Illustrative Visualization of 3D Planning Models for...
10
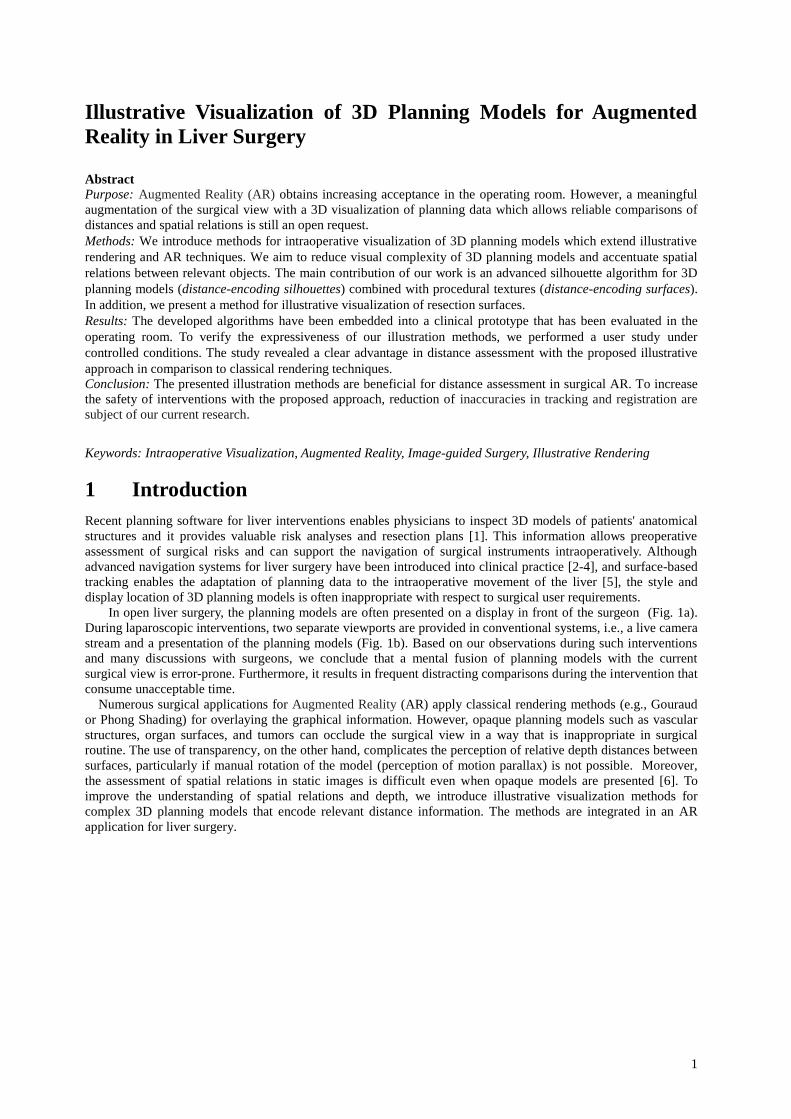
1 Illustrative Visualization of 3D Planning Models for Augmented Reality in Liver Surgery Abstract Purpose: Augmented Reality (AR) obtains increasing acceptance in the operating room. However, a meaningful augmentation of the surgical view with a 3D visualization of planning data which allows reliable comparisons of distances and spatial relations is still an open request. Methods: We introduce methods for intraoperative visualization of 3D planning models which extend illustrative rendering and AR techniques. We aim to reduce visual complexity of 3D planning models and accentuate spatial relations between relevant objects. The main contribution of our work is an advanced silhouette algorithm for 3D planning models (distance-encoding silhouettes) combined with procedural textures (distance-encoding surfaces). In addition, we present a method for illustrative visualization of resection surfaces. Results: The developed algorithms have been embedded into a clinical prototype that has been evaluated in the operating room. To verify the expressiveness of our illustration methods, we performed a user study under controlled conditions. The study revealed a clear advantage in distance assessment with the proposed illustrative approach in comparison to classical rendering techniques. Conclusion: The presented illustration methods are beneficial for distance assessment in surgical AR. To increase the safety of interventions with the proposed approach, reduction of inaccuracies in tracking and registration are subject of our current research. Keywords: Intraoperative Visualization, Augmented Reality, Image-guided Surgery, Illustrative Rendering 1 Introduction Recent planning software for liver interventions enables physicians to inspect 3D models of patients' anatomical structures and it provides valuable risk analyses and resection plans [1]. This information allows preoperative assessment of surgical risks and can support the navigation of surgical instruments intraoperatively. Although advanced navigation systems for liver surgery have been introduced into clinical practice [2-4], and surface-based tracking enables the adaptation of planning data to the intraoperative movement of the liver [5], the style and display location of 3D planning models is often inappropriate with respect to surgical user requirements. In open liver surgery, the planning models are often presented on a display in front of the surgeon (Fig. 1a). During laparoscopic interventions, two separate viewports are provided in conventional systems, i.e., a live camera stream and a presentation of the planning models (Fig. 1b). Based on our observations during such interventions and many discussions with surgeons, we conclude that a mental fusion of planning models with the current surgical view is error-prone. Furthermore, it results in frequent distracting comparisons during the intervention that consume unacceptable time. Numerous surgical applications for Augmented Reality (AR) apply classical rendering methods (e.g., Gouraud or Phong Shading) for overlaying the graphical information. However, opaque planning models such as vascular structures, organ surfaces, and tumors can occlude the surgical view in a way that is inappropriate in surgical routine. The use of transparency, on the other hand, complicates the perception of relative depth distances between surfaces, particularly if manual rotation of the model (perception of motion parallax) is not possible. Moreover, the assessment of spatial relations in static images is difficult even when opaque models are presented [6]. To improve the understanding of spatial relations and depth, we introduce illustrative visualization methods for complex 3D planning models that encode relevant distance information. The methods are integrated in an AR application for liver surgery.
Transcript of Illustrative Visualization of 3D Planning Models for...
1
Illustrative Visualization of 3D Planning Models for Augmented
Reality in Liver Surgery
Abstract
Purpose: Augmented Reality (AR) obtains increasing acceptance in the operating room. However, a meaningful
augmentation of the surgical view with a 3D visualization of planning data which allows reliable comparisons of
distances and spatial relations is still an open request.
Methods: We introduce methods for intraoperative visualization of 3D planning models which extend illustrative
rendering and AR techniques. We aim to reduce visual complexity of 3D planning models and accentuate spatial
relations between relevant objects. The main contribution of our work is an advanced silhouette algorithm for 3D
planning models (distance-encoding silhouettes) combined with procedural textures (distance-encoding surfaces).
In addition, we present a method for illustrative visualization of resection surfaces.
Results: The developed algorithms have been embedded into a clinical prototype that has been evaluated in the
operating room. To verify the expressiveness of our illustration methods, we performed a user study under
controlled conditions. The study revealed a clear advantage in distance assessment with the proposed illustrative
approach in comparison to classical rendering techniques.
Conclusion: The presented illustration methods are beneficial for distance assessment in surgical AR. To increase
the safety of interventions with the proposed approach, reduction of inaccuracies in tracking and registration are
subject of our current research.
Keywords: Intraoperative Visualization, Augmented Reality, Image-guided Surgery, Illustrative Rendering
1 Introduction
Recent planning software for liver interventions enables physicians to inspect 3D models of patients' anatomical
structures and it provides valuable risk analyses and resection plans [1]. This information allows preoperative
assessment of surgical risks and can support the navigation of surgical instruments intraoperatively. Although
advanced navigation systems for liver surgery have been introduced into clinical practice [2-4], and surface-based
tracking enables the adaptation of planning data to the intraoperative movement of the liver [5], the style and
display location of 3D planning models is often inappropriate with respect to surgical user requirements.
In open liver surgery, the planning models are often presented on a display in front of the surgeon (Fig. 1a).
During laparoscopic interventions, two separate viewports are provided in conventional systems, i.e., a live camera
stream and a presentation of the planning models (Fig. 1b). Based on our observations during such interventions
and many discussions with surgeons, we conclude that a mental fusion of planning models with the current
surgical view is error-prone. Furthermore, it results in frequent distracting comparisons during the intervention that
consume unacceptable time.
Numerous surgical applications for Augmented Reality (AR) apply classical rendering methods (e.g., Gouraud
or Phong Shading) for overlaying the graphical information. However, opaque planning models such as vascular
structures, organ surfaces, and tumors can occlude the surgical view in a way that is inappropriate in surgical
routine. The use of transparency, on the other hand, complicates the perception of relative depth distances between
surfaces, particularly if manual rotation of the model (perception of motion parallax) is not possible. Moreover,
the assessment of spatial relations in static images is difficult even when opaque models are presented [6]. To
improve the understanding of spatial relations and depth, we introduce illustrative visualization methods for
complex 3D planning models that encode relevant distance information. The methods are integrated in an AR
application for liver surgery.

2
(a) (b)
Fig. 1: (a) Intraoperative visualization of 3D planning models on the screen of a navigation system
for open liver surgery at General Hospital Celle [2], and (b) for laparoscopic surgery at University
Hospital Lübeck [3].
2 Related Work
In the context of AR in liver surgery, a variety of concepts have already been developed. Our work is inspired by
two research areas: AR and illustrative visualization. Therefore, we review work in the field of AR for liver
interventions and previous work on improvement of depth perception in medical AR. Subsequently, we describe
related illustrative visualization approaches on which we base our augmentation instead of classical rendering
techniques.
Augmented Reality for Liver Interventions
Medical AR has a long history in science; a comprehensive literature review can be found in Sielhorst et al. [7].
The basic approach to employ AR during liver interventions is described by Ayache et al. [8]. They propose to
augment intraoperative video images with an associated 3D-reconstruction of the liver surface using alpha
compositing. Samset et al. [9] use AR to educate surgeons in radiofrequency ablations of liver tumors. Using a
head-mounted display (HMD), interventional procedures are trained on phantoms without the risk of performing
an invasive intervention in reality. Nicolau et al. [10] introduced a guidance system for liver percutaneous
punctures that superimposes planning models on video images of the interventional view. Alpha compositing is
used to achieve semi-transparent planning models. However, if AR applications apply transparency to
superimpose planning models on the surgical view, visual depth cues can be degraded through lower contrast.
Feuerstein et al. [11] apply direct volume visualization of intraoperative retrieved CT data to superimpose
laparoscopic video images for trocar placement in liver surgery. A drawback therein is its limitation to the
intraoperative processed segmentation result which does not provide an accentuation of risk structures and spatial
relations. Several groups [12, 13] in the field of laparoscopy guidance apply transparency-based superimpositions,
similar to [8, 9, 10], in order to achieve a superimposition of laparoscopic video images with planning information,
which could as well lead to misinterpretations.
Projector-based AR represents an interesting way to support surgical decisions: Krempien et al. [14] and
Riechmann et al. [15] showed that a projector can not only be used for intraoperative visualization, but also for the
registration of the patient’s organ using structured light techniques. However, in preliminary studies in
collaboration with the Institute of Process Control and Robotics, University of Karlsruhe, Germany [15] we found
that complex 3D planning models (such as vascular structures) shaded with classical rendering methods are
inappropriate for intraoperative projection. The projected image provides insufficient visual contrast which results
in a crucial loss of spatial information (Fig. 2). Glossop et al. [16] showed that the application of laser projectors is
conceivable. The advantage of laser is an unlimited depth of field, but it represents a safety risk for the unprotected
eye of the surgical staff.

3
Fig. 2: First experiments in the field of projector-based AR for open liver surgery carried out by
the Institute of Process Control and Robotics, University of Karlsruhe, Germany and MeVis at
Robert Bosch Hospital Stuttgart, Germany.
Depth Perception in Medical Augmented Reality
The surgical need to assess spatial information of planning models during an intervention has lead to the
development of several techniques which attempt to improve depth perception in AR applications. In the context
of projector-based AR, Riechmann et al. [15] proposed to project vascular structures onto an organ surface via
projective texture mapping while tracking the surgeons head. Thus, an important depth cue (motion parallax) is
provided by taking the observer’s position into account. However, a permanent tracking via head-attached tracking
applicators could affect the surgical workflow, e.g. by forcing a surgeon to move his head to improve depth
perception.
Multiple viewports have been proposed to enhance depth perception in AR without forcing observers to
change their viewing position or to rotate the model. Navab et al. [17] presented a render-to-texture approach,
termed virtual mirror, for monitor-based AR which provides additional views on the planning model. Particularly,
the interpretation of partial self-occlusions inside complex planning models is improved.
One way to add depth cues to AR is to extract depth information from the associated video images and use this
data to control the superimposition. Lerotic et al. [18] utilize photometric stereo to derive the orientation of the
organ surface. This information is used to generate a translucent contour layer that preserves sufficient details to
aid navigation and depth cueing. Bichlmeier et al. [19] use surface topology, viewing attributes, and the location of
surgical instruments to generate a transparency map that is applied to control the pixel transparency of video
images. Thus, a context-preserving focus region is provided that facilitates intuitive depth perception. Moreover, a
optical see-through HMD with stereoscopic imagery is used to provide an augmented view. However, head-
mounted displays can handicap a surgeon during interventions and need further technological improvement before
getting into the operating room.
Illustrative Visualization in Medicine
Based on traditional illustration techniques, a variety of non-photorealistic methods have been proposed to apply
silhouettes and hatching strokes in order to increase expressiveness of visualizations. An overview can be found in
Strothotte et al. [20]. While the field of non-photorealistic rendering is concerned with imitating artistic styles in
an automated way, illustrative rendering applies these techniques to enhance visual comprehension; for a survey of
illustrative rendering techniques we refer to the thesis of Bruckner [21].
We were inspired by the work of Fischer et al. [22] who developed an illustrative rendering technique that is
capable of generating a stylized augmented video stream. Based on an edge-detection algorithm, silhouttes are
extracted and applied to both the camera image and the virtual objects. Thus, visual realism of the graphical
foreground and the real camera image is reduced. Both modalities become less distinguishable from each other
and thus an improved immersion can be achieved.
Our project is based on prior work in the field of vascular visualization: Ritter et al. [6] presented vascular
visualization methods, which extend illustrative rendering techniques to particularly accentuate spatial depth and
to improve the perceptive separation of important vascular properties such as branching level and supply area.
Besides a GPU-based hatching algorithm for tubular structures (distance-encoding surfaces), shadow-like depth
indicators (distance-encoding shadows), which enable reliable comparisons of depth distances, are introduced.
Important techniques on which our work is based have been described by Freudenberg [23], who introduced an
algorithm to generate stroke textures procedurally that is further developed by Ritter et al. [6] to visualize
distance-encoding surfaces. Moreover, Isenberg et al. [24] described techniques for the stylization of silhouettes.

4
3 Methods
We aim to accentuate spatial relations and reduce visual complexity of 3D planning models via GPU-accelerated
illustrative rendering techniques. It is a prerequisite of our approach that planning information is either projected
onto the liver surface during open liver surgery using a light projector as described in [14-16], or rather
superimposed with the images from a laparoscopic camera [11-13]. Since the surgical view is augmented with
planning models, we expect a reduction of cognitive demands for the surgeon, concerning distracting comparisons
of spatially separated views during the intervention. However, as mentioned in the related work section, an
augmentation of the surgical view by planning models may result in unacceptable occlusions of the operation field
or misinterpretation of spatial relations, colors, and contrast. Therefore, our visualization approach is guided by
four requirements:
Spatial depth of planning models must be perceivable, even in static images,
occlusion of the surgical view by planning models should be minimal,
transitions in color and brightness must be avoided in order to ensure a maximal contrast,
required technical devices should not handicap the surgeon.
To test the usability of our methods, we specified three visualization scenarios in collaboration with experienced
liver surgeons. These scenarios represent surgical situations wherein expressive visualizations are requested:
(1) Anatomical Overview: This scenario contains all tumors identified preoperatively and their relations to
relevant vascular structures. Besides providing an abstract overview of available planning objects, this
visualization scenario allows fast assessment of alignment errors between the real and the virtual world.
(2) Focusing the current tumor: During the treatment of a specific tumor, this visualization provides
information about surrounding risk structures such as vessels which are invisible for the surgeon.
(3) Focusing the virtual resection surface: In case of a precise prepared resection strategy, this scenario
provides spatial information of the virtual resection surface, while enhancing its relation to risk structures.
Predefined views for each scenario are generated in advance and provided intraoperatively. In the following
subsections we focus on the developed illustrative rendering techniques.
Distance-Encoding Silhouettes
Silhouettes play an important role in figure-to-ground distinction and can be applied to reduce the visual
complexity of geometric models. Reduction of visual complexity is a basic requirement of our visualization
approach. However, the abstraction of a classical shaded object to its silhouette results in the loss of shading
information and consequently in a reduction of depth cues. Therefore, we enhanced conventional silhouette
algorithms by two optional rendering settings.
Our first extension allows for varying the stroke thickness of silhouettes continuously by using the distance to
relevant objects (organ surface, adjacent risk structures, or surgical tracked instruments) as input (Fig. 3). The
distance-dependent scaling of silhouttes is similar to the concept described by Isenberg et al. [24], but we control
the stroke thickness on the GPU using two framebuffer objects. The algorithm is based on a translation of each
vertex of the 3D planning model (i.e. vascular tree) in direction of its normal by a vertex shader. Utilizing multiple
render targets, we calculate the silhouette by subtracting the original planning model from the scaled model in a
fragment program. We vary the length of the applied vertex translation by calculating a distance value (e.g. the
distance between a vertex and the tip of a tracked surgical instrument) via built-in shader functions, or rather by
exploiting a precomputed 3D distance map via texture lookup. Our algorithm controls stroke thickness within a
user-defined interval (minimum and maximum stroke thickness). Irrelevant parts of the model can be omitted.
Fig. 3: Silhouette thickness depends on the distance to the observer. A rotation about 180° of the
left model along the vertical axis changes stroke thickness in the right model and thus adapts the

5
accentuation of specific parts. Compare vessel marks a, b, c, d.
Our second extension uses different stroke styles (solid, dashed, dotted) to accentuate view-
dependent spatial relations (in front, within, behind) of interweaved objects. The developed
rendering styles are particularly important for vessels that intersect other planning models such as
resection volumes, territories at risk, or tumors. The stroke styles are varied by means of a
sawtooth function in a fragment program. Occluded objects are detected using the depth buffer,
while overlapping objects are identified by a texture look-up in the underlying 3D segmentation
masks of planning models. Figure 4 shows an example for a close-up view of a tumor with
surrounding vessels rendered with classical shading (Fig. 4a), conventional silhouettes (Fig. 4b),
and our new approach termed distance-encoding silhouettes (Fig. 4c).
(a) (b) (c)
Fig. 4: (a) Focusing a tumor using classical rendering techniques. (b) A silhouette representation of
the scene results in a loss of depth cues. Occluded vessel branches are not visible. (c) Distance-
encoding silhouettes allow for the accentuation of important vessels by applying varying stroke
thickness, while occluded vessels are emphasized via varying stroke styles.
Distance-Encoding Surfaces
Distance-encoding surfaces provide the observer with distance information displayed on the surface of geometric
objects. This technique was introduced by Ritter et al. [6] to visualize the distance of vascular structures to the
observer by using texture gradients as additional depth cues (Fig 5). A procedural stroke texture with varying
stroke thickness is used for this purpose.
Fig. 5: The distance to the observer is encoded by the thickness of strokes. A sawtooth function σ is compared
with a distance function δ. If the value of σ is greater than the value of δ, a black fragment is generated, otherwise
a white fragment (Idea by Freudenberg et al. [23]).
Instead of applying a hatching texture on the whole vessel system, we exploit a distance-based transfer function to
limit the use of texture to a specific scope. Thus, distances between arbitrary planning objects can be visualized,
e.g. vessels at risk can be accentuated while their spatial relation to other objects (organ surface, vascular
territories, tracked surgical instruments) is encoded by distance-encoding silhouettes. In addition, this enables the
combination of distance-encoding surfaces with distance-encoding silhouettes. Figure 6 shows an example for the
combination of both techniques: vessels at risk are emphasized using a distance-encoding surface while a
distance-encoding silhouette highlights branches close to the organ surface.

6
(a)
(b)
Fig. 6: Classical rendering (a) in comparison to the illustrative approach (b). While the spatial
relations between vessels and tumors are difficult to perceive in (a), vessels at risk are accentuated
in (b) using a varying stroke texture, termed distance-encoding surface. The distance-encoding
silhouette enhances branches close to the organ surface (varying silhouette thickness). The part of
the vessel behind the left tumor is accentuated with dashed strokes.
Regarding the tumor scenario, spatial relations between a tumor and surrounding risk structures
have to be visualized. Besides the distance between tumors and vessels, the location of a vessel (in
front, inside, or behind a specific tumor) has to be clearly perceivable in order to support surgical
decisions. Inspired by standardized conventions in technical drawings we propose to encode spatial
relations as follows: Vessels in front of the volume are encoded by the union of the distance-
encoding surface and the distance-encoding silhouette (Fig. 7a-1). Vessels within the volume (Fig.
7a-2) are rendered as solid silhouette, while occluded vessels (Fig. 7a-3) are rendered as dotted or
dashed silhouette. In order to achieve corresponding stroke- and texture-frequencies, the silhouette
style for occluded vessels is controlled by the same sawtooth function as the distance-encoding
surface.
Visualization of Resection Surfaces using Contour Lines
If a resection plan has been created before surgery, the aim of an intervention is to execute the preoperatively
planned resection as accurately as possible. If a 3D model of the resection surface is used for this purpose, it is
important to provide the surgeon with reliable information about distances of the virtual resection surface to other
relevant objects like the liver surface, vessels, or surgical instruments. We found that contour lines (also named
isolines) are appropriate for this purpose. They provide an efficient representation of data changing continuously
which is often used on topographic maps to represent points of equal value.
For the visualization of virtual resection surfaces, we project contour lines onto the outer shape of resection
volumes. The distance between contour lines is controlled by exploiting a precomputed Euclidian distance map.
This distance map encodes the shortest distance of each liver voxel to the liver surface. Thus, line thickness can be
kept constant or varied linear depending on a distance function in a fragment program. In addition, the distances
between lines can be adjusted, e.g. 5mm, which facilitates quantitative assessment of spatial depth. As illustrated
in Fig. 7b-c, the proposed contour lines can also be combined with distance-encoding silhouettes and distance
encoding-surfaces.
(a) (b) (c)

7
Fig. 7: (a) Combination of distance-encoding silhouettes and distance-encoding surfaces to visualize spatial
relations between vessels and a tumor (tumor scenario). (b) Illustration of a wedge-shaped resection via contour
lines. Line thickness depends on the distance to the organs surface and is reduced with increasing distance.
Contour lines are equidistant which allows a quantitative assessment of distance. (c) Illustration of a planar
resection, e.g. a hepatectomy. Spatial depth is encoded via the thickness of silhouettes and contour lines.
4 Evaluation
In a previous user study [6], we conducted a quantitative evaluation of stroke hatching, distance-encoding
surfaces, and shadows on the effect of distance assessment. Using a web-based questionnaire we were able to
test 160 participants. The study clearly indicated the advantages of direct distance encoding in 3D visualizations
of planning models. Compared to classical rendering methods, participants were significantly better and faster in
judging distances.
In the recent study, design considerations discussed in this article were verified under controlled lab
conditions using verbal comments as data according to the Think-Aloud protocol [25]. Therefore, an electronic
questionnaire was created that contained single video frames from laparoscopic and open liver interventions with
overlayed planning models as well as photos from a projector-based AR visualization using a cadaver liver of a
pig. In order to probe the subjects’ perception of spatial relations, we designed tasks that require a precise
judgment of distances. Three vessel positions in each image were labeled with markers, while each task started
with a question about the distance of these markers to a second object (e.g. tumor, resection surface, organ
surface). Participants were asked to determine the correct order of marks. Since we wanted to assess the effect of
the new techniques, a visualization of the planning model using one of the new techniques had to be compared
with a second visualization of the same model identical in every aspect, except for the rendering algorithms. This
requirement has been met by using the same model and viewpoint. Each visualization scenario was evaluated
using three paired tests in different sequences: Fig. 8 shows an example for a paired test for scenario 1 (overview
scenario), Fig. 9 for scenario 2 (focusing the current tumor), and Fig. 10 for scenario 3 (focusing the resection
surface). The first paired test for each scenario was conducted with video images from open liver surgery, the
second paired test with video images from laparoscopic liver surgery, and the third paired test with images from
planning models projected on a pig’s liver using a light projector. Six liver specialists participated in the study:
two surgeons, two radiologist, and two medical software engineers. Before performing the test, participants were
informed about the underlying principles for visual distance encoding.
To evaluate the surgical applicability of the new methods, we also conducted preliminary studies in the
operating room. Therefore, the images from a video camera focusing the patient’s liver during an open liver
intervention were captured. A rigid registration of the planning model to one video frame was carried out while
the liver was immobilized. Subsequently, associated planning models were superimposed onto the video stream
which itself was presented on a display in front of the surgeon.
(a) (b)
Fig. 8: Scenario 1 for open liver surgery: Superimposition using classical rendering techniques (a) and the
proposed illustrative approach (b). Distance-encoding silhouettes are applied to visualize the distance between
vessels and liver surface, while a distance-encoding surface emphasizes vessel that are located close to tumors.

8
(a) (b)
Fig. 9: Scenario 2 for projector-based AR: (a) Classical rendering that shows a transparent tumor and adjacent
vessels. (b) A distance-encoding surface is applied to vessels at risk, while their spatial relation is accentuated
using a distance-encoding silhouette.
(a) (b)
Fig. 10: Scenario 3 for a laparoscopic camera view: Classical rendering (a) causes perceptible occlusions of the
surgical view while depth of the wedge-resection surface is difficult to perceive. The proposed technique (b) uses
equidistant contour lines for depth assessment. Furthermore, a distance-encoding surface is applied to vessels to
encode the distance between vessels and resection surface inside the resection volume. The silhouette encodes
the distance between vessels and resection surface. Several branches are faded out depending on a distance
threshold.
5 Results and Conclusion New illustration methods for 3D planning models have been described. The methods use silhouettes and texture
gradients to efficiently communicate shape and topology without the requirement of a medium able to display
color. Hence, color may be used to encode additional information.
The recent expert study confirmed the results of our previous quantitative study [6] in the field of explicit
distance encoding: Compared to classical rendering methods, all six participants were better and faster in judging
distances. Since the advantage of explicit distance encoding had already been stated in the previous study, a
statistical analysis of our measurements was not carried out. However, experts have been asked to express their
thoughts on the application while executing the tasks using a Think-Aloud protocol. In case of a wrong distance
judgement, participants were informed and asked to describe their decision in detail. Thus, a number of
constructive suggestions were made:
1. Although we aimed at reducing the complexity of planning models, participants reported that too much
information was presented in scenario 3. One surgeon proposed to use the position of a tracked surgical
instrument to select a specific depth layer of the resection surface. In addition, vessels that do not
supply or drain healthy parenchyma could be omitted.
2. When presenting scenario 3, several experts asked for a better emphasis of intersections between

9
vessels and resection surface in order to judge depth. Similar request were made for scenario 2, where
the intersections between tumor and vessels are important.
3. In several tests, we presented two independent parameters. One parameter was encoded using distance-
encoding surfaces, while the second parameter was visualized using distance-encoding silhouettes.
However, a few participants mixed up the parameters. After being informed about the mistake, subjects
proposed to enhance the visualization with captions.
4. Concerning the projector-based AR approach, the assessment of distance of an object from varying
stroke styles (dashed, dotted) was not successful in all cases. Participants complained that the variation
in style and frequency is not always perceivable on the liver surface.
5. To assess the spatial relation of tumors and vessels in scenario 2, participants asked for an improved
visualization of tumors. Particularly, quantitative distance information and additional shape hints would
be necessary.
Since cognitive loads during surgical interventions put demands on the usability of intraoperative
applications, the reduction of information presented to the surgeon is of high importance. The choice of relevant
information has to be made in close collaboration with liver surgeons.
The proposed approach utilizes non-standard visual encoding. Thus, the usability of the visualization
correlates with the surgeon’s familiarity with these concepts. It seems promising to integrate the illustrative
techniques in software assistants for surgical training.
As mentioned in the last section, the developed algorithms have been embedded into a clinical prototype that
has already been used in the operating room for preliminary evaluations. Subsequent discussions indicated that
the presented visualization has considerable advantages, compared to traditional intraoperative visualization
methods. However, the performed surface-registration was only valid for a few seconds since we did not track
the movement of the liver surface during the test. Therefore, the surgeon could not make reliable statements
about the surgical benefit of the augmentation. After analyzing several intraoperative video streams from open
liver interventions, we conclude that a permanent augmentation of the surgical view is (to our knowledge) not
possible with liver tracking techniques available today. However, the precise placement of initial cuts is
important for the success of an intervention and this surgical task can be supported with the visualization
methods proposed here. A surgical workflow analysis as described by Blum et al. [26] could reveal further areas
of application.
In the near future, we will investigate the use of real-time video analysis. The superimposition (or
projection) could be limited to the organ in order to exclude structures such as surgical instruments from the
augmentation. In addition, anatomical details can be preserved similar to the approach described by Lerotic et al.
[16].
The expectations of surgeons on accuracy and stability in AR settings are high. By now, the virtual planning
model is transformed onto the patient’s liver using a manual registration approach. Thus, the visualization is only
accurate if the liver is immobilized. To alleviate this limitation, we plan to derive registration information from
an ultrasound-based navigation system to facilitate an image fusion. In addition, a surface-based tracking method
has to be developed to update the registration. However, inaccuracies in camera calibration, tracking and
registration have to be taken into account. Therefore, the visualization of uncertainty (quality of the alignment
between virtual and real world) is important for clinical acceptance.
References
[1] Schenk A, Zidowitz S, Bourquain H, Hindennach M, Hansen C, Hahn H, Peitgen HO (2008) Clinical
relevance of model based computer-assisted diagnosis and therapy. Proceedings of SPIE Medical Imaging,
6915(1):691502_1-19, doi:10.1117/12.780270
[2] Oldhafer KJ, Stavrou GA, Prause G, Peitgen HO, Lueth TC, Weber S (2009) How to operate a liver tumor
you cannot see. Langenbecks Arch Surg, 394(3):489-494, doi:10.1007/s00423-009-0469-9
[3] Hildebrand P, Schlichting S, Martens V, Besiveric A, Kleemann M, Roblick U, Mirow L, Buerk C,
Schweikard A, Bruch H (2008) Prototype of an intraoperative navigation and documentation system for
laparoscopic radiofrequency ablations: First experiences. European Journal of Surgical Oncology, 34(4):418–
421, doi:10.1016/j.ejso.2007.04.017
[4] Beller S, Eulenstein S, Lange T, Hünerbein M, Schlag PM (2009) Upgrade of an optical navigation system
with a permanent electromagnetic position control: a first step towards "navigated control" for liver surgery. J
Hepatobiliary Pancreat Surg, 16(2):165-70, doi:10.1007/s00534-008-0040-z
[5] Cash DM, Miga MI, Glasgow SC, Dawant BM, Clements LW, Cao Z, Galloway RL, Chapman WC (2007)
Concepts and preliminary data toward the realization of image-guided liver surgery. Journal of Gastrointestinal
Surgery, 11(7):844-859, doi:10.1007/s11605-007-0090-6
[6] Ritter F, Hansen C, Dicken V, Konrad O, Preim B, Peitgen HO (2006) Real-Time Illustration of Vascular
Structures. IEEE Transactions on Visualization and Computer Graphics Journal, 12(5):877–884, doi:
10
10.1109/TVCG.2006.172
[7] Sielhorst T, Feuerstein M, Navab N (2008) Advanced Medical Displays: A Literature Review of Augmented
Reality. IEEE/OSA Journal of Display Technology; Special Issue on Medical Displays, 4(4):451-467, doi:
10.1109/JDT.2008.2001575
[8] Ayache N (2003) Epidaure: A Research Project in Medical Image Analysis, Simulation and Robotics at
INRIA. IEEE Trans Med Imaging, 22(10):1185–1201, doi:10.1109/TMI.2003.812863
[9] Samset E, Schmalstieg D, Vander SJ, Freudenthal A, Declerck J, Casciaro S, Rideng Ø, Gersak B (2008)
Augmented Reality in Surgical Procedures. Proceedings of SPIE Medical Imaging, 6806(1):68060K_1-12, doi:
10.1117/12.784155
[10] Nicolau SA, Pennec X, Soler L, Buy X, Gangi A, Ayache N, Marescaux J (2009) An augmented reality
system for liver thermal ablation: Design and evaluation on clinical cases. Med Image Anal, 13(3):494-506,
doi:10.1016/j.media.2009.02.003
[11] Feuerstein M, Mussack T, Heining SM and Navab N (2008) Intraoperative Laparoscope Augmentation for
Port Placement and Resection Planning in Minimally Invasive Liver Resection. IEEE Transactions on Medical
Imaging, 27(1):355–369, doi:10.1109/TMI.2007.907327
[12] Scheuering M, Schneider A, Schenk A, Preim B, Greiner G (2003) Intraoperative augmented reality for
minimally invasive liver interventions. Proceedings of SPIE Medical Imaging, 5029(1):407-417, doi:
10.1117/12.480212
[13] Marescaux J, Rubino F, Arenas M, Mutter D, Soler L (2004) Augmented-Reality-Assisted Laparoscopic
Adrenalectomy. Journal of the American Medical Association, 292(18):2214-2215, doi:
10.1001/jama.292.18.2214-c
[14] Krempien R, Hoppe H, Kahrs L, Daeuber S, Schorr O, Eggers G, Bischof M, Munter MW, Debus J, Harms
W (2008) Projector-based augmented reality for intuitive intraoperative guidance in image-guided 3D interstitial
brachytherapy. Int J Radiat Oncol Biol Phys, 70(3):944-952, doi:10.1016/j.ijrobp.2007.10.048
[15] Riechmann M, Kahrs LA., Hoppe H, Ulmer C, Raczkowsky J, Lamade W, Wörn H (2006)
Visualisierungskonzept für die projektorbasierte Erweiterte Realität in der Leberchirurgie. Proceedings of BMT,
209(1):1-2
[16] Glossop ND, Wang Z (2003) Laser projection augmented reality system for computer-assisted surgery.
International Congress Series, 1256(1):65–71, doi:10.1016/S0531-5131(03)00515-6
[17] Navab N, Feuerstein M, Bichlmeier C (2007) Laparoscopic Virtual Mirror - New Interaction Paradigm for
Monitor Based Augmented Reality. Virtual Reality Conference IEEE, 43-50. doi:10.1109/VR.2007.352462
[18] Lerotic M, Chung AJ, Mylonas GP, Yang GZ (2007) Pq-space Based Non-Photorealistic Rendering for
Augmented Reality. Proceedings of MICCAI, 4792:102-109. doi:10.1007/978-3-540-75759-7
[19] Bichlmeier C, Wimmer F, Heining SM, Navab N (2007) Contextual Anatomic Mimesis: Hybrid In-Situ
Visualization Method for Improving Multi-Sensory Depth Perception in Medical Augmented Reality. ISMAR
'07: Proceedings of the 2007 6th IEEE and ACM International Symposium on Mixed and Augmented Reality, 1-
10, doi: 10.1109/ISMAR.2007.4538837
[20] Strothotte T, Schlechtweg S (2002) Non-Photorealistic Computer Graphics. Morgan Kaufmann, San
Francisco, USA
[21] Bruckner S (2008) Interactive Illustrative Volume Visualization. PhD thesis, University of Technology,
Vienna, Austria
[22] Fischer J, Bartz D (2005) Stylized Augmented Reality for Improved Immersion. Proceedings of the IEEE
Conference on Virtual Reality, 195 – 202, doi:10.1109/VR.2005.1492774
[23] Freudenberg B (2004) Real-Time Stroke-Based Halftoning. PhD thesis, Otto-von-Guericke University
Magdeburg, Germany
[24] Isenberg T, Halper N and Strothotte T (2002) Stylizing Silhouettes at Interactive Rates: From Silhouette
Edges to Silhouette Strokes. Computer Graphics Forum, 21(3):249–258, doi:10.1111/1467-8659.00584
[25] Ericsson K, Simon H (1993) Protocol Analysis: Verbal Reports as Data. Boston, MIT Press
[26] Blum J, Padoy N, Feußner H, Navab N (2008) Workflow mining for visualization and analysis of surgeries.
International Journal of Computer Assisted Radiology and Surgery, 3(5):379-386, doi: 10.1007/s11548-008-
0239-0


![Illustrative Multi-volume Rendering for PET/CT Scans · ally, the advantages of recent illustrative visualization tech-niques are described by Lawonn [Law15]. Based on the pre-vious](https://static.fdocuments.us/doc/165x107/602ff4246a667f1cee2ce22c/illustrative-multi-volume-rendering-for-petct-scans-ally-the-advantages-of-recent.jpg)