ILLINOIS PERMANENCY FOR OLDER WARDS WAIVER · Table 2.11 Permanence by Date of Assignment to ......
217
Illinois Permanence for Older Wards Waiver: Final Evaluation Report Authors: Liz Quinn Crystal MacAllum Janet Ciarico John Rogers September 17, 2009 Prepared for: Illinois Department of Children and Family Services 100 W. Randolph Chicago, Illinois 60601 Prepared by: WESTAT 1650 Research Boulevard Rockville, Maryland 20850
Transcript of ILLINOIS PERMANENCY FOR OLDER WARDS WAIVER · Table 2.11 Permanence by Date of Assignment to ......

Illinois Permanence for Older Wards Waiver:
Final Evaluation Report
Authors:
Liz Quinn
Crystal MacAllum
Janet Ciarico
John Rogers
September 17, 2009
Prepared for: Illinois Department of Children
and Family Services 100 W. Randolph Chicago, Illinois 60601
Prepared by:
WESTAT 1650 Research Boulevard Rockville, Maryland 20850


i
ILLINOIS PERMANENCE FOR OLDER WARDS WAIVER:
FINAL EVALUATION REPORT
Table of Contents
Page
EXECUTIVE SUMMARY ....................................................................................................... xi
1. Introduction ..............................................................................................................1
1.1 Overview of the Older Wards Waiver .........................................................2 1.2 Evaluation of the Waiver .............................................................................3
1.3 Summary of Interim Report #1 ....................................................................6 1.4 Summary of Interim Report #2 ....................................................................7
1.5 Highlights of Final Evaluation Report .......................................................10
2. Outcomes ...............................................................................................................13
2.1 Permanence ................................................................................................14
2.1.1 Waiver Impact on Permanency Exits .............................................14
2.1.2 Predictors of Permanence ..............................................................16
2.1.3 Analysis of Youth Who Achieved Permanence.............................22
2.1.4 Placement Restrictiveness ..............................................................29
2.2 Safety .........................................................................................................33 2.3 Well-Being .................................................................................................36
3. Youth and Caregiver Characteristics .....................................................................39
3.1 Youth Characteristics .................................................................................40
3.2 Youth Well-Being ......................................................................................43 3.3 Caregiver Characteristics ...........................................................................47
4. Youth’s Decisionmaking Process ..........................................................................53
4.1 Awareness of Enhanced Services Among Youth in the
Demonstration Group.................................................................................54
4.2 Differences in Permanency Decisionmaking by Demonstration and
Control Groups...........................................................................................58 4.3 Reasons for Choosing Permanence and Staying in Care ...........................66 4.4 Movement Into Permanence Over Time ....................................................68

ii
Contents (continued)
Page
5. Caregivers’ Decisionmaking Process ....................................................................71
5.1 Discussions About Permanence .................................................................71 5.2 Decisionmaking and Permanence for Caregivers in the
Demonstration Group.................................................................................72
5.3 Comparing Permanence for Demonstration and Control Groups ..............74 5.4 Other Factors that Might Influence Permanence .......................................76 5.5 The Most Important Issues Reported By Caregivers in Deciding
Permanence ................................................................................................81 5.6 Permanence Over Time..............................................................................85
6. Summary and Conclusion ......................................................................................89
Appendix A. Youth Interview Instrument .......................................................................... A-1
Appendix B. Caregiver Interview Instrument .....................................................................B-1
Appendix C. Survey Response for the Youth and Caregiver Interviews ............................C-1
Appendix D. Youth School Status ...................................................................................... D-1
Appendix E. Differences Between Relative and Nonrelative Families .............................. E-1

iii
List of Tables
Page
Table ES.1 Exit Status of Youth Statewide After Assignment to the Waiver and
Before September 30, 2008.................................................................................. xiii
Table 2.1 Exit Status of Youth in Study Regions After Assignment to the Waiver
and Before September 30, 2008 .............................................................................15
Table 2.2 Exit Status of Youth Statewide After Assignment to the Waiver and
Before September 30, 2008....................................................................................15
Table 2.3 Time in Foster Care Following Assignment for Youth in Study Regions .............16
Table 2.4 Time in Foster Care Following Assignment for Youth Statewide ........................16
Table 2.5 P-values for Assessing Significance of Main Effects in the Survival Model
Predicting Time From Assignment to Permanence ...............................................18
Table 2.6 Significant Factors Predicting the Probability of Each Permanency
Outcome, for Youth Who Achieved Permanence..................................................23
Table 2.7 Permanence by Assignment Group, for Youth Who Achieved Permanence ........24
Table 2.8: Permanence by Interaction of Relative Status at Assignment and Prior Years in
Foster Care, for Youth Who Achieved Permanence ............................................. 25
Table 2.9 Permanence by Interaction of Gender and Prior Years in Foster Care, for
Youth Who Achieved Permanence ........................................................................26
Table 2.10 Permanence by Interaction of Gender and Age When Eligible, for Youth
Who Achieved Permanence ...................................................................................27
Table 2.11 Permanence by Date of Assignment to the Older Wards Waiver, for Youth
Who Achieved Permanence ...................................................................................28
Table 2.12 Race by Assignment Group, for Youth Who Achieved Permanence ....................29
Table 2.13 Percentage of Youth in Study Regions Who Ever Spent Time in Living
Arrangements After Assignment to the Waiver and Before September 30,
2008........................................................................................................................33
Table 2.14 Percentage of Youth Statewide Who Ever Spent Time in Living
Arrangements After Assignment to the Waiver and Before September 30,
2008........................................................................................................................33

iv
List of Tables (continued)
Page
Table 2.15 Youth in the Study Regions with Abuse and Neglect Allegations, by
Permanency Exit and Waiver Assignment ............................................................35
Table 2.16 Youth Statewide with Abuse and Neglect Allegations, by Permanency
Exit and Waiver Assignment .................................................................................35
Table 2.17 Youth in the Study Regions with Indicated Allegations, by Permanency
Exit and Waiver Assignment .................................................................................35
Table 2.18 Youth Statewide with Indicated Allegations, by Permanency Exit and
Waiver Assignment ................................................................................................36
Table 3.1 Age of Youth Interviewed (latest interview) .........................................................40
Table 3.2 Youth’s Gender and Race/Ethnicity (latest interview) ..........................................41
Table 3.3 Youth’s Health Indicators (latest interview) ..........................................................41
Table 3.4 Youth’s Grade in School (latest interview) ...........................................................42
Table 3.5 Youth’s Education Plans, by Treatment Group (latest interview) .........................42
Table 3.6 Youth’s Education Plans, by Whether Youth Wants Permanence with
Caregiver (latest interview)....................................................................................43
Table 3.7 Youth’s Support Scale Scores, by Youth’s Health Status (latest interview) .........45
Table 3.8 Youth’s Support Scale Scores, by Permanency Status (latest interview) ..............46
Table 3.9 Whether Youth Liked Living With Caregiver at Initial Interview, by
Permanency Status at Follow-Up Interview (T1/T2 subsample) ...........................47
Table 3.10 Whether Youth Felt Like Part of Family at Initial Interview, by
Permanency Status at Follow-Up Interview (T1/T2 subsample) ...........................47
Table 3.11 Characteristics of the Caregivers (latest interview) ...............................................48
Table 3.12 Caregivers’ Household Characteristics and Financial Indicators (latest
interview) ...............................................................................................................50
Table 3.13 Financial Indicators by Relative and Nonrelative Caregivers (latest
interview) ...............................................................................................................52

v
List of Tables (continued)
Page
Table 4.1 Whether Caseworker Told Youth About Enhanced Services, for
Demonstration Youth in Care (latest interview) ....................................................54
Table 4.2 Whether Caseworker Told Youth about Enhanced Services by Youth Age, for
Demonstration Youth in Care (latest interview) .................................................. 55
Table 4.3 Interest in Permanence by Awareness of Enhanced Services, for
Demonstration Youth in Care (latest interview) ....................................................55
Table 4.4 Influence of Awareness of Enhanced Services on Youth’s Permanency
Decision, for DemonstrationYouth in Permanence (latest interview) ...................57
Table 4.5 Awareness of Enhanced Services by Demonstration Youth’s Permanency
Decision (latest interview) .....................................................................................58
Table 4.6 Awareness of Enhanced Services by Demonstration Youth’s Permanency
Status (latest interview)..........................................................................................58
Table 4.7 Discussions of Permanence, for Youth Still in Care (latest interview) .................59
Table 4.8 Interest in Permanence, forYouth Still in Care (latest interview) ..........................60
Table 4.9 Interest in Permanence by Age, for Youth Still in Care (latest interview) ............60
Table 4.10 Interest in Permanence by Contact with Biological Parent, for Youth Still
in Care (latest interview) ........................................................................................61
Table 4.11 Permanency Decision, for All Youth (latest interview).........................................62
Table 4.12 Permanency Decision by Age, for All Youth (latest interview) ............................62
Table 4.13 Permanency Decision by Contact with Parent, for All Youth (latest
interview) ...............................................................................................................63
Table 4.14 Permanency Decision by Caregiver Relative Status, for All Youth (latest
interview) ...............................................................................................................63
Table 4.15 Permanency Status by Age, for All Youth (latest interview) ................................64
Table 4.16 Permanency Status by Contact with Parent, for All Youth (latest
interview) ...............................................................................................................64

vi
List of Tables (continued)
Page
Table 4.17 Permanency Status by Caregiver Relative Status, for All Youth (latest
interview) ...............................................................................................................65
Table 4.18 Permanence by Caregiver Relative Status and Youth Age, for All Youth
(latest interview) ....................................................................................................66
Table 4.19 Youth Report of Reasons for Wanting Permanence with Caregiver (latest
interview) ...............................................................................................................67
Table 4.20 Youth Report of Reasons for Not Wanting Permanence with Caregiver
(latest interview) ....................................................................................................68
Table 4.21 Youth Permanence (T1/T2 subsample) .................................................................69
Table 4.22 Youth Who Wanted Permanence at Initial Interview and Whether
Obtained Permanence at Follow-Up Interview, by Caregiver Relationship
(T1/T2 subsample) .................................................................................................69
Table 5.1 Caregivers’ Discussions of Permanence with Caseworker, by Evaluation
Group (latest interview) .........................................................................................71
Table 5.2 Awareness of Enhanced Services by Caregivers in Demonstration Group
(latest interview) ....................................................................................................72
Table 5.3 Permanency Decision, by Whether Caregiver in Demonstration Group
Was Told About Enhanced Services (latest interview) .........................................73
Table 5.4 Permanency Process Completed, by Whether Caregiver in Demonstration
Group Was Told about Enhanced Services (latest interview) ...............................74
Table 5.5 Caregivers’ Permanency Decision, by Evaluation Group (latest interview) .........75
Table 5.6 Caregivers’ Permanency Completion Status, By Evaluation Group (latest
interview) ...............................................................................................................75
Table 5.7 Caregivers’ Permanency Process Completed, by Evaluation Group (latest
interview) ...............................................................................................................78
Table 5.8 Caregivers’ Permanency Decisions and Permanence Completed, by
Relative Status (latest interview) ...........................................................................77
Table 5.9 Caregivers’ Permanency Decisions, by Age of Caregiver (latest interview) ........78

vii
List of Tables (continued)
Page
Table 5.10 Caregivers’ Permanency Decisions, by Annual Household Income (latest
interview) ...............................................................................................................78
Table 5.11 Annual Household Income, by Relative and Nonrelative Caregivers (latest
interview) ...............................................................................................................79
Table 5.12 Caregivers’ Permanency Decisions and Permanency Status, by Whether
Have Spouse or Partner(latest interview) ..............................................................80
Table 5.13 Caregivers’ Permanency Choice by Whether Have Spouse or Partner, for
Relative and Nonrelative Caregivers (latest interview) .........................................81
Table 5.14 Issues Considered by Caregivers When Deciding about Permanence (latest
interview) ...............................................................................................................82
Table 5.15 Caregivers’ Reasons for Choosing Permanence with Youth (latest
interview) ...............................................................................................................82
Table 5.16 Caregivers’ Reasons for Not Choosing Adoption (latest interview) .....................83
Table 5.17 Caregivers’ Reasons for Not Choosing Subsidized Guardianship (latest
interview) ...............................................................................................................84
Table 5.18 Caregivers’ Permanency Decisions at T1 and T2 (T1/T2) ....................................86
Table 5.19 Caregivers’ Permanence Completed at T2 by Permanency Decision at T1
(T1/T2) ...................................................................................................................86
Table 5.20 Caregivers Who Decided To Adopt or Enter Subsidized Guardianship at
T1, by Whether Completed Permanence at T2 (T1/T2) ........................................87
Table 5.21 Caregivers’ Permanence Completed at T2, by Relative Status (T1/T2) ................87
Table C.1 Response Rates for Initial Interviews ..................................................................C-2
Table C.2 Reasons Why Youth Were Not Eligible for Follow-Up Interviews for All
Cases with Initial Interviews ................................................................................C-3

viii
List of Tables (continued)
Page
Table C.3 Final Disposition for Youth Interviews ...............................................................C-4
Table C.4 Reasons Why Caregivers Were Not Eligible for Follow-Up Interviews for
All Cases with Initial Interviews..........................................................................C-4
Table C.5 Final Disposition for Caregiver Interviews..........................................................C-5
Table D.1 School Status of Youth in Study Regions on September 30, 2008 ..................... D-2
Table D.2 School Status of Youth Statewide on September 30, 2008 ................................ D-3
Table D.3 Mean Years of Education of Youth in Study Regions on September 30,
2008..................................................................................................................... D-4
Table D.4 Mean Years of Education of Youth Statewide on September 30, 2008 ............. D-4
Table E.1 Youth Ethnicity/Race by Relative Status of Caregiver (youth interviews) ......... E-1
Table E.2 Youth Disability Status by Relative Status of Caregiver (caregiver
interviews)............................................................................................................ E-2
Table E.3 Youth Moves by Relative Status of Caregiver (youth interviews) ...................... E-2
Table E.4 Percentage of Time in Each Living Arrangement in Study Regions Before
Permanence or September 30, 2008, by Living Arrangement When
Eligible for the Waiver (DCFS administrative data) ........................................... E-4
Table E.5 Percentage of Time in Each Living Arrangement Statewide Before
Permanence or September 30, 2008, by Living Arrangement When
Eligible for the Waiver (DCFS administrative data) ........................................... E-5
Table E.6 Caseworker Permanency Discussions by Relative Status of Caregiver
(caregiver interviews) .......................................................................................... E-6
Table E.7 Awareness of Enhanced Services Among Caregivers in the Demonstration
Group by Relative Status of Caregiver (caregiver interviews) ............................ E-7

ix
List of Figures
Page
Figure 2.1 Overall Transition to Permanence .........................................................................19
Figure 2.2 Transition to Permanence by Age at Assignment ..................................................20
Figure 2.3 Transition to Permanence by Race ........................................................................20
Figure 2.4 Transition to Permanence by Living Arrangement at Assignment ........................21
Figure 2.5 Transition to Permanence by Years in the Foster Care System Prior to
Assignment ............................................................................................................21
Figure 2.6 Transition to Permanence by Assignment Year.....................................................22
Figure 2.7 Permanence by Assignment Group, for Youth Who Achieved Permanence ........24
Figure 2.8 Permanence by Interaction of Relative Status and Prior Years in Foster
Care, for Youth Who Achieved Permanence .........................................................25
Figure 2.9 Permanence by Interaction of Gender and Prior Years in Foster Care, for
Youth Who Achieved Permanence ........................................................................26
Figure 2.10 Permanence by Interaction of Gender and Age When Eligible, for Youth
Who Achieved Permanence ...................................................................................27
Figure 2.11 Permanence by Date of Assignment to the Older Wards Waiver, for Youth
Who Achieved Permanence ...................................................................................28
Figure 2.12 Total Time in Each Living Arrangement in Study Regions After
Assignment to the Waiver and Before Permanence or September 30, 2008 .........31
Figure 2.13 Total Time in Each Living Arrangement Statewide After Assignment to
the Waiver and Before Permanence or September 30, 2008 .................................32
Figure E.1 Total Time in Each Living Arrangement in Study Regions Before
Permanence or September 30, 2008, by Living Arrangement When
Eligible for the Waiver......................................................................................... E-4

x
List of Figures (continued)
Page
Figure E.2 Total Time in Each Living Arrangement Statewide Before Permanence or
September 30, 2008, by Living Arrangement When Eligible for the
Waiver .................................................................................................................. E-5

xi
Illinois Permanence for Older Wards Waiver:
Final Evaluation Report
EXECUTIVE SUMMARY
The Illinois Permanency for Older Wards Waiver (2005-2008) tested the effects of
offering an enhanced set of transition and post-permanency services to youth who were
considering subsidized guardianship or adoption. A previous Illinois subsidized guardianship
waiver demonstration (1997-2002) found that the availability of subsidized guardianship boosted
permanency rates, but more so for younger children than for teenagers. In response, the Older
Wards Waiver was designed to determine whether the prospect of losing eligibility for some
enhanced transition services after adoption or subsidized guardianship was the reason for the
lower permanency rate for teens.
The Older Wards Waiver was evaluated by Westat, under contract to the Illinois
Department of Children and Family Services (DCFS). The requirements for a youth to be
assigned to the waiver included: youth had to have been in a foster home placement (with either
a relative or a nonrelative) for at least 1 year, had to be at least 14 years old, and had to be
eligible for subsidized guardianship. Youth were randomly assigned to either the demonstration
group (eligible for enhanced services) or the control group (eligible only for a standard limited
set of services). Both groups were eligible for adoption and subsidized guardianship. Evaluation
of the waiver was based on (1) DCFS administrative data for all youth ever eligible for the
waiver statewide, (2) interviews from a sample of eligible youth and their caregivers in the three
study regions (Central Cook County region, East St. Louis sub-region, and Peoria sub-region),
and (3) Administrative Case Reviews (ACRs) for a sample of youth in the three study regions. In
addition, we held focus groups and interviews with agency and court staff for a process study.
Interim Report #1 (January 2008) presented the findings of the process study, limited
preliminary outcome findings, and some early results from the initial youth and caregiver
interviews.1 The process study found that local agencies often did not take advantage of the
training that DCFS provided across the state. Thus, some agency and court personnel were not
well-informed about the waiver. There was some confusion about the difference in service
1 Interviews were conducted at two points in time: (1) an initial interview within 6 months of becoming eligible for
the waiver and (2) a follow-up interview at age 18, time of discharge, or end of the data collection period,
whichever came first.

xii
eligibility between youth in the demonstration group and those in the control group, as well as
the difference between the Older Wards Waiver and the earlier Subsidized Guardianship Waiver.
However, staff expressed strong support for subsidized guardianship and adoption for older
youth, although many noted that permanency planning must take into consideration the services
that are available as well as issues about managing some youth’s behavior.
In Interim Report #1, our outcome findings based on DCFS administrative data were
preliminary, as many of the youth had not been in the waiver very long. However, at that time
there appeared to have been no positive or negative waiver effect. Comparing outcomes between
youth in the demonstration group and those in the control group showed that eligibility for
enhanced transition services led to no significant differences (either in the study regions or
statewide) on:
Occurrence of abuse and neglect between the time of assignment to the waiver and
achievement of permanence;
Level of restrictiveness of placements;
Rates of permanence (subsidized guardianship, adoption, or reunification);
How quickly permanence was achieved; or
School achievement or status.
Interim Report #2 (June 2008) presented complete findings from the initial youth and
caregiver interviews, as well as the analysis of the ACRs. They included:
Subsidized guardianship and adoption had not been proposed to quite a few families:
36 percent according to caregiver interview data, 39 percent according to youth
interview data, and 44 percent according to ACR data.
There was far more of a focus on permanence (subsidized guardianship or adoption)
for younger youth than older youth. The younger youth were significantly more likely
(1) to have discussed permanence, (2) to have had permanence proposed to them, and
(3) to want permanence with their caregivers.
A large proportion of families were either undecided or had decided against
permanence (subsidized guardianship or adoption): about 74 percent according to the
youth, 60 percent according to the caregivers, and 58 percent according to the ACRs.
According to the interviews, over half (53%) of the youth in the demonstration group
reported that their caseworkers had not explained the enhanced transition services to
them. Among the caregivers in the demonstration group, 35 percent reported that their

xiii
caseworkers had not explained the enhanced services to them. And when the services
were explained, both youth and caregivers were more likely to want permanence
(subsidized guardianship or adoption) with each other.
In the Final Evaluation Report, we present the final outcome findings and the analysis of
the follow-up interviews. The outcomes analysis showed that the waiver had no observed impact.
Overall, there were small and not statistically significant demonstration-control differences in
exits to adoption, subsidized guardianship, or reunification; incidence and recurrence of abuse
and neglect; restrictiveness of living arrangements; or educational experiences prior to
permanence. The table below presents findings on exits to permanence for youth in the waiver
statewide.
Table ES.1: Exit Status of Youth Statewide After Assignment to the Waiver and Before
September 30, 2008
Exit Status
Demonstration
Group
(N=1,472)
%
Control
Group
(N=1,468)
%
Overall
(N=2,940)
%
No Permanence (still in foster care) 68.9 70.3 69.6
Reunification 6.4 8.2 7.3
Subsidized Guardianship 11.4 9.1 10.3
Adoption 7.5 7.1 7.3
Exited Care (aged out without permanence) 5.8 5.3 5.6
Total 100 100 100
p=0.13
This might indicate that the prospect of enhanced services had little effect on child safety,
permanence, and well-being, and that losing access to services was not the barrier to permanence
that might be expected. However, as found in the process study, there was considerable
confusion about the waiver among agency and court staff, and as a result the intervention was
not always delivered as designed. Thus it is difficult to draw conclusions about the effects of the
intervention. In addition, the caregiver and youth interviews provided indications that services
were important factors in decisionmaking about permanence. Regarding the enhanced transition
services that were available to youth in the demonstration group who were adopted or achieved
subsidized guardianship:
Over half (58%) of the youth in the demonstration group were not aware of the
enhanced services; those who did know were far more likely to want permanence
(subsidized guardianship or adoption) with their caregivers (40% vs. 19%) and more

xiv
likely to have chosen permanence (43% vs. 27%). However, this did not translate into
a significant difference in achievement of permanence (21% vs. 15%). The
achievement of permanence is a lengthy process, and if the tracking of the youth had
gone on longer, we might have found that additional youth achieved permanence.
Over a quarter (28%) of caregivers in the demonstration group were not aware of the
enhanced services. Caregivers in the demonstration group who knew about the
enhanced services were more likely to choose permanence than caregivers who did
not know about the services (52% vs. 24%) and were more likely to complete the
permanency process (23% vs. 10%).
Another indication of the importance of services in general (beyond the enhanced
transition services available only to the demonstration group) was that when caregivers in both
demonstration and control groups were asked what issues were most important in their
decisionmaking about permanence, issues related to services were the most frequently named.
Among all caregivers, over half said that agency help with medical assistance, as well as
services for youth, were the top considerations in their decisionmaking process about
permanence. Two thirds of the caregivers who had decided on guardianship or adoption said that
services for youth were the most important consideration.
In other findings, there was a decline in interest in permanence (subsidized guardianship
or adoption) from the initial to the follow-up interview. Among youth who said at their initial
interviews that they wanted permanence with their caregivers, only 30 percent had achieved it by
the time of their follow-up interviews (19% had achieved guardianship and 11% had been
adopted). Many of the youth had lost interest in permanence by the follow-up interview, saying
that they were too old or had become more interested in living on their own or going into
Independent Living. Average age of these youth at initial interview was 15.6 years and at follow-
up interview was 17.3 years; thus, youth interest in permanence appears to fall off dramatically
between ages 15 and 17, and it is important to discuss permanence with them as early as
possible.
We also found some significant differences depending on whether youth were living with
caregivers who were relatives. Youth with nonrelative caregivers were as interested in
permanence as youth with relative caregivers, but youth with relatives were significantly more
likely to have achieved permanence: youth with relatives were more likely to be adopted (9%)
and much more likely to achieve guardianship (20%) than youth with nonrelatives (6% were

xv
adopted, and 9% achieved guardianship). There were indications that many youth who had been
placed with nonrelatives had more severe needs than youth who had been placed with relatives:
they were more likely to have disabilities, to have spent more time in restrictive placements, and
to have had more moves while in foster care. This might have influenced the permanency rate, if
families with more severe needs were reluctant to forego agency involvement and oversight.
In summary, although we did not find a significant waiver impact, our interview findings
support the perception that services are important considerations for caregivers in their
decisionmaking. We also found that many teenagers in foster care do want permanence
(subsidized guardianship or adoption) but it is important to move quickly because their interest
often wanes as they get older. Finally, caseworkers need to communicate complete and up-to-
date information on families’ permanency options and service eligibility. Particularly given the
new subsidized guardianship eligibility and reimbursement provisions under the Fostering
Connections to Success and Increasing Adoptions Act of 2008, young people and their caregivers
need fully to understand their options.


1
ILLINOIS PERMANENCY FOR OLDER WARDS WAIVER:
Final Evaluation Report
1. Introduction
Placement into permanent homes is an urgent priority for children who have been taken
into the custody of a child welfare agency. Since the implementation of the Adoption and Safe
Families Act of 1997 (ASFA), child welfare policy and practice have been guided by ASFA
principles that foster care should be temporary and that permanency planning should begin as
soon as a child enters foster care. The goals are to place children into homes that are long-lasting
(in addition to safe and nurturing) and to provide enduring family relationships. Policy
increasingly has emphasized adoption, placement with relatives and kin, and guardianship.
Interest in improving permanence for children in foster care was one factor in the U.S.
Department of Health and Human Services’ (HHS’s) establishment of waiver demonstration
programs for states, in which HHS waived certain Federal requirements related to child welfare
services. Several of these waiver demonstrations tested the impact of offering the option of
subsidized guardianship to children in foster care. Under subsidized guardianship, legal
responsibility for a child is transferred from the child welfare agency to a private caregiver or
guardian who receives a monthly subsidy for the care and support of the child. There is no
termination of parental rights (TPR), although reunification generally has been ruled out. The
success of these demonstrations helped set the stage for a recent far-reaching law, the Fostering
Connections to Success and Increasing Adoptions Act of 2008, which (among other significant
provisions) authorizes Title IV-E reimbursements for children who exit foster care to live
permanently with relatives who become their legal guardians.
Illinois was one of the early states to operate a waiver demonstration focused on
subsidized guardianship. The Illinois Subsidized Guardianship Waiver (1997-2002) tested
whether offering subsidized guardianship boosted children’s permanency rate and found that it
did. Illinois’s second waiver involving subsidized guardianship, the Illinois Permanence for
Older Wards Waiver (2005-2008), tested the effects of offering an enhanced transition and
postpermanency services package to youth ages 14 and older who were considering adoption or
subsidized guardianship. Both waivers were evaluated by Westat, under contract to the Illinois
Department of Children and Family Services (DCFS). This Final Evaluation Report covers the
second waiver, the Illinois Permanence for Older Wards Waiver.
2
Interim Report #1, submitted January 8, 2008, discussed the background and
implementation of the waiver, the status of the evaluation, and preliminary outcome findings.
Data collection from youth and caregivers was still in process, so we included only preliminary
summaries of some interview data. Interim Report #2, submitted June 20, 2008, presented
detailed findings from the initial interviews with youth and caregivers, as well as the analysis of
the Administrative Case Reviews (ACRs). This Final Evaluation Report presents our outcome
findings based on DCFS administrative data, as well as findings from the follow-up interviews
with youth and caregivers, and covers the waiver period June 30, 2005, through December 31,
2008.
1.1 Overview of the Older Wards Waiver
The Older Wards Waiver tested an enhanced services component that offered
independent living and transitional services to wards age 14 and older who achieved permanence
through adoption or guardianship. The target population of the waiver was youth ages 14 and
older who had been in the legal custody of the state for at least 1 year, had resided with a foster
parent for at least 12 consecutive months, were not already in a subsidized guardianship or
adoption setting, and were eligible for the state’s standard guardianship program. Youth living
with relatives as well as those in nonrelative foster homes could participate, and they could
participate without regard to Title IV-E eligibility.
The Older Wards Waiver was an extension of the Illinois Subsidized Guardianship
Waiver Demonstration, which operated from May 1997 through March 2002 and tested whether
offering subsidized guardianship boosted the permanency rate of children for whom reunification
and adoption were not possible. The evaluation found that the availability of guardianship did
boost the permanency rates. However, the rates for youth ages 14-17 were lower than for
younger children, which led to an interest in testing whether service eligibility might make a
difference in permanency decision-making for older wards, particularly if the lower permanency
rates were due to losing access to independent living and other transition services once they
achieved permanence. This was the basis for the Older Wards Waiver.
There were some important differences between the two waivers. First, the children in the
Subsidized Guardianship Waiver were younger than those in the Older Wards Waiver. The
average age at assignment to the Subsidized Guardianship Waiver was 10 and the median age
was 9, while most youth were assigned to the Older Wards Waiver at age 14. Second, subsidized

3
guardianship is often thought of in connection with relative caregivers, as it provides a means for
kin to assume parental authority and responsibility without permanently severing parental rights.
Indeed, in the Subsidized Guardianship Waiver, about 66 percent of the children were with
relatives (most of those with a grandmother).2 However, in the interview sample for the Older
Wards Waiver only about 33 percent of the youth were with relatives (most frequently with an
aunt).
1.2 Evaluation of the Waiver
Evaluation Design. The evaluation used an experimental design in which youth were
randomly assigned to either a demonstration or a control group. The treatment difference
involved enhanced transition services: Youth in the demonstration group who were adopted or
achieved subsidized guardianship were eligible for nearly all of the transition services that youth
who aged out of care were eligible for. Youth in the control group who were adopted or went
into subsidized guardianship lost their eligibility for most of the services, such as an employment
incentive program, housing cash assistance, and a youth-in-college program.
Evaluation of the waiver was based on (1) DCFS administrative data for all youth ever
eligible for the waiver statewide, (2) interviews from a sample of eligible youth and their
caregivers in the three study regions (Central Cook County region, East St. Louis sub-region, and
Peoria sub-region), and (3) Administrative Case Reviews (ACRs) for a sample of youth in the
three study regions. In addition, we held focus groups and interviews with agency and court staff
for a process study. And finally, data from other state administrative agencies help understand
longer term youth outcomes on transition to adulthood.3
The study was designed to test hypotheses regarding the experience of older wards in
response to the experimental treatment of being eligible to receive enhanced transition services
after choosing subsidized guardianship or adoption.4 Youth assigned to the control group were
eligible for limited transition services (and could enter into adoption or subsidized guardianship);
2 The Subsidized Guardianship Waiver required that children under age 12 be with a relative in order to be eligible
for subsidized guardianship. The Older Wards Waiver did not require that any youth be with relatives, but they
had to be at least 14 to be in the waiver.
3 Obtaining data from the other Illinois agencies has been a lengthy process. Depending on data availability, those
findings will be presented in a supplementary report during the fall of 2009.
4 All youth in the Older Wards Waiver, whether in the demonstration group or the control group, were eligible for
subsidized guardianship and for adoption.

4
hence the evaluation tested the effects of offering enhanced services relative to limited services,
not the effects relative to no services. We analyzed DCFS administrative data for information
about subsequent abuse and neglect reports, permanence, and child well-being in the
demonstration and control groups, while taking into account youth characteristics and foster care
history.
Random Assignment Procedures. DCFS randomly assigned youth to the demonstration
and control groups from July 1, 2005, through July 1, 2008. Youth had a 50-50 chance of being
in either the demonstration or control group. The random assignment occurred in two phases.
Phase 1 consisted of a large group of eligible youth who (1) were currently in foster care in the
three study regions,5 (2) were eligible for subsidized guardianship under the Subsidized
Guardianship Waiver, and (3) were on or past their 14th
birthday at the start of the waiver (July 1,
2005). DCFS assigned these youth (there were 325) to either the demonstration group or the
control group on June 28, 2005.6
Phase 2 began a month later, as youth who were not previously eligible for the waiver
became eligible by meeting the waiver criteria. DCFS assigned youth to either the demonstration
group or the control group on a monthly basis, as youth met the following criteria: (1) were
eligible for subsidized guardianship under the Subsidized Guardianship Waiver, (2) reached their
14th
birthday after July 1, 2005, and (3) had been in a placement for at least 1 year. The total
number of youth who were eligible for the waiver and assigned to the waiver was 2,940
statewide (1,472 in the demonstration group and 1,468 in the control group) and 1,006 in the
three study regions (497 in the demonstration group and 509 in the control group).
Youth and Caregiver Interviews. The youth and caregiver interviews were conducted at
two points: (1) an initial interview conducted with a sample of youth and their caregivers in the
study regions within 6 months of becoming eligible for the waiver and (2) a follow-up interview
with the youth and caregivers at age 18, time of discharge, or end of the data collection period
(December 31, 2008), whichever came first. These interviews provided the perspectives of the
youth and caregivers on their decision-making processes regarding permanence, as well as other
issues that might affect final outcomes (e.g., services used, relationship of caregiver and youth,
5 The waiver covered only the three study areas from June 30, 2005, through April 30, 2006, and then it went
statewide.
6 In Phase 1, caregivers were randomly assigned, so that youth with the same provider, including siblings in the
same home, would have the same assignment (demonstration or control). In Phase 2, youth were randomly
assigned so that two youth with the same provider or in the same family might not have the same assignment.

5
child well-being, caregiver attitudes about the youth). They also collected information on
demographics, health status, household composition, social support, services received, role of
biological parents, attachment status, and decisionmaking about permanence. The same
instrument was used for both the initial and follow-up interview. Appendix A includes the youth
interview instrument, and Appendix B includes the caregiver interview instrument. Appendix C
provides technical details on the response rate and nonresponse adjustment for the initial and
follow-up interviews.
The interview sample was selected using monthly files of DCFS administrative data on
youth assigned to the waiver. One result of the random assignment process was that some youth
assigned to the waiver were not actually eligible for subsidized guardianship at the time we
received their data. These included youth who had not been in their current caregiver’s home for
at least 1 year, youth who were institutionalized, and youth who had already turned age 18.
When we received the monthly DCFS data, we selected into the interview sample only youth
who met all the criteria—i.e., had been in their current caregiver’s home at least 1 year, were not
in a group home or institution, and had not yet turned 18. Youth who did not meet all the criteria
were excluded from the interview sample. For the youth who met all criteria except that they had
not yet been with their caregiver for 1 year, we selected them into the interview sample as soon
as they met the 1-year requirement.
Administrative Case Reviews. Every 6 months, ACRs were conducted for each child in
foster care to determine their progress toward permanence and to identify any factors that might
impede that progress.7 We analyzed longitudinal ACR data from March 2006 through September
2007. For the ACR findings, see Interim Report #2 (summarized in Section 1.4).
Human Subjects Protection. All Westat research involving human subjects or confidential
data must be reviewed by the Westat Institutional Review Board (IRB). The IRB reviewed the
study and determined that it was exempt from IRB review, as it was an internal program
evaluation and did not fall under the definition of ―research.‖ After IRB review, Westat had to
obtain informed consent from the DCFS Office of the Guardian as well as from the youth’s
caregivers prior to conducting interviews with the youth. At times, the consent process from the
Office of the Guardian was protracted, and youth turned 18, were adopted, were reunified, or
7 Participants at ACRs can include the administrative case reviewer, caseworker, child (when age 12 and older),
foster parent, biological parent, attorney, Guardian Ad Litem (GAL), and others requested by the parent, although
often only the reviewer and caseworker are present. The reviewer conducts the meeting and, during the waiver,
completed an information packet that included questions that were part of the evaluation.

6
went into subsidized guardianship before Guardian consent was received. (See Appendix C for
more information about survey response.)
1.3 Summary of Interim Report #1
Interim Report #1 presented the findings of the implementation study, limited preliminary
outcome findings, and some early results from the initial youth and caregiver interviews. The
implementation study found that local agencies often did not take advantage of the training that
DCFS provided across the state. Thus, some agency and court personnel were not well-informed
about the waiver. There seemed to be some confusion at times about (1) the difference in service
eligibility between youth in the demonstration group and those in the control group and (2) the
difference between the present Older Wards Waiver and the earlier Subsidized Guardianship
Waiver. However, staff who understood the waiver felt strongly that having the enhanced
services available made a big difference for the youth and caregivers, and they expected a
positive impact from the waiver. Overall, staff expressed strong support for subsidized
guardianship and adoption for older youth, although many noted that permanency planning must
take into consideration the services that are available as well as issues about managing some
youths’ behavior.
Our outcome findings based on DCFS administrative data were preliminary, as many of
the youth had not been in the waiver very long, but at the writing of Interim Report #1 there
appeared to have been no positive or negative effect. Comparing outcomes between youth in the
demonstration group and those in the control group showed that eligibility for enhanced
transition services led to no significant differences (either in the study regions or statewide) on:
Occurrence of abuse and neglect between the time of assignment to the waiver and
achievement of permanence;
Level of restrictiveness of placements;
Rates of permanence;
How quickly permanence was achieved; or
School achievement or status.
Interim Report #1 also presented selected early results from the initial interviews with
youth and caregivers. We do not summarize those here, as the detailed findings from the initial
interviews presented in Interim Report #2 are summarized next.

7
1.4 Summary of Interim Report #2
The following findings were consistent across all three data sources (youth interviews,
caregiver interviews, and ACRs). Although specific percentages vary, the general patterns are
the same.
Permanence had not been proposed to quite a few families: 36 percent according to
caregiver interview data, 39 percent according to youth interview data, and 44 percent
according to ACR data.
There was far more of a focus on permanence for younger youth than older youth.
The younger youth were significantly more likely to have (1) discussed permanence,
(2) had permanence proposed to them, and (3) want permanence with their caregivers.
A large proportion of families were either undecided or had decided against
permanence: about 74 percent according to the youth, 60 percent according to the
caregivers, and 58 percent according to the ACRs.8
The following pattern was found in the youth and caregiver interviews.
Over half (53%) of the youth in the demonstration group reported that their
caseworkers had not explained the enhanced transition services to them. Among the
caregivers in the demonstration group, 35 percent reported that their caseworkers had
not explained the enhanced services to them. And when the services were explained,
both youth and caregivers were more likely to want permanence.
Youth interviews showed some demonstration/control differences.
Youth in the control group whose caregivers were relatives were more likely to want
permanence compared to youth in the control group whose caregivers were not
relatives. For youth in the demonstration group, it appeared to make little difference
whether their caregivers were relatives.
Youth in the demonstration group were significantly more likely to have decided with
their caregivers on subsidized guardianship (about 20 percent) and less likely to be
8 The percentage from the ACR data is the proportion of families who had decided against permanence from among
all families for whom permanence was proposed by the caseworker rather than from among all families.

8
undecided or unsure (about 50 percent) than youth in the control group (about 13
percent for subsidized guardianship and 60 percent undecided or unsure).9
Youth in the control group were more likely to have had several of the independent
living classes, compared to youth in the demonstration group.
Other patterns revealed by the youth interviews provide descriptive information.
Most youth had at least moderate amounts of emotional, concrete, and relationship
support. However, among males, low levels of support were more prevalent than
among females.
Youth whose caregivers were relatives were significantly more likely to report that
they had contact with a biological parent.
About 36 percent of youth wanted their caregivers to become their legal guardians; 27
percent wanted to be adopted by their caregivers; 24 percent did not want either
option; and 31 percent were unsure. Overall, 45 percent of the youth said that they
wanted permanence (adoption, subsidized guardianship, or either) with their
caregivers.
Youth who had contact with a biological parent were less likely to want to be adopted
by their caregivers compared to youth who had no contact, but there was no
significant difference on subsidized guardianship.
Youth who had experienced many moves (four or more) in their lives had received
significantly more counseling, compared to youth with fewer moves.
The following findings about demonstration/control differences are based on the
caregiver interviews.
Caregivers in the demonstration group were significantly more likely to have
discussed subsidized guardianship with their caseworkers, compared to caregivers in
the control group: 63 percent compared to 55 percent. There was not a significant
difference on discussing adoption.
9 Although the difference was not quite statistically significant (p=.053), caregivers in the demonstration group also
had chosen subsidized guardianship more often (about 31%) and were undecided less often (about 35%) than
caregivers in the control group (about 22% for subsidized guardianship and 41% undecided). The demonstration-
control differences in the ACR data were not even close to being statistically significant, but for the sake of
comparison, the ACRs showed that among families to whom permanence was proposed, about 25 percent chose
subsidized guardianship, and 58 percent rejected permanence.

9
Among caregivers who had chosen adoption or legal guardianship, those in the
demonstration group were significantly less likely to have completed the permanency
process and more likely not to have started the process, compared to those in the
control group.
Caregiver interviews (and the evaluation of the previous waiver) provided other
descriptive information.
In the Older Wards Waiver, only about a third of the youth lived with relative
caregivers. In the previous waiver (Subsidized Guardianship Waiver), about two-
thirds of the children lived with relative caregivers.
In the Older Wards Waiver, relative caregivers were most often aunts. In the
Subsidized Guardianship Waiver, relative caregivers were usually grandmothers.
Overall, about half of caregivers reported that the youth in their care had disabilities,
most frequently learning disabilities and emotional disturbance.
Youth with disabilities were significantly less likely to be living with relatives,
compared to youth without disabilities.
Relative caregivers were significantly more likely to report low income and financial
difficulties, and less likely to report home ownership.
Overall, about 91 percent of youth service requests/referrals resulted in receipt of
services, compared to about 60 percent of caregiver requests/referrals. Services for
youth most often consisted of medical cards, individual counseling, and health care
services. Services for caregivers most often consisted of respite care, family
counseling, and help getting public assistance.
The analysis of ACR data showed the following.
Caseworkers were more likely to propose subsidized guardianship when the caregiver
was a relative, compared to when the caregiver was a non relative. Caseworkers were
more likely not to propose either option when the caregiver was a nonrelative. There
was little difference on proposing adoption.
Among families for whom permanence was proposed, about 17 percent accepted
adoption; 25 percent accepted subsidized guardianship; and 58 percent accepted
neither option.
Permanency outcomes differed significantly when examined by youth’s age, relative
status of caregiver, and youth’s gender. Among younger youth, about 23 percent were

10
discharged to permanence (reunification, subsidized guardianship, or adoption),
compared to only 3 percent of older youth. Among youth whose caregivers were
relatives, 21 percent were discharged to permanence, compared to 12 percent of youth
whose caregivers were nonrelatives. And among the younger youth, females were
more likely to be discharged to permanence than were males, and those with relatives
were more likely to be discharged to permanence than those with nonrelatives.
1.5 Highlights of Final Evaluation Report
The hypothesis testing on child safety, permanence, and well-being for the Illinois Older
Wards Waiver showed that the waiver had no observed impact. Overall, there were no
statistically significant demonstration-control differences in exits to permanence (adoption,
subsidized guardianship, or reunification), incidence and recurrence of abuse and neglect,
restrictiveness of living arrangements, or educational experiences prior to permanence. This
analysis could indicate that loss of transition services is not the barrier to permanence that some
thought it might be.
However, other evaluation findings provide a somewhat different perspective. The
intervention was implemented inconsistently, with considerable confusion among agency and
court staff about what it involved, and this might have diluted or prevented any potential waiver
impact. And the caregiver and youth interviews provided indications that services were
important factors in decisionmaking about permanence. For example:
Over half (58%) of the youth in the demonstration group were not aware of the
enhanced services; those who did know were far more likely to want permanence
with their caregivers (40% vs. 19%) and more likely to have chosen permanence
(43% vs. 27%). However, this did not translate into a significant difference in
achievement of permanence (21% vs. 15%). The achievement of permanence is a
lengthy process, and if the tracking of the youth had gone on longer, we might have
found that additional youth achieved permanence.
Over a quarter (28%) of caregivers in the demonstration group were not aware of the
enhanced services. Caregivers in the demonstration group who knew about the
services were more likely to choose permanence than caregivers who did not know
about the services (52% vs. 24%) and were more likely to complete the permanency
process (23% vs. 10%).

11
When caregivers were asked what issues were most important in their decision-
making about permanence, issues related to services were the most frequently named.
Among all caregivers, over half said that agency help with medical assistance, as
well as services for youth, were the top considerations in their decision-making
process about permanence. Two thirds of the caregivers who had decided on
guardianship or adoption said that services for youth were the most important
consideration.
The top reason that youth wanted either adoption or guardianship was that they had a
strong bond with their caregiver. The top reason that youth did not want either option was that
they felt they were too old. And youth preference was important to the caregivers: the top reason
that caregivers did not choose guardianship was that the youth did not want it. The top reason
that caregivers did not choose adoption was that the youth was already related by blood
(however, note that many related caregivers did choose to adopt). And over half of the caregivers
did not choose adoption because the youth did not want to be adopted.
Among youth who said at their initial interviews that they wanted permanence with their
caregivers, only 30 percent had achieved it by the time of their follow-up interviews (19% had
achieved guardianship and 11% had been adopted). Among caregivers who said at their initial
interview that they had chosen permanence, only 43 percent had achieved it by their follow-up
interview. Many of the youth had lost interest in permanence by the follow-up interview, saying
that they were too old or had become more interested in living on their own or going into
Independent Living. Average age of these youth at initial interview was 15.6 years and at follow-
up interview was 17.3 years; thus, youth interest in permanence appears to fall off dramatically
between ages 15 and 17, and it is important to discuss permanence with them as early as
possible.
In a descriptive analysis of the subset of 730 youth who achieved permanence, we found
that youth assigned to the control group were more likely to be reunified (34% of the control
group vs. 25% of the demonstration group) and less likely to go into subsidized guardianship
(37% of the control group vs. 45% of the demonstration group) than youth assigned to the
demonstration group. The proportions of youth who were adopted were nearly equal (around
29%) for demonstration and control groups. Note that this finding is not necessarily indicative of
a waiver impact, because it looks only at youth who achieved permanence rather than at all
youth.


13
2. Outcomes
The Older Wards Waiver was designed to test specific hypotheses regarding the effect of
the waiver on youth’s safety, permanence, and well-being. The primary hypothesis of interest
focused on permanence: What was the impact of the waiver on youth’s achievement of
permanence, especially subsidized guardianship? In addition, we assessed the waiver’s impact
on the restrictiveness of youth’s placements, recurrence of abuse and neglect, and health and
education status. We also present descriptive findings concerning the youth who did achieve
permanence.
The hypotheses were tested using administrative data through September 2008. The
administrative data cover 2,940 youth statewide (1,006 in the study regions) who were assigned
to the demonstration or control group and were eligible for the waiver (i.e., were at least 14 years
old, had been in a living arrangement for 1 year, and the living arrangement was a foster home or
home of relative). The analysis covers only youth ages 14 through 17 at the time of assignment.
The hypothesis testing showed that, in most of the analyses, there were only small
differences between the demonstration and control groups, whether examined for the study
regions or statewide. Statistical techniques were used to assess whether the differences were
statistically significant.10
The p-values for testing significance are shown below the tables. P-
values less than .05 indicate significant differences. Tables and figures in this chapter include
demonstration-control differences even when not statistically significant because these outcomes
are of central importance to the waiver and, when examined together, might suggest a pattern.
It is important to keep in mind that the intervention was implemented inconsistently and,
overall, quite weakly. Our process study found that there was confusion at times about (1) the
difference in service eligibility between youth in the demonstration group and those in the
control group, and (2) the difference between the present Older Wards Waiver and the earlier
Subsidized Guardianship Waiver. Both court and agency staff often were unaware of or confused
about the waiver. Many were under the impression that youth in the control group were ineligible
for subsidized guardianship—likely a holdover from the previous Subsidized Guardianship
10
Youth were assigned to the demonstration and control groups monthly. The assignments were clustered by the
provider ID in the first month of assignment such that all youth with the same provider got the same assignment.
In subsequent months, the youth were assigned independently. The statistical tests (chi-square tests for testing
independence in tables and F-tests for testing for differences in means) were adjusted to account for the effect of
clustering in the first assignment month.

14
Waiver, under which only youth assigned to the demonstration group were eligible for
subsidized guardianship. Thus any ―treatment effect‖ from being eligible for enhanced services
would have been diluted if caseworkers were not aware that some youth were eligible for these
services, or did not know what services youth would be eligible for, and did not communicate
that information to the youth.
2.1 Permanence
The permanency outcomes of primary interest were subsidized guardianship and
adoption. However, for this analysis, we investigated reunification as well, to determine whether
there was an effect on that permanency option. We defined ―permanence‖ as being reunified,
placed in subsidized guardianship, or adopted after becoming eligible for the waiver and before
age 18 or before September 30, 2008. In a few cases in this dataset, the youth achieved
permanence but later came back into the foster care system; such cases are still counted as
―permanence.‖
2.1.1 Waiver Impact on Permanency Exits
Hypothesis: Youth in the demonstration group are more likely to achieve permanence than youth
in the control group.
Did the waiver result in more youth achieving permanence? Did subsidized guardianship
supplant adoption, as was found under the original Subsidized Guardianship Waiver? The lack of
significant demonstration-control differences, as discussed below, means that the waiver did not
result in more youth achieving permanence, and adoption was not supplanted by subsidized
guardianship
Table 2.1 shows that as of September 30, 2008, 71.4 percent of the youth in the study
regions had not achieved permanence—they were still in foster care (63.8%) or had aged out
(7.6%). A slightly higher percentage of youth in the demonstration group were in subsidized
guardianship compared to the control group, while a slightly lower percentage had been reunified
or adopted. However, since these differences were not significant, we should be cautious in
interpreting them. It is possible that the differences indicate some confusion about the waiver—
perhaps some caseworkers mistakenly believed that youth in the control group were not eligible
for subsidized guardianship (which would have been the situation under the previous waiver),

15
and therefore they were more likely to suggest reunification or adoption, rather than subsidized
guardianship, to those families. However, no definite conclusions may be drawn.
Table 2.1: Exit Status of Youth in Study Regions After Assignment to the Waiver and
Before September 30, 2008
Exit Status
Demonstration Group
(N=497)
%
Control Group
(N=509)
%
Overall
(N=1,006)
%
No permanence (still in foster care) 62.8 64.9 63.8
Reunification 8.0 9.6 8.8
Subsidized guardianship 13.3 9.2 11.2
Adoption 7.4 9.2 8.3
Exited care (aged out without permanence) 8.5 7.1 7.6
Total 100 100 100
p=.23
Note: Youth who achieved permanence might have later re-entered foster care, but they are still counted in the type of
permanence they achieved before re-entering care.
As shown in Table 2.2, a somewhat higher percentage of youth statewide (75.2%) was
still in care or had aged out as of September 30, 2008, regardless of the assignment group. Note
that the youth in the study regions were eligible for the waiver starting in June 2005, while the
youth from other regions in the state were eligible beginning in April 2006. Thus the statistics for
youth statewide are for a shorter period than in the study regions. This difference may explain
the lower proportion of youth in foster care in the study regions. Again, no significant
differences were found between demonstration and control groups.
Table 2.2: Exit Status of Youth Statewide After Assignment to the Waiver and Before
September 30, 2008
Exit Status
Demonstration Group
(N=1,472)
%
Control Group
(N=1,468)
%
Overall
(N=2,940)
%
No permanence (still in foster care) 68.9 70.3 69.6
Reunification 6.4 8.2 7.3
Subsidized guardianship 11.4 9.1 10.3
Adoption 7.5 7.1 7.3
Exited care (aged out without permanence) 5.8 5.3 5.6
Total 100 100 100
p=.13
Note: Youth who achieved permanence might have later re-entered foster care, but they are still counted in the type of
permanence they achieved before re-entering care.

16
Another measure related to achievement of permanence is the time in foster care since the
date of assignment to the waiver. Did the waiver lead to shorter stays in foster care? Table 2.3
shows the average number of years that youth in the demonstration and control groups in the
study regions were in foster care after assignment until either achieving permanence, aging out,
or September 30, 2008, whichever came first. The average number of years is essentially the
same for the demonstration and the control group. Because the permanency rates were so similar
(as shown in Table 2.1), we did not expect to find differences in time in foster care, but we
wanted to check whether permanence was happening more quickly for one group than the other.
We did not find that; thus, the waiver did not lead to shorter stays in foster care (or faster
permanence).
Table 2.3: Time in Foster Care Following Assignment for Youth in Study Regions
Time in Foster Care Demonstration Group Control Group Overall
Mean years in care 1.68 1.67 1.68
Number of youth 497 509 1,006 p=.91
Table 2.4 presents the average numbers of years in foster care for youth in the waiver
statewide. Those averages are somewhat lower than for the youth in the study regions. Again,
these findings are influenced by the later statewide implementation date, compared to
implementation in the study regions, meaning that there was less time for youth statewide to
accumulate years in care.
Table 2.4: Time in Foster Care Following Assignment for Youth Statewide
Time in Foster Care Demonstration Group Control Group Overall
Mean years in care 1.52 1.53 1.52
Number of youth 1,472 1,468 2,940 p=.77
2.1.2 Predictors of Permanence
In another analytic approach to help understand the outcomes, we assessed factors that
predicted time until permanence—i.e., the time from assignment to the Older Ward Waiver until
a youth achieved permanence through adoption, subsidized guardianship, or reunification. What
factors (including demonstration-control status) were significant predictors of achieving
permanence? The analysis showed that demonstration-control status was not a significant

17
predictor, but several other factors were (race of youth, relative caregiver, age of youth, and
years in foster care).
Many youth did not achieve permanence before reaching age 18 or before the end of the
study. Because the time until permanence was unknown or undefined for these youth, survival
analysis was used to assess factors that predicted the time to permanence. In the terminology of
survival analysis, the time to permanence for the youth who did not achieve permanence before
reaching age 18 or before the end of the study was treated as censored.11
Variables that were available from the administrative data at the time of assignment to the
Older Wards Waiver were used as candidate predictors of time until permanence. Those
variables were:
Control or demonstration assignment;
Age at assignment (rounded down to 14, 15, 16, or 17);
Years in the foster care system prior to assignment to the Older Wards Waiver (1 to 2
years, 2 to 3 years, 3 to 7 years, 7 to 13 years, and 13 to 18 years12
);
Race (as black, white, and other);
Whether the youth was in the home of relative or nonrelative at assignment;
Assignment date (June 28, 2005; July 2005 through June 2006; July 2006 through
June 2007; and July 2007 through September 2008);
Gender; and
Region at assignment (either in the study regions or not).
A stepwise procedure was used to identify significant main effects. All of the candidate
variables were statistically significant except gender and region, which were dropped from
further consideration. Interactions of the significant main effects were considered. No
interactions were significant except that the interaction of age at assignment, and year of
assignment was marginally significant. The significance depended on what other terms were in
the model and if the continuous or categorical variables were used. In the models considered, the
11
The analysis ignored the clustering associated with the clustering of assignments at the first assignment time.
Ignoring the clustering was expected to make little difference in the outcomes because (1) in other analyses the
effect of clustering on the precision estimates and p-values is small, and (2) the assignments were not clustered for
most of the youth.
12 The actual maximum number of years was 17.7, which was rounded to 18.

18
p-value for the interaction was always greater than .0261. The interaction was dropped from the
final model.
Table 2.5 shows p-values for evaluating the significance of each term. All terms except
the assignment group were highly significant.
Table 2.5: P-values for Assessing Significance of Main Effects in the
Survival Model Predicting Time From Assignment to
Permanence
Factor
Wald Chi-
Square
Degrees of
Freedom Pr > ChiSq
Assignment group 0.21 1 0.5942
Race 46.58 2 <.0001
Living arrangement at assignment 39.92 2 <.0001
Age at assignment 137.65 3 <.0001
Prior years in foster care 35.54 4 <.0001
Assignment year 15.37 3 0.0015
The table shows that even after adjusting for the effect of other factors, the assignment
group was not a significant predictor of achieving permanence. However, the results for the other
parameters in the model provide some insight into factors that predicted the rate of achieving
permanence for those youth who were eligible for the Older Wards Waiver. On average, youth
classified as white achieved permanence sooner than youth classified as black. Youth in a
relative’s home at the time of assignment achieved permanence sooner than youth in a
nonrelative’s home. Based on age at the time of assignment, younger youth (age 14 or 15 at the
time of assignment) achieved permanence sooner than older youth. Youth who had been in the
foster care system for 2 to 3 years were more likely to achieve permanence by age 18 (or to
achieve permanence sooner) than those in the system for 1 to 2 years and those in the system for
more than 3 years. Youth in the foster care system less than 1 year were not included in this
analysis because they were not eligible for the Older Wards Waiver. There were some
differences by assignment year, but those differences are relatively small compared to other
factors.
Due to the complexity of the model, presenting the results is somewhat complicated. To
summarize the results, Figures 2.1 to 2.6 show the proportion of youth still in foster care (on the
vertical axis) versus time since assignment to the Older Wards Waiver (on the horizontal axis),
with lines on each plot showing the survival curves for subsets of youth. The proportion of youth
who achieved permanence is one minus the proportion who had not achieved permanence. The

19
lower lines on the plots are for youth who achieved permanence sooner than the youth
represented by the upper lines.
Figure 2.1: Overall Transition to Permanence
Fra
ctio
n o
f ch
ild
ren
sti
ll i
n f
ost
er c
are
0.0
0.1
0.2
0.3
0.4
0.5
0.6
0.7
0.8
0.9
1.0
Years since eligible for older wards waiver
0 1 2 3 4
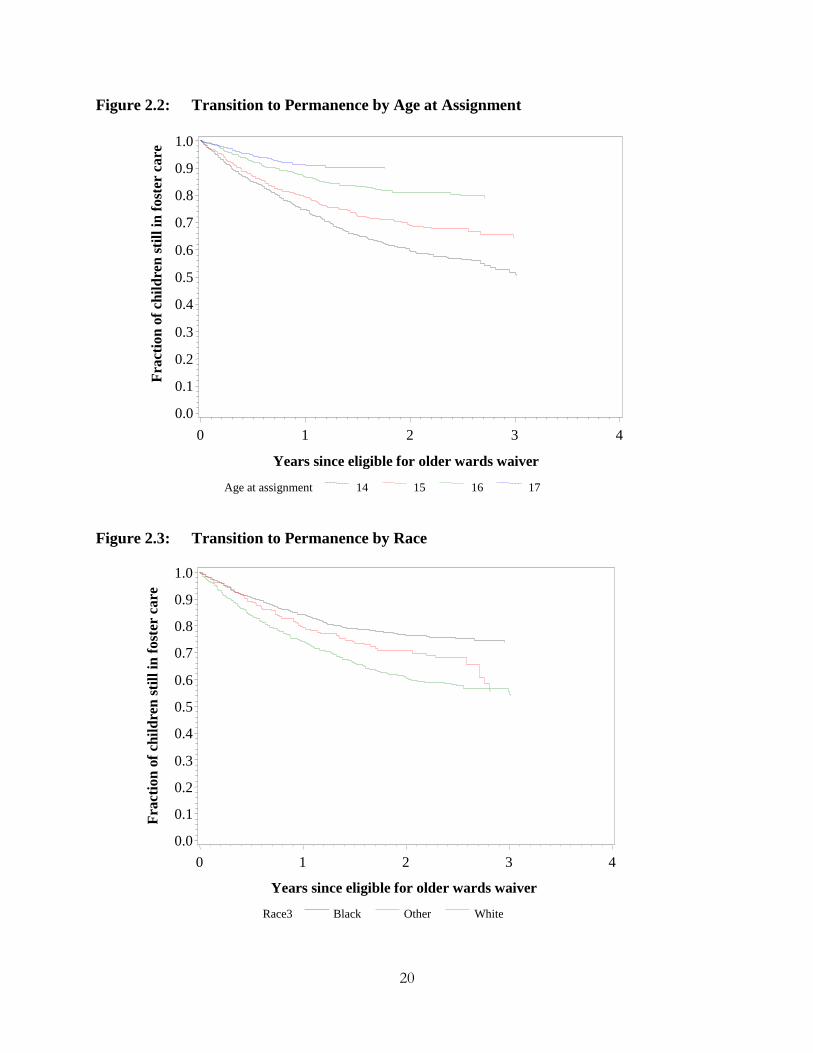
20
Figure 2.2: Transition to Permanence by Age at Assignment
Figure 2.3: Transition to Permanence by Race
Race3 Black Other White
0.0
0.1
0.2
0.3
0.4
0.5
0.6
0.7
0.8
0.9
1.0
Years since eligible for older wards waiver
0 1 2 3 4
Fra
ctio
n o
f ch
ild
ren
sti
ll i
n f
ost
er c
are
Age at assignment 14 15 16 17
Fra
ctio
n o
f ch
ild
ren
sti
ll i
n f
ost
er c
are
0.0
0.1
0.2
0.3
0.4
0.5
0.6
0.7
0.8
0.9
1.0
Years since eligible for older wards waiver
0 1 2 3 4

21
Figure 2.4: Transition to Permanence by Living Arrangement at
Assignment (HMR = home of relative, FH_ = foster home)
Figure 2.5: Transition to Permanence by Years in the Foster Care System
Prior to Assignment
Living arrangement at assignment FH HMR
Fra
ctio
n o
f ch
ild
ren
sti
ll i
n f
ost
er c
are
0.0
0.1
0.2
0.3
0.4
0.5
0.6
0.7
0.8
0.9
1.0
Years since eligible for older wards waiver
0 1 2 3 4
Prior years in foster care 1 to 2 2 to 3 3 to 7 7 to 13 13 to 18
Fra
ctio
n o
f ch
ild
ren
sti
ll i
n f
ost
er c
are
0.0
0.1
0.2
0.3
0.4
0.5
0.6
0.7
0.8
0.9
1.0
Years since eligible for older wards waiver
0 1 2 3 4

22
Figure 2.6: Transition to Permanence by Assignment Year (in the legend, 0 is
the first assignment (June 28, 2005), 1 and 2 are for assignments in
the following 2 years, and 3 is for the remainder of the assignments)
2.1.3 Analysis of Youth Who Achieved Permanence
For the 730 youth who achieved permanence, a separate analysis predicted the
probability of a youth’s going into subsidized guardianship, being adopted, or returning home.
Thus, this analysis takes a closer look at only the youth who achieved permanence. The youth’s
assignment (demonstration or control group) was not a significant predictor of the time to
permanence, and as presented in Tables 2.1 and 2.2, we did not find a significant waiver impact
on achievement of permanence. However, interestingly, there were significant differences among
the youth who achieved permanence, based on assignment group and other characteristics.
The model was fit using the SAS CatMod procedure. The candidate-independent factors
were those used for survival analysis, with the exception that for the prior time in foster care, the
categories for 3 to 7 years and 7 to 18 years were combined due to small sample sizes. The
significant main effects were identified using a manual stepwise procedure. Then, all possible
interactions of the significant main effects were added to the main effects one at a time to
Assignment year 0 1 2 3
Fra
ctio
n o
f ch
ild
ren
sti
ll i
n f
ost
er c
are
0.0
0.1
0.2
0.3
0.4
0.5
0.6
0.7
0.8
0.9
1.0
Years since eligible for older wards waiver
0 1 2 3 4

23
identify candidate interactions. Three of the five candidate interactions were significant when all
candidate interactions were included in the model. The factors in the model predicting the
probabilities of the three permanency outcomes are shown in Table 2.6 along with p-values. If
interactions were significant, the main effects that were part of the interaction were kept in the
model.
Table 2.6: Significant Factors Predicting the Probability of Each
Permanency Outcome, for Youth Who Achieved
Permanence
Source Pr > ChiSq
OWW assignment 0.0177
Living arrangement 0.0561
Age 0.0901
Prior years in foster care (FC) <.0001
Eligibility year <.0001
Gender 0.1586
Living arrangement * prior years in FC 0.0011
Prior years in FC * gender 0.0037
Age * gender 0.0229
The descriptive differences modeled by the various terms above are illustrated in Tables
2.7 to 2.11 and Figures 2.7 to 2.11. In this analysis, there was a significant difference associated
with the assignment group. As shown in Table 2.7 and Figure 2.7, youth assigned to the control
group were more likely to be reunified and less likely to go into subsidized guardianship than
youth assigned to the demonstration group – a rather unexpected finding because, as was shown
in Tables 2.1 and 2.2, the overall demonstration-control differences regarding permanency exit
were not statistically significant, indicating no waiver impact on achievement of permanence.
However, the current analysis is different because it focuses on the subset of youth who achieved
permanence and because the model adjusts for the effects of other factors. Given the lack of
waiver impact in the earlier analyses and the weak implementation of the waiver, this difference
might be due to chance. On the other hand, this difference might correspond to an impact of the
waiver assignment for those who were aware of the service options associated with the waiver.
In addition, it is interesting to note that the proportions of youth who were adopted, as shown in
Table 2.7, were nearly equal between demonstration and control groups. Figure 2.7 presents
these findings in bar charts.

24
Table 2.7: Permanence by Assignment Group, for Youth Who
Achieved Permanence
Assignment Group
Reunification
%
Subsidized
Guardianship
%
Adoption
%
Total
%
Demonstration (N=372) 25.3 45.2 29.6 100
Control (N=358) 33.5 37.4 29.1 100
p=.0177
Figure 2.7: Permanence by Assignment Group, for Youth Who Achieved
Permanence
The interaction of living arrangement and prior years in foster care was significant. As
shown in Table 2.8 and Figure 2.8, youth with more years in the foster care system were more
likely to be adopted than those with fewer years and, for those living in foster homes, less likely
to be reunified. However, youth living with relatives who had been in the foster care system for
over 7 years were more likely to be reunified than those with 2 to 7 years in the foster care
system.
0%
10%
20%
30%
40%
50%
60%
70%
80%
90%
100%
Control Demonstration
Older ward waiver assignment group
Per
cen
t of
chil
dre
n e
xit
ing c
are
(N
=730)
Adoption
Subsidized guardianship Reunification
Exit status
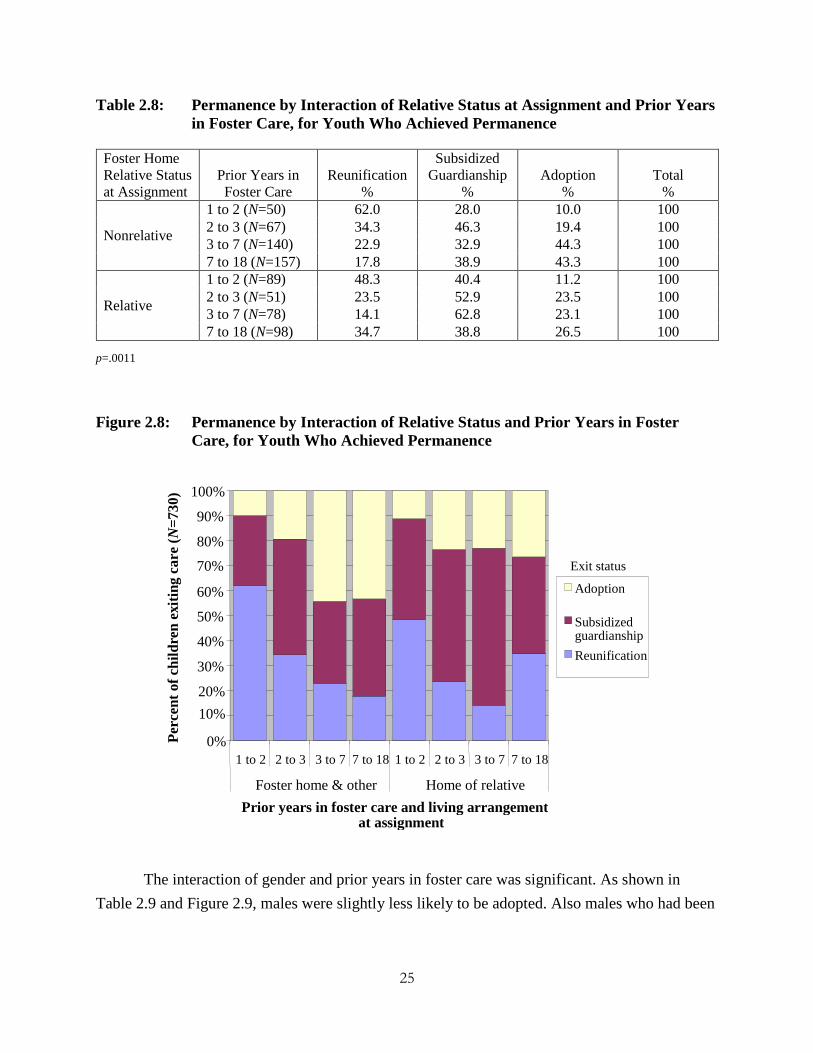
25
Table 2.8: Permanence by Interaction of Relative Status at Assignment and Prior Years
in Foster Care, for Youth Who Achieved Permanence
Foster Home
Relative Status
at Assignment
Prior Years in
Foster Care
Reunification
%
Subsidized
Guardianship
%
Adoption
%
Total
%
Nonrelative
1 to 2 (N=50) 62.0 28.0 10.0 100
2 to 3 (N=67) 34.3 46.3 19.4 100
3 to 7 (N=140) 22.9 32.9 44.3 100
7 to 18 (N=157) 17.8 38.9 43.3 100
Relative
1 to 2 (N=89) 48.3 40.4 11.2 100
2 to 3 (N=51) 23.5 52.9 23.5 100
3 to 7 (N=78) 14.1 62.8 23.1 100
7 to 18 (N=98) 34.7 38.8 26.5 100
p=.0011
Figure 2.8: Permanence by Interaction of Relative Status and Prior Years in Foster
Care, for Youth Who Achieved Permanence
The interaction of gender and prior years in foster care was significant. As shown in
Table 2.9 and Figure 2.9, males were slightly less likely to be adopted. Also males who had been
0%
10%
20%
30%
40%
50%
60%
70%
80%
90%
100%
1 to 2 2 to 3 3 to 7 7 to 18 1 to 2 2 to 3 3 to 7 7 to 18
Foster home & other Home of relative
Prior years in foster care and living arrangement at assignment
Per
cen
t of
chil
dre
n e
xit
ing c
are
(N
=730)
Adoption
Subsidized guardianship
Reunification
Exit status

26
in the foster care for less than 2 years were more likely to be reunified than females in the same
circumstances.
Table 2.9: Permanence by Interaction of Gender and Prior Years in Foster Care, for
Youth Who Achieved Permanence
Gender
Prior Years in
Foster Care
Reunification
%
Subsidized
Guardianship
%
Adoption
%
Total
%
Female
1 to 2 (N = 75) 40.0 45.3 14.7 100
2 to 3 (N = 60) 33.3 40.0 26.7 100
3 to 7 (N = 110) 22.7 33.6 43.6 100
7 to 18 (N = 120) 21.7 40.8 37.5 100
Male
1 to 2 (N = 64) 68.8 25.0 6.3 100
2 to 3 (N = 58) 25.9 58.6 15.5 100
3 to 7 (N = 108) 16.7 53.7 29.6 100
7 to 18 (N = 135) 26.7 37.0 36.3 100
p=.0037
Figure 2.9: Permanence by Interaction of Gender and Prior Years in Foster Care, for Youth Who Achieved Permanence
0%
10%
20%
30%
40%
50%
60%
70%
80%
90%
100%
1 to 2 2 to 3 3 to 7 7 to 18 1 to 2 2 to 3 3 to 7 7 to 18
Female Male
Gender and prior years in foster care
Per
cen
t o
f ch
ild
ren
exit
ing c
are
(N
=730)
Adoption
Subsidized guardianship Reunification
Exit status

27
The interaction of gender and age when eligible for the waiver was significant. As shown
in Table 2.10 and Figure 2.10, the relative distribution among adoption, subsidized guardianship,
and reunification differs between males and females for 16- and 17-year-olds.
Table 2.10: Permanence by Interaction of Gender and Age When Eligible, for Youth
Who Achieved Permanence
Gender
Age at
Assignment
Reunification
%
Subsidized
Guardianship
%
Adoption
%
Total
%
Female
14 (N= 96) 25.5 40.8 33.7 100
15 (N=90) 27.8 32.2 40.0 100
16 (N=53) 28.3 45.3 26.4 100
17 (N=26) 42.3 42.3 15.4 100
Male
14 (N=216) 27.3 44.0 28.7 100
15 (N=84) 25.0 52.4 22.6 100
16 (N=43) 58.1 30.2 11.6 100
17 (N=22) 36.4 27.3 36.4 100
p=.0229
Figure 2.10: Permanence by Interaction of Gender and Age When Eligible, for
Youth Who Achieved Permanence
0%
10%
20%
30%
40%
50%
60%
70%
80%
90%
100%
14 15 16 17 14 15 16 17
Female Male
Gender and age at assignment
Per
cen
t o
f ch
ild
ren
exit
ing c
are
(N
=730)
Adoption
Subsidized guardianship Reunification
Exit status

28
The date of assignment to the Older Wards Waiver was a highly significant predictor of
the exit type. As shown in Table 2.11 and Figure 2.11, adoption was more likely and
reunification was less likely among those who were assigned earlier compared to those assigned
later. This may reflect the time required to explore and implement the various options.
Table 2.11: Permanence by Date of Assignment to the Older Wards Waiver, for
Youth Who Achieved Permanence
Assignment Date
Reunification
%
Subsidized
Guardianship
%
Adoption
%
Total
%
June 28, 2005 (N=97) 21.6 38.1 40.2 100
July 05 through June 06 (N=319) 22.9 43.3 33.9 100
July 06 through June 07 (N=225) 33.8 45.8 20.4 100
July 07 through Sept. 08 (N=89) 49.4 27.0 23.6 100
p<.0001
Figure 2.11: Permanence by Date of Assignment to the Older Wards Waiver, for
Youth Who Achieved Permanence
0%
10%
20%
30%
40%
50%
60%
70%
80%
90%
100%
June 28, 2005 July 05 through June
06
July 06 through June
07
July07 through Sept 08
Date of assignment to the OWW waiver
Per
cen
t o
f ch
ild
ren
exit
ing c
are
(N
=730)
Adoption
Subsidized guardianship Reunification
Exit status

29
In other descriptive analyses of the 730 youth who achieved permanence, demonstration-
control differences were not statistically significant for the following: length of time in care after
assignment to the waiver (mean = 0.75 years), age at assignment to the waiver (mean = 15.1
years), age at achieving permanence (mean = 15.8 years), years in care prior to assignment to the
waiver (mean = 5.9 years), whether with relative or nonrelative caregiver (43.3% with relatives
and 56.7% with nonrelatives), and gender (50% of each). There was a slightly significant
difference in youth’s race, as shown in Table 2.12, with more white youth in the demonstration
group and more black and other youth in the control group. Since youth’s race distribution for
demonstration and control groups was not significantly different at the time of random
assignment to the waiver, it is not clear why it is different after achieving permanence; with such
a marginally significant p value, it could be due to chance.
Table 2.12: Race by Assignment Group, for Youth Who Achieved
Permanence
Assignment
Group
Youth’s Race
%
Black White Other Total
Demonstration 50.3 41.9 7.8 100
Control 55.9 33.5 10.6 100
p=.04
2.1.4 Placement Restrictiveness
The next measure of permanence that we address is the restrictiveness of living
arrangements.13
Over a child’s history in the foster care system, he or she can be in many
different living arrangements with varying levels of restrictiveness, some for only brief periods
of time. This issue is important both because restrictive placements are more expensive and
because children who experience more time in restrictive placements (which can indicate more
difficult behavior and a higher level of service needs) might be less likely to achieve permanence
through reunification, adoption, or subsidized guardianship. And usually a restrictive placement
is assumed to be temporary, and the child would move into a different living arrangement as
soon as the purpose of the restrictive placement is achieved—thus requiring yet another move for
the child.
13
More restrictive living arrangements include placements in institutions and group homes; less restrictive
placements are in foster care (either relative or nonrelative).

30
Hypothesis: Youth in the demonstration group will experience fewer and less restrictive
placements than youth in the control group.
Might eligibility for enhanced transition services help maintain less restrictive placements
in foster and relative homes and lead to fewer restrictive placements such as in institutions or
group homes? The lack of significant demonstration-control differences shows that the waiver
did not have an impact on restrictiveness of placements.
The following analysis is based on the total time that youth in the demonstration and
control groups spent in living arrangements with different levels of restrictiveness.14
We show
both more and less restrictive placements to provide a full picture of the youth’s living
arrangements throughout the waiver period to date. Note that eligibility for the waiver required
that a youth had been in a foster or relative home for at least 1 year, so youth in other types of
placements would not have been eligible. That requirement likely influenced the findings by
increasing the overall amount of time that youth in the waiver spent in a foster or relative home.
Figure 2.12 shows, for the three study regions, the total time (across all eligible youth) in
each type of living arrangement as a percentage of the total time in foster care between
assignment to the waiver and either permanence or September 30, 2008. Across the living
arrangements (including the most restrictive placements—institutions and group homes), the
percentages were quite similar for each assignment group; differences were not statistically
significant. For both groups, far more time had been spent in less restrictive arrangements (foster
and relative homes) than in the most restrictive arrangements. Thus youth in the demonstration
group do not have significantly less restrictive or more restrictive placements than youth in the
control group. If we had found significant differences in the living arrangements, we would have
investigated the restrictiveness of those arrangements; since there were no significant
differences, there is no reason to analyze these patterns further at this time.
14
For this analysis, several types of foster home (typecode = FHA, FHB, FHP, FHS, or FHI), institutional
arrangements (typecode = ICF, IDC, IMH, IOP, IPA, IRS, HHF, or NCF), runaway categories (typecode = RNY,
WCC, WUK, UAP, or UAH), transitional placements (typecode = YIC, CUS, ILO, or TLP), and other living
arrangements (typecode = ASD, DEC, OTH, PND, UNK, JTP, CIL, ABD, YES, or MIS) were combined to create
a smaller number of categories.

31
Figure 2.12: Total Time in Each Living Arrangement in Study Regions
After Assignment to the Waiver and Before Permanence or
September 30, 2008
Figure 2.13 presents the same analysis for youth statewide.15
Again, the percentages in
this figure are quite similar for the assignment groups.
15
There are some caveats with the state data that did not apply to the study-region data. Across the state, youth were
occasionally placed in a permanent placement, but the case was not closed until months later. Also youth
occasionally had a living arrangement in the home of a parent before the placement type categorization was
changed. Time in a living arrangement with a code of HMP, HAP, or SGH is not included in the figure; none of
the youth in the study regions, presented in the previous figure, had those living arrangements.
0%
10%
20%
30%
40%
50%
60%
70%
80%
90%
100%
Control Demonstration
Other Unauthorized
Transitional Institution Relative home
Foster home

32
Figure 2.13: Total Time in Each Living Arrangement Statewide After
Assignment to the Waiver and Before Permanence or
September 30, 2008
Table 2.13 shows the percentage of eligible youth in the study regions that ever spent
time in each of the different living arrangements during the time period beginning at assignment
to the waiver through either permanence or September 30, 2008. As with the time in different
living arrangements, the differences between the demonstration and control groups were small
and not statistically significant. The percentages in Table 2.13 and 2.14 (youth statewide) do not
add to 100 percent since children can have several different living arrangements over time.
0%
10%
20%
30%
40%
50%
60%
70%
80%
90%
100%
Control Demonstration
Other Unauthorized
Transitional Institution Relative home
Foster home

33
Table 2.13: Percentage of Youth in Study Regions Who Ever Spent Time in
Living Arrangements After Assignment to the Waiver and Before
September 30, 2008
Ever Spent Time In:
Demonstration
Group
(N=350)
%
Control
Group
(N=358)
%
Overall
(N=708)
%
Chi-square
p-value
Foster home 73.0 74.9 74.0 0.52
Relative home 40.0 35.6 37.8 0.15
Institution 18.7 17.0 17.9 0.48
Other 9.1 9.0 9.0 0.99
Transitional living/college 16.3 15.9 16.1 0.87
Unauthorized place 17.5 19.1 18.3 0.52
Table 2.14 shows the same analysis for youth statewide. Again, the differences between
the demonstration and control groups were small and not statistically significant.
Table 2.14: Percentage of Youth Statewide Who Ever Spent Time in Living
Arrangements After Assignment to the Waiver and Before
September 30, 2008
Ever Spent Time In:
Demonstration
Group
(N=932)
%
Control
Group
(N=925)
%
Overall
(N=1,857)
%
Chi-square
p-value
Foster home 68.3 66.8 67.6 0.48
Relative home 44.0 44.3 44.2 0.89
Institution 14.8 13.2 14.0 0.31
Other 8.9 8.8 8.8 0.90
Transitional living/college 15.4 15.1 15.3 0.87
Unauthorized place 13.7 14.5 14.1 0.57
2.2 Safety
The concern about youth’s safety arises because when children are adopted or enter
subsidized guardianship, the state withdraws administrative oversight. This might lead to some
children being placed at greater risk of maltreatment by their guardians or adoptive parents
(increasing the incidence of abuse and neglect) or greater vulnerability to more maltreatment by
abusive or neglectful biological parents (increasing the recurrence of abuse and neglect). The
34
concern under the Subsidized Guardianship Waiver was that subsidized guardianship might lead
to higher rates of maltreatment among children in the demonstration group because of the
withdrawal of administrative oversight.16
This hypothesis has been carried over into the Older
Wards Waiver to make sure that the waiver did not lead to greater risk of maltreatment.
Hypothesis: Youth in the demonstration group will have a lower incidence and recurrence of
abuse and neglect than youth in the control group.
Did the waiver increase or reduce the risk of subsequent maltreatment for any youth? We
did not find any evidence that it did. Examining CPS allegation findings after assignment to the
waiver and before permanence up to September 30, 2008, showed very few indicated allegations
and no significant demonstration-control differences. Among the youth in the waiver study
regions, only 1.8 percent experienced indicated allegations prior to permanence, and the
proportion among youth in the waiver statewide was 2.1 percent (data not shown in a table). The
analysis showed that assignment to the waiver did not lead to youth in the demonstration group
experiencing more or less abuse and neglect than youth in the control group.
Next, we examined allegations for the youth who did achieve permanence before the end
of the study or before age 18. The purpose was to assess whether there were differences in
subsequent maltreatment depending on the type of permanence.17
Tables 2.15-2.18 below show
the number of children in the study regions and statewide associated with allegations and with
indicated allegations. Logistic regression was used to assess the significance of differences by
permanence option, waiver assignment, and the interaction of permanence option and
assignment. Table 2.15 shows the number and percentage of children in the study regions
associated with allegations (whether or not they were indicated). Differences by assignment
(demonstration-control) were not significant. However, differences by permanency exit were
significant, with a higher proportion of youth who were reunified being associated with an abuse
or neglect allegation. Table 2.16 presents the same findings for youth statewide.
16
The evaluation of the Subsidized Guardianship Waiver did not find a higher rate of maltreatment among children
who were adopted or went into subsidized guardianship. In fact, it found that safety risks were higher for children
who remained in foster care or were reunified with their birth parents.
17 For children who were adopted, we looked for allegations linked to both the DCFS child ID before adoption and
the child ID after adoption (the adoption ID). The adoption IDs came from a file provided by DCFS that linked
the DCFS child ID from before adoption to the DCFS child ID after adoption. Since the adoption IDs linked with
only 148 of the 214 children who were adopted statewide, the number of allegations may be underestimated.

35
Table 2.15: Youth in the Study Regions with Abuse and Neglect Allegations, by
Permanency Exit and Waiver Assignment
Permanency
Exit
Demonstration Control All
N
Percent with
an allegation N
Percent with
an allegation N
Percent with
an allegation
Reunification 40 2 49 22 89 22
Subsidized
guardianship 66 8 47 11 113 9
Adoption 37 3 47 4 84 4
All 143 10 143 13 286 12
Differences by permanency exit are significant (p<.0012).
Table 2.16: Youth Statewide with Abuse and Neglect Allegations, by Permanency Exit
and Waiver Assignment
Permanency
Exit
Demonstration Control All
N
Percent with
an allegation N
Percent with
an allegation N
Percent with
an allegation
Reunification 94 16 120 23 214 20
Subsidized
guardianship 168 5 134 8 302 7
Adoption 110 2 104 3 214 2
All 372 7 358 12 730 9
Differences by permanency exit are significant (p<.0001).
Tables 2.17 and 2.18 show the number of youth in the study regions and statewide
associated with allegations that were found to be indicated. The number of cases with indicated
abuse and neglect was very small, 1 among 286 youth in the study regions and 8 among 730
youth statewide. Significance testing was not possible due to the number of zeros in table cells.
Table 2.17: Youth in the Study Regions with Indicated Allegations, by
Permanency Exit and Waiver Assignment*
Permanency
Exit
Demonstration Control All
N
Percent with
an indicated
allegation N
Percent with
an indicated
allegation N
Percent with
an indicated
allegation
Reunification 40 3 49 2 89 2
Subsidized
guardianship 66 0 47 0 113 0
Adoption 37 0 47 0 84 0
All 143 1 143 1 286 1
*Significance could not be determined due to the number of zeroes.

36
Table 2.18: Youth Statewide with Indicated Allegations, by Permanency
Exit and Waiver Assignment*
Permanency
Exit
Demonstration Control All
N
Percent with
an indicated
allegation N
Percent with
an indicated
allegation N
Percent with
an indicated
allegation
Reunification 94 4 120 3 214 3
Subsidized
guardianship 168 1 134 0 302 0
Adoption 110 0 104 0 214 0
All 372 1 358 1 730 1
*Significance could not be determined due to the number of zeroes.
2.3 Well-Being
Hypothesis: Youth in the demonstration group will register better health and education status
than youth in the control group.
Did eligibility for enhanced transition services affect youth’s health status and
educational experiences, critical indicators of their well-being? Information about youth’s health
status is not available in the DCFS administrative data, although some limited information about
education is available.18
In this section, we summarize that information. The detailed tables are
presented in Appendix D. None of the demonstration-control differences were statistically
significant, so eligibility for enhanced services did not appear to affect youth’s educational
experiences, at least as measured by the administrative data.
Two variables in the administrative data relate to success in school: school status and
number of years of education completed. Both variables have relatively high rates of missing,
unknown, and not applicable values, and so their usefulness is very limited, and they should be
used cautiously.
Overall, more than 75 percent of the youth were attending school or had completed
high school—but nearly 23 percent of the youth were missing information on school
status.
18
The youth interviews asked about both health status and educational experiences. See Chapter 3.

37
Among youth age 18 and older in the study regions, 62 percent were still attending
school and 9 percent had completed school; comparable proportions statewide were
62 percent and 8 percent (but more than a quarter of the youth were missing the
information).
Youth age 18 and older with nonmissing data had completed 11 years of school, on
average, both in the study regions and statewide. Over 20 percent of the youth were
missing the information.


39
3. Youth and Caregiver Characteristics
This chapter discusses the characteristics of the youth and caregiver, primarily at the time
of the latest interview. The purposes of examining youth and caregiver characteristics are both to
gain a picture of the population being analyzed and to ensure that there were no systematic
underlying differences between the demonstration and control groups and, thus, randomization
was successful in producing statistically equivalent groups.
Latest Interview Dataset. As described in Section 1.2, the evaluation design called for an
initial and a follow-up interview. However, a number of the youth and caregivers had only one
interview because the initial interview occurred after permanence had been achieved, the youth
turned 18 before or shortly after the initial interview, or the youth had been reunified after the
initial interview. In these cases, the initial interview was the only interview conducted (note that
the same instrument was used for both interviews). In a few other cases, the caregiver refused the
follow-up interview. There were no significant differences in response rates between
demonstration and control groups.19
Given the number of cases for which only one interview was
obtained, a dataset was constructed of the ―latest‖ interview for the caregiver or youth, whether it
was close to time of assignment or at the end of the data collection period. These datasets for the
caregiver and youth provide the most current interview information available regarding the
youth’s characteristics, well-being, and permanency decisionmaking.
The latest youth interview dataset contains 678 records, 245 from cases with only one
youth interview and 433 from cases where there are two interviews, where only the latest
interview is included. It is important to note that youth who were reunified after their initial
interview were only interviewed once, as the instrument was focused on decisionmaking about
permanency options other than reunification. For these youth, their latest interview occurred
while they were still in foster care and reflected their permanency decisionmaking at that time.
Youth were interviewed for a second time when they achieved permanence through adoption or
subsidized guardianship, exited care through aging out, or at the end of the study in December
2008. More youth would have undoubtedly achieved permanence had the study continued until
all youth in the waiver had turned 18. The latest interview, therefore, reflects youths’ status at
one point in time and is not necessarily their final permanency status. The latest interview dataset
for the caregivers contains 749 records; there are more caregiver than youth records because
youth were excluded from an interview if they were too severely disabled to participate or if they
19
Additional information on survey response can be found in Appendix C.

40
had moved too far from the study area to be interviewed in person. Caregivers could be
interviewed over the telephone, but this was not an appropriate method of data collection for the
youth interview.
3.1 Youth Characteristics
Table 3.1 shows the age of the youth at the time of the latest interview. While there was
no significant difference between the demonstration and control groups in the mean age of the
youth at the time of the latest interview (16.4 years for the demonstration group and 16.3 years
for the control group), the youth in the control group had a larger proportion of youth who were
age 14 (16.2%) than did the demonstration group (8.8%). The demonstration group had a larger
proportion of youth who were age 15 (22.7%) than did the control group (16.5%). However, the
percentage of youth in other age categories was very similar between the demonstration and
control groups.
Table 3.1: Age of Youth Interviewed (latest interview)
Age at Interview
Demonstration
Group
(N=332)
Control
Group
(N=346)
Overall
(N=678)
Average (p=.497) 16.4 years 16.3 years 16.3 years
Age (p=.026): % % %
14 8.8 16.2 12.6
15 22.7 16.5 19.5
16 19.0 17.7 18.3
17 23.8 22.9 23.3
18 or 19* 25.8 26.7 26.3
Total 100 100 100
*Note: Three youth, all in the control group, were age 19.
About half the youth interview sample was male and half female (see Table 3.2). Nearly
65 percent of the youth identified themselves as African-American, and about one-quarter was
white. Eleven percent of the sample was Hispanic. There were no significant demonstration-
control differences in gender or ethnicity.

41
Table 3.2: Youth’s Gender and Race/Ethnicity (latest interview)
Characteristic Overall Percentage
Youth’s gender:
Male 49.7
Female 50.3
Total (N=678) 100
Youth’s race/ethnicity:
Hispanic 11.2
African American 64.7
White 25.7
Native American 0.6
Asian 0.2
Other race or ethnicity 0.4
(N=678) *
*Percentages do not sum to 100% as youth could identify multiple race/ethnicity categories.
As shown in Table 3.3, the large majority of youth reported that they were in excellent or
good health. About 6 percent had given birth to or fathered children. Quite a few of the youth
reported that they had friends who smoked cigarettes, drank alcohol, or used drugs to get high.
Nearly half of the youth were reported by their caregivers as having a disability, most often a
learning disability. Demonstration-control differences were not statistically significant (except in
having a learning disability, as noted below).
Table 3.3: Youth’s Health Indicators (latest interview)
Indicator
Overall Percentage
of Youth
In excellent or good health 92.8
Has given birth to or fathered any children 5.9
Friends smoke cigarettes 60.4
Friends drink alcohol 53.8
Friends use drugs to get high 46.3
Caregiver reports youth has disability 46.2
Type of disability among youth with disability:
Learning disability 57.2*
Emotional disturbance 50.0
Developmental delay 28.9
Some other disabling condition 16.0
Hearing, speech, or sight impairment 11.6 *Youth in the control group were somewhat more likely to have a learning disability than were
youth in the demonstration group: 57.6% vs. 42.4%, p=.008.

42
Ninety-one percent of the youth reported that they were currently in school, with close to
20 percent each in 9th
, 10th
, 11th
, and 12th
grade (see Table 3.4). About 3 percent of the youth in
school were enrolled in college. Four percent of the youth said they had graduated from high
school, 2 percent had dropped out, and 2 percent gave some other reason for not being enrolled
in school (data not shown in a table). There were no significant differences in school status
between the demonstration and control youth.
Table 3.4: Youth’s Grade in School (latest interview)
Current Grade in School* Percentage
7th 1.3
8th 9.9
9th 21.5
10th 22.8
11th 21.3
12th 19.8
College 3.4
Total, youth currently attending school (N=619) 100
*Youth who reported that they were not currently attending school because they were on summer
vacation were counted as being in the grade they were in before summer vacation started.
Youth were asked how far they planned to go in school, and youth’s educational plans
were identified by DCFS as a topic of particular interest. Table 3.5 shows that over three-
quarters of the youth planned to go to college, graduate from college, or get a postgraduate
degree. Demonstration-control differences approached statistical significance and are shown in
the table. Youth in the demonstration group aspired to postgraduate degrees more than did youth
in the control group, although similar proportions planned to graduate from college.
Table 3.5: Youth’s Education Plans, by Treatment Group (latest interview)
How far do you think you will
go in school?
Percentage by Treatment Group Overall
Percentage
(N=678)
Demonstration
(N=332)
Control
(N=346)
High school/GED 16.6 20.2 18.5
Vocational 5.4 3.2 4.3
Go to college 19.3 26.3 22.9
Graduate from college 46.1 42.2 44.1
Get a postgraduate degree 12.6 8.1 10.3
Total 100 100 100
p=.062

43
Table 3.6 shows that there were significant differences in youth’s educational plans
according to whether they wanted permanence with their caregiver. The significance was largely
driven by the undecided youth, who were far more likely to plan on getting a high school
diploma or GED and not going further with their education and far less likely to plan on
graduating from college.
Table 3.6: Youth’s Education Plans, by Whether Youth Wants Permanence
with Caregiver (latest interview)
How far do you think you will
go in school?
Youth Wants Permanence:
Yes
(N=157)
%
No
(N=214)
%
Undecided
(N=157)
%
High school/GED 11.5 15.0 35.7
Vocational 2.6 5.5 3.8
Go to college 26.2 21.0 22.9
Graduate from college 51.5 45.9 26.8
Get a postgraduate degree 8.3 12.6 10.8
Total 100 100 100
p<.001
3.2 Youth Well-Being
Having networks of social support likely affects youth well-being and might be related to
their interest in permanence and eventual permanency outcomes. Strong social networks can
prevent isolation and provide a range of benefits, including practical assistance such as
transportation or help with chores; sympathy or encouragement if a youth needs to discuss a
problem or celebrate an achievement; social interaction; and help in understanding feelings and
dealing with difficult situations.
To obtain an understanding of the type and quality of relationships in the youth’s lives, a
set of ―social network‖ questions were administered in the youth interview (see pp. 4-5 in the
youth interview instrument in Appendix A). Youth were asked to describe up to five people who
had been important to them in the past month. They were then asked a series of questions about
these relationships: they were asked to identify whether these people lived in their home; were
family members outside the home; were friends or neighbors; attended school, work, or support
groups with the youth; or were professionals such as teachers, counselors, or caseworkers.

44
For each person named, youth were asked questions such as whether the person would
help them out, provide emotional support, give advice, and be critical of them, whether the help
went both directions, and how close they were to the person. Based on youth’s answers to these
questions, three scales of supportiveness were developed to answer the following questions:20
Emotional support scale: Did youth have people to rely on for emotional help? This scale
is defined as having people to talk with about feelings. It took into account the youth’s closeness
to the individual and whether the individual was critical of the youth.
Concrete support scale: Did youth have people to rely on for concrete help? This scale is
defined as having people available upon whom the youth could rely for help (e.g., occasional
transportation and advice). It took into account whether help and advice went in both
directions—that is, did the youth provide concrete help as well as receive it?
Relationship support scale: Did youth have people with whom they had close
relationships? This scale was the number of people with whom the youth had an intense
relationship. In order for a person to be classified as having an intense relationship with the
youth, he/she had to be considered ―very close‖ and have had contact at least weekly.
Youths’ scores on the support scales compared to their reported health status are
presented in Table 3.7, which shows the percentage of youth whose scores were relatively low
(few people or none), medium (moderate number of people), and high (many people) on each of
the three scales, by health status. There were no significant differences by demonstration-control
status, gender, or relative/nonrelative caregiver, and those differences are not shown. Overall,
most of the youth reported having at least moderate support on all of the scales regardless of
their health status, although youth in excellent health also tended to have high support as
measured by the support scales. On the relationship support scale, significantly more of the youth
in excellent health had high support, meaning they had several people in their lives with whom
they were close and could talk about feelings. However, more youth in fair or poor health had
medium levels of relationship support.
20
The questions and the scales followed the methodology in Westat 1991, A National Evaluation of Title IV-E
Foster Care Independent Living Programs for Youth, Phase 2 Final Report, Vol. 1. Rockville, MD: Westat.

45
Table 3.7: Youth’s Support Scale Scores, by Youth’s Health Status (latest
interview)
Range on Support Scale
Youth’s Health Status
Excellent
(N=373)
%
Good
(N=234)
%
Fair/Poor
(N=50)
%
Concrete Support Scale (having people to rely on for help): (p=.214)
Low support 16.1 24.4 25.0
Medium support 60.9 58.6 54.2
High support 23.1 17.1 20.8
Total 100 100 100
Emotional Support Scale (having people to talk with about feelings): (p=.068)
Low support (<2) 7.5 11.1 8.3
Medium support (2-3.9) 39.1 50.4 50.0
High support (4-5) 53.4 38.5 36.9
Total 100 100 100
Relationship Support Scale (having close relationships with people): (p=.001)
Low support 18.8 26.5 14.6
Medium support 38.6 47.9 60.4
High support 42.6 25.6 25.0
Total 100 100 100
Table 3.8 shows youths’ support scale scores by their permanency status (in which
―permanence‖ refers to subsidized guardianship or adoption) in the latest interview.21
On the
emotional support scale (the extent to which the youth had people with whom he/she could talk
about feelings), youth who had been adopted were significantly more likely to report high
support, and none of the youth who had been adopted or gone into guardianship reported low
support.
21
Note that although the youth and caregiver interviews usually agreed on permanency status, there were a few
discrepancies. There was one case where the youth said adoption had occurred when the youth was actually still in
foster care, 14 cases where youth said that they had gone into subsidized guardianship when they actually were
still in foster care, and one case where the youth had gone into subsidized guardianship but thought he was still in
foster care. For these cases, we used the permanency status that was reported by the caregiver and confirmed with
DCFS records.

46
Table 3.8: Youth’s Support Scale Scores, by Permanency Status (latest
interview)
Range on Support Scale
Percentage by Youth’s Permanency Status
Adoption
(N=21)
%
Subsidized
Guardianship
(N=20)
%
Foster Care*
(N=611)
%
Concrete Support Scale (having people to rely on for help): (p=.579)
Low support 19.1 30.0 20.1
Medium support 52.4 60.0 59.9
High support 28.6 13.4 20.0
Total 100 100 100
Emotional Support Scale (having people to talk with about feelings): (p=.025)
Low support 0.0 0.0 9.5
Medium support 33.3 50.0 44.4
High support 66.7 50.0 46.2
Total 100 100 100
Relationship Support Scale (having close relationships with people): (p=.254)
Low support 19.1 15.0 21.6
Medium support 23.8 45.0 44.2
High support 57.1 40.0 34.2
Total 100 100 100
*Youth who were reunified after their first interview did not receive a follow-up interview and are counted in the
―foster care‖ group.
As discussed at the beginning of Chapter 3, up to this point the tables in this chapter were
based on the latest interview dataset (which included only one interview per youth). However,
we have interview data at two points in time for a subset of 418 youth. Examining this
subpopulation at these two points in time may give us some insights into how youth changed
over time. This sample is referred to as the T1/T2 subsample. Tables 3.9 and 3.10 differ from the
other tables in this chapter in that they are based on the T1/T2 subsample (rather than the latest
interview dataset) and compare interview responses at the initial interview to those at the follow-
up interview. Tables 3.9 and 3.10 address an important indication of youth well-being: youth’s
feelings about living with his/her caregiver. We addressed the question of whether the degree to
which the youth liked living with the caregiver or felt a part of the family at the initial interview
was related to whether the youth achieved permanence at the follow-up interview. Table 3.9
shows that the more youth liked living with their caregivers at the initial interview, the less likely
they were to still be in foster care at the follow-up. These differences were statistically

47
significant. Note that there were only two youth who reported that they hardly ever or never
liked living with the caregiver at the initial interview.
Table 3.9: Whether Youth Liked Living With Caregiver at Initial Interview, by
Permanency Status at Follow-Up Interview (T1/T2 subsample)
Permanency Status at
Follow-Up Interview
Youth Liked Living with Caregiver at Initial Interview:
All the Time
(N=283)
%
Most of the
Time
(N=101)
%
Sometimes
(N=32)
%
Hardly
Ever/Never
(N=2)
%
Adoption 6.7 4.0 6.3 0.0
Subsidized guardianship 16.7 7.9 0.0 0.0
Foster care 76.6 88.1 93.7 100.0
Total 100 100 100 100
p=.001
A similar pattern is shown in Table 3.10. Youth who always felt a part of the family at
the initial interview were the most likely to have achieved permanence at the follow-up
interview. Note that there were only three youth who hardly ever or never felt a part of the
family at the initial interview.
Table 3.10: Whether Youth Felt Like Part of Family at Initial Interview, by
Permanency Status at Follow-Up Interview (T1/T2 subsample)
Permanency Status at
Follow-Up Interview
Youth Felt a Part of the Family at Initial Interview
All the time
(N=315)
Most of the
time
(N=74)
Sometimes
(N=25)
Hardly
ever/never
(N=3)
Adoption 7.0 1.4 8.1 0.0
Subsidized guardianship 15.6 6.8 4.0 0.0
Foster care 77.4 91.9 87.9 100.0
Total 100 100 100 100
p=.001
3.3 Caregiver Characteristics
Caregiver characteristics presented below are based on the latest interview, as described
at the beginning of Chapter 3. Information in this section includes general demographics
describing age, sex, race/ethnicity, and relative status, as well as family and household

48
characteristics. Key among the findings is that relative caregivers reported lower household
incomes, less home ownership, and more financial difficulties maintaining their households than
did nonrelative caregivers.
Table 3.11 summarizes a variety of caregivers’ characteristics. Overall, 80 percent of
caregivers reported that they were the youth’s foster parents, with 20 percent having achieved
permanence with youth either through subsidized guardianship (12.7%) or adoption (7.3%). This
represents a more than doubling in the overall proportion of caregivers achieving permanence
since the initial interviews reported in the Interim Report #2, when only 9.3 percent were legal
guardians or adoptive parents of the youth. Demonstration-control differences were not
significant.
Table 3.11: Characteristics of the Caregivers (latest interview)
Caregiver Characteristics Percent
Type of caregiver
Adoptive parent 7.3
Legal guardian 12.7
Foster parent 80.0
Total (N=749) 100
Caregiver gender
Female 88.0
Male 12.0
Total (N=749) 100
Average age of caregiver (N=749) 50.2
Relative or nonrelative caregiver
Nonrelative 67.7
Relative 32.3
Total (N=741) 100
Relative relationship to youth
Aunt/Uncle 15.0
Grandparent 10.3
Sibling 3.4
Other relative 3.6
Nonrelative 67.7
Total (N=741) 100
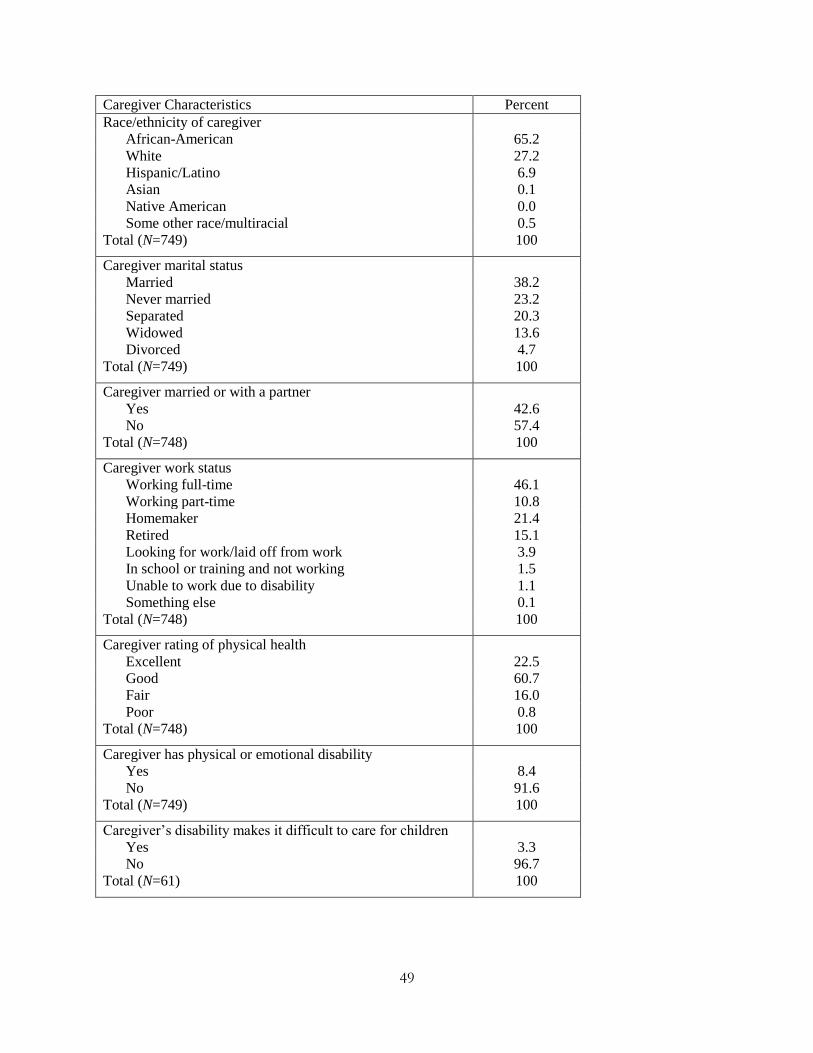
49
Caregiver Characteristics Percent
Race/ethnicity of caregiver
African-American 65.2
White 27.2
Hispanic/Latino 6.9
Asian 0.1
Native American 0.0
Some other race/multiracial 0.5
Total (N=749) 100
Caregiver marital status
Married 38.2
Never married 23.2
Separated 20.3
Widowed 13.6
Divorced 4.7
Total (N=749) 100
Caregiver married or with a partner
Yes 42.6
No 57.4
Total (N=748) 100
Caregiver work status
Working full-time 46.1
Working part-time 10.8
Homemaker 21.4
Retired 15.1
Looking for work/laid off from work 3.9
In school or training and not working 1.5
Unable to work due to disability 1.1
Something else 0.1
Total (N=748) 100
Caregiver rating of physical health
Excellent 22.5
Good 60.7
Fair 16.0
Poor 0.8
Total (N=748) 100
Caregiver has physical or emotional disability
Yes 8.4
No 91.6
Total (N=749) 100
Caregiver’s disability makes it difficult to care for children
Yes 3.3
No 96.7
Total (N=61) 100

50
As shown in Table 3.11, the caregiver population was primarily female, with the average
caregiver age being 50.2 years old. About one-third of the caregivers were relatives. The relative
caregivers were most frequently aunts/uncles (15.0%) followed by grandparents (10.3%). Nearly
two-thirds of caregivers were African-American, 27.2 percent white, and 6.9 percent
Hispanic/Latino. Caregivers were asked about their marital status; 42.6 percent were married or
lived with a partner in the home (38.2% reported they were married). The majority of caregivers
worked either full-time or part-time (56.9%), while 21.4 percent were homemakers, 15.1 percent
were retired, and 1.1 percent were unable to work due to disability. Most caregivers reported
they were in good or excellent health. Less than 9 percent reported a physical or emotional
disability, and a very small proportion of caregivers with a disability said their condition made it
difficult to care for the children in their home. There were no statistically significant differences
between demonstration group and control group caregivers on any of these characteristics.
Table 3.12 presents caregivers’ financial and household characteristics, including
household size, household income, home ownership, and financial indicators. Information on
household size shows that very few of caregivers’ households consisted of only the caregiver and
youth (only 6.7%). Most households had at least three persons, and nearly one-third included
siblings of the youth. There were no statistically significant differences between demonstration
group and control group caregivers on any of these characteristics.
Table 3.12: Caregivers’ Household Characteristics and Financial
Indicators (latest interview)
Characteristic Percentage
Household size
Two-person household 6.7
Three-person household 18.4
Four-person household 22.7
Five-person household 20.7
Six-person household 15.8
Seven or more persons in the household 15.7
Total (N=749) 100
Youth’s sibling lives in household
Yes 30.8
No 69.2
Total (N=749) 100

51
Characteristic Percentage
Total annual household income from the previous calendar
year
Less than $20,000 24.1
$20,000 – $39,999 40.5
$40,000 - $59,999 24.8
$60,000 or more 10.7
Total (N=749) 100
Caregiver owns or rents residence
Owns residence 73.6
Rents residence 26.4
Total (N=749) 100
Caregiver had enough money to maintain household in the
last 30 days (N=747) 88.5
Caregiver had difficulty paying the electric or heating bills in
the last 30 days (N=746) 13.0
Caregiver had difficulty paying the rent or mortgage in the
last 30 days (N=748) 8.7
Caregiver had difficulty buying enough food for your family
in the last 30 days (N=746) 2.5
Table 3.12 also shows that 24.1 percent of households had an income of less than
$20,000.22
Despite nearly a quarter reporting such low incomes, few caregivers reported
financial difficulties in paying their mortgage or rent, utilities, or buying food for their families.
About three-quarters of caregivers reported owning their own home, and a high percentage
(88.5%) said they had enough money to maintain their households in the past 30 days. No
significant differences were found between the demonstration and control groups.
Examining these same financial indicators separately for relative and nonrelative
caregivers reveals some significant differences. Table 3.13 shows that nonrelative households
tended to be more financially secure. Relative households were significantly more likely to
report lower household incomes, rent their residences rather than own, and report financial
difficulties in maintaining their households and paying essential bills. Note that we found several
statistically significant relative/nonrelative differences in the decisionmaking processes,
described in Chapter 4; although this study was not designed to assess the extent or impact of the
differences between families where the caregiver and youth were related and families in which
they were not related, we explore some of those differences in more detail in Appendix E.
22
The 2008 poverty threshold was $21,200 for a four-person household. Source:
http://aspe.hhs.gov/poverty/08fedreg.htm.

52
Table 3.13: Financial Indicators by Relative and Nonrelative Caregivers (latest
interview)
Financial Indicator
Percentage by Relative Status
Relative Nonrelative
Annual household income (p<.001)
Less than $20,000 38.1 17.3
$20,000 – $39,999 36.3 42.5
$40,000 - $59,999 18.1 28.0
$60,000 or more 7.5 12.2
Total 100
(N=226)
100
(N=468)
Very low income (p<.001)
Income below $20,000 38.1 17.3
Income above $20,000 61.9 82.7
Total 100 100
(N=226) (N=468)
Caregiver owns or rents residence (p<.001)
Owns residence 56.9 81.1
Rents residence 43.1 18.9
Total 100
(N=239)
100
(N=502)
Enough money to maintain household in the past
30 days (p=.006)
Yes 83.3 90.8
No 16.7 9.2
Total 100
(N=239 )
100
(N=500)
Difficulty paying the rent or mortgage in the last
30 days (p=.001) 14.6 6.0
(Number of caregivers) (N=239) (N=501)
Difficulty paying the electric or heating bills in the
last 30 days (p=.001) 20.1 9.8
(Number of caregivers) (N=239) (N=499)
Difficulty buying enough food for your family in
the last 30 days (p=.002) 5.9 1.0
(Number of caregivers) (N=239) (N=499)

53
4. Youth’s Decisionmaking Process
The purpose of the waiver was to determine whether eligibility for enhanced transition
services for youth who were adopted or went into subsidized guardianship resulted in increased
permanence. Chapter 2 presented outcome findings based on DCFS data, which showed no
significant differences overall between the demonstration and control groups in the percentage of
youth who had been adopted, had gone into subsidized guardianship, were reunified, had exited
care without permanence, or were still in care (Tables 2.1 and 2.2). Investigating youth’s
decisionmaking process can help understand these findings, although we must keep in mind the
cautionary note at the beginning of Chapter 2 about the inconsistent implementation of the
waiver and the confusion among agency and court staff about the meaning of assignment to
demonstration or control group.
Chapter 4 uses data from the youth interviews to examine youth’s decisionmaking
process as they and their caregivers considered whether to move to permanence or remain in
foster care. Most of our analyses of the decisionmaking process are based on data from the latest
youth interview dataset, as was described at the beginning of Chapter 3. In the interview, youth
were asked about the permanency options of adoption or subsidized guardianship; no other
permanency options were discussed. Therefore, ―permanence‖ in this chapter refers only to
adoption and subsidized guardianship. We first examine the effect of the availability of enhanced
transition services on the decisionmaking of youth in the demonstration group. Then we look at
the decisionmaking of all youth, and finally, we look at changes in decisionmaking over time for
youth with two interviews.
We found that many teens in foster care were interested in obtaining permanence,
particularly those younger than age 16. However, more than 40 percent of youth said that their
caseworker had not talked to them about adoption or subsidized guardianship. Youth who were
aware of the enhanced services were more likely to want permanence. However, only about 60
percent of youth in the demonstration group said that their caseworker had told them about the
enhanced services, and caseworkers were more likely to tell older youth about enhanced services
rather than younger youth. As youth get older, their interest in permanence tends to wane
because they become more focused on living on their own, and permanence seems more
improbable.

54
4.1 Awareness of Enhanced Services Among Youth in the Demonstration
Group
All of the youth in the demonstration group were eligible to receive enhanced transition
services if they exited care through adoption or subsidized guardianship. However, the
availability of these services could affect youth’s and caregiver’s decisionmaking only if they
were aware that the waiver had made these services available. Youth in the demonstration group
who had not already achieved permanence at the time of the latest interview were asked whether
their caseworker had told them that they were eligible for enhanced transition services if their
caregiver became their legal guardian or adoptive parent. We found that awareness of the
services was significantly related to these youth’s interest in and decision to choose subsidized
guardianship, though it was not related to adoption. Awareness of the enhanced services was not
significantly related to the achievement of permanence by the time of the latest interview.
Table 4.1 shows that a little more than half (57.5%) of the youth in the demonstration
group said that they had been told about the availability of enhanced transition services after
permanence. Note that Tables 4.1 through 4.6 include only youth in the demonstration group, as
youth in the control group were not eligible for the enhanced services and were not asked
questions about them.
Table 4.1: Whether Caseworker Told Youth About Enhanced Services, for
Demonstration Youth in Care (latest interview)
Youth Reported That Caseworker Told of
Enhanced Services:
Percentage of Demonstration Group
in Care
(N=242)
Only regarding adoption 1.6
Only regarding guardianship 13.7
Regarding both adoption and guardianship 42.2
Regarding neither adoption nor guardianship 42.5
Total, demonstration group in care 100
Older youth in care were significantly more likely than younger youth to report that they
had been told about the availability of the enhanced services (see Table 4.2). More than half of
youth ages 14-15 did not know about the availability of the services, compared to 38.3 percent of
youth ages 16 and older. Caseworkers might have felt that the services were less relevant to

55
younger youth who still had several years before they would qualify for them. Whether the youth
had contact with a biological parent and whether the caregiver was a relative were not related to
whether the caseworker had told the youth about the services.
Table 4.2: Whether Caseworker Told Youth about Enhanced Services by
Youth Age, for Demonstration Youth in Care (latest interview)
Youth Reported That Caseworker
Told of Enhanced Services:
Youth Age
14-15
(N=65)
%
16-19
(N=177)
%
Only regarding adoption. 4.6 0.5
Only regarding guardianship. 9.2 15.3
Regarding both adoption and guardianship. 32.3 45.8
Regarding neither adoption nor guardianship. 53.8 38.3
Total, demonstration group in care 100 100
p=.050
Awareness of Enhanced Services and Interest in Permanence. There was a significant
relationship between knowing about the enhanced services and wanting permanence.23
Nearly 40
percent of demonstration youth who knew about the availability of the enhanced services said
that they wanted permanence, while only 18.6 percent of youth who did not know about the
services wanted permanence (see Table 4.3).
Table 4.3: Interest in Permanence by Awareness of Enhanced Services, for
Demonstration Youth in Care (latest interview)
Youth Wanted
Permanence
Awareness of Enhanced Services
Overall
(N=247)
%
Youth Was Aware
(N=139)
%
Youth Was Not Aware
(N=108)
%
Yes 39.6 18.6 30.4
No 31.6 53.5 41.2
Not sure/don’t know 28.8 27.9 28.4
Total, demonstration
group in care 100 100 100
p<.001
23
Youth’s interest in permanence was measured by asking if they wanted to be adopted or go into guardianship with
their current caregiver.

56
It is possible that caseworkers told youth about the availability of enhanced services only
if they thought that the youth was a good candidate for adoption or subsidized guardianship, and
this is the reason for the pattern shown in Table 4.3. However, it is also possible that awareness
of the services influenced youth’s decisionmaking, as was the intent of the waiver. To investigate
whether awareness of the services might have influenced youth’s permanency choices, we
examine the decisionmaking of those demonstration youth who did achieve permanence by the
time of the latest interview.
Awareness of Enhanced Services and Achievement of Permanence. Youth in the
demonstration group who had been adopted or gone into subsidized guardianship were asked
whether they were told about the availability of enhanced services before being adopted or going
into subsidized guardianship. Of the 42 youth who had gone into subsidized guardianship at the
time of the latest interview, more than half (59.5%) said that the caseworker had told them about
the services; 23.8 percent said that their caseworker had not told them; and 16.7 percent did not
know whether the caseworker had told them or did not answer the question (data not presented in
a table). For the 20 youth who had been adopted at the time of the latest interview, half said that
their caseworkers had told them about the enhanced services, while 45.2 percent said they had
not, and 4.8 percent were unsure or did not answer the question.
While the number of youth in the demonstration group who had achieved permanence
and knew about the enhanced services was very small (only 35 cases), youth who had been
adopted and had heard about the enhanced services (N=10) said that knowledge of these services
played either no role or a small role in their decision to be adopted (see Table 4.4). In contrast,
about half of the 25 youth (48%) who had achieved subsidized guardianship and said that they
knew about the services reported that the availability of these services had a great deal of
influence on their permanence decision, as illustrated in Table 4.4.

57
Table 4.4: Influence of Awareness of Enhanced Services on Youth’s Permanency
Decision, for Demonstration Youth in Permanence (latest interview)
Influence of Awareness of Enhanced
Services on Youth’s Permanency
Decision
Youth Who Were
Adopted
(N=10)
%
Youth Who Were in
Subsidized Guardianship
(N=25)
%
A great deal 0 48.0
Somewhat 20.1 8.0
Not at all 79.9 36.0
Don’t know 0 8.0
Total, demonstration youth who
were aware of services and achieved
permanence
100 100
p=.013
These results suggest that awareness of the enhanced services might have influenced the
decision to go into subsidized guardianship. However, the number of demonstration youth who
had achieved permanence at the time of the latest interview through adoption or subsidized
guardianship is very small. Therefore, it is instructive to look at the influence of the availability
of enhanced services on the decisionmaking processes of all demonstration youth to answer the
question: Did awareness of the enhanced services influence permanency decisionmaking?
Awareness of Enhanced Services and Permanency Decisionmaking. We combined the
responses of youth who either had gone into adoption or subsidized guardianship with the youth
still in care. Awareness of the services did not appear to be related to choosing adoption, but did
appear to be related to choosing subsidized guardianship over remaining in foster care. As shown
in Table 4.5, about a third (32.5%) of youth who were aware of the enhanced services said that
they chose subsidized guardianship, while just 18.5 percent of youth who did not know about the
services chose subsidized guardianship. Just 20.4 percent of youth who were aware of the
services said that they had decided against both adoption and guardianship, while 31.4 percent of
those who did not know about the services had decided against these types of permanent
relationships.

58
Table 4.5: Awareness of Enhanced Services by Demonstration Youth’s Permanency
Decision (latest interview)
Youth’s Permanency Decision
Awareness of Enhanced Services
Overall
(N=312)
%
Youth Was Aware
(N=176)
%
Youth Was Not Aware
(N=136)
%
Adoption 10.8 8.9 10.0
Subsidized guardianship 32.5 18.5 26.4
Neither adoption nor guardianship 20.4 31.4 25.2
Undecided/unsure/don’t know 36.3 41.2 38.4
Total, demonstration group 100 100 100
p=.015
Although awareness of the enhanced services was related to permanency decision, it was
not related to permanency status (see Table 4.6). It is important to note that the permanency
process takes time, and since varying periods of time elapsed between the date that youth became
eligible for the waiver and the date that they were interviewed, some youth likely achieved
permanence after the end of the study.
Table 4.6: Awareness of Enhanced Services by Demonstration Youth’s
Permanency Status (latest interview)
Youth’s Permanency Status
Awareness of Enhanced Services
Overall
(N=312)
%
Youth Was Aware
(N=176)
%
Youth Was Not Aware
(N=136)
%
Adoption 5.8 6.6 6.1
Subsidized guardianship 14.8 8.1 11.9
Foster care or emancipated* 79.5 85.2 82.0
Total, demonstration group 100 100 100
p=.178
*Youth who were reunified after their first interview did not receive a follow-up interview and are counted in the
―foster care‖ group.
4.2 Differences in Permanency Decisionmaking by Demonstration and Control
Groups
The interview data indicated that there were no significant differences between the
demonstration and control groups in the percentage of youth still in care at the time of the latest

59
interview who had discussed adoption or subsidized guardianship with their caseworker. Overall,
58.3 percent of youth still in care at the latest interview had discussed these permanency options
with their caseworkers, as shown in Table 4.7, with more discussing subsidized guardianship
(54.8%) than adoption (44.5%). One may assume that 100 percent of the youth who had been
adopted or gone into subsidized guardianship at the time of the latest interview had discussed
these options with their caseworker. Youth’s age, whether the youth was in contact with a
biological parent, and whether the caregiver was a relative were not related to whether the youth
and caseworker discussed permanence for those youth still in care at the time of the latest
interview.
Table 4.7: Discussions of Permanence, for Youth Still in Care
(latest interview)
Youth talked with caseworker about:
Overall
%
Adoption or subsidized guardianship
Yes 58.3
No 41.7
Total, youth in care (N=527) 100
Adoption
Yes 44.5
No 55.5
Total, youth in care (N=529) 100
Subsidized guardianship
Yes 54.8
No 45.2
Total, youth in care (N=528) 100
Interest in Permanence of Youth Still in Care. About 30 percent of youth who were still
in care at the time of the latest interview said that they wanted permanence with their caregiver
(see Table 4.8). There were no significant differences between the demonstration and control
groups. More youth wanted permanence through subsidized guardianship than adoption. An
important finding is that 30 percent of youth said that they were not sure if they wanted adoption
or subsidized guardianship with their caregiver, indicating that they were at least somewhat open
to considering these permanency options.

60
Table 4.8: Interest in Permanence, for Youth Still in Care (latest
interview)
Permanency Interest
Overall
%
Youth wants adoption only. 4.4
Youth wants subsidized guardianship only. 16.3
Youth wants either adoption or subsidized guardianship. 9.1
Youth wants neither adoption nor subsidized guardianship. 40.5
Youth is not sure if wants adoption or subsidized guardianship. 29.7
Total, youth in care (N=529) 100
Youth’s age did make a difference in whether they wanted permanence with their
caregivers (see Table 4.9). Nearly half (46.9%) of youth ages 14 and 15 said that they were
interested in permanence through adoption or subsidized guardianship, while less than one-
quarter (23.0%) of older youth said that they wanted permanence. A large number of youth in
both age groups said that they were unsure if they wanted adoption or subsidized guardianship
but older youth were more definitive in saying that they did not want to be either adopted or to
go into subsidized guardianship (49.1%) than were the younger youth (18.8%).
Table 4.9: Interest in Permanence by Age, for Youth Still in Care (latest
interview)
Permanency Interest
Ages 14-15
(N=149)
%
Ages 16-19
(N=380)
%
Overall
(N=529)
%
Youth wants adoption only. 6.0 3.7 4.4
Youth wants subsidized guardianship only. 25.5 12.7 16.3
Youth wants either adoption or subsidized
guardianship. 15.4 6.6 9.1
Youth wants neither adoption nor subsidized
guardianship. 18.8 49.1 40.5
Youth is not sure if wants either adoption or
subsidized guardianship. 34.2 28.0 29.7
Total, youth in care 100 100 100
p<.001
Whether youth still had contact with one or both of their biological parents also made a
difference in the type of permanence the youth wanted, as shown in Table 4.10.24
Youth who had
contact with a biological parent were more likely to say that they did not want either adoption or
24
Contact with parent was broadly defined as whether youth ever saw or talked to their biological mother or father.

61
subsidized guardianship, while those who did not have contact were more likely to be interested
in adoption.
Table 4.10: Interest in Permanence by Contact with Biological Parent, for
Youth Still in Care (latest interview)
Permanency Interest
Youth Has
Contact with
Parent
(N=327)
%
Youth Does
Not Have
Contact with
Parent
(N=202)
%
Overall
(N=529)
%
Youth wants adoption only. 2.2 7.9 4.4
Youth wants subsidized guardianship only. 17.8 13.9 16.3
Youth wants either adoption or subsidized
guardianship. 8.3 10.3 9.1
Youth wants neither adoption nor
subsidized guardianship. 44.2 34.6 40.5
Youth is not sure if wants either adoption
or subsidized guardianship. 27.6 33.2 29.7
Total, youth in care 100 100 100
p=.007
Whether youth’s caregiver was a relative did not make a difference in their permanency
interest. However, as we discuss later in the chapter, relative status did make a difference in the
percentage of youth who achieved permanence.
Permanency Decisionmaking. The next step after wanting permanence is making a
permanence decision.25
Youth who were in permanence at the time of the latest interview had
clearly made a decision and so could be combined with youth still in care who were asked what
their permanence decision was. Again, there were no significant differences between the
demonstration and control groups in their permanence decisionmaking. About two-thirds of
youth said that they were either undecided about permanence or had decided against either
option (see Table 4.11).
25
Decisionmaking was measured by asking the youth if they and their caregiver had made a decision about adoption
or guardianship and whether the decision was for adoption, guardianship, or neither.

62
Table 4.11: Permanency Decision, for All Youth (latest interview)
Permanency Decision
Overall
(N=677)
%
Adoption 11.0
Subsidized guardianship 24.4
Neither adoption nor guardianship 25.2
Undecided/unsure/don’t know 39.4
Total 100
Youth age, whether youth had contact with a parent, and whether the caregiver was a
relative all had an impact on youth’s decisionmaking. Younger youth were more likely to say
that they had made a decision for adoption or subsidized guardianship, while older youth were
more likely to say they had decided against either option (see Table 4.12).
Table 4.12: Permanency Decision by Age, for All Youth (latest
interview)
Permanency Decision
Ages 14-15
(N=217)
%
Ages 16-19
(N=460)
%
Adoption 18.9 7.2
Subsidized guardianship 35.9 19.0
Neither adoption nor guardianship 8.3 33.2
Undecided/unsure/don’t know 36.9 40.6
Total 100 100
p<.001
As shown in Table 4.13, youth who did not have contact with a parent were more likely
to say that they and their caregivers had decided on adoption (18.0%) than were those who still
had contact (6.4%). The percentage of youth who decided on subsidized guardianship was
similar for those who did and did not have contact with a parent.

63
Table 4.13: Permanency Decision by Contact with Parent, for All Youth (latest
interview)
Permanency Decision
Youth Has
Contact With
Parent
(N=410)
%
Youth Does Not
Have Contact
With Parent
(N=267)
%
Overall
(N=677)
%
Adoption 6.4 18.0 11.0
Subsidized guardianship 25.4 22.9 24.4
Neither adoption nor guardianship 27.5 21.7 25.2
Undecided/unsure/don’t know 40.7 37.5 39.4
Total 100 100 100
p<.001
Youth whose caregiver was a relative were also more likely to choose permanence
through adoption or subsidized guardianship than youth who were living with nonrelatives (see
Table 4.14). There were several statistically significant differences between youth who were
living with relatives vs. youth who were living with nonrelatives; see Appendix E for details.
Overall, the data suggest that youth living with relatives might have had less severe needs than
youth living with nonrelatives, which could have influenced their decisionmaking process.
Families with youth who had more severe needs might have been reluctant to forego needed
services and supports that might not have been available if the youth were adopted or achieved
guardianship. However, the evaluation was not designed to answer this question definitively, so
the findings are suggestive only.
Table 4.14: Permanency Decision by Caregiver Relative Status, for All Youth
(latest interview)
Permanency Decision
Caregiver is a
Relative
(N=213)
%
Caregiver is a
Nonrelative
(N=461)
%
Overall
(N=674)
%
Adoption 13.6 9.8 11.0
Subsidized guardianship 30.1 22.0 24.4
Neither adoption nor guardianship 19.2 27.5 25.2
Undecided/unsure/don’t know 37.0 40.8 39.4
Total 100 100 100
p=.024

64
Factors Influencing Achievement of Permanence. There were no significant differences
between the demonstration and control groups in the percentage of youth who were adopted or
went into subsidized guardianship; however, youth age, contact with a biological parent, or
whether the caregiver was a relative all were related to achieving permanence. Younger youth
were more likely to be adopted or go into guardianship, while older youth were more likely to
not go into permanence (see Table 4.15).
Table 4.15: Permanency Status by Age, for All Youth (latest interview)
Permanency Status
Ages 14-15
(N=217)
%
Ages 16-19
(N=456)
%
Overall
(N=673)
%
Adoption 12.4 4.4 7.0
Subsidized Guardianship 17.5 9.7 12.2
Foster care or emancipated* 70.0 85.9 80.8
Total 100 100 100
p<.001
*Youth who were reunified after their first interview did not receive a follow-up interview and are counted in the
―foster care‖ group.
Those who did not have contact with a parent were more likely to be adopted than those
youth who did have contact (see Table 4.16).
Table 4.16: Permanency Status by Contact with Parent, for All Youth (latest interview)
Permanency Status
Youth Has
Contact With
Parent
(N=408)
%
Youth Does Not
Have Contact With
Parent
(N=265)
%
Overall
(N=673)
%
Adoption 4.4 11.0 6.9
Subsidized Guardianship 13.3 10.6 12.2
Foster care or emancipated* 82.3 78.5 80.8
Total 100 100 100
p=.007
*Youth who were reunified after their first interview did not receive a follow-up interview and are counted in the ―foster
care‖ group.
Youth who lived with relative caregivers were somewhat more likely to be adopted and
much more likely to go into subsidized guardianship than youth who were with nonrelative

65
caregivers (see Table 4.17). As noted previously, youth with nonrelatives might have had more
severe needs than youth with relatives or they might have had other differences that influenced
their decisionmaking process; see Appendix E for more information on differences between
relative and nonrelative caregiver families.
Table 4.17: Permanency Status by Caregiver Relative Status, for All Youth (latest
interview)
Permanency Status
Caregiver is a
Relative
(N=212)
%
Caregiver is a
Nonrelative
(N=459)
%
Overall
(N=671)
%
Adoption 9.4 5.9 7.0
Subsidized Guardianship 20.3 8.5 12.2
Foster care or emancipated* 70.2 85.6 80.7
Total 100 100 100
p<.001
*Youth who were reunified after their first interview did not receive a follow-up interview and are counted in the ―foster
care‖ group.
Model of Permanence. We developed a model of permanence to see what factors in part
or together are related to whether youth went into permanence, regardless of whether it was
adoption or subsidized guardianship. When permanence is measured as a bivariate variable, there
ceases to be a significant relationship between whether youth still had contact with a parent and
whether they achieved permanence. This is because youth who have contact with a parent are
much less likely to be adopted than youth who do not, but when subsidized guardianship is
included, the overall permanency rate is similar for those who have contact with parents and
those who do not. Using logistic regression, we did find that there were significant main effects
for age and caregiver relationship and for the interaction between age and caregiver relationship
in predicting whether youth went into permanence. Table 4.18 shows the significant interaction
between caregiver relationship and youth age in achieving permanence (subsidized guardianship
or adoption). There is not a statistically significant difference in permanence by age when a
youth is with a relative caregiver (35.1% of youth ages 14-15 are in permanence versus 26.5% of
youth ages 16-19), but older youth living with nonrelatives are much less likely to be in
permanence (8.5%) than are younger youth living with nonrelatives (27.5%). Age of youth
therefore makes a difference when youth are living with nonrelatives but less of a difference with
relatives.

66
Table 4.18: Permanence by Caregiver Relative Status and Youth Age, for All Youth
(latest interview)
Youth Achieved Permanence
with Caregiver
Percentage by Caregiver Relative Status and Age
Caregiver Is a Relative Caregiver Is a Nonrelative
Youth Age Youth Age
Ages14-15
(N=74)
%
Ages 16-19
(N=140)
%
Ages 14-15
(N=143)
%
Ages 16-19
(N=318)
%
Yes 35.1 26.5 27.3 8.5
No 64.9 73.5 72.7 91.5
Total 100 100 100 100
p= .015
4.3 Reasons for Choosing Permanence and Staying in Care
Reasons Why Youth Wanted Permanence. The interview included open-ended questions
that asked the youth why they did or did not want to be adopted or have their caregiver become
their legal guardian. As shown in Table 4.19, the main reason that youth wanted to be adopted
was that they had a strong bond with their caregiver (64.8%), and more than one-third (38.0%)
said that they wanted to be adopted by their caregiver because they felt it would be a more
permanent relationship. And the top reason for youth who wanted guardianship was the same as
for adoption. The majority said they wanted it because they had a strong, positive relationship
with their caregiver. Somewhat fewer youth (7.5%) said that they wanted to go into subsidized
guardianship because they felt it was more permanent than being in foster care. A number of
youth (7.4%) also said that they wanted to do subsidized guardianship because they had been
with their caregivers their whole lives.

67
Table 4.19: Youth Report of Reasons for Wanting Permanence with
Caregiver (latest interview)
Top Reasons for Wanting Permanence Percentage
Reason youth wants to be adopted by caregiver:
Youth likes/has a good relationship with caregiver. 64.8
Youth believes it would be more permanent. 38.0
Total, youth wanting adoption (N=71)
Reason youth wants caregiver to become legal guardian:
Youth likes/has a good relationship with caregiver. 70.9
Youth believes it would be more permanent. 7.5
Youth has been with caregiver most of his/her life. 7.4
Total, youth wanting guardianship (N=134)
Reasons Youth Did Not Want Permanence. Youth could state multiple reasons for not
wanting to be adopted and for not wanting to go into subsidized guardianship. Table 4.20 shows
the top five reasons youth gave for not wanting permanence with their current caregiver. The
largest percentage of youth who rejected either permanence option indicated that they felt they
were too old to be adopted or go into guardianship (43.4% of those rejecting adoption and 44.2%
of those rejecting subsidized guardianships). About one-quarter of the youth did not want to be
adopted or go into guardianship because they wanted independence—saying either they wanted
to live on their own (13.1% of youth rejecting adoption, 17.9% of youth rejecting guardianship)
or they wanted Independent Living26
(10.1% for adoption rejecters, 10.5% for guardianship
rejecters). About equal numbers of youth in the demonstration and control group said that they
did not want adoption or subsidized guardianship because they wanted to go into Independent
Living. About 14 percent of youth said that they did not want their caregiver to become their
legal guardian because they wanted to be reunified with their parents. This was not a top reason
cited by youth for not wanting adoption. Just 6 percent of youth cited a desire to return home as a
reason for not wanting to be adopted.
26
When reunification, adoption, and guardianship have been ruled out for a youth, Independence becomes the goal
for the case plan. This is not affected by the youth’s waiver assignment (demonstration or control group). The
worker then prepares the youth for Independent Living, which is a program that offers supervised living in an
apartment. According to DCFS policy, before youth can move into Independent Living, they have to demonstrate
that they have life skills such as money management and meal preparation. Youth can move into an Independent
Living program starting at age 16, and while in the program they continue to attend life skills classes. Independent
Living is available only to youth who remain in foster care and who have a permanency goal of Independence, but
the life skills classes are available to older youth with other permanency goals.

68
Table 4.20: Youth Report of Reasons for Not Wanting Permanence with
Caregiver (latest interview)
Top Reason for Not Wanting Permanence Percentage
Reason youth does not want to be adopted by caregiver:
Youth feels he/she is too old to be adopted. 43.4
Youth wants to live on own. 13.1
Youth believes adoption would disrupt family ties. 12.3
Youth wants Independent Living. 10.1
Youth and caregiver are already related. 9.2
Total, youth not wanting adoption (N=327)
Reason youth does not want caregiver to become legal guardian:
Youth feels he/she is too old to go into guardianship. 44.2
Youth wants to live on own. 17.9
Youth wants to return home to parent(s). 13.9
Youth wants Independent Living. 10.5
Youth and caregiver are already related. 7.3
Total, youth not wanting guardianship (N=230)
4.4 Movement Into Permanence Over Time
We obtained interview data at both initial and follow-up data points for a subset of 418
youth, referred to as the T1/T2 subsample. Overall, 49.6 percent of youth in the T1/T2
subsample said they wanted to be adopted or go into subsidized guardianship at the time of the
initial interview.27
But did these youth achieve permanence by the time of the follow-up
interview?
As Table 4.21 illustrates, only 30 percent of the youth who said they wanted permanence
at the time of the initial interview had achieved it by the time of the follow-up interview. This is,
however, higher than for youth who had permanence at the time of the follow-up interview and
who had said that they either were not sure or did not want permanence at the initial interview
(only about 6% of those youth had achieved permanence). There were no significant differences
between the demonstration and control groups.
27
Included in these numbers are 14 youth who said they were in subsidized guardianship at the time of the initial
interview and one who reported being adopted. However, as these youth had not actually obtained permanence at
the time of the first interview, their answers either indicate some confusion as to what subsidized guardianship
meant or a desire to move into permanence though it had not yet occurred. We include these cases among the
youth who wanted to be adopted or go into guardianship.

69
Table 4.21: Youth Permanence (T1/T2 subsample)
Youth Obtained Permanence with
Caregiver at Follow-Up Interview
Wanted
Permanence at
Initial Interview
(N=197)
%
Not Sure/Did
Not Want
Permanence at
Initial Interview
(N=201)
%
Overall
(N=398)
%
Yes, adoption 11.2 1.0 6.1
Yes, subsidized guardianship 18.8 5.4 12.1
No 70.0 93.5 81.9
Total 100 100 100
p<.001
For the youth who said that they wanted permanence at the time of the initial interview,
what factors were related to whether youth actually obtained permanence? Neither age nor
contact with biological parent was related to the attainment of permanence for those who wanted
it at the time of the initial interview. However, youth living with relatives who expressed interest
in permanence were significantly more likely to be adopted or go into subsidized guardianship
than those who lived with a nonrelated caregiver (see Table 4.22). Still, more than half of the
youth who were living with relatives and said they wanted permanence at the time of the initial
interview were still in care or had exited care without a permanent, legal relationship by the time
of the follow-up interview.
Table 4.22: Youth Who Wanted Permanence at Initial Interview and Whether
Achieved Permanence at Follow-Up Interview, by Caregiver
Relationship (T1/T2 subsample)
Youth Achieved Permanence with
Caregiver at Follow-Up Interview
Caregiver Is a
Relative
(N=75)
%
Caregiver Is a
Nonrelative
(N=121)
%
Overall
(N=196)
%
Yes, adoption 16.0 8.3 11.2
Yes, subsidized guardianship 26.7 14.1 18.9
No 57.3 77.6 69.8
Total, youth who wanted permanence
at initial interview 100 100 100
p=.026
Youth’s interest in permanence was not always the same at both interviews; 42.4 percent
of youth who said that they wanted permanence at the time of the initial interview had changed

70
their mind by the time of the follow-up interview and said they either did not want to be adopted
or go into subsidized guardianship (27.4%) or they were unsure (15.0%) (not shown in a table).
Some insight into youth’s decisionmaking processes may be gained by looking at the
reasons given by youth who said that they were interested in permanence at the time of the initial
interview but were not interested in permanence at the time of the follow-up interview. In the
majority of cases (75.3% of those not interested in adoption and 77.2% of those not interested in
subsidized guardianship), youth who indicated an interest in permanence at the time of the initial
interview said that they were too old at the time of the follow-up interview and/or they were now
more interested in living on their own or going into Independent Living. On average, these youth
who changed their mind about wanting permanence were age 15.6 at the initial interview and age
17.3 at the follow-up interview. In most cases, then, it was not something about the youth’s
living situation or relationship with their caregiver that changed; rather, with time and older age,
youth felt that the window for obtaining permanence was closing, and they set their sights on
moving into independence from foster care. In two cases, youth said that they planned to join the
military after high school and therefore felt no need to formalize their relationship with their
caregiver through subsidized guardianship.

71
5. Caregivers’ Decisionmaking Process
This chapter presents details of the permanency decisionmaking process by caregivers
and resulting permanency outcomes (i.e., subsidized guardianship and adoption). Using data
from the latest caregiver interview dataset, the chapter examines information caregivers obtained
about permanency options, decisions that caregivers made about permanence, the status of those
decisions, and the reasons why caregivers made their decisions. In the interview, caregivers were
asked about the permanency options of adoption or subsidized guardianship; no other
permanency options were discussed. Therefore, ―permanence‖ in this chapter refers only to
adoption and subsidized guardianship.
5.1 Discussions About Permanence
Caregivers were asked whether family meetings were held with their caseworker to
discuss issues regarding youth’s permanency plans. Overall, 68.2 percent of caregivers attended
a family meeting with their caseworker to discuss plans (see Table 5.1). About 66 percent of
caregivers reported that they had discussed some type of permanence (subsidized guardianship,
adoption, or both) with their caseworker in the last year, leaving nearly 35 percent of caregivers
who had not discuss any permanency options with their caseworker in the last year. Differences
between evaluation groups were not statistically significant.
Table 5.1: Caregivers’ Discussions of Permanence with Caseworker, by
Evaluation Group (latest interview)
Discussions About Permanence
Percentage by Evaluation Group
Demonstration
Group
(N=367)
%
Control
Group
(N=382)
%
Overall
(N=749)
%
Attended a family meeting to discuss permanence for youth (p=0.234):
Yes 70.3 66.2 68.2
No 29.7 33.8 31.8
Total 100 100 100
Discussion with caseworker about subsidized guardianship or adopting youth (p=0.354):
Caseworker and caregiver discussed
adoption but not subsidized guardianship. 6.8 8.6 7.7
Caseworker and caregiver discussed
subsidized guardianship but not adoption. 18.0 15.2 16.6

72
Discussions About Permanence
Percentage by Evaluation Group
Demonstration
Group
(N=367)
%
Control
Group
(N=382)
%
Overall
(N=749)
%
Caseworker and caregiver discussed both
subsidized guardianship and adoption. 43.3 39.5 41.4
Caseworker and caregiver did not discuss
adoption or subsidized guardianship. 31.9 36.6 34.3
Total 100 100 100
5.2 Decisionmaking and Permanence for Caregivers in the Demonstration
Group
Caregivers and youth in the demonstration group had to have been aware of the enhanced
transition services that were available in order for the service eligibility to influence their
decisionmaking. Table 5.2 shows that 72.2 percent of caregivers in the demonstration group had
been told about the enhanced transition services. While this is an increase of 7.3 percent from
caregiver initial interview data, still more than a quarter of demonstration group caregivers were
not told about the services.
Table 5.2: Awareness of Enhanced Services by Caregivers in the
Demonstration Group (latest interview)
Caregiver was told by caseworker that youth was eligible for
enhanced transition services
Overall
%
Yes 72.2
No 27.8
Total, demonstration group (N=335) 100
Was awareness of the enhanced services related to whether caregivers pursued
permanence through adoption or subsidized guardianship? Table 5.3 shows that more than half
(51.9%) of caregivers who knew about the enhanced services chose either adoption or subsidized
guardianship. By contrast, only 23.7 percent of caregivers who did not know about the enhanced
services decided to pursue adoption or subsidized guardianship. Moreover, awareness of the
services was even more strongly related to percentage of caregivers entering subsidized

73
guardianship. While the percentage of adoption between the caregiver groups was the same
(12.9%), caregivers who knew about the services were significantly more likely to entered
subsidized guardianship (39.0%), compared to caregivers who did not know about the services
(10.8%). These data indicate that caregivers who knew about the enhanced services were
significantly more likely to pursue permanence through subsidized guardianship. It is possible
that caseworkers told caregivers about the availability of enhanced services only if they thought
that the youth was a good candidate for adoption or subsidized guardianship. However, it is also
possible that knowledge of this information influenced youth and caregivers’ decisionmaking, as
was the intent of the waiver.
Table 5.3: Permanency Decision, by Whether Caregiver in Demonstration
Group Was Told About Enhanced Services (latest interview)
Demonstration Group Caregiver
Decisions
Caregiver Was Told About Enhanced Services
Available to Youth
%
Yes
(N=241)
No
(N=93)
Overall
(N=334)
Adopt 12.9 12.9 12.9
Enter subsidized guardianship 39.0 10.8 31.1
Chose neither adoption nor subsidized
guardianship or had made no
permanency decision made
48.1 76.4 56.0
Total, demonstration group 100 100 100
p<.001
Table 5.4 shows rates of permanence achieved by caregivers in the demonstration group,
both for those who were told about the enhanced services and those who were not.28
Less than 20
percent of caregivers in the demonstration group had completed permanence with youth.
However, caregivers who were aware of the enhanced services were significantly more likely to
achieve permanence than caregivers who were not aware of the services. There were small
differences between the caregiver groups for completed adoptions, but the caregivers who were
aware of the services were much more likely to have entered subsidized guardianship (16.1%)
compared to caregivers not aware of the services (4.3%).29
Thus, caregivers who were aware of
28
Unlike Chapter 2, but like Chapters 3 and 4, in this chapter ―permanence‖ refers to adoption and subsidized
guardianship and does not include reunification.
29 This caregiver finding differs from the findings for youth; however, the difference may primarily be because far
fewer youth were told about transition services overall.
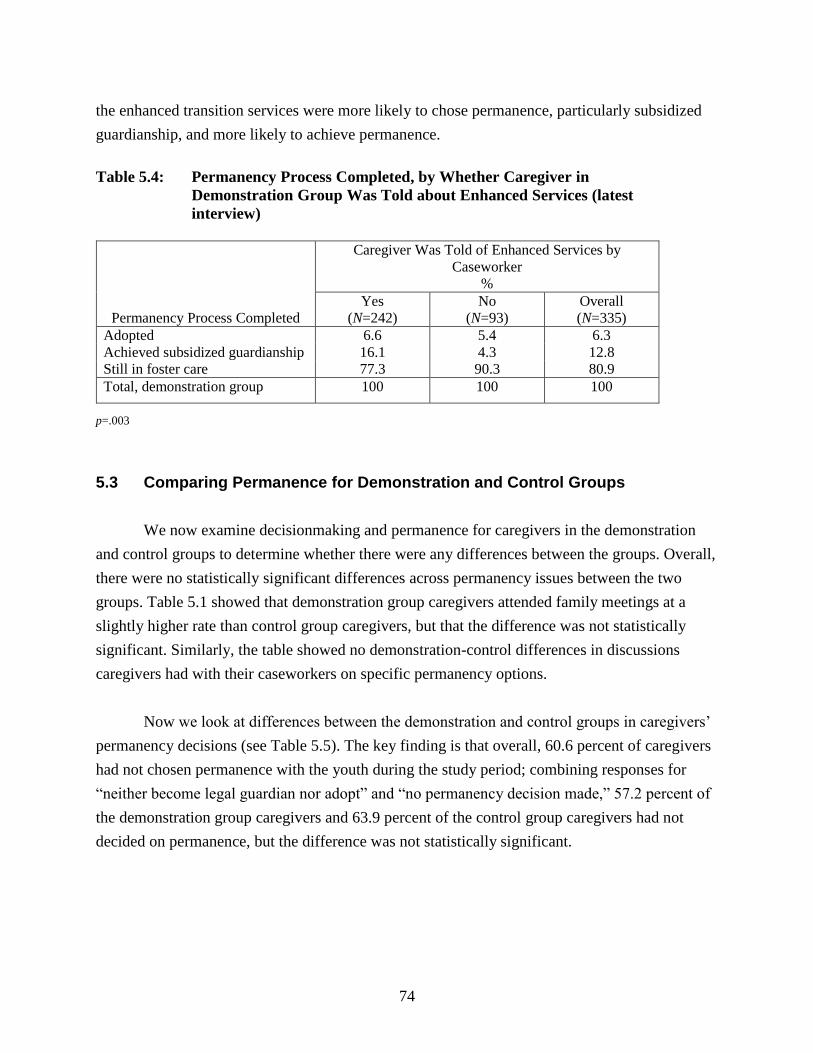
74
the enhanced transition services were more likely to chose permanence, particularly subsidized
guardianship, and more likely to achieve permanence.
Table 5.4: Permanency Process Completed, by Whether Caregiver in
Demonstration Group Was Told about Enhanced Services (latest
interview)
Permanency Process Completed
Caregiver Was Told of Enhanced Services by
Caseworker
%
Yes
(N=242)
No
(N=93)
Overall
(N=335)
Adopted 6.6 5.4 6.3
Achieved subsidized guardianship 16.1 4.3 12.8
Still in foster care 77.3 90.3 80.9
Total, demonstration group 100 100 100
p=.003
5.3 Comparing Permanence for Demonstration and Control Groups
We now examine decisionmaking and permanence for caregivers in the demonstration
and control groups to determine whether there were any differences between the groups. Overall,
there were no statistically significant differences across permanency issues between the two
groups. Table 5.1 showed that demonstration group caregivers attended family meetings at a
slightly higher rate than control group caregivers, but that the difference was not statistically
significant. Similarly, the table showed no demonstration-control differences in discussions
caregivers had with their caseworkers on specific permanency options.
Now we look at differences between the demonstration and control groups in caregivers’
permanency decisions (see Table 5.5). The key finding is that overall, 60.6 percent of caregivers
had not chosen permanence with the youth during the study period; combining responses for
―neither become legal guardian nor adopt‖ and ―no permanency decision made,‖ 57.2 percent of
the demonstration group caregivers and 63.9 percent of the control group caregivers had not
decided on permanence, but the difference was not statistically significant.

75
Table 5.5: Caregivers’ Permanency Decisions, by Evaluation Group (latest
interview)
Permanency Decision
Evaluation Group
%
Demonstration
(N=367)
Control
(N=382)
Overall
(N=749)
Adopt 12.0 13.4 12.7
Enter the subsidized guardianship program 30.8 22.8 26.7
Neither become legal guardian or adopt 25.9 29.1 27.5
No permanency decision made 31.3 34.8 33.1
Total 100 100 100
p=.157
Caregivers who decided to adopt or become legal guardians were asked about the status
of their permanency process (see Table 5.6). Once again we see no statistically significant
demonstration-control group differences in permanency status.
Table 5.6: Caregivers’ Permanency Completion Status, by Evaluation
Group (latest interview)
Permanency Completion Status
Evaluation Group
%
Demonstration
(N=151)
Control
(N=135)
Overall
(N=286)
Permanence is completed. 49.0 60.0 54.2
Permanence is started. 34.4 27.4 31.1
Not started the permanency process. 16.6 12.6 14.7
Total, caregivers who had decided to
adopt or become legal guardians 100 100 100
p=.185
Table 5.7 presents data on the permanence achieved by caregivers. There are similarities
to Table 5.5—there is a slightly higher percentage of caregivers in the control group who had
achieved adoption with youth and a slightly higher percentage of caregivers in the demonstration
group who had achieved legal guardianship. However, once again there were no statistically
significant differences between the demonstration and control groups.

76
Table 5.7: Caregivers’ Permanency Process Completed, by Evaluation Group
(latest interview)
Permanency Process
Completed
Evaluation Group
%
Demonstration Group
(N=367)
Control Group
(N=382)
Overall
(N=749)
Adoption 6.0 8.6 7.3
Subsidized guardianship 13.4 12.0 12.7
Youth still in foster care* 80.7 79.3 80.8
Total 100 100 100
p=.415
*Youth who were reunified after the initial interview (and thus they and their caregivers did not have a follow-up
interview) would be counted in this row.
5.4 Other Factors that Might Influence Permanence
As with the previous analyses, the interview closest to the time of a permanency decision
(latest interview dataset) was reviewed to examine a number of factors to understand more
details about caregivers’ permanency decisions.
Relative Status. Relatives, whenever available and appropriate, are the home of first
choice when a child is in need of a foster care placement. Despite their household size or income
limitations, relatives are often firmly committed to family members in need. About one-third of
the caregivers in the study were relatives, with aunts being the largest proportion of kin
caregivers (as was shown in Table 3.8). There were no significant demonstration-control group
differences in the proportion of relative caregivers in the study. However, as presented in Table
5.8, relatives were significantly more likely to have decided on permanence with the youth and
also more likely to have achieved permanence during the study period. Nearly half of the
relatives had decided to adopt or enter subsidized guardianship compared to 35.1 percent of
nonrelative caregivers. The largest difference was seen for caregivers who decided on subsidized
guardianship, with a more than 10-percent difference between the relative and nonrelative
caregivers. Also shown in Table 5.8 are the proportions of relative and nonrelative caregivers
who had achieved permanence with youth. A much larger proportion of relative caregivers had
achieved subsidized guardianship than nonrelative caregivers (19.7% compared to 9.2%).

77
Table 5.8: Caregivers’ Permanency Decisions and Permanence Completed, by
Relative Status (latest interview)
Permanency Issue
Caregiver Relative Status
%
Relative
(N=239)
Nonrelative
(N=502)
Overall
(N=741)
Caregivers’ Permanency Decision (p=0.005):
Adoption 14.6 11.8 12.7
Subsidized guardianship 33.5 23.3 26.6
Neither adoption nor subsidized guardianship 21.3 30.5 27.5
No permanency decision 30.5 34.5 33.2
Total 100 100 100
Permanence Completed (p<0.001):
Adoption 9.2 6.4 7.3
Subsidized guardianship 19.7 9.2 12.6
Still in foster care* 71.1 84.5 80.2
Total 100 100 100
*This group includes caregivers who said they had decided to adopt or enter subsidized guardianship, but they had not
yet completed the process.
Caregiver Age. Age can be a factor that influences a caregiver’s permanency decision.
For example, an older relative caregiver may believe he/she is too old to permanently care for
and meet the needs of a teenager, while a younger caregiver may feel he/she lacks the income or
stability of lifestyle to offer a permanent home. For our analyses, caregivers in the study were
categorized into three age levels: 21 to 39 years old, 40 to 59 years old, and 60 years or older.
The analyses show that caregiver age had little influence in permanence. As seen in Table 5.9,
despite a statistically significant difference in the data overall, the percentage of youth adopted
and entering subsidized guardianship appear very similar across age categories. The significant
differences were primarily driven by the nonpermanency categories (―neither adoption nor
subsidized guardianship‖ or ―no permanency decision made‖). When the analyses were
conducted collapsing the categories (i.e., for permanence vs. no permanence), we find the
statistical significance between caregiver age groups disappears (p=.819).

78
Table 5.9: Caregivers’ Permanency Decisions, by Age of Caregiver (latest interview)
Permanency Decision
Age of Caregiver
%
21-39
years
(N=152)
40-59
years
(N=423)
60 years
or older
(N=171)
Overall
(N=746)
Adoption 10.5 14.4 10.5 12.7
Subsidized guardianship 30.9 24.1 28.7 26.5
Neither adoption nor subsidized guardianship 17.8 29.6 31.6 27.6
No permanency decision 40.8 31.9 29.2 33.1
Total 100 100 100 100
p=.016
Household Income. Does household income influence whether a caregiver is able and
willing to provide permanence for a youth? We examined permanence for various levels of
household income to see if income influenced permanence for youth. Caregivers’ annual
household incomes were divided into four levels: lowest incomes (less than $20,000), low
income ($20,000-$39,999), moderate income ($40,000-$59,999), and high incomes ($60,000 or
more). There were statistically significant differences in caregivers’ permanency decisions
among the income categories (see Table 5.10). The proportion of caregivers who had chosen
permanence increased as household income increased; caregivers reporting higher household
incomes were more likely to choose adoption or enter subsidized guardianship compared to
caregivers with lower household incomes. However, an examination of household income by
permanence achieved (as opposed to permanence chosen) showed no statistically significant
differences (data not presented in a table).
Table 5.10: Caregivers’ Permanency Decisions, by Annual Household Income (latest
interview)
Permanency Decision
Caregiver’s Annual Household Income
%
Less than
$20,000
(N=169)
$20,000-
$39,999
(N=281)
$40,000-
$59,999
(N=176)
$60,000 or
more
(N=76)
Overall
(N=702)
Adoption 11.8 9.6 15.3 19.7 12.7
Subsidized guardianship 21.9 25.6 33.0 31.6 27.2
Neither adoption nor
subsidized guardianship 37.9 27.4 22.2 25.0 28.3
No permanency decision 28.4 37.4 29.5 23.7 31.8
Total 100 100 100 100 100
p=.006

79
Table 5.11 presents household income data for all caregivers, and separately for relative
and nonrelative caregivers. Overall, the majority of caregivers in the study (64.6%) reported
annual household incomes less than $40,000. Moreover, relative households were more likely to
have lower household incomes than nonrelative households.
Table 5.11: Annual Household Income, by Relative and Nonrelative Caregivers
(latest interview)
Household Annual Income
Relative Caregiver
(N=226)
%
Nonrelative Caregiver
(N=468)
%
Overall
(N=694)
%
Less than $20,000 38.1 17.3 24.1
$20,000-$39,999 36.3 42.5 40.5
$40,000 - $59,999 18.1 28.0 24.8
$60,000 or more 7.5 12.2 10.7
Total 100 100 100
p<.001
Caregivers Married or Living With a Partner. Over half of the caregivers who
participated in the interviews (57%) were single parents. Caregivers who have a spouse or
partner may count on that additional support in caring for a youth. However, does that support
make a difference in whether caregivers choose and complete permanence with a foster youth?
Table 5.12 shows that caregivers living with a spouse or a partner were more likely to choose
permanence with youth than caregivers without a spouse or partner. Likewise, caregivers were
more likely to complete the adoption or subsidized guardianship process when married or living
with a partner.

80
Table 5.12: Caregivers’ Permanency Decisions and Permanency Status, by Marital/
Partner Status (latest interview)
Permanency Issue
Caregiver’s Marital/Partner Status
%
Caregiver Is
Married or
Living With a
Partner
(N=319)
Caregiver Is
Not Married
or Living
With a Partner
(N=429)
Overall
(N=748)
Permanency Decision (p<.001)
Adoption 17.6 9.1 12.7
Subsidized guardianship 31.3 23.3 26.7
Neither adoption nor subsidized guardianship 22.6 31.0 27.4
No permanency decision made 28.5 36.6 33.2
Total 100 100 100
Whether permanence completed (p<.001):
Adoption 11.0 4.7 7.4
Subsidized guardianship 16.3 10.0 12.7
Youth still in foster care 72.7 85.3 79.9
Total 100 100 100
The analyses presented in this section indicate that relative status, annual household
income, and having a spouse or partner in the household all were related to whether a caregiver
chooses permanence for the youth. Other factors were tested and were found to have weak or no
relationship, including caregiver’s employment status, caregiver’s disability status, and whether
youth was diagnosed with a disability.
Model of Permanence. A regression model was developed to more clearly explain the
influences of relative status, income, caregiver age, and the presence of a spouse or partner on
predicting permanence. Using logistic regression, a stepwise process was used to build a logistic
model, adding each of the independent variables and testing the strength of the influence that
each factor has to predict permanence. The model found that there were significant main effects
for relative status and spouse/partner in household, in predicting permanence.
Table 5.13 illustrates the relationship of the data in the model. The analysis indicates that
caregivers with a spouse or partner were more likely to choose permanence for youth. This was
particularly pronounced for relative caregivers compared to nonrelative caregivers. Relative

81
caregivers with a spouse or partner were more likely to choose permanence than nonrelative
caregivers with a spouse or partner.
Table 5.13: Permanency Choice by Whether Have Spouse or Partner, for Relative
and Nonrelative Caregivers (latest interview)
Permanency Choice
Relative (p=.009)
%
Nonrelative (p=.001)
%
Partner/
Spouse
(N=100)
No
Partner/
Spouse
(N=139)
Partner/
Spouse
(N=213)
No
Partner/
Spouse
(N=288)
Caregiver chose adoption or
subsidized guardianship. 40.0 20.9 21.1 11.5
Caregiver did not choose permanence. 60.0 79.1 78.9 88.5
Total 100 100 100 100
5.5 The Most Important Issues Reported By Caregivers in Deciding
Permanence
Issues Caregivers Considered in Deciding on Permanence. Given that only about 4 in 10
caregivers chose permanence for the youth during the demonstration period, it is important to
understand why caregivers did and did not choose a permanency option to learn more about their
needs. Table 5.14 presents the most common issues considered by caregivers in deciding
whether to choose permanence with the youth. Service issues were given the strongest
consideration, and medical service concerns topped the list. Over one-half of the caregivers cited
help from DCFS with medical services (55.7%) as a consideration in their permanency
decisionmaking process, followed by youth services (55.3%), which could have included
transition services such as employment, housing and college assistance, or medical care or other
services that youth could receive through DCFS. The remaining considerations on the list
included caregiver wants to make his/her own decisions about how to care for youth (45.9%),
belief that DCFS would pay a subsidy (45.0%), and life skills training for youth (40.5%).
Demonstration group caregivers reported the same top five issues as the control group caregivers
with one exception—the control group caregivers listed need the child welfare agency’s help
with youth’s problems rather than life skills training for youth. Varying somewhat from
caregivers overall, the caregivers who had decided to enter subsidized guardianship or adopt

82
emphasized issues dealing with legal permanence for the youth, including the legal right to care
for and provide a more permanent legal arrangement for youth.
Table 5.14: Issues Considered by Caregivers When Deciding about Permanence
(latest interview)
Items Considered by… Percentage
All caregivers:
Need the child welfare agency to help with medical assistance 55.7
Services for youth 55.3
Caregiver wants to make his/her own decisions about how to care for youth 45.9
Belief that DCFS would provide a subsidy payment 45.0
Life skills training Program 40.5
Total (N=749)
Caregivers Who Decided to Enter Subsidized Guardianship or Adopt Youth:
Services for youth 65.8
Caregiver wants to make his/her own decisions about how to care for youth 63.4
Caregiver wants legal right to care for youth 61.7
Need the child welfare agency to help with medical assistance 58.6
Caregiver wants to provide a more permanent legal arrangement for youth 57.3
Total (N=295)
Caregivers’ Reasons for Choosing Permanence. Caregivers were asked why they chose to
adopt or enter subsidized guardianship with the youth in their care. The most common open-
ended responses are provided in Table 5.15. Whether adopting or choosing subsidized
guardianship, caregivers chose very similar reasons for their decisions, focused on their
relationship with the youth, the relationship youth had with their family, and providing a stable,
permanent home for the youth outside the foster care system.
Table 5.15: Caregivers’ Reasons for Choosing Permanence with Youth
(latest interview)
Top Five Reasons for Choosing Permanence for… Percentage
All caregivers who decided to adopt or enter subsidized guardianship:
Caregiver grew to love youth as his/her own 18.6
Thought it was best for youth 18.6
Family should be with family 17.6
To give youth a permanent home 13.9
To take youth out of the foster care system 8.5
Total (N=295)

83
Top Five Reasons for Choosing Permanence for… Percentage
Caregivers who decided to enter subsidized guardianship:
Thought it was best for youth 20.5
Family should be with family 14.5
Caregiver grew to love youth as his/her own 13.0
To give youth a permanent family 9.5
To give youth more services when he/she is older 8.5
Total (N=200)
Caregivers who chose adoption:
Caregiver grew to love the youth as his/her own 30.5
Family should be with family 24.2
To give youth a permanent home 23.2
Thought it was best for youth 14.7
Youth fit into the family and we liked having him/her 7.4
Total (N=95)
Caregivers’ Reasons for Not Choosing Adoption. With over 60 percent of caregivers in
the study having chosen to maintain youth in the foster care system during the study period, it is
important to understand why caregivers did not choose a permanency option in order to learn
more about their needs and the needs of the youth in their care. Table 5.16 provides the reasons
caregivers reported most frequently when asked in an open-ended format why they chose not to
adopt the youth in their care. The reasons given for not adopting youth included preference of the
caregiver or youth, the youth’s age (too old for adoption), and because youth was already a blood
relative. Caregiver responses reviewed separately for the demonstration group and control group
caregivers offered no significant differences from the larger group responses (and are not shown
in the table). Table 5.16 also shows caregiver responses separately for relative and nonrelative
caregivers. Responses were generally the same as for all caregivers; however 14.4 percent of
nonrelative caregivers reported their age as a reason they had not adopted youth, which was not
reported among the top responses by relative caregivers.
Table 5.16: Caregivers’ Reasons for Not Choosing Adoption (latest interview)
Top Five Reasons for Not Choosing Adoption for…. Percentage
All caregivers who did not choose adoption:
Youth does not want to be adopted. 53.8
Caregiver prefers to be a legal guardian. 41.7
Caregiver does not want to adopt youth. 40.7
Youth is too old. 23.7
Youth is already related by blood. 21.0
Total (N=405)

84
Top Five Reasons for Not Choosing Adoption for…. Percentage
Relative caregivers who did not choose adoption:
Youth is already related by blood. 63.8
Caregiver prefers to be a legal guardian. 53.8
Youth does not want to be adopted. 51.5
Caregiver does not want to adopt youth. 41.5
Youth is too old. 21.5
Total (N=130)
Nonrelative caregivers who did not choose adoption:
Youth does not want to be adopted. 55.9
Caregiver does not want to adopt youth. 40.7
Caregiver prefers to be a legal guardian. 36.3
Youth is too old. 25.2
Caregiver is too old. 14.4
Total (N=270)
Caregivers’ Reasons for Not Choosing Subsidized Guardianship. The reasons reported by
caregivers, relative caregivers, and nonrelative caregivers for not choosing subsidized
guardianship are presented in Table 5.17. In these lists, we see responses not previously reported
that refer to youth’s problems and possible reunification of youth with their parents. We see
these themes repeated in the data that compare the responses separately for relative and
nonrelative caregivers. Additionally, 10.3 percent of relative caregivers reported youth will lose
services as a reason for not choosing subsidized guardianship with youth. Demonstration-control
differences were not significant.
Table 5.17: Caregivers’ Reasons for Not Choosing Subsidized Guardianship
(latest interview)
Top Five Reasons for Not Choosing Subsidized Guardianship for…. Percentage
All caregivers who did not choose subsidized guardianship:
Youth does not want to enter subsidized guardianship. 45.0
Caregiver prefers to be an adoptive parent. 30.8
Youth has too many problems. 11.3
Caregiver has already raised his/her own children. 10.3
Youth’s parents will soon be able to care for youth. 9.3
Total (N=302)
Relative caregivers who did not choose subsidized guardianship:
Caregiver wants to be an adoptive parent. 40.2
Youth does not want to go into subsidized guardianship. 40.2
Caregiver has already raised own children. 14.9
Youth’s parents will soon be able care for youth. 11.5
Youth will lose services. 10.3

85
Top Five Reasons for Not Choosing Subsidized Guardianship for…. Percentage
Total (N=87)
Nonrelative caregivers who did not choose subsidized guardianship:
Youth does not want subsidized guardianship. 47.2
Caregiver wants to be an adoptive parent. 26.9
Youth has too many problems. 13.7
Youth is too difficult. 10.4
Youth’s parents will soon be able to care for youth. 8.5
Caregiver already raised own children. 8.5
Total (N=212)
5.6 Permanence Over Time
To examine permanence over the study period, we compare permanence for a subset of
caregivers at two points in time—the initial interview and the follow-up interview (referred to in
these analyses as time 1 (T1) and time 2 (T2)). The subpopulation for these analyses consists of
446 caregivers for whom we have both T1 and T2 data, the T1/T2 subsample. Caregivers were
interviewed only once if, at the time of the initial interview, the youth had already achieved
adoption or subsidized guardianship, or if the youth had turned 18 or been reunified with his/her
family (see Appendix C for more details), and these caregivers are not in the T1/T2 subsample.
Examining this subpopulation of caregivers at these two points in time may provide additional
information about permanency decisionmaking over time. Therefore, this section will look at
differences in caregiver decisions and permanence achieved among this subsample.
Permanency Decisions at T1 and T2. Table 5.18 shows caregiver permanency decisions
at T1 and T2. Overall, a small majority of caregivers (50-60%) reported the same decision at T1
and T2. Of those who changed their decision from T1 to T2, 12.4 percent of caregivers who had
not chosen permanence at T1 did choose permanence at T2. Additionally, 13.4 percent of
caregivers who had decided on permanence at T1 changed their mind and decided against
permanence at T2.

86
Table 5.18: Caregivers’ Permanency Decisions at T1 and T2 (T1/T2)
Permanency Decision at
Time 2
Caregiver Permanency Decision at Time 1
Adoption
(N=60)
%
Subsidized
Guardianship
(N=118)
%
Neither
Adoption
Nor SG
(N=93)
%
No
Permanency
Decision
(N=174)
%
Adoption 60.2 5.0 1.1 4.0
Subsidized guardianship 16.7 56.0 16.0 18.5
Neither adoption nor
subsidized guardianship 11.6 22.9 54.8 26.9
No permanency decision 11.6 16.0 28.1 50.5
Total 100 100 100 100
p<.001
Permanence Completed at T1 and T2. Table 5.19 examines whether caregivers who
decided on permanence at T1 achieved permanence by T2. The caregivers who had decided on
permanence with youth at T1 completed permanence between 40 and 48 percent by T2 (varying
by the type of permanence). Caregivers who had not chosen a permanency option at T1 obtained
permanence at a much lower rate (10.9%).
Table 5.19: Caregiver Permanence Completed at T2 by Permanency Decision at T1
(T1/T2)
Completed
Permanence at T2
Caregiver Permanency Decision at T1
Adoption
(N=60)
%
Subsidized
Guardianship
(N=118)
%
Neither or No Permanency
Decision
(N=267)
%
Yes* 48.3 40.8 10.9
No 51.7 59.2 92.9
Total 100% 100% 100%
p<.001
*Percentages who achieved permanence include caregivers who chose adoption at T1 but achieved subsidized
guardianship at T2 (n=3), and caregivers who chose subsidized guardianship at T1 and achieved adoption at T2 (n=3).
Among the caregivers who made a decision to adopt or enter subsidized guardianship at
T1, less than half (43.3%) had completed permanence with the youth at T2 (see Table 5.20).
However, of the 56.7 percent of caregivers who had not completed permanence at T2, the vast
majority (77.5%) reported at T2 that they had started the permanency process.

87
Table 5.20: Caregivers Who Decided To Adopt or Enter Subsidized
Guardianship at T1, Whether Completed Permanence
at T2 (T1/T2)
Chose Permanence at T1, Completed
Permanence at T2
Overall
%
Yes 43.3
No 56.7
Total, caregivers who chose permanence at
T1 (N=178) 100
Factors Influencing Permanence. What factors were related to whether caregivers and
youth obtained permanence? Neither caregivers’ evaluation group status nor financial hardship
was related to whether caregivers obtained permanence at T2; however, caregivers’ relative
status was significant. Table 5.21 presents the significant differences in permanence obtained at
T2 separately for relative caregivers and nonrelative caregivers. Relative caregivers were more
likely to obtain permanence by T2 than nonrelative caregivers. This mirrors the finding for youth
who obtained permanence at T2, presented in Chapter 4.
Table 5.21: Caregivers’ Permanence Completed at T2, by Relative Status (T1/T2)
Permanence Completed at T2
Caregiver is a
Relative
(N=131)
%
Caregiver is a
Nonrelative
(N=310)
%
Overall
(N=441)
%
Yes 37.4 14.9 21.6
No 62.6 85.1 78.4
Total 100 100 100
p<.001


89
6. Summary and Conclusion
Subsidized guardianship provides an additional permanency option and has been found to
increase permanency rates—but more so for younger children than for teenagers. The Illinois
Older Wards Waiver was designed to test hypotheses to answer the questions: Are older youth
less likely than younger children to achieve permanence because it would entail loss of access to
transition and post-permanency services? If youth are assured that they would not lose access to
services, are they more interested in and likely to achieve adoption or subsidized guardianship?
Through randomization, two statistically equivalent groups were created: (1) the
demonstration group, which was eligible for enhanced transition services, and (2) the control
group, which was not eligible for enhanced transition services but was eligible for a standard
limited set of services. Both groups were eligible for subsidized guardianship or adoption. Youth
in the demonstration group were eligible for enhanced transition services, including an
employment incentive program, housing cash assistance, formalized and enhanced life skills
training, and a youth-in-college/vocational training program—services that clearly would be
helpful and important to youth transitioning to adulthood and the loss of which might act as a
deterrent to permanence. The randomization was designed to ensure that any difference in
outcomes observed between the two groups was due to the intervention, not to any systematic
underlying difference between the groups, and that a lack of difference would indicate that the
intervention did not have an observed effect.
The hypothesis testing of the Illinois Older Wards Waiver found no evidence of a waiver
impact. Overall, there were no statistically significant demonstration-control differences in
achievement of permanence (adoption, subsidized guardianship, or reunification), incidence and
recurrence of abuse and neglect, restrictiveness of living arrangements, or educational
experiences prior to permanence. This might indicate that the prospect of enhanced services has
little effect on child safety, permanence, and well-being, and that losing access to services is not
the barrier to permanence that might be expected. However, it is important to keep in mind a
limitation of the Older Wards Waiver: we learned that the waiver’s intervention was
implemented inconsistently and, overall, quite weakly.
Our process study found that there was confusion among many court and agency staff
about both the difference in service eligibility between youth in the demonstration group and
those in the control group, and the difference between the present Older Wards Waiver and the
earlier Subsidized Guardianship Waiver. Some mistakenly believed that youth in the control

90
group were ineligible for subsidized guardianship, which would have been the case under the
earlier Subsidized Guardianship Waiver but was not the case under the present Older Wards
Waiver. In addition, caseworkers often were not aware of all the services that would be available
to families after they achieved permanence because those services tended to be the responsibility
of post-permanence workers; thus, caseworkers were not able to tell families about those
services. Any potential ―treatment effect‖ from being eligible for enhanced services could have
been diluted or reduced if caseworkers and courts: (1) were not aware that all the youth in the
waiver were eligible for subsidized guardianship, (2) did not know that some youth were eligible
for enhanced services, (3) were uncertain about what services youth would be eligible for, or (4)
did not communicate the correct information to the youth and their caregivers. If there is no clear
implementation of the intervention, with the treatment differences delivered as designed, it is
difficult to draw conclusions about the effects of the intervention.
We analyzed interview data for clues about what was important in the youth and
caregiver decisionmaking processes about permanence (defined in the interviews as subsidized
guardianship and adoption only) and why we found no waiver impact. Note that youth interview
questions differentiated among discussing permanence, wanting permanence, choosing
permanence, and achieving permanence, in order to better understand the process of
decisionmaking.30
We learned that quite a few youth (42%) reported in interviews that they had
never discussed guardianship or adoption with their caseworkers (demonstration-control
differences were not significant). About 30 percent of the youth were unsure about whether they
wanted either option. A third (34%) of caregivers had never discussed adoption or guardianship
with their caseworkers and about the same proportion (33%) had not made a decision about
permanence (again, no significant demonstration-control differences). Thus, availability of
enhanced services for youth in the demonstration group did not increase the probability that
caseworkers would discuss permanence with the families or that families would choose
permanence. This indicates a large number of families who potentially were open to achieving
permanence, but might have needed more information and discussion with their caseworkers. It
is possible that caseworkers made accurate determinations that some families were not good
candidates for guardianship or adoption and so never brought up the subject with them—but it is
30
The Children’s Bureau, U.S. Department of Health and Human Services, has expressed interest in the
decisionmaking process at this level of detail. For example, the standard Terms and Conditions for guardianship
demonstrations require that data be collected on proportion of cases eligible for guardianship, offered
guardianship, accepting or rejecting guardianship, and awarded guardianship. This is important in understanding
to whom and in what situations subsidized guardianship should be proposed, and when subsidized guardianship
works best.

91
also possible that many of those families would have wanted permanence if they had had more
information.
In addition, there was some evidence from the youth and caregiver interviews that the
services were important to both youth and caregivers in their decisionmaking about permanence.
Over half (58%) of the youth in the demonstration group were not aware of the enhanced
services, but those who did know were far more likely to want permanence with their caregivers
than did those who did not know about the services (40% vs. 19%). They also were far more
likely to have chosen permanence (43% vs. 27%). However, this did not translate into a
significant difference in achievement of permanence (21% vs. 15%). The achievement of
permanence can be a lengthy process, and if the tracking of the youth had gone on longer, we
might have found that more achieved permanence.
Similarly, more than a quarter (28%) of caregivers in the demonstration group had not
been told about the enhanced services that the youth would be eligible for if they achieved
adoption or subsidized guardianship. And caregivers in the demonstration group who said they
were aware of the enhanced services were more likely to choose permanence than caregivers
who did not know about the services (52% vs. 24%) and were more likely to complete the
permanency process (23% vs. 10%).31
As with discussions about permanence, it is possible that
caseworkers only told families about the services if they thought that the families were good
candidates for adoption or subsidized guardianship; however, it is also possible that awareness of
the services would have helped more youth and caregivers achieve permanence.
We found some significant differences in decisionmaking depending on whether or not
youth were living with caregivers who were relatives: youth with nonrelative caregivers were as
interested in permanence as youth with relative caregivers, but youth with relatives were
significantly more likely to have chosen permanence (44%) than were youth with nonrelatives
(32%). They also were more likely to have achieved permanence: youth with relatives were
more likely to be adopted (9%) and much more likely to achieve guardianship (20%) than youth
with nonrelatives (6% were adopted, and 9% achieved guardianship). The differences might be
explained by differences in characteristics of the two groups and a greater interest by relative
caregivers than nonrelative caregivers in achieving permanence. There were indications that
31
The apparent difference between the percentages of youth who achieved permanence (discussed in the previous
paragraph) and caregivers who achieved permanence is due to the different numbers who knew about the services:
among the 312 youth in the dataset, 176 knew about the services, while among the 335 caregivers in the dataset,
242 knew about the services.

92
many youth who had been placed with nonrelatives had more severe needs than youth who had
been placed with relatives: they were more likely to have disabilities, to have spent more time in
restrictive placements, and to have had more moves while in foster care. In light of the new
provisions for subsidized guardianship with kin caregivers under the recent Fostering
Connections to Success and Increasing Adoptions Act of 2008, it is important to understand the
differences in characteristics and decisionmaking between relative and nonrelative foster
families, and further research is needed.
The top reason that youth said they wanted either adoption or guardianship was that they
had a strong bond with their caregiver. The top reason that youth said they did not want either
option was that they felt they were too old. And youth preference was important to the
caregivers: the top reason that caregivers did not choose guardianship was that the youth did not
want it. The top reason that caregivers did not choose adoption was that the youth was already
related by blood (however, many related caregivers did choose to adopt). And over half of the
caregivers did not choose adoption because the youth did not want to be adopted.
When asked what issues were most important in their decisionmaking about adoption and
subsidized guardianship, issues related to services were the most frequently named. Among all
caregivers, over half said that agency help with medical assistance, as well as services for
youth, were the top considerations in their decisionmaking process about permanence. Two
thirds of the caregivers who had decided on guardianship or adoption said that services for youth
were the most important consideration.
Among youth who said at their initial interviews that they wanted guardianship or adoption with
their caregivers, only 30 percent had achieved it by the time of their follow-up interviews (19%
had achieved guardianship, and 11% had been adopted). Among caregivers who said at their
initial interview that they had chosen permanence, only 43 percent had achieved it by their
follow-up interview. Many of the youth had lost interest in permanence by the follow-up
interview, saying that they were too old or had become more interested in living on their own or
going into Independent Living. In most cases, it was not the relationship with the caregiver that
had changed; rather, youth felt that the time for achieving permanence had passed and they had
set their sights on moving into independence. Average age at initial interview was 15.6 years and
at follow-up interview was 17.3 years; thus, youth interest in permanence appears to fall off
dramatically between ages 15 and 17, indicating that it is important to discuss permanence with
youth as early as possible. We found that younger youth (ages 14-15) were more likely to want
permanence with their caregivers than were older youth (47% vs. 23%), more likely to have

93
chosen permanence (55% vs. 26%), and more likely to have achieved permanence (30% vs.
14%).
In a separate analysis of the subset of 730 youth who achieved permanence, we found
that youth assigned to the demonstration group were less likely to be reunified (25% of the
demonstration group vs. 34% of the control group) and more likely to go into subsidized
guardianship (45% of the demonstration group vs. 37% of the control group vs.) than youth
assigned to the control group (p=.0177). The proportions of youth who were adopted were nearly
equal (around 29%) for demonstration and control groups. As previously mentioned,
demonstration-control differences regarding permanency exits for all youth in the waiver were
not statistically significant, indicating no waiver impact on achievement of permanence.
However, this analysis was different because it focused on the subset of youth who achieved
permanence and because the model adjusted for the effects of other factors. The finding could be
due to (1) chance, (2) waiver impact, or (3) inconsistent implementation of the intervention. It is
possible that some caseworkers mistakenly believed that youth in the control group were not
eligible for subsidized guardianship and so were more likely to suggest reunification or adoption
to those families. No definite conclusions can be drawn, but this is an issue that warrants further
research.
Thus, although we did not find a significant waiver impact, our interview findings
support some common casework perceptions about permanency decisionmaking and youth:
(1) Services are important considerations for caregivers in their decisionmaking.
(2) Many teenagers in foster care do want permanence but it is important to move
quickly because their interest often wanes as they get older.
(3) Many families are not informed about permanency options and might choose
adoption or guardianship if caseworkers discuss those options with them.
(4) It is critical that caseworkers have complete and up-to-date information on the
transition services that young people are eligible for, depending on their
permanency choices, and communicate that information to the families.
Given the range of services available to youth under the Chafee Foster Care
Independence Program (Foster Care Independence Act of 1999) and the new subsidized
guardianship eligibility and reimbursement provisions under the Fostering Connections to
Success and Increasing Adoptions Act of 2008, young people and their caregivers need fully to
understand their options. In particular, as states begin to implement the Fostering Connections

94
provisions and other new initiatives, they will need to make sure that the range of options and
services are presented to families in clear, easy to understand, and consistent language, and that
families are well-prepared for whatever permanency options they choose. This will be a
challenging implementation issue.

Appendix A
Youth Interview Instrument


Westat
A-1
DID YOUTH SIGN ASSENT FORM?
YES
NO [YOUTH MUST SIGN ASSENT
FORM BEFORE STARTING INTERVIEW]
DID CAREGIVER SIGN CAREGIVER CONSENT
FOR YOUTH FORM?
NA, YOUTH IS 18 OR OLDER
YES
NO [CAREGIVER MUST SIGN CONSENT IF YOUTH IS
UNDER 18 BEFORE STARTING YOUTH INTERVIEW]

Westat
A-2
RECORD START TIME: |___|___|:|___|___| AM PM (CIRCLE ONE)
A. INTRODUCTION
Again, my name is __________________________________ and it’s great to talk to you today.
First I have some questions about you and the people who are important in your life.
A1. How old are you?
|_____|_____| YEARS
A2. What is your birthdate?
|___|___| |___|___| 19 |___|___|
MONTH DAY YEAR
A3. What race or ethnicity do you consider yourself? You can pick more than one.
Are you…(CIRCLE ALL THAT APPLY)
Hispanic . ................................................... 01
African-American. ...................................... 02
White ......................................................... 03
Native American ......................................... 04
Asian .......................................................... 05
Some other race or ethnicity ...................... 06
Specify: _______________________________
A4. Is [NAME OF CAREGIVER] a relative?
YES ......................................................... 1
NO ........................................................... 2 GO TO A6

Westat
A-3
A5. What relation is [NAME OF CAREGIVER] to you?
GRANDMOTHER. ..................................... 01
GRANDFATHER. ....................................... 02
AUNT ........................................................ 03
UNCLE ....................................................... 04
SISTER ...................................................... 05
BROTHER .................................................. 06
COUSIN ..................................................... 07
ADOPTIVE MOTHER ................................ 08
ADOPTIVE FATHER ................................. 09
BIRTH MOTHER ........................................ 10
STEPMOTHER .......................................... 11
BIOLOGICAL FATHER .............................. 12
STEPFATHER ........................................... 13
OTHER ....................................................... 14
SPECIFY:______________________________
(IF YOUTH SAYS CAREGIVER IS “MOTHER” OR “FATHER” PROBE FOR ADOPTIVE, BIOLOGICAL
OR STEP)
A6. What do you call your [CAREGIVER]?
_________________________________________________
A7. What would you like me to call her/him in this interview?
_________________________________________________
A8. Is [CAREGIVER] your godparent?
YES ......................................................... 1
NO ........................................................... 2
A9. INTERVIEWER: NOTE YOUTH’S GENDER FROM OBSERVATION
MALE ...................................................... 1
FEMALE .................................................. 2

Westat
A-4
B. SOCIAL NETWORKS Now let’s talk about people who are important to you. Think back over this past month. What people have been important to you? They may have been people you saw, talked with, or wrote letters to. This includes people who made you feel good, people who made you feel bad, and others who just played a part in your life.
B1. B2. B3. B4. B5. B6. B7. B8. B9.
First, think of people who live in this home who have been important to you in the past month. What are their first names or initials? (LIST NAMES AND CODE AREA OF LIFE ON CHART) NO ONE….........1 (ASK B2) How about family who live outside your home, including extended family and people you consider to be like family? (LIST NAMES AND CODE AREA OF LIFE ON CHART) NO ONE….........1 (ASK B3) How about friends or people you know from this neighborhood? (LIST NAMES AND CODE AREA OF LIFE ON CHART) NO ONE….........1 (ASK B4) How about people you know from school or work or support groups that we haven’t already listed? (LIST NAMES AND CODE AREA OF LIFE ON CHART) NO ONE….........1 (ASK B5) How about professional people such as teachers or mentors, counselors or caseworkers or clergy? (LIST NAMES AND CODE AREA OF LIFE ON CHART) NO ONE….........1 I will read your list to you (READ LIST). Is there any name you want to add? (LIST NAMES AND CODE AREA OF LIFE ON CHART) NO………..........1 MORE THAN 5 PEOPLE WERE LISTED…………………….1 5 OR FEWER PEOPLE WERE LISTED………………………2 (GO TO B8) Of the (NUMBER) names you have given me, who are the five that are most important to you? PLACE AN ASTERISK (*) IN PERSON COLUMN NEXT TO 5 MOST IMPORTANT AND CROSS OUT ALL OTHERS. ENTER THE APPROPRIATE CODE FOR EACH PERSON, UNDER AREA OF LIFE. Now I’m going to ask you a few questions about these people. ASK B10-B17 ABOUT EACH PERSON OF THE 5 MOST IMPORTANT PERSONS AND ENTER CODE NUMBERS FROM TOP OF COLUMN.
B10. Who would be available to help you out, for example, would give you a ride if you needed one, or would help you with a big chore? Can you rely on (NAME) for this kind of help… hardly ever sometimes, or almost always?
B11. Who would be available to give you emotional support, for example, would comfort you if you were upset or talk to you about your feelings? Can you rely on (NAME) for this kind of support… hardly ever sometimes, or almost always?
B12. Who do you rely on for advice? For example, who would tell you how to do something, or help you make a big decision? Would you rely on (NAME) for advice… hardly ever sometimes, or almost always?
B13. Who do you feel is critical of you, that is, makes you feel bad? Is (NAME) critical of you… hardly ever sometimes, or almost always?
B14. Now think about where help goes both ways. Do you usually… help (NAME) does (NAME help you, or do you help each other?
B15. Now think about how close you are to those people. Is (NAME)… not very close to you, somewhat close to you, or very close to you?
B16. Do you usually see (NAME)… daily weekly monthly
a few times a year, or not at all?
B17. How long have you known (NAME)… less than a year from 1-5 years, or more than 5 years?

Westat
A-5
B1a1-5 ENTER ALL NAMES OR INITIALS BELOW. IF MORE THAN 5, PLACE * NEXT TO 5 MOST IMPORTANT. CROSS OUT ALL OTHERS.
B81-5 AREA OF LIFE ENTER CODE # 1. In home 2. Family outside home 3. Friends or people from the neighborhood 4. School, work, support group 5. Professional people
B10. HELP
ENTER CODE # 1. Hardly ever 2. Sometimes 3. Almost always
B11. EMOTIONAL SUPPORT
ENTER CODE # 1. Hardly ever 2. Sometimes 3. Almost always
B12. INFORMATION/
ADVICE
ENTER CODE # 1. Hardly ever 2. Sometimes 3. Almost always
B13. CRITICAL
ENTER CODE # 1. Hardly ever 2. Sometimes 3. Almost always
B14. DIRECTION
OF HELP
ENTER CODE # 1. You help (PERSON) 2. (PERSON) helps you 3. Help each other
B15. CLOSENESS
ENTER CODE # 1. Not very close 2. Sort of close 3. Very close
B16. HOW OFTEN
SEEN
ENTER CODE # 1. Daily 2. Weekly 3. Monthly 4. Few time/year 5. Not at all
B17. HOW LONG
KNOWN
ENTER CODE # 1. Less than 1 year 2. From 1-5 years 3. More than 5 years
PERS #
B1a1-5 FIRST NAME OR INITIALS
01
02
03
04
05
06
07
08
09
10
11
12
13
14
15

Westat
A-6
We have just talked about the people who were important to you in the past month. Now I would like you to tell me the names of two people who have ever made a positive difference in your life. (They may be the same people or they may be different people). Who would they be? What is each person’s relationship to you? (RECORD FIRST NAME AND CODE) B18. PERSON 1: _______________________________________________________________ B19. PERSON 2: _______________________________________________________________ RELATIONSHIP B20: PERSON 1 B21: PERSON 2 a. BIRTH OR ADOPTIVE PARENT 01 01 b. FOSTER PARENT 02 02 c. SIBLING 03 03 d. OTHER RELATIVE 04 04 e. FRIEND 05 05 f. TEACHER 06 06 g. COUNSELOR 07 07 h. EMPLOYER 08 08 i. SOCIAL WORKER 09 09 j. OTHER (SPECIFY) PERSON 1____________________ 88 88 PERSON 2 ___________________ ASK FOR EACH PERSON How did [PERSON] make a positive difference? (RECORD VERBATIM) (PROBE: Can you give me an example of what [PERSON] did that made a difference?) B22. PERSON 1: _____________________________________________ _____________________________________________ B23. PERSON 2: _____________________________________________ _____________________________________________ B24. Did you know these two people prior to coming to live with [CAREGIVER]?
YES, BOTH ........................................... 1 GO TO SECTION C YES, ONE ............................................. 2 GO TO SECTION C NO, NEITHER ....................................... 3
B25. Was there anyone who made a positive difference in your life before you came to live with
[CAREGIVER]?
YES ....................................................... 1 NO ..................................................... …2 GO TO SECTION C
B26. Can you give me the name of this person or these people? _____________________________________________ _____________________________________________

Westat
A-7
B27. What relationship [is this person/are these people] to you? CIRCLE ALL THAT APPLY.
a. BIRTH OR ADOPTIVE PARENT 01
b. FOSTER PARENT 02
c. SIBLING 03
d. OTHER RELATIVE 04
e. FRIEND 05
f. TEACHER 06
g. COUNSELOR 07
h. EMPLOYER 08
i. SOCIAL WORKER 09
j. OTHER (SPECIFY) ___________________________ 88
B28. Do you still see or talk to [this person/these people]?
YES, ONE PERSON ONLY .................. 1
YES, ALL OF THEM ............................ 2
YES, SOME OF THEM ......................... 3
NO, NONE OF THEM ........................... 4

Westat
A-8
C. LIFE SKILLS
Now I have some questions about things you do around the home.
C1. How often do you cook dinner or help cook dinner?
At least once a week ............................. 1
At least once a month .......................... 2
Less than once a month........................ 3
Never ..................................................... 4
C2. How often do you go grocery shopping or help shop for groceries for your household?
At least once a week ............................. 1
At least once a month .......................... 2
Less than once a month........................ 3
Never ..................................................... 4
C3. Do you know what you would do to look for a job?
Would you say…?
Yes ........................................................ 1
No .......................................................... 2
Sort of.................................................... 3
C4. Do you have a bank account?
YES ....................................................... 1
NO ........................................................ 2
C5. Is there anything that you are saving money for?
YES ....................................................... 1
NO ......................................................... 2 GO TO C7
C6. What is it? [RECORD VERBATIM] ______________________________________
C7. Do you know how to budget your money?
Would you say…?
Yes ........................................................ 1
No .......................................................... 2
Sort of.................................................... 3
C8. Do you have a driver’s license or learner’s permit?
YES ....................................................... 1
NO ......................................................... 2 GO TO C11
C9. Do you have a car?
YES ....................................................... 1
NO ......................................................... 2

Westat
A-9
C10. Does anyone in your household have a car they let you use?
YES ....................................................... 1
NO ......................................................... 2
C11. Do you have a computer at home?
YES ....................................................... 1
NO ......................................................... 2
C12. How good are you at using computers?
Would you say…?
Very good .............................................. 1
Pretty good ............................................ 2
Fair ........................................................ 3
Poor ....................................................... 4
NEVER USE A COMPUTER AT
SCHOOL OR HOME ............................. 5
Now I have a few questions about school.
C13. Are you currently attending school? [IF IT IS SUMMER, CODE AS NO IF THE YOUTH IS OUT
OF SCHOOL FOR THE SUMMER]
YES ....................................................... 1
NO ......................................................... 2 GO TO C15
C14. What grade are you in school?
5th GRADE .......................................... 01
6th GRADE ......................................... 02
7th GRADE ......................................... 03
8th GRADE ......................................... 04
9th GRADE ......................................... 05
10th GRADE ....................................... 06
11th GRADE ....................................... 07
12th GRADE ....................................... 08
IN COLLEGE ...................................... 09
GO TO C17
C15. Why aren’t you currently attending school?
GRADUATED FROM HIGH SCHOOL ............. 1
DROPPED OUT ................................................. 2
SUMMER VACATION ........................................ 3
OTHER .............................................................. 4
SPECIFY: _______________________________

Westat
A-10
C16. What is the highest grade you completed in school?
LESS THAN 5th GRADE ..................... 01
5th GRADE .......................................... 02
6th GRADE ......................................... 03
7th GRADE ......................................... 04
8th GRADE ......................................... 05
9th GRADE ......................................... 06
10th GRADE ....................................... 07
11th GRADE ....................................... 08
12th GRADE ....................................... 09
C17. How far do you think you will go in school?
Less than high school (1 TO 8 years) ........................... 01
Some high school (9 to 11 years) ................................ 02
Will finish high school .................................................... 03
Will get a GED ............................................................... 04
Will complete a vocational program .............................. 05
Will go to college ......................................................... 06 GO TO C20
Will graduate from college ............................................ 07 GO TO C20
Will get a graduate degree like MA or MS, MBA,
PhD, MD or law degree ................................................. 08 GO TO C20
C18. Is this as far as you want to go in school?
YES ....................................................... 1 GO TO C21
NO ....................................................... 2
C19. What might prevent you from completing more school? Would it be…?
YES NO
a. That you are not interested in school ..................................... 1 2
b. Financial problems ................................................................. 1 2
c. Transportation ........................................................................ 1 2
d. That you need to work fulltime ............................................... 1 2
e. School work is too difficult ...................................................... 1 2
f. You can’t get into school ........................................................ 1 2
g. Health reasons, ..................................................................... 1 2
h. Because of some other reason .............................................. 1 2
Specify: __________________________________________
GO TO C21

Westat
A-11
C20. Have you taken any of the following steps toward going to college, such as…?
YES NO
a. Talking with a school guidance counselor about college ....... 1 2
b. Talking with [CAREGIVER] about college ............................. 1 2
c. Talking with your caseworker about college .......................... 1 2
d. Taking the right classes to prepare for college ...................... 1 2
e. Thinking about what college you would like to attend ............ 1 2
f. Visiting colleges...................................................................... 1 2
g. Looking into financial aid or scholarships to help
pay for college ........................................................................ 1 2
h. Saving money for college ....................................................... 1 2
i. Applying to college ................................................................. 1 2
i. Anything else .......................................................................... 1 2
Specify___________________________________________
C21. Are you currently working?
YES ....................................................... 1
NO ....................................................... 2 GO TO SECTION D
C22. What is your type of work?
________________________________________________________________
________________________________________________________________

Westat
A-12
D. SERVICES
This section covers some services you may receive.
D1. How often do you usually see or talk to your caseworker?
Would you say…?
Every day or almost every day ........................................ 1
About once a week ......................................................... 2
Once or twice a month .................................................... 3
Less than once a month .................................................. 4
Never ............................................................................... 5
IT VARIES ...................................................................... 6
DOES NOT HAVE A CASEWORKER …………………...7 GO TO D5
D2. Have you seen or talked to your caseworker in the past 30 days?
YES ....................................................... 1
NO ......................................................... 2 GO TO D5
D3. In the past 30 days, has your caseworker helped you with a problem you had?
YES ....................................................... 1
NO ......................................................... 2
D4. In the past 30 days, has your caseworker taken you anywhere?
YES ....................................................... 1
NO ......................................................... 2

Westat
A-13
D5. Have your caseworker, foster care agency or independent living program provided you with
classes or training on:
YES NO
a. How to manage your money .................................................. 1 2
b. How to open a bank account .................................................. 1 2
c. How to balance a checkbook ................................................. 1 2
d. How to make friends .............................................................. 1 2
e. How to get health care ........................................................... 1 2
f. How to make decisions about birth control ............................ 1 2
g. How to protect yourself from sexually transmitted diseases
(STDs), like AIDS ................................................................... 1 2
h. How to prepare meals ............................................................ 1 2
i. How to choose nutritionally good food ................................... 1 2
j. How to find a job..................................................................... 1 2
k. How to write a resume ........................................................... 1 2
l. How to interview for a job ....................................................... 1 2
m. How to apply for college ......................................................... 1 2
n. How to find a place to live ...................................................... 1 2
o. How to do housekeeping ........................................................ 1 2
p. How to obtain legal assistance ............................................... 1 2
q. How to locate community resources (i.e., post office, hospital,
counseling services) ............................................................... 1 2
r. How to set and achieve goals ................................................ 1 2
s. How to tell other people how you feel .................................... 1 2
t. How to express your opinion .................................................. 1 2
u. How to make good decisions ................................................. 1 2
D7. Have you ever had counseling about personal or family problems?
YES ....................................................... 1
NO ......................................................... 2
D8. Have you ever received tutoring in schoolwork?
YES ....................................................... 1
NO ......................................................... 2
D9. Have you ever received employment services like job counseling or job training?
YES ....................................................... 1
NO ......................................................... 2

Westat
A-14
E. RELATIONSHIP WITH CAREGIVER
Now I have some questions about your home life.
E1. When you go out, how often do you tell [CAREGIVER] where you’re going and what you’re
doing?
Would you say…?
All of the time ........................................ 1
Most of the time .................................... 2
Sometimes ............................................ 3
Hardly ever ............................................ 4
Never ..................................................... 5
E2. How often does [CAREGIVER] check out your friends or people you hang out with?
Would you say…?
All of the time ........................................ 1
Most of the time .................................... 2
Sometimes ............................................ 3
Hardly ever ............................................ 4
Never ..................................................... 5
E3. How often does [CAREGIVER] set rules about when you have to be back home if you go out?
Would you say…?
All of the time ........................................ 1
Most of the time .................................... 2
Sometimes ............................................ 3
Hardly ever ............................................ 4
Never ..................................................... 5
E4. When did you first start to live with [CAREGIVER]? Can you give me the month and year?
(PROBE: GET AT LEAST THE YEAR EVEN IF YOUTH CANNOT RECALL MONTH)
|__|__| |__|__|__|__|
Month Year
E5. Since you started living in the home you’re in now, has anyone moved in?
YES ....................................................... 1
NO ......................................................... 2 GO TO E8
E6. Have you felt happy because someone came to live in your home?
YES ....................................................... 1
NO ......................................................... 2
E7. Have you felt unhappy because someone came to live in your home?
YES ....................................................... 1
NO ......................................................... 2

Westat
A-15
E8. Do you ever feel scared of someone who lives in your home?
YES ....................................................... 1
NO ......................................................... 2
E9. How many times have you moved to live with a different family or a different family member in
your life? Would you say…
1 time .................................................... 1
2 times................................................... 2
3 times................................................... 3
4 or more times ..................................... 4
E10. Do you like living with the people you live with now?
Would you say…?
All of the time ........................................ 1
Most of the time .................................... 2
Sometimes ............................................ 3
Hardly ever ............................................ 4
Never ..................................................... 5
E11. Do you feel like you’re part of this family?
Would you say…?
All of the time ........................................ 1
Most of the time .................................... 2
Sometimes ............................................ 3
Hardly ever ............................................ 4
Never ..................................................... 5
E12. How much longer do you think you will be living with [CAREGIVER]?
Would you say…?
A couple of weeks longer ........................................................... 01
A couple of months longer ......................................................... 02
A year longer .............................................................................. 03
A couple of years longer ............................................................ 04 GO TO E14
Until you are 18 .......................................................................... 05 GO TO E14
Until you are 21 .......................................................................... 06 GO TO E14
Until some other time ................................................................. 07 GO TO E14
SPECIFY: Until what time do you think you will be living
here? ___________________________________

Westat
A-16
E13. Who do you think you’ll be living with next year? RECORD VERBATIM AND THEN CIRCLE ALL
THAT APPLY
______________________________________________________________________________
______________________________________________________________________________
______________________________________________________________________________
______________________________________________________________________________
a. BIOLOGICAL MOTHER AND/OR FATHER ........................ 01
b. ANOTHER RELATIVE ......................................................... 02
c. FOSTER PARENT ............................................................... 03
d. FRIEND OR ROOMMATE ................................................... 04
e. SPOUSE .............................................................................. 05
f. IN A GROUP HOME ........................................................... 06
g. IN AN INDEPENDENT LIVING APARTMENT ................... 07
h. BY YOURSELF ALONE ....................................................... 08
i. OTHER ................................................................................. 09
SPECIFY: ___________________________________________
E14. Is there someone else who is responsible for taking care of you if [CAREGIVER] is ill or
away?
YES ....................................................... 1
NO ......................................................... 2 SKIP TO E16
E15. Is this person in your home?
YES ....................................................... 1
NO ......................................................... 2
E16. Is there someone’s home you could stay at if you need a place to stay?
YES ....................................................... 1
NO ......................................................... 2
E17. Have you ever run away from the family you live with now for overnight or longer? (IF YES, how
often?)
NO ......................................................... 1
YES, ONCE .......................................... 2
YES, MORE THAN ONCE .................... 3
E18. Have you ever been thrown out or locked out of this home for overnight or longer?
YES ....................................................... 1
NO ......................................................... 2
Westat
A-17
F. HEALTH
Now I have some questions about your health.
F1. Compared to other people your age, would you say your present health is…?
Excellent................................................ 1
Good ..................................................... 2
Fair ........................................................ 3
Poor ....................................................... 4
F2. Have you (given birth to/fathered) any children?
YES ....................................................... 1 GO TO SECTION G
NO ......................................................... 2
F3. Have you ever been pregnant/gotten anyone pregnant)?
YES ....................................................... 1
NO ......................................................... 2
DON’T KNOW ....................................... 8

Westat
A-18
G. NEIGHBORHOOD AND FRIENDS
Now I have some questions about your neighborhood and your friends.
G1. For each of the following items, please tell me how often each one happened to you during the
past three months. (READ ITEM) Would you say never, once, or more than once?
More than
Never Once once
a. You saw non-violent crimes take place in your neighborhood – for example, selling drugs or stealing..................................... 1 2 3
b. You heard or saw violent crime take place in your neighborhood. ........................................................................ 1 2 3
c. You know someone who was a victim of a violent crime in your neighborhood. ............................................................ 1 2 3
d. You were a victim of violent crime in your neighborhood. ..... 1 2 3
e. You were a victim of violent crime in your home. ................... 1 2 3
G2. Do any of your friends smoke cigarettes?
YES ......................................................... 1
NO ........................................................... 2
G3. Do any of your friends drink alcohol, such as beer, wine or liquor?
YES ......................................................... 1
NO ........................................................... 2
G4. Do any of your friends use drugs to get high?
YES ......................................................... 1
NO ........................................................... 2

Westat
A-19
H. RELATIONSHIP WITH BIOLOGICAL PARENTS AND SIBLINGS
BOX H1
IF CAREGIVER IS BIRTH MOTHER (A5 on p. 3 = 10) GO TO H10
Now I’d like to ask you a few questions about your birth mother.
H1. Is your mother living?
YES ....................................................... 1
NO ......................................................... 2 GO TO BOX H10
DON’T KNOW ....................................... 8 GO TO BOX H10
H2. Does [CAREGIVER] ever see your mother or talk to your mother at all?
YES ....................................................... 1
NO ......................................................... 2 GO TO H4
H3. Do [CAREGIVER] and your mother get along OK?
YES ....................................................... 1
NO ......................................................... 2
H4. Do you ever see your mother?
YES ....................................................... 1
NO ......................................................... 2 GO TO BOX H10
H5. About how often do you see your mother?
Would you say…?
Everyday .............................................. 1
Almost everyday ................................... 2
About once a week ............................... 3
Once or twice a month .......................... 4
Less than once a month........................ 5
H6. When was the last time you saw or talked to your mother?
WITHIN THE LAST WEEK ................... 1
WITHIN THE LAST MONTH ................. 2
WITHIN THE PAST 3 MONTHS ........... 3
WITHIN THE PAST 6 MONTHS ........... 4
MORE THAN 6 MONTHS AGO ............ 5
MORE THAN 1 YEAR AGO.................. 6

Westat
A-20
H7. Do you do enjoyable activities with your mother when you see her?
Would you say…?
All of the time ........................................ 1
Most of the time .................................... 2
Sometimes ............................................ 3
Hardly ever ............................................ 4
Never ..................................................... 5
H8. Do you talk to your mother about important things in your life when you see her?
Would you say…?
All of the time ........................................ 1
Most of the time .................................... 2
Sometimes ............................................ 3
Hardly ever ............................................ 4
Never ..................................................... 5
H9. Do you wish you saw your mother more, less or the same amount as you do now?
MORE ................................................... 1
LESS ..................................................... 2
THE SAME AMOUNT ........................... 3
BOX H10
IF CAREGIVER IS BIOLOGICAL FATHER (A5 on p. 3 = 12) GO TO H18
H10. Now I want to ask you a few questions about your biological father. Is your father living?
YES ....................................................... 1
NO ........................................................ 2 GO TO H18
DON’T KNOW ....................................... 8 GO TO H18
H11. Does [CAREGIVER] ever see your father or talk to your father at all?
YES ....................................................... 1
NO ......................................................... 2 GO TO H13
H12. Do [CAREGIVER] and your father get along OK?
YES ....................................................... 1
NO ......................................................... 2
H13. Do you ever see your father?
YES ....................................................... 1
NO ......................................................... 2 GO TO H18

Westat
A-21
H14. About how often do you see your father?
Would you say…?
Everyday .............................................. 1
Almost everyday ................................... 2
About once a week ............................... 3
Once or twice a month .......................... 4
Less than once a month........................ 5
H15. Do you do enjoyable activities with your father when you see him?
Would you say…?
All of the time ........................................ 1
Most of the time .................................... 2
Sometimes ............................................ 3
Hardly ever ............................................ 4
Never ..................................................... 5
H16. Do you talk to your father about important things in your life when you see him?
Would you say…?
All of the time ........................................ 1
Most of the time .................................... 2
Sometimes ............................................ 3
Hardly ever ............................................ 4
Never ..................................................... 5
H17. Do you wish you saw your father more, less or the same amount as you do now?
MORE ................................................... 1
LESS ..................................................... 2
THE SAME AMOUNT ........................... 3
H18. Do you have any brothers or sisters who don’t live with you, including half-brothers and half-
sisters?
YES ....................................................... 1
NO ......................................................... 2 GO TO I1
H19. When was the last time you saw or talked to one of your brothers or sisters who lives outside your
home?
WITHIN THE LAST WEEK ................... 1
WITHIN THE LAST MONTH ................. 2
WITHIN THE PAST 3 MONTHS ........... 3
WITHIN THE PAST 6 MONTHS ........... 4
MORE THAN 6 MONTHS AGO ............ 5
MORE THAN 1 YEAR AGO.................. 6

Westat
A-22
I. DECISION-MAKING ON GUARDIANSHIP AND ADOPTION
BOX I1
IF CAREGIVER IS BIRTH MOTHER (A5 on p. 3 = 10) OR BIOLOGICAL FATHER (A5 on p. 3 = 12)
GO TO SECTION K
Now I have some questions about guardianship and adoption.
I1. Have you been legally adopted by [CAREGIVER]? To be legally adopted, you would have
appeared before a judge who made [CAREGIVER] your adoptive parent. You would no longer
have a caseworker or any involvement with DCFS.
YES ....................................................... 1 GO TO J1
NO ......................................................... 2
I2. Have you and [CAREGIVER] gone through the process by which [CAREGIVER] becomes your
legal guardian? To become your legal guardian, you would have appeared before a judge who
declared [CAREGIVER] your guardian and you would no longer have a caseworker or any
involvement with DCFS.
YES ....................................................... 1 GO TO J10
NO ......................................................... 2
I3. Has your caseworker ever talked to you about [CAREGIVER] becoming your legal guardian?
YES ....................................................... 1
NO ......................................................... 2
I4. Has anyone in your home ever talked to you about [CAREGIVER] becoming your legal guardian?
YES ....................................................... 1
NO ......................................................... 2
IF YOUTH IS IN GROUP B [LABEL IS BLUE], GO TO I6
I5. Did your caseworker tell you that if [CAREGIVER] became your legal guardian you could get
enhanced Transition Services like education and training vouchers, money for college, housing
assistance, and life skills training that would help you get ready to live on your own?
YES ....................................................... 1
NO ......................................................... 2
I6. Do you think you want [CAREGIVER] to become your legal guardian?
YES ....................................................... 1
NO ....................................................... 2 GO TO I8
NOT SURE/DON’T KNOW ................... 8 GO TO I9

Westat
A-23
I7. Why do you want [CAREGIVER] to become your legal guardian?
RECORD VERBATIM
______________________________________________________________________________
______________________________________________________________________________
______________________________________________________________________________
______________________________________________________________________________
(PROBE: Are there any other reasons?)
GO TO I9
I8. Why don’t you want [CAREGIVER] to become your legal guardian?
RECORD VERBATIM
______________________________________________________________________________
______________________________________________________________________________
______________________________________________________________________________
______________________________________________________________________________
(PROBE: Are there any other reasons?)
I9. Has your caseworker ever talked to you about [CAREGIVER] adopting you?
YES ....................................................... 1
NO ......................................................... 2
I10. Have you ever talked with [CAREGIVER] about being adopted?
YES ....................................................... 1
NO ......................................................... 2
IF YOUTH IS IN GROUP B [LABEL IS BLUE], GO TO I12
I11. Did your caseworker tell you that if you were adopted you could get enhanced Transition Services
like education and training vouchers, money for college, housing assistance, and life skills
training that would help you get ready to live on your own?
YES ....................................................... 1
NO ......................................................... 2
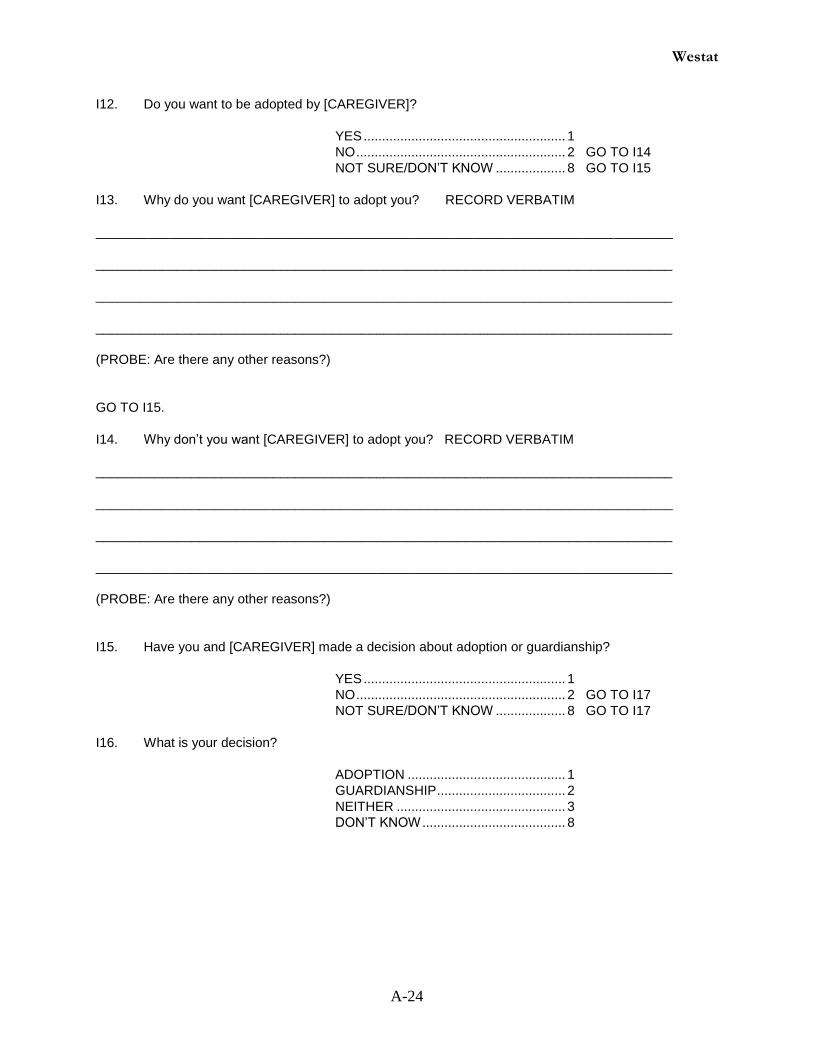
Westat
A-24
I12. Do you want to be adopted by [CAREGIVER]?
YES ....................................................... 1
NO ......................................................... 2 GO TO I14
NOT SURE/DON’T KNOW ................... 8 GO TO I15
I13. Why do you want [CAREGIVER] to adopt you? RECORD VERBATIM
______________________________________________________________________________
______________________________________________________________________________
______________________________________________________________________________
______________________________________________________________________________
(PROBE: Are there any other reasons?)
GO TO I15.
I14. Why don’t you want [CAREGIVER] to adopt you? RECORD VERBATIM
______________________________________________________________________________
______________________________________________________________________________
______________________________________________________________________________
______________________________________________________________________________
(PROBE: Are there any other reasons?)
I15. Have you and [CAREGIVER] made a decision about adoption or guardianship?
YES ....................................................... 1
NO ......................................................... 2 GO TO I17
NOT SURE/DON’T KNOW ................... 8 GO TO I17
I16. What is your decision?
ADOPTION ........................................... 1
GUARDIANSHIP ................................... 2
NEITHER .............................................. 3
DON’T KNOW ....................................... 8

Westat
A-25
I17. Do you think adoption and guardianship are equally permanent?
YES ....................................................... 1
NO ......................................................... 2
NOT SURE/DON’T KNOW ................... 8 GO TO SECTION K
I18. Why do you think this?
______________________________________________________________________________
______________________________________________________________________________
______________________________________________________________________________
______________________________________________________________________________
GO TO SECTION K

Westat
A-26
J. POST-ADOPTION AND GUARDIANSHIP
J1. Now I have some questions about your adoption. What is the main reason you wanted to be
adopted? RECORD VERBATIM
______________________________________________________________________________
______________________________________________________________________________
______________________________________________________________________________
______________________________________________________________________________
IF YOUTH IS IN GROUP B [LABEL IS BLUE] GO TO J4.
J2. Did your caseworker tell you that if you were adopted you could get enhanced Transition Services
(like education and training vouchers, medical card, money for college, housing assistance, and
life skills training) that would help you get ready to live on your own?
YES ....................................................... 1
NO ......................................................... 2
J3. Did the fact that you could get these Transition Services if you were adopted play a role in your
decision to be adopted?
Would you say…?
Not at all ............................................... 1
Somewhat ............................................. 2
A great deal ........................................... 3
J4. What advice would you tell other teens considering adoption?
RECORD VERBATIM
______________________________________________________________________________
______________________________________________________________________________
______________________________________________________________________________
______________________________________________________________________________
J5. Has adoption made your relationship with [CAREGIVER]…
Better ..................................................... 1
Worse, or .............................................. 2
About the same ..................................... 3

Westat
A-27
J6. Has adoption made your life…
Better ..................................................... 1
Worse, or............................................... 2
About the same ..................................... 3
J7. Since being adopted, do you find it is easier or harder to make plans for the future?
Would you say…?
Easier .................................................... 1
Harder, or .............................................. 2
About the same ..................................... 3
J8. Do you think adoption and guardianship are equally permanent?
YES ....................................................... 1
NO ......................................................... 2
NOT SURE/DON’T KNOW ................... 8 GO TO SECTION K
J9. Why do you think this?
______________________________________________________________________________
______________________________________________________________________________
______________________________________________________________________________
______________________________________________________________________________
GO TO SECTION K
J10. Now I have some questions about [CAREGIVER] becoming your legal guardian. What is the
main reason you wanted [CAREGIVER] to become your legal guardian?
RECORD VERBATIM
______________________________________________________________________________
______________________________________________________________________________
______________________________________________________________________________
______________________________________________________________________________
IF YOUTH IS IN GROUP B [LABEL IS BLUE], GO TO J13.

Westat
A-28
J11. Did your caseworker tell you that if you went into subsidized guardianship you could get
enhanced Transition Services (like education and training vouchers, medical card, money for
college, housing assistance, and life skills training) that would help you get ready to live on your
own?
YES ....................................................... 1
NO ......................................................... 2
J12. Did the fact that you could get these Transition Services if you went into guardianship play a role
in your decision to have [CAREGIVER] become your guardian?
Would you say…?
Not at all ............................................... 1
Somewhat ............................................. 2
A great deal ........................................... 3
DON’T KNOW ....................................... 8
J13. Did you consider having [CAREGIVER] adopt you instead of becoming your guardian?
YES ...................................................... 1
NO ......................................................... 2 GO TO J15
J14. Why did you and [CAREGIVER] decide on guardianship instead of adoption?
RECORD VERBATIM
______________________________________________________________________________
______________________________________________________________________________
______________________________________________________________________________
______________________________________________________________________________
J15. Do you think adoption and guardianship are equally permanent?
YES ....................................................... 1
NO ......................................................... 2
NOT SURE/DON’T KNOW ................... 8 GO TO J17
J16. Why do you think this?
______________________________________________________________________________
______________________________________________________________________________
______________________________________________________________________________
______________________________________________________________________________

Westat
A-29
J17. What advice would you tell other teens considering guardianship?
RECORD VERBATIM
______________________________________________________________________________
______________________________________________________________________________
______________________________________________________________________________
J18. Has guardianship made your relationship with [CAREGIVER]…
Better ..................................................... 1
Worse, or .............................................. 2
About the same ..................................... 3
J19. Has guardianship made your life…
Better ..................................................... 1
Worse, or............................................... 2
About the same ..................................... 3
J20. Since going into the subsidized guardianship program, do you find it is easier or harder to make
plans for the future?
Would you say…?
Easier .................................................... 1
Harder, or .............................................. 2
About the same ..................................... 3

Westat
A-30
SECTION K
INTERVIEWER--HAND YOUTH SELF-REPORT FORM TO RESPONDENT.
We often read these next questions to respondents. Would you like me to read them to you or would you
prefer to read them to yourself? I am going to have you mark your answers on this sheet. Questions
that refer to “parent” are talking about [CAREGIVER] who is your caregiver.
INTERVIEWER CIRCLE 1 OR 2:
QUESTIONS READ TO YOUTH .......... 1
YOUTH READ QUESTIONS ................ 2

Westat
A-31
__________________________ ID
L. CONTACT INFORMATION
Because we want to contact you again for the followup interview, I would like to get some information
from you that will help us locate you in case you move.
L1. Your home phone number: ___________________________________________________________
L2. Whose name is the phone listed under: _________________________________________________
L3. Your cell phone number: _____________________________________________________________
L4. Your email address: ________________________________________________________________
L5. Will you please tell me the name, address and telephone numbers of three individuals who will
always know where you are or how to reach you. We will only contact these individuals if we are
unable to locate you at your current address or telephone number. Anyone we contact will be
asked only if they know how to reach you. They won’t be given any information, and they won’t be
interviewed.
Name Address
Home Telephone
Number
Cell or Work
Telephone Number
Relationship to you
(e.g., family, friend,
co-worker, etc.)
[PROVIDE R WITH $20.00 CASH INCENTIVE]
That is all. Thank you very much for helping us with our study.
RECORD END TIME: |___|___|:|___|___| AM PM (CIRCLE ONE)


Appendix B
Caregiver Interview Instrument


Westat
B-1
DID CAREGIVER SIGN CONSENT FORM?
YES
NO [CAREGIVER MUST SIGN CONSENT FORM BEFORE STARTING
INTERVIEW]

Westat
B-2
TIME STARTED: ______________AM/PM (CIRCLE ONE)
A. HOUSEHOLD STRUCTURE AND CHARACTERISTICS
INTRODUCTION
Again, my name is ____________________ and I work for Westat, the national research organization that is
conducting the Illinois Family Study. The study will help the Department of Children and Family Services provide
better services to teens.
I would like to ask you questions specifically regarding [YOUTH].
A1. First, please tell me if you are [YOUTH]’s …
Adoptive parent ................................................................. 01
Foster parent ..................................................................... 02
Legal guardian .................................................................. 03
Birth mother/step mother .................................................. 04 (GO TO A3)
Biological father/step father .............................................. 05 (GO TO A3)
OTHER [SPECIFY] ________________ .......................... 07
A2. Prior to becoming his/her (adoptive parent/foster parent/guardian/other) were you related to [YOUTH],
and if so, what is your relation?
GRANDMOTHER ............................................................. 01
GRANDFATHER ............................................................... 02
SISTER/STEPSISTER ..................................................... 03
BROTHER/STEPBROTHER ............................................ 04
AUNT ................................................................................ 05
UNCLE .............................................................................. 06
OTHER RELATIVE [SPECIFY] ___________________ 07
NON-RELATIVE ............................................................... 08
A3. I would like to know the names of all the adults and children who are members of your household,
including yourself and any who may not be living here right now (i.e. at school or college or temporarily
living out of the house or staying with someone else).
Let's start by listing the names of each person. Then I’d like to ask you a few questions about each
member.
Your name is……
[LIST ALL NAMES. THEN ASK ALL QUESTIONS IN TABLE FOR ONE PERSON BEFORE GOING TO
NEXT]

Westat
B-3
Person #
A3a. .NAME
A3b. RELATION TO CHILD
A3c. STAYING
IN THE HOME
A3d. AGE AND
BIRTHDATE
A3e. SEX
A3f. RACE/ETHNICITY
LIST ALL NAMES
STARTING WITH THE
CAREGIVER YOU
ARE INTERVIEWING
ON LINE 01
FOLLOWED BY THE
YOUTH IN THE
STUDY.
And the relation to [YOUTH]
is…..?
GRANDPARENT ............ 01
SISTER/STEPSISTER .... 02
BROTHER/STEPBRO. ..... 03
AUNT ........................... 04
UNCLE .............................. 05
OTHER RELATIVE
(SPECIFY)______________06
NON-RELATIVE
(SPECIFY)______________07
ENTER CODE
Is this person
currently staying
in the home?
YES………1
NO………..2
ENTER CODE
What is the person’s date of
birth and age?
ENTER DOB/AGE
Is the
person
male or
female?
M........1
F.........2
ENTER
CODE
What race/or ethnic origin
are you/he/she?
You may choose more
than one.
Hispanic/Latino origin…1
African American………2
White……………………3
Native American……….4
Asian……………………5
Some other race or
origin?.......................... 6
(SPECIFY: __________)
ENTER ALL CODES
THAT APPLY
01
[RESPONDENT]
|___|___||___|___||___|___|___|___|
DATE OF BIRTH
|_____|_____|
AGE
02
[YOUTH]
|___|___||___|___||___|___|___|___|
DATE OF BIRTH
|_____|_____|
AGE
03
|___|___||___|___||___|___|___|___|
DATE OF BIRTH
|_____|_____|
AGE

Westat
B-4
Person #
A3a. .NAME
A3b. RELATION TO CHILD
A3c. STAYING
IN THE HOME
A3d. AGE AND
BIRTHDATE
A3e. SEX
A3f. RACE/ETHNICITY
LIST ALL NAMES
STARTING WITH THE
CAREGIVER YOU ARE
INTERVIEWING ON
LINE 01 FOLLOWED BY
THE YOUTH IN THE
STUDY.
And the relation to [YOUTH]
is…..?
GRANDPARENT ............... 01
SISTER/STEPSISTER .... 02
BROTHER/STEPBRO. ..... 03
AUNT ........................... 04
UNCLE .............................. 05
OTHER RELATIVE
(SPECIFY)______________06
NON-RELATIVE
(SPECIFY)______________07
ENTER CODE
Is this person
currently staying
in the home?
YES………1
NO………..2
ENTER CODE
What is the person’s date of
birth and age?
ENTER DOB/AGE
Is the
person
male or
female?
M........1
F.........2
ENTER
CODE
What race/or ethnic
origin are you/he/she?
You may choose more
than one.
Hispanic/Latino origin…1
African American………2
White……………………3
Native American……….4
Asian……………………5
Some other race or
origin?.......................... 6
(SPECIFY: __________)
ENTER ALL CODES
THAT APPLY
04
|___|___||___|___||___|___|___|___|
DATE OF BIRTH
|_____|_____|
AGE
05
|___|___||___|___||___|___|___|___|
DATE OF BIRTH
|_____|_____|
AGE
06
|___|___||___|___||___|___|___|___|
DATE OF BIRTH
|_____|_____|
AGE

Westat
B-5
Person #
A3a. .NAME
A3b. RELATION TO CHILD
A3c. STAYING
IN THE HOME
A3d. AGE AND
BIRTHDATE
A3e. SEX
A3f. RACE/ETHNICITY
LIST ALL NAMES
STARTING WITH THE
CAREGIVER YOU ARE
INTERVIEWING ON
LINE 01 FOLLOWED BY
THE YOUTH IN THE
STUDY.
And the relation to [YOUTH]
is…..?
GRANDPARENT ............... 01
SISTER/STEPSISTER .... 02
BROTHER/STEPBRO ...... 03
AUNT ........................... 04
UNCLE .............................. 05
OTHER RELATIVE
(SPECIFY)______________06
NON-RELATIVE
(SPECIFY)______________07
ENTER CODE
Is this person
currently staying
in the home?
YES………1
NO………..2
ENTER CODE
What is the person’s date of
birth and age?
ENTER DOB/AGE
Is the
person
male or
female?
M........1
F.........2
ENTER
CODE
What race/or ethnic
origin are you/he/she?
You may choose more
than one.
Hispanic/Latino origin…1
African American………2
White……………………3
Native American……….4
Asian……………………5
Some other race or
origin?.......................... 6
(SPECIFY: __________)
ENTER ALL CODES
THAT APPLY
07
|___|___||___|___||___|___|___|___|
DATE OF BIRTH
|_____|_____|
AGE
08
|___|___||___|___||___|___|___|___|
DATE OF BIRTH
|_____|_____|
AGE

Westat
B-6
B. YOUTH CHARACTERISTICS
EDUCATION
Now, I am going to ask you some questions about [YOUTH].
B1. Is [YOUTH] currently attending school?
YES ......................................................... 1 (GO TO B4)
NO ........................................................... 2
B2. Why not?
DROPPED OUT ...................................... 01
GRADUATED ......................................... 02
ILLNESS ................................................. 03
SUMMER VACATION ............................. 04
SUSPENDED .......................................... 05
INCARCERATED .................................... 06
OTHER [SPECIFY] ________________ 07
B3. What level of school/grade did (he/she) last attend?
BELOW 5TH
GRADE ............................... 01
5TH
GRADE ............................................. 02
6TH
GRADE ............................................. 03
7TH
GRADE ............................................. 04
8TH
GRADE ............................................. 05
9TH
GRADE ............................................. 06
10TH
GRADE ........................................... 07
11TH
GRADE ........................................... 08
12TH
GRADE ........................................... 09
VOCATIONAL ......................................... 10
ATTENDING COLLEGE ......................... 11
GRADUATE SCHOOL ............................ 12
OTHER [SPECIFY]________________ . 13
GO TO B5

Westat
B-7
B4. What level of school or grade is (he/she) currently attending?
BELOW 5TH
GRADE ............................... 01
5TH
GRADE ............................................. 02
6TH
GRADE ............................................. 03
7TH
GRADE ............................................. 04
8TH
GRADE ............................................. 05
9TH
GRADE ............................................. 06
10TH
GRADE ........................................... 07
11TH
GRADE ........................................... 08
12TH
GRADE ........................................... 09
VOCATIONAL ......................................... 10
ATTENDING COLLEGE ......................... 11
GRADUATE SCHOOL ............................ 12 (GO TO B12)
OTHER (SPECIFY)________________ 13
B5. Including [YOUTH]’s current school, how many different schools has (he/she) attended in the last
year?
[BE SURE RESPONDENT INCLUDES CURRENT SCHOOL IN TOTAL]
|___|___|
NUMBER (IF 1, GO TO B7)
B6. Has [YOUTH] had trouble adjusting to new schools?
YES ......................................................... 1
NO ........................................................... 2
B7. Does [YOUTH] have an Individualized Education Program or Plan (IEP)?
YES ......................................................... 1
NO ........................................................... 2
DON’T KNOW ......................................... 8
B8. In general, how would you describe [YOUTH]’s grades?
MOSTLY As ............................................ 01
MOSTLY As AND Bs .............................. 02
MOSTLY Bs ............................................ 03
MOSTLY Bs AND Cs .............................. 04
MOSTLY Cs ............................................ 05
MOSTLY Cs AND Ds .............................. 06
MOSTLY Ds ............................................ 07
MOSTLY Ds AND Fs .............................. 08
MOSTLY Fs ............................................ 09

Westat
B-8
B9. How far do you think [YOUTH] will go in school? Would you say…
Less than high school (1-8 years) ..................................... 01
Some high school (9-11 years) ......................................... 02
(He/she) will finish high school .......................................... 03
(He/she) will get a GED .................................................... 04
(He/she) will complete a vocational program .................... 05
(He/she) will go to college ................................................. 06
(He/she) will graduate from college .................................. 07
(He/she) will get a graduate degree like MA or MS, MBA,
PhD, MD, or law degree) .................................................. 08
B10. During this school year, how many days of school did [YOUTH] miss for reasons other than
accidents, illnesses, or injuries?
0 DAYS ................................................... 1
1-5 DAYS ................................................ 2
6-10 DAYS .............................................. 3
10-20 DAYS ............................................ 4
MORE THAN 20 DAYS ........................... 5
DON’T KNOW ......................................... 8
B11. Has anyone from school contacted you in the past year about problems with [YOUTH]’s grades,
attendance, or behavior?
YES ......................................................... 1
NO ........................................................... 2
HEALTH
Now I want to ask some questions regarding [YOUTH]’s health.
B12. In general, how would you describe [YOUTH] physical health? Would you say it is…?
Excellent.................................................. 1
Good ....................................................... 2
Fair, or ..................................................... 3
Poor? ....................................................... 4
B13. Are you able to get [YOUTH] health care when (he/she) needs it?
YES ......................................................... 1
NO ........................................................... 2
B14. Has [YOUTH] ever been (pregnant/gotten anyone pregnant)?
YES ......................................................... 1
NO ........................................................... 2 (GO TO B16)
B15. Has [YOUTH] (given birth to/fathered) any children?
YES ......................................................... 1
NO ........................................................... 2 (GO TO B16)

Westat
B-9
B15a. How many children has [YOUTH] (given birth to/fathered)?
|___|___|
NUMBER
B16. Does [YOUTH] have any diagnosed physical, emotional, or learning disabilities?
YES ......................................................... 1
NO ........................................................... 2 (GO TO B19)
B17. What kind of disability does (he/she) have? Does he/she have….(CIRCLE ALL THAT APPLY)
A developmental delay, ........................................ 01
(PROBE: Please name the specific disability/condition)
SPECIFY _________________________________________
An emotional disturbance, ................................... 02
(PROBE: Please name the specific disability/condition)
SPECIFY _________________________________________
A learning disability, ............................................. 03
(PROBE: Please name the specific disability/condition)
SPECIFY _________________________________________
A hearing, speech or sight impairment, or ........... 04
(PROBE: Please name the specific disability/condition)
SPECIFY _________________________________________
Some other disabling condition? ......................... 05
(PROBE: Please name the specific disability/condition)
SPECIFY _________________________________________
B18. Are you able to get help for [YOUTH] disability or condition?
YES ......................................................... 1
NO ........................................................... 2
B19. In the past 30 days, has [YOUTH] been taken to the emergency room at a hospital or clinic for a
health problem or medical emergency?
YES ......................................................... 1
NO ........................................................... 2 (GO TO B20)
B19a. How many times?
|___|___|
NUMBER
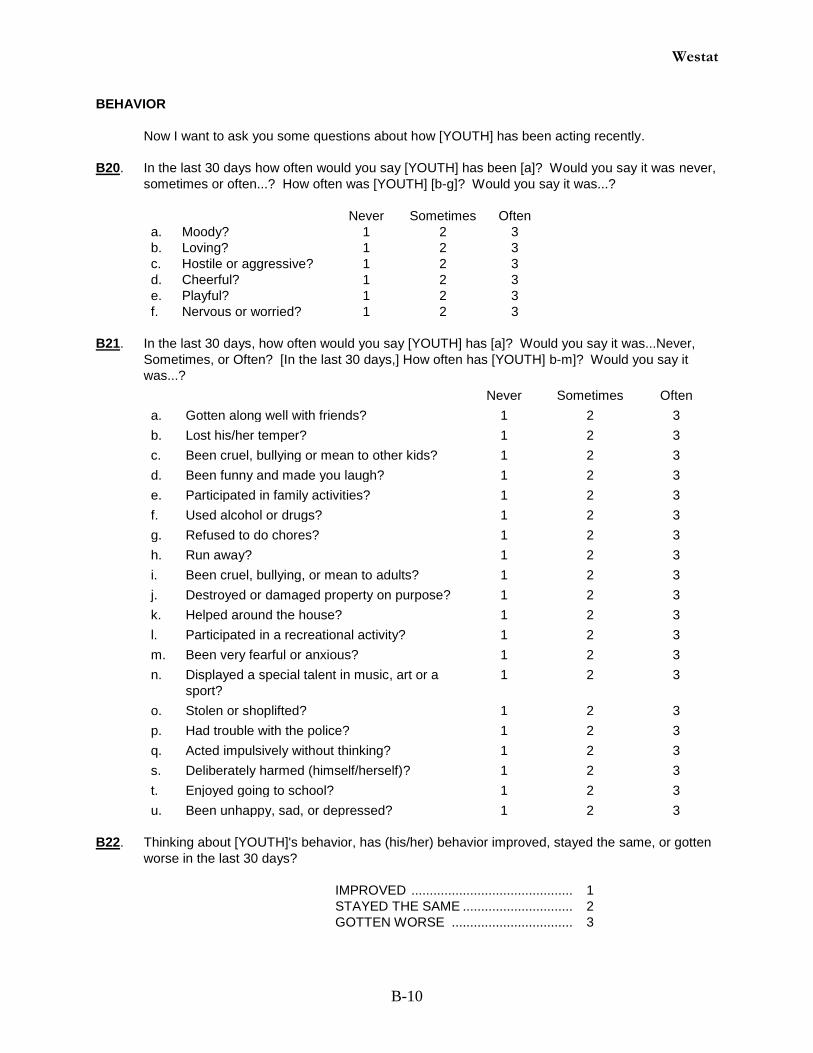
Westat
B-10
BEHAVIOR
Now I want to ask you some questions about how [YOUTH] has been acting recently.
B20. In the last 30 days how often would you say [YOUTH] has been [a]? Would you say it was never,
sometimes or often...? How often was [YOUTH] [b-g]? Would you say it was...?
Never Sometimes Often
a. Moody? 1 2 3
b. Loving? 1 2 3
c. Hostile or aggressive? 1 2 3
d. Cheerful? 1 2 3
e. Playful? 1 2 3
f. Nervous or worried? 1 2 3
B21. In the last 30 days, how often would you say [YOUTH] has [a]? Would you say it was...Never,
Sometimes, or Often? [In the last 30 days,] How often has [YOUTH] b-m]? Would you say it
was...?
Never Sometimes Often
a. Gotten along well with friends? 1 2 3
b. Lost his/her temper? 1 2 3
c. Been cruel, bullying or mean to other kids? 1 2 3
d. Been funny and made you laugh? 1 2 3
e. Participated in family activities? 1 2 3
f. Used alcohol or drugs? 1 2 3
g. Refused to do chores? 1 2 3
h. Run away? 1 2 3
i. Been cruel, bullying, or mean to adults? 1 2 3
j. Destroyed or damaged property on purpose? 1 2 3
k. Helped around the house? 1 2 3
l. Participated in a recreational activity? 1 2 3
m. Been very fearful or anxious? 1 2 3
n. Displayed a special talent in music, art or a
sport?
1 2 3
o. Stolen or shoplifted? 1 2 3
p. Had trouble with the police? 1 2 3
q. Acted impulsively without thinking? 1 2 3
s. Deliberately harmed (himself/herself)? 1 2 3
t. Enjoyed going to school? 1 2 3
u. Been unhappy, sad, or depressed? 1 2 3
B22. Thinking about [YOUTH]'s behavior, has (his/her) behavior improved, stayed the same, or gotten
worse in the last 30 days?
IMPROVED ............................................ 1
STAYED THE SAME .............................. 2
GOTTEN WORSE ................................. 3

Westat
B-11
SOCIAL SUPPORT
I want to ask you a few questions about who cares for [YOUTH].
B23. Besides yourself, are there other adults who live with you who regularly care for and supervise
[YOUTH]?
YES ......................................................... 1
NO ........................................................... 2
B24. Are there any relatives or friends outside of your household who regularly care for and supervise
[YOUTH]?
YES ......................................................... 1
NO ........................................................... 2
B25. Are there other people in your family who could take care of [YOUTH] in case you became ill or
could not take care of (him/her)?
YES ......................................................... 1
NO ........................................................... 2 (GO TO B27)
................................................................
B25a. About how many people could take care of (him/her)?
|___|___|
NUMBER
B26. You just told me about a person(s) who would help you take care of [YOUTH]. Can you tell me
how this person is related to you? If you told me more than one person would help, tell me how
the person most likely to take care of [YOUTH] is related to you?
_____________________________________________
RELATION TO CAREGIVER

Westat
B-12
CONTINUITY
B27. How long has [YOUTH] lived in your home?
|___|___| |___|___|
YEARS MONTHS
B28. Has [YOUTH] spent more than two weeks at a time in any other household in the past year?
YES ......................................................... 1
NO ........................................................... 2 (GO TO B32)
B29. How many times has this happened in the past year? Would you say...?
Once ........................................................ 1
Twice ....................................................... 2
Three times ............................................. 3
Four or more times .................................. 4
B30. Was this with (his/her) family members?
YES ......................................................... 1
NO ........................................................... 2
B31. Why did [YOUTH] live in another household for more than two weeks? Was it because [a-h]?
YES NO
a. You were on vacation? 1 2
b. You were ill or there was an illness in the family? 1 2
c. Someone else wanted to spend time with (him/her)? 1 2
d. (He/She) was misbehaving? 1 2
e. You needed a break 1 2
f. You could not afford to keep (him/her)? 1 2
g. The child welfare agency moved (him/her) into a different
household?
1 2
h. Something else? (SPECIFY) _____________________________ 1 2
B32. How much longer do you think [YOUTH] will be living with you? Would you say…?
A couple of weeks longer, ....................... 01
A couple of months longer, ..................... 02
A year longer, .......................................... 03
A couple of years longer, ........................ 04
Until (he/she) is 18? ................................ 05
Until (he/she) is 21 .................................. 06
Until some other time
(SPECIFY)______________________ .. 07

Westat
B-13
C. CAREGIVER STATUS, PARENTING SKILLS AND RESOURCES
PHYSICAL HEALTH C1. Now, I want to ask you some questions about how you are doing. In general, how would you
describe your physical health? Would you say it is…?
Excellent.................................................. 1 Good ....................................................... 2 Fair .......................................................... 3 Poor ......................................................... 4
C2. Are you able to get health care for yourself when you need it?
YES ......................................................... 1 NO ........................................................... 2
C3. Do you have any physical or emotional disabilities?
YES ......................................................... 1 NO ........................................................... 2 (GO TO C5)
C4. Does your disability make it difficult for you to care for any of the children who live with you?
YES ......................................................... 1 NO ........................................................... 2
MENTAL HEALTH C5. Now, I want to ask you about problems and complaints that people sometimes have. I am going
to ask you how much that problem has bothered or distressed you during the past week, including today.
How much were you bothered by [a-m]?
(USE RESPONSE CARD)
Would you say it was...?
Not at
all
A little
bit Moderately
Quite a
bit Extremely
a. Feeling low in energy or slowed down? 1 2 3 4 5
b. Thoughts of ending your life? 1 2 3 4 5
c. Loss of sexual interest or pleasure? 1 2 3 4 5
d. Crying easily? 1 2 3 4 5
e. A feeling of being trapped or caught? 1 2 3 4 5
f. Blaming yourself for things? 1 2 3 4 5
g. Feeling lonely? 1 2 3 4 5
h. Feeling blue? 1 2 3 4 5
i. Worrying too much about things? 1 2 3 4 5
j. Feeling no interest in things? 1 2 3 4 5
k. Feeling helpless about the future? 1 2 3 4 5
l. Feeling everything is an effort? 1 2 3 4 5
m. Feelings of worthlessness? 1 2 3 4 5

Westat
B-14
C6. Now, I want to ask you about any problems you have had doing certain things around the house
or taking care of [YOUTH] in your household. As I read each problem tell me whether it applies.
In the last 30 days, have you had difficulty...?
YES NO
a. Doing routine household chores, like cleaning, 1 2
b. Preparing meals, 1 2
c. Spending time doing things with [YOUTH], 1 2
d. Helping [YOUTH] with problems, 1 2
e. Taking [YOUTH] to a doctor or dentist appointment, or 1 2
f. Taking [YOUTH] shopping for clothes or school supplies? 1 2
CAREGIVER’S SOCIAL NETWORK
Now, I want to ask you about people who help you and give you support when you need it. C7. As I read each way they might offer support, please tell me whether it applies. Are there any adult family members who live with you who support you by...? (IF NO FAMILY MEMBERS LIVE WITH CAREGIVER, MARK “3” (N/A) FOR EACH)
YES NO N/A
a. Comforting you when you are upset, 1 2 3
b. Talking to you about your feelings, 1 2 3
c. Helping you with child care, 1 2 3
d. Helping with transportation, 1 2 3
e. Lending you money when you need it, 1 2 3
f. Helping with shopping, or 1 2 3
g. Helping when someone is ill? 1 2 3
C8. What about any relatives or friends who do NOT live with you? As I read each way they might
offer support, please tell me whether it applies.
Are there any relatives or close friends outside of your household who support you by...?
YES NO
a. Comforting you when you are upset, 1 2
b. Talking to you about your feelings, 1 2
c. Helping you with child care, 1 2
d. Helping with transportation, 1 2
e. Lending you money when you need it, 1 2
f. Helping with shopping, or 1 2
g. Helping when someone is ill? 1 2

Westat
B-15
C9. Do you attend a church, temple or mosque?
YES ......................................................... 1
NO ........................................................... 2 (GO TO C11) C10. What about support or help from others in your church, temple, or mosque? As I read each way
they might offer support, please tell me whether it applies.
Are there any church members that support you by...?
YES NO
a. Comforting you when you are upset, 1 2
b. Talking to you about your feelings, 1 2
c. Helping you with child care, 1 2
d. Helping with transportation, 1 2
e. Lending you money when you need it, 1 2
f. Providing food for you and/or your family 1 2
g. Providing clothes to you or your family 1 2
h. Helping with shopping, or 1 2
i. Helping when someone is ill? 1 2
C11. Do you have any relatives who live near you?
YES ......................................................... 1
NO ........................................................... 2 (GO TO C13) C12. How often do you see at least one of these relatives? Would you say...?
Almost every day .................................... 1
About once a week ................................. 2
Several times a month ............................ 3
Once a month or less .............................. 4
CHILD REARING
Now I want to ask you some things that affect how children grow up.
C13. Do you have household rules you ask [YOUTH] to follow?
YES ......................................................... 1
NO ........................................................... 2 (GO TO C15)

Westat
B-16
C14. Please answer yes or no to the following items. In your house, are there rules or routines for
[YOUTH] about…?
YES NO
a. How late (he/she) can stay out? 1 2
b. When (he/she) can have friends at the house? 1 2
c. Doing (his/her) homework? 1 2
d. How long (he/she) can talk on the telephone? 1 2
e. How many hours [YOUTH] can use the computer? 1 2
f. What [YOUTH] can access online or the games (he/she) plays on
the computer?
1 2
g. Leaving a note when (he/she) leaves the house and you’re not home 1 2
h. What chores [YOUTH] does? 1 2
C15. In the last 30 days, how often have you [a]? Would you say it was...? In the last 30 days, how
often have you [b-g]? Would you say it was...?
Never Sometimes Often
a. Had difficulty controlling (him/her)? 1 2 3
b. Showed that you liked having (him/her) around? 1 2 3
c. Seen (his/her) behavior get worse when you punished
(him/her)?
1 2 3
d. Comforted [YOUTH] when (he/she) had problems? 1 2 3
e. Made (him/her) feel loved? 1 2 3
f. Praised [YOUTH] for doing something really well? 1 2 3
g. Hesitated to enforce rules because you feared (he/she)
might harm someone in your household?
1 2 3
C16. Other than [YOUTH] living here now, have you ever raised any other children who were not your
birth children?
YES ......................................................... 1
NO ........................................................... 2 (GO TO C18)
C17. How many other children have you raised, excluding your own? [INCLUDE DECEASED]
|___|___|
NUMBER
C18. How many children have you (given birth to/fathered)? [INCLUDE DECEASED]
|___|___|
NUMBER
C19. Were you ever [a-c]?
YES NO
a. In foster care? 1 2
b. Adopted? 1 2
c. Informally taken care of by relatives? 1 2

Westat
B-17
C20. Were you born in the United States?
YES ...................................................... 1 (GO TO SECTION D)
NO ........................................................ 2
C21. What country were you born in?
__________________________________
COUNTRY NAME
C22. How many years have you lived in the United States?
|___|___|
NUMBER OF YEARS

Westat
B-18
D. DYNAMICS OF FAMILY SITUATION
CAREGIVER’S RELATIONSHIPS
D1. Below is a series of statements about your relationship with [YOUTH]. For each statement,
please tell me the number of the category that most applies to your relationship with (him/her).
(USE RESPONSE CARD)
Definitely
Does Not
Apply
Not
Really
Neutral,
Not Sure
Applies
Sometimes
Definitely
Applies
a. I share an affectionate, warm
relationship with [YOUTH]. 1 2 3 4 5
b. (He/she) and I always seem to be
struggling with each other. 1 2 3 4 5
c. If upset, (he/she) will seek comfort
from me. 1 2 3 4 5
d. (He/she) is uncomfortable with
physical affection or touch from me. 1 2 3 4 5
e. (He/she) values (his/her) relationship
with me. 1 2 3 4 5
f. When I praise (him/her), (he/she)
beams with pride. 1 2 3 4 5
g. (He/she) spontaneously shares
information about (himself/herself). 1 2 3 4 5
h. (He/she) easily becomes angry with
me. 1 2 3 4 5
i. It is easy to be in tune with what
(he/she) is feeling. 1 2 3 4 5
j. (He/she) remains angry or is
resistant after being disciplined. 1 2 3 4 5
k. Dealing with (him/her) drains my
energy. 1 2 3 4 5
l. When (he/she) is in a bad mood, I
know we’re in for a long and difficult
day. 1 2 3 4 5
m. (His/her) feelings toward me can be
unpredictable or can change
suddenly. 1 2 3 4 5
n. (He/she) is sneaky or manipulative
with me. 1 2 3 4 5
o. (He/she) openly shares (his/her)
feelings and experiences with me. 1 2 3 4 5

Westat
B-19
D2. What is your current marital status?
MARRIED................................................ 1 (GO TO D4)
SEPARATED .......................................... 2
DIVORCED ............................................. 3
WIDOWED .............................................. 4
NEVER MARRIED .................................. 5
D3. Are you currently in a relationship with someone living in your home whom you consider to be
your partner?
YES ......................................................... 1
NO ........................................................... 2 (GO TO
D6INTRO)
D4. Now I want to ask about how things are going with your spouse or partner. In the last 30 days,
how have you been getting along with your spouse or partner? Would you say that overall you
have gotten along…?
Very well,................................................. 1
Well, or .................................................... 2
Not very well? ......................................... 3
D5. Was your spouse or partner living with you when [YOUTH] came to live with you?
YES ......................................................... 1
NO ........................................................... 2 (GO TO D6INTRO)
NOT APPLICABLE ............................. … 3 (GO TO D6INTRO)
D5a. Comparing how you are getting along now with your spouse or partner to how you were getting
along before [YOUTH] came to stay with you, would you say that overall things are...?
Better now than before, ........................... 1
About the same now as before, or .......... 2
Not as good now as before? ................... 3
D6INTRO: Now I want to ask you about your family. I am talking about family members who live with you
and those who live somewhere else.
D6. Comparing how you are getting along now with your family to how you were getting along before
[YOUTH] lived with you, would you say that overall things are...?
Better now than before, ........................... 1
About the same now as before, or .......... 2
Not as good now as before? ................... 3
D7. Before you took over as caregiver for [YOUTH], did the other members of your family agree that
[YOUTH] should be living with you?
YES ......................................................... 1
NO ........................................................... 2

Westat
B-20
E. CAREGIVER EMPLOYMENT AND HOUSEHOLD FINANCIAL SITUATION
E1. Are you currently…..?
Working full-time (35 hrs or more per week) ..................... 01
Working part-time .............................................................. 02
Looking for work ................................................................ 03
Laid off from work.............................................................. 04
In school or training/not working ....................................... 05
Keeping house .................................................................. 06
Retired ............................................................................... 07
Something else (SPECIFY) ______________________ . 08
E2. Please look at this card and tell me which of these amounts comes closest to your total
household income from all sources for [LAST CALENDAR YEAR]. You can tell me the letter...?
(USE RESPONSE CARD)
A. Less than $1,000, ............................. 01
B. $1,000- $2,499, ................................ 02
C. $2,500- $4,999, ................................ 03
D. $5,000- $9,999, ................................ 04
E. $10,000- $19,999, ............................ 05
F. $20,000-$39,999, ............................. 06
G. $40,000-$59,999, or ......................... 07
H. $60,000 or more? ............................. 08
E3. For each of the following sources of support, tell whether you received each of the following for
the care of [YOUTH] last month.
Did you receive [a-f]?
YES NO
a. Adoption or guardianship subsidy 1 2
b. Foster care boarding payment 1 2
e. Welfare or TANF checks 1 2
d. Child support payments 1 2
e. SSI (Supplementary Security Income) 1 2
f. Social Security Survivor Benefit 1 2
E4. I have some questions about how things are with you money-wise.
In the last 30 days, have you had any difficulty...?
YES NO
a. Paying your rent or mortgage 1 2
b. Paying your electric and heating bills 1 2
c. Buying enough food for your family 1 2
d. Buying clothes for [YOUTH]? 1 2
E5. In the last 30 days, overall, have you had enough money to maintain your household?
YES ......................................................... 1
NO ........................................................... 2
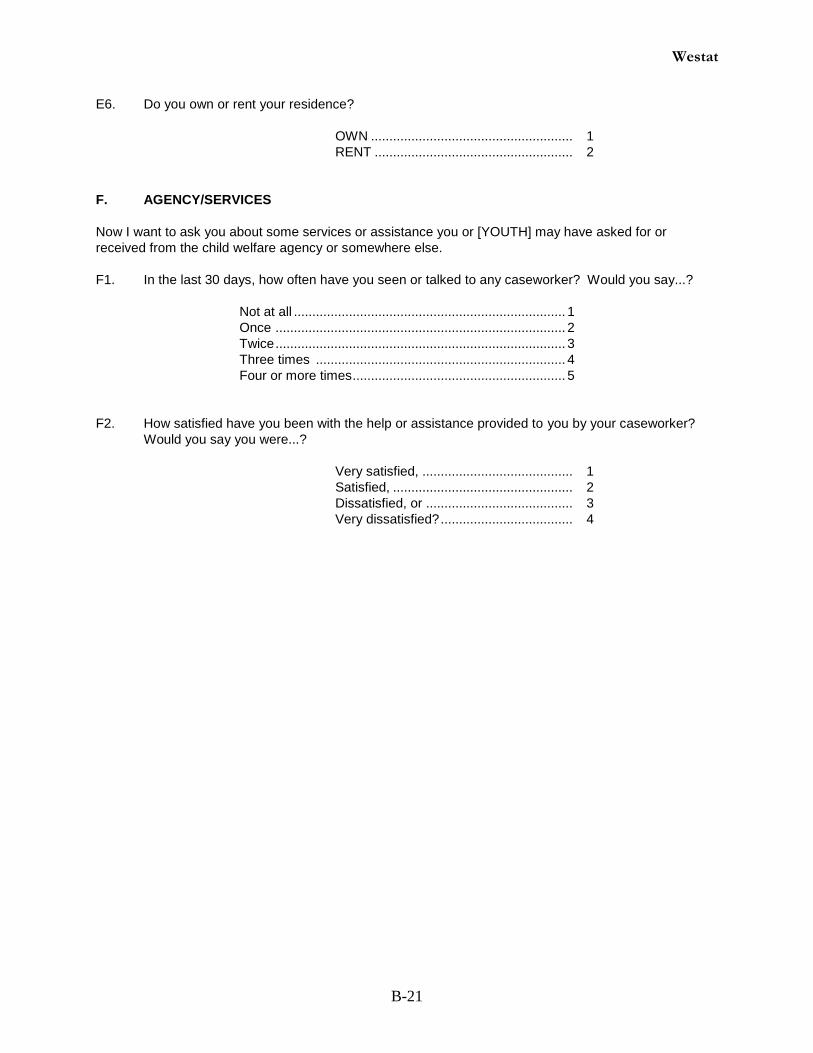
Westat
B-21
E6. Do you own or rent your residence?
OWN ....................................................... 1
RENT ...................................................... 2
F. AGENCY/SERVICES
Now I want to ask you about some services or assistance you or [YOUTH] may have asked for or
received from the child welfare agency or somewhere else.
F1. In the last 30 days, how often have you seen or talked to any caseworker? Would you say...?
Not at all .......................................................................... 1
Once ............................................................................... 2
Twice ............................................................................... 3
Three times .................................................................... 4
Four or more times .......................................................... 5
F2. How satisfied have you been with the help or assistance provided to you by your caseworker?
Would you say you were...?
Very satisfied, ......................................... 1
Satisfied, ................................................. 2
Dissatisfied, or ........................................ 3
Very dissatisfied? .................................... 4

Westat
B-2
2
F3. Now, I am going to ask you about some services that you may have received or tried to get for yourself, either from the child welfare
agency or somewhere else in the last year.
A. B.
In the last year,
have you ever
been referred for
or tried to get…?
Have you
received it?
Services YES NO YES NO
a. Family counseling 1 2 1 2
b. Individual counseling for yourself 1 2 1 2
c. Respite care 1 2 1 2
d. Housing assistance 1 2 1 2
e. Help looking for a job 1 2 1 2
f. Job training 1 2 1 2
g. Adult education 1 2 1 2
h. Legal assistance 1 2 1 2
i. Alcohol or drug treatment 1 2 1 2
j. TANF or other public aid 1 2 1 2
k. WIC 1 2 1 2
l. Food stamps 1 2 1 2
m. Social security disability payments 1 2 1 2
n. Help to pay the rent, electricity, or phone bill 1 2 1 2
o. Other services (SPECIFY) ________________________________ 1 2 1 2

Westat
B-2
3
F4. Now, I am going to ask you about some services that [YOUTH] may have received or tried to get, either from the child welfare agency or
somewhere else in the last year.
A. B. C.
In the last year,
has [YOUTH] ever
been referred for
or tried to get…?
Has [YOUTH]
received it?
Did the child
welfare agency
help [YOUTH]
to get?
Services YES NO YES NO YES NO
a. Individual counseling 1 2 1 2 1 2
b. Health care 1 2 1 2 1 2
c. Hospitalization 1 2 1 2 1 2
d. Medical card 1 2 1 2 1 2
e. Alcohol or drug treatment 1 2 1 2 1 2
f. Tutoring 1 2 1 2 1 2
g. College stipend 1 2 1 2 1 2
h. Employment services or job support/training 1 2 1 2 1 2
i. Employment stipend 1 2 1 2 1 2
j. Life skills services 1 2 1 2 1 2
k. Housing assistance 1 2 1 2 1 2
l. Family counseling 1 2 1 2 1 2
m. Social security payments 1 2 1 2 1 2
n. Other (SPECIFY)_______________________________ 1 2 1 2 1 2

Westat
B-24
B-2
4
G. DECISIONS ON PERMANENCY
G1. Has your caseworker held a family meeting to talk about a permanent living arrangement for
[YOUTH]?
YES ......................................................... 1
NO ........................................................... 2 (GO TO G7)
G2. How many family meetings have been held in the last year?
One meeting .......................................... 1
Two meetings .......................................... 2
Three or more meetings .......................... 3
G3. Who usually attended the family meetings?
YES NO
a. Did you attend? 1 2
b. Did [YOUTH]? 1 2
c. Did [YOUTH]’s birth mother attend? 1 2
d. Did [YOUTH]’s biological father attend? 1 2
e. Did other family members attend?
[SPECIFY] _____________________
1 2
G4. Which of the following topics were discussed at the family meetings? As I read each topic,
please tell me whether it was discussed.
YES NO
a. Getting support from family and community? 1 2
b. Future service needs for [YOUTH]? 1 2
c. Future service needs for the family? 1 2
d. Adoption or guardianship of [YOUTH]? 1 2
e. Terminating parental rights? 1 2
f. Visitation with birth/biological parent and [YOUTH]? 1 2
e. Any other service?
[SPECIFY] ____________________
1 2

Westat
B-25
B-2
5
G5. Of the topics you just identified [REFER TO THOSE CIRCLED ABOVE] would you say that they
were very important, somewhat important, or not important to decisions made about [YOUTH]’s
permanency?
Very
Important
Somewhat
Important
Not
Important
Not
discussed
a. Getting support from family and community 1 2 3 4
b. Future needs for services for [YOUTH] 1 2 3 4
c. Future needs for services for you and other
members of the family 1 2 3 4
d. Adoption or guardianship of [YOUTH] 1 2 3 4
e. Terminating parental rights 1 2 3 4
f. Visitation with birth parent and [YOUTH] 1 2 3 4
g. Any other service (SPECIFY) 1 2 3 4
IF G5 b, c, OR g WERE IDENTIFIED (Service needs) AS VERY OR SOMEWHAT IMPORTANT, GO
TO G6, ELSE GO TO G7
G6. What specific services were most important in discussing decisions on permanency?
_______________________________________________________________________
_______________________________________________________________________
_______________________________________________________________________
G7. Have you attended a Caregiver Institute workshop for foster parents in the past year?
YES ......................................................... 1
NO ........................................................... 2 (GO TO BOX G1)
G7a. Did you learn about the importance of permanency for older youth at the workshop?
YES ......................................................... 1
NO ........................................................... 2
BOX G1
(SEE A1 on p. 2.) IF YOUTH HAS BEEN REUNIFIED WITH A PARENT, AND PARENT IS
RESPONDENT,
GO TO SECTION I

Westat
B-26
B-2
6
G8. In the last year, has your caseworker talked to you about [YOUTH] going home to live with
(his/her) birth parents?
YES ......................................................... 1
NO ........................................................... 2
G9. In the last year, has your caseworker talked to you about legally adopting [YOUTH]?
YES ......................................................... 1
NO ........................................................... 2 (GO TO G12)
G10. Approximately how many times in the last year have you talked about or discussed adoption with
a caseworker?
|___|___|
NUMBER OF TIMES
G11. When was the last time adoption was mentioned to you by a caseworker? Was it...?
A week ago, ............................................ 01
A month ago, ........................................... 02
2 to 3 months ago, .................................. 03
4 to 6 months ago, or .............................. 04
7 to 12 months ago ................................. 05
G12. In the last year, has your caseworker talked to you about becoming a legal guardian under the
subsidized guardianship program for [YOUTH]?
YES ......................................................... 1
NO ........................................................... 2 (GO TO BOX G2)
G13. Approximately how many times in the last year have you discussed this program with a
caseworker?
|___|___|
NUMBER OF TIMES
G14. When was the last time the subsidized guardian program was mentioned to you by a
caseworker? Was it...?
A week ago, ............................................ 01
A month ago, ........................................... 02
2 to 3 months ago, .................................. 03
4 to 6 months ago, or .............................. 04
7 to 12 months ago ................................. 05
BOX G2
IF GROUP = B (blue label) GO TO G16

Westat
B-27
B-2
7
G15. Did your caseworker tell you that [YOUTH] can continue receiving transition services for teens
including employment, college, and life skills, even though you become (his/her) adoptive parent
or legal guardian?
YES ......................................................... 1
NO ........................................................... 2
G16. Did your caseworker pressure you to adopt or become [YOUTH]’s legal guardian?
YES ......................................................... 1
NO ........................................................... 2
G17. Have you made a decision on whether to adopt [YOUTH] or become (his/her) legal guardian?
YES, HAVE MADE A DECISION ............ 1
NO, HAVE NOT DECIDED ..................... 2

Westat
B-2
8
G18. Which of the following things have you been considering in deciding about adopting or becoming a legal guardian?
A. Did you
consider [a-r]?
B. How important was this in your decision?
Was it...?
Items for Consideration
YES NO
Very
Important
Somewhat
Important
Not Very
Important
Not At All
Important
a. Services that [YOUTH] may be eligible for?
ASK: I’d like to ask you about some specific services….did
you consider…..
1 2 1 2 3 4
b. Youth in College, a program for college/vocational education
assistance?
1 2 1 2 3 4
c. Youth in Employment, a program providing employment
preparation and assistance?
1 2 1 2 3 4
d. Life Skills Training, a program that teaches life skills for living
independently?
1 2 1 2 3 4
e. Housing Cash Assistance, a program that assists with finding,
securing, and paying for housing and furniture?
1 2 1 2 3 4
f. Housing Advocacy, a program that assists in finding housing
and helping to prepare for living independently?
1 2 1 2 3 4
g. Education and Training Vouchers, a program that provides
education and vocational assistance for youth in
adoption/subsidized guardianship?
1 2 1 2 3 4
h. Community College Tuition Payment, a program that provides
payment assistance for community college?
1 2 1 2 3 4
i. Youth in Scholarship, a program that provides merit-based
college scholarship?
1 2 1 2 3 4
j. Northern Illinois University Education Access Project, a
program that provides educational advocacy for former foster
care youth?
1 2 1 2 3 4
k. Want less involvement with the child welfare agency?
1 2 1 2 3 4
l. Want the caseworker to stop visiting your home?
1 2 1 2 3 4
m. Want to be free to make decisions about (him/her)?
1 2 1 2 3 4
n. Believe the program was best for (him/her)?
1 2 1 2 3 4
o. Want to have the legal right to care for (him/her)?
1 2 1 2 3 4

Westat
B-2
9
A. Did you
consider [a-r]?
B. How important was this in your decision?
Was it...?
Items for Consideration
YES NO
Very
Important
Somewhat
Important
Not Very
Important
Not At All
Important
p. Want to make your own decisions about how to care for
(him/her)?
1 2 1 2 3 4
q. Need the child welfare agency to help with youth’s problems?
1 2 1 2 3 4
r. Want to provide a more permanent legal arrangement for
(him/her)?
1 2 1 2 3 4
s. Want to insure that (he/she) would not be taken away?
1 2 1 2 3 4
t. Need someone else to take care of (him/her)?
1 2 1 2 3 4
u. Need (him/her) to live with (his/her) parents?
1 2 1 2 3 4
v. Want to have the child welfare agency involved to protect
(him/her)?
1 2 1 2 3 4
w. Want to continue to have help from your caseworker?
1 2 1 2 3 4
x. Need the child welfare agency to help with medical
assistance?
1 2 1 2 3 4
y. Like having a caseworker to help you?
1 2 1 2 3 4
z. Believe that DCFS would pay you a subsidy?
1 2 1 2 3 4
aa. Think it would be too difficult to care for (him/her)] when
(he/she) got older?
1 2 1 2 3 4
bb. Think you would lose other subsidies or benefits?
1 2 1 2 3 4
cc. Think about other things (SPECIFY)?
1 2 1 2 3 4
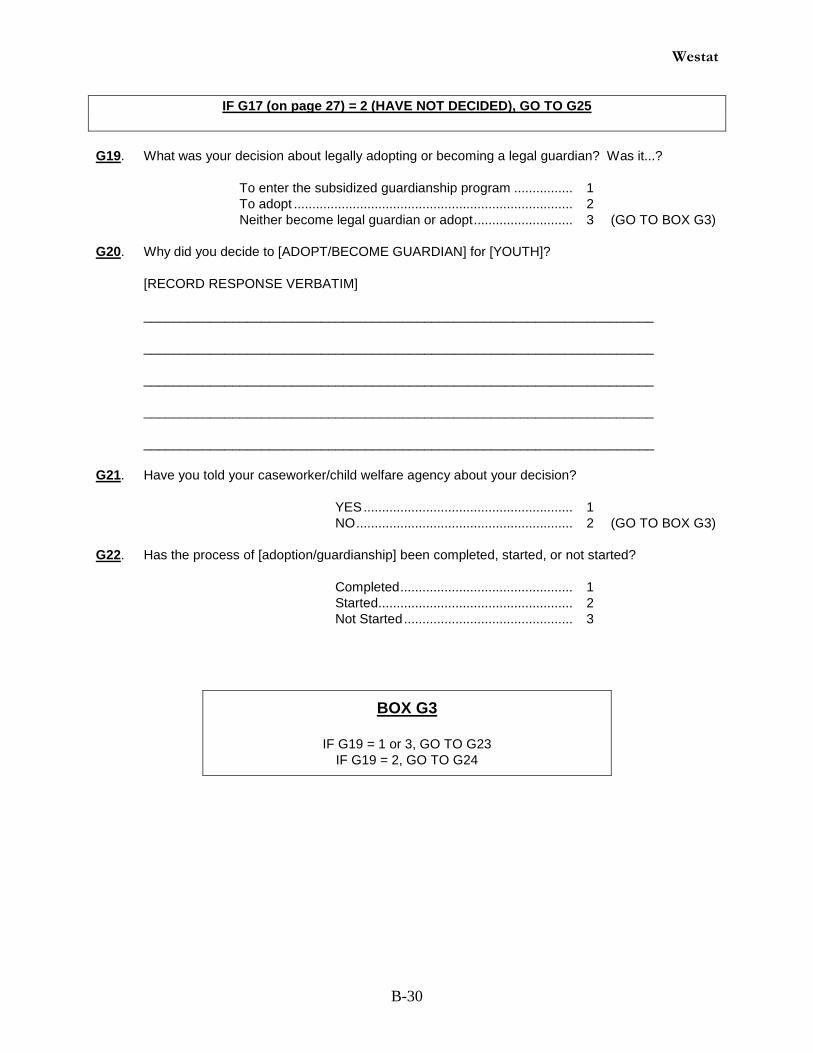
Westat
B-30
IF G17 (on page 27) = 2 (HAVE NOT DECIDED), GO TO G25
G19. What was your decision about legally adopting or becoming a legal guardian? Was it...?
To enter the subsidized guardianship program ................ 1
To adopt ............................................................................ 2
Neither become legal guardian or adopt ........................... 3 (GO TO BOX G3)
G20. Why did you decide to [ADOPT/BECOME GUARDIAN] for [YOUTH]?
[RECORD RESPONSE VERBATIM]
_____________________________________________________________________
_____________________________________________________________________
_____________________________________________________________________
_____________________________________________________________________
_____________________________________________________________________
G21. Have you told your caseworker/child welfare agency about your decision?
YES ......................................................... 1
NO ........................................................... 2 (GO TO BOX G3)
G22. Has the process of [adoption/guardianship] been completed, started, or not started?
Completed ............................................... 1
Started..................................................... 2
Not Started .............................................. 3
BOX G3
IF G19 = 1 or 3, GO TO G23
IF G19 = 2, GO TO G24

Westat
B-31
G23. Why aren’t you going to adopt [YOUTH]. As I read each reason, please tell me whether it
applies.
Is it because…?
YES NO
a. You don’t have enough information about adoption 1 2
b. You can’t afford to adopt (him/her)] 1 2
c. (He/she) is too old 1 2
d. You are too old 1 2
e. [YOUTH] does not want to be adopted 1 2
f.
g.
(He/she) has too many problems
(He/she) will lose needed services
1
1
2
2
h. (He/she) is already related by blood 1 2
i. (His/her) parents will soon be able to take care of (him/her) 1 2
j. You already raised your own children 1 2
k. (He/she) is too difficult 1 2
l. You don’t want to adopt, 1 2
m. You prefer becoming a guardian 1 2
n. Some other reason? (SPECIFY) ______________________ 1 2
IF a. = 1 ABOVE, GO TO G23a. BELOW, ELSE GO TO BOX G4
G23a. What other information do you need? As I read each item, please tell me whether it applies.
Do you need information about...?
YES NO
a. How much money you would receive, 1 2
b. What services or help is available to you or [YOUTH] 1 2
c. What services or help you or [YOUTH] might lose 1 2
d. What papers you would have to sign, 1 2
e. What is involved in adopting (him/her), or 1 2
f. Something else? (SPECIFY) _________________________________ 1 2
BOX G4
IF G19 (on page 30) =1, GO TO G25
IF G19 (on page 30) = 3, GO TO G24
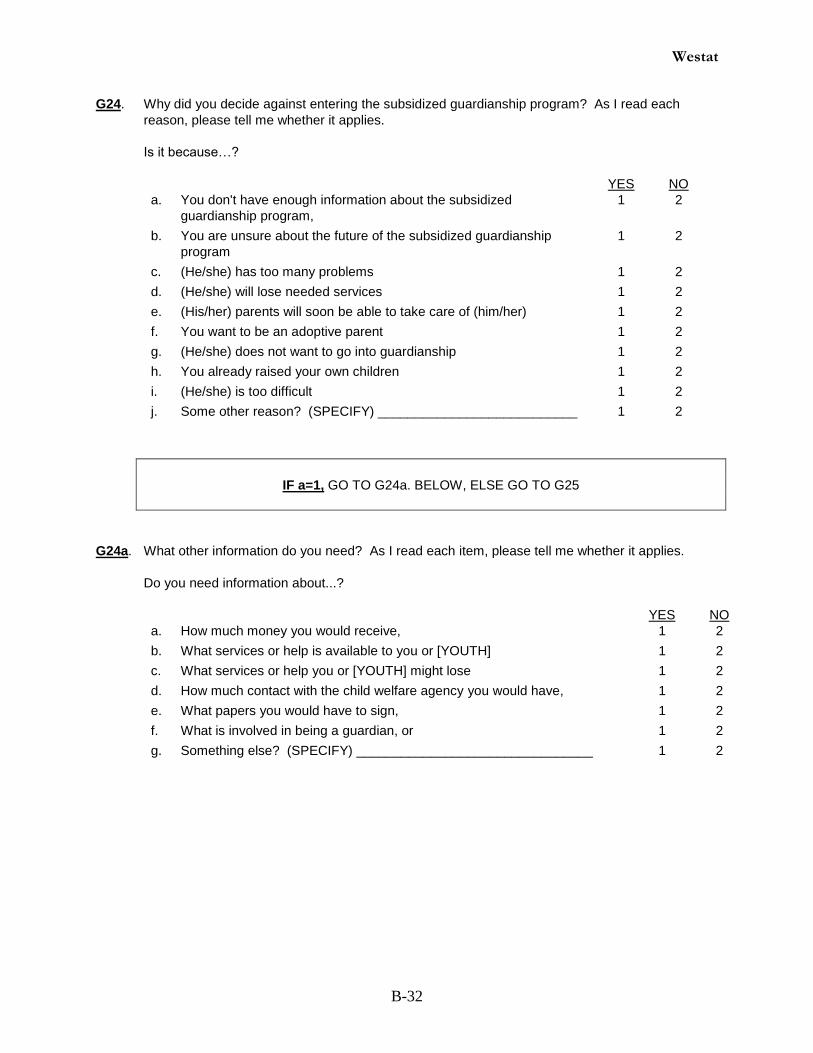
Westat
B-32
G24. Why did you decide against entering the subsidized guardianship program? As I read each
reason, please tell me whether it applies.
Is it because…?
YES NO
a. You don't have enough information about the subsidized
guardianship program,
1 2
b. You are unsure about the future of the subsidized guardianship
program
1 2
c. (He/she) has too many problems 1 2
d. (He/she) will lose needed services 1 2
e. (His/her) parents will soon be able to take care of (him/her) 1 2
f. You want to be an adoptive parent 1 2
g. (He/she) does not want to go into guardianship 1 2
h. You already raised your own children 1 2
i. (He/she) is too difficult 1 2
j. Some other reason? (SPECIFY) ___________________________ 1 2
IF a=1, GO TO G24a. BELOW, ELSE GO TO G25
G24a. What other information do you need? As I read each item, please tell me whether it applies.
Do you need information about...?
YES NO
a. How much money you would receive, 1 2
b. What services or help is available to you or [YOUTH] 1 2
c. What services or help you or [YOUTH] might lose 1 2
d. How much contact with the child welfare agency you would have, 1 2
e. What papers you would have to sign, 1 2
f. What is involved in being a guardian, or 1 2
g. Something else? (SPECIFY) ________________________________ 1 2

Westat
B-33
G25. Now I want to ask you about your beliefs about adoption and taking care of children. As I read
each description, please tell me whether you strongly agree, agree, disagree, or strongly
disagree.
(USE RESPONSE CARD)
Strongly
Agree
Agree
Disagree
Strongly
Disagree
a.
Adoption is really best only for young children. 1 2 3 4
b.
Adoption by a relative stirs up too much trouble in the
family. 1 2 3 4
c.
Adoption is best no matter how old the child. 1 2 3 4
d.
You are too old to adopt. 1 2 3 4
e.
Adoption takes too long. 1 2 3 4
f.
Adoption is really only for children who aren't related to
you. 1 2 3 4
g.
Adoption gives children greater security even if they are
related by blood. 1 2 3 4
h.
Children who must be removed from their birth parents
should be placed with relatives rather than non-
relatives. 1 2 3 4
i.
Families have a moral duty to take care of their own kin
regardless of whether government pays for the cost of
care. 1 2 3 4
j.
Placement in foster care for children should be the last
resort only after efforts have been made to place
children with their kin. 1 2 3 4
G26. Do you think adoption and guardianship are equally permanent?
YES ......................................................... 1
NO ........................................................... 2
G26a. Why do you think this? [RECORD RESPONSE VERBATIM] _________________
________________________________________________________________________
________________________________________________________________________

Westat
B-34
IF G22=1 ASK THE QUESTIONS BELOW. OTHERWISE, GO TO SECTION H.
G27. Has [adoption/guardianship] made your relationship with [YOUTH]…
Better ..................................................... 1
Worse, or .............................................. 2
About the same ..................................... 3
G28. Since you have [adopted/obtained guardianship], do you find it is easier or harder to make pans
for [YOUTH’S] future?
Would you say…?
Easier .................................................... 1
Harder, or .............................................. 2
About the same ..................................... 3
G29. Has the [adoption/guardianship] subsidy agreement provided you with all of the
services that you need for [YOUTH]?
YES ....................................................... 1 GO TO G31
NO ......................................................... 2
G30. What additional services do you need?
____________________________________________________________________________
____________________________________________________________________________
___________________________________________________________________________
G31. Have you asked for additional help from DCFS since the [adoption/guardianship] was finalized?
YES ....................................................... 1
NO ......................................................... 2 GO TO G33
G32. Overall, how helpful has DCFS been responding to your needs since the [adoption/guardianship]
was finalized?
Would you say…?
Very helpful ........................................... 1
Somewhat helpful ................................. 2
Not at all helpful, or ............................... 3
G33. What advice would you give other foster parents considering adoption or subsidized
guardianship?
____________________________________________________________________________
____________________________________________________________________________
___________________________________________________________________________

Westat
B-35
H. ROLE OF BIRTH PARENTS
I have a few questions about [YOUTH]'s birth parents. These are questions about how you get along with
them and about the visits they may have with (him/her).
H1. Do you know who [YOUTH]'s birth mother is?
YES ......................................................... 1
NO ........................................................... 2 (GO TO H13)
H2. Is (his/her) birth mother still alive?
YES ......................................................... 1
NO ........................................................... 2 (GO TO H13)
DON’T KNOW ......................................... 8 (GO TO H13)
H3. Where does [YOUTH]'s birth mother currently live?
In her own home with a spouse or partner ................... 01
In her own home alone or with roommates ................... 02
With other relatives or friends ....................................... 03
In jail or prison ............................................................... 04
In a hospital or other medical facility ............................. 05
Changing, because she moves a lot or is homeless .... 06
Somewhere else (SPECIFY ) ___________________ 07
DON’T KNOW ............................................................... 08
H4. In the last 30 days, how often have you talked to [YOUTH]'s birth mother? Would you say...?
Every day, ............................................. 1
Several times a week, ........................... 2
About once a week, .............................. 3
1 to 3 times a month, ............................ 4
Not at all? .............................................. 7
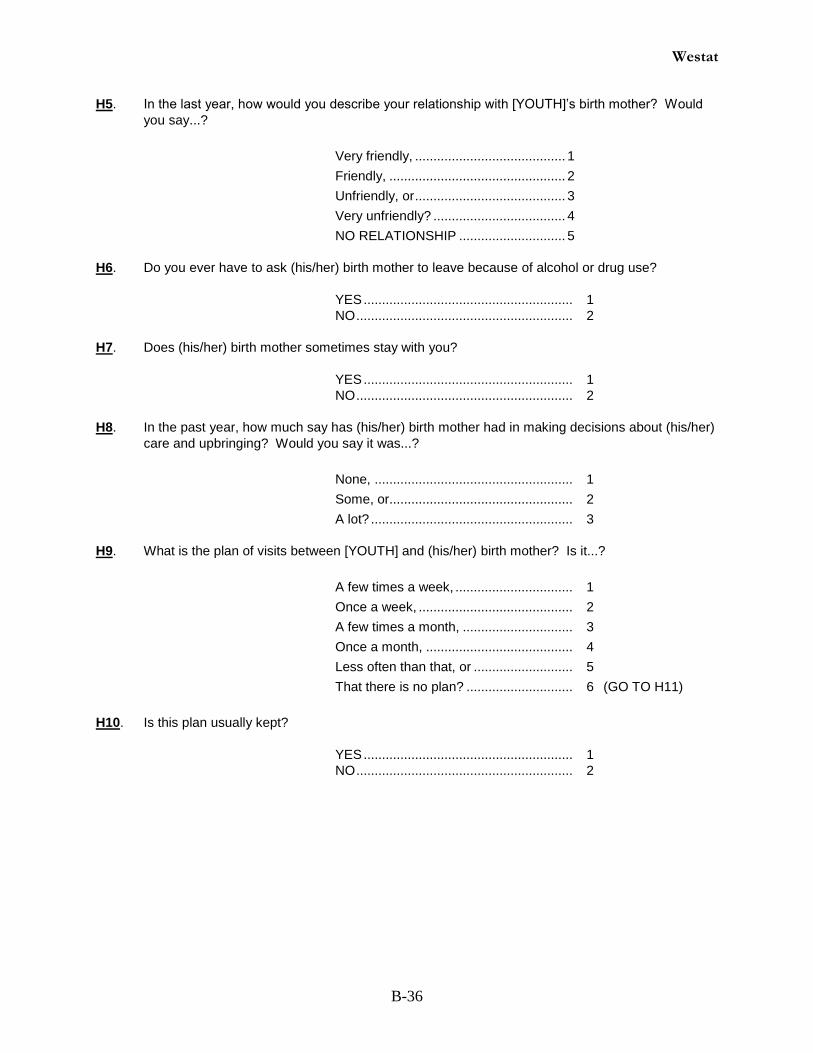
Westat
B-36
H5. In the last year, how would you describe your relationship with [YOUTH]’s birth mother? Would
you say...?
Very friendly, ......................................... 1
Friendly, ................................................ 2
Unfriendly, or ......................................... 3
Very unfriendly? .................................... 4
NO RELATIONSHIP ............................. 5
H6. Do you ever have to ask (his/her) birth mother to leave because of alcohol or drug use?
YES ......................................................... 1
NO ........................................................... 2
H7. Does (his/her) birth mother sometimes stay with you?
YES ......................................................... 1
NO ........................................................... 2
H8. In the past year, how much say has (his/her) birth mother had in making decisions about (his/her)
care and upbringing? Would you say it was...?
None, ...................................................... 1
Some, or.................................................. 2
A lot? ....................................................... 3
H9. What is the plan of visits between [YOUTH] and (his/her) birth mother? Is it...?
A few times a week, ................................ 1
Once a week, .......................................... 2
A few times a month, .............................. 3
Once a month, ........................................ 4
Less often than that, or ........................... 5
That there is no plan? ............................. 6 (GO TO H11)
H10. Is this plan usually kept?
YES ......................................................... 1
NO ........................................................... 2

Westat
B-37
H11. In the last year, about how often has [YOUTH] seen (his/her) birth mother? Would you say it
was...?
Several times a week, ............................. 1
About once a week, ................................ 2
1 to 3 times a month, .............................. 3
Several times a year, .............................. 4
About once a year, or .............................. 5
Not at all? ................................................ 6 (GO TO H13)
H12. Would you say the visits were supervised...?
All of the time, ......................................... 1
Some of the time, or ................................ 2
Never?..................................................... 3
H13. Now I’d like to ask about [YOUTH]’s biological father. Do you know who [YOUTH]'s birth father
is?
YES ......................................................... 1
NO ........................................................... 2 (GO H25)
H14. Is (his/her) birth father still alive?
YES ......................................................... 1
NO ........................................................... 2
DON’T KNOW ......................................... 8 (GO TO H25)
H15. Where does [YOUTH]'s biological father currently live? Is it...?
In his own home with a spouse or partner, ....................... 01
In his own home alone or with roommates, ...................... 02
With other relatives or friends, .......................................... 03
In jail or prison, .................................................................. 04
In a hospital or other medical facility, ................................ 05
Changing, because he moves a lot or is homeless, or ..... 06
Somewhere else? (SPECIFY) _____________________ 07
DON’T KNOW ................................................................... 08
H16. In the last 30 days, how often have you talked to [YOUTHS]'s biological father? Would you
say...?
Every day, ............................................... 1
Several times a week, ............................. 2
About once a week, ................................ 3
1 to 3 times a month, .............................. 4
Not at all? ................................................ 7

Westat
B-38
H17. In the last year, how would you describe your relationship with [YOUTH]’s biological father?
Would you say...?
Very friendly, ........................................... 1
Friendly, .................................................. 2
Unfriendly, or ........................................... 3
Very unfriendly? ...................................... 4
NO RELATIONSHIP ............................... 5
H18. Do you ever have to ask (his/her) biological father to leave because of alcohol or drug use?
YES ......................................................... 1
NO ........................................................... 2
H19. Does (his/her) biological father sometimes stay with you?
YES ......................................................... 1
NO ........................................................... 2
H20. In the past year, how much say has (his/her) biological father had in making decisions about
(his/her) care and upbringing? Would you say it was...?
None, ...................................................... 1
Some, or.................................................. 2
A lot? ....................................................... 3
H21. What is the plan of visits between [YOUTH] and (his/her) biological father? Would you say it
was...?
A few times a week, ................................ 1
Once a week, .......................................... 2
A few times a month, .............................. 3
Once a month, ........................................ 4
Less often than that, or ........................... 5
That there is no plan? ............................. 6 (GO TO H23)
H22. Is this plan usually kept?
YES ......................................................... 1
NO ........................................................... 2

Westat
B-39
H23. In the last year, about how often has [YOUTH] seen (his/her) biological father? Would you say it
was...?
Several times a week, ............................. 1
About once a week, ................................ 2
1 to 3 times a month, .............................. 3
Several times a year, .............................. 4
About once a year, or .............................. 5
Not at all? ................................................ 6 (GO TO H25)
H24. Would you say the visits were supervised...?
All of the time, ......................................... 1
Some of the time, or ................................ 2
Never?..................................................... 3
H25. Now I want to ask you about any siblings [YOUTH] has. Does (he/she) have siblings
who live somewhere else?
YES ............................................................. 1
NO ............................................................... 2(GO TO SECTION J)
DON'T KNOW.............................................. 8(GO TO SECTION J)
H26. In the past year, has [YOUTH] seen (his/her) siblings on a regular basis?
YES ....................................................... 1(GO TO SECTION J)
NO ......................................................... 2(GO TO SECTION J)

Westat
B-40
I. INFORMATION ON BIRTH/BIOLOGICAL PARENT
IF BIRTH MOTHER IS RESPONDENT, BEGIN WITH I1. IF BIOLOGICAL FATHER IS RESPONDENT,
GO TO I11
I1. Is [YOUTH]’s biological father still alive?
YES ......................................................... 1
NO ........................................................... 2 (GO TO SECTION J)
DON’T KNOW ......................................... 9 (GO TO SECTION J)
I2. Where does he currently live? Is it...?
In his own home with a spouse or partner, ................................ 01
In his own home alone or with roommates, .............................. 02
With other relatives or friends, ................................................... 03
In jail or prison, ........................................................................... 04
In a hospital or other medical facility, ......................................... 05
Changing, because he moves a lot or is homeless, or .............. 06
Somewhere else? (SPECIFY) ________________________ 07
I3. In the last 30 days, how often have you talked to [YOUTH]'s biological father? Would you say...?
Every day, ............................................... 01
Several times a week, ............................. 02
About once a week, ................................ 03
1 to 3 times a month, .............................. 04
Several times a year, .............................. 05
About once a year, or .............................. 06
Not at all .................................................. 07
I4. In the last year, how would you describe your relationship with [YOUTH]’s biological father?
Would you say...?
Very friendly, ........................................... 1
Friendly, .................................................. 2
Unfriendly, or ........................................... 3
Very unfriendly? ...................................... 4
NO RELATIONSHIP ............................... 5

Westat
B-41
I5. Does (his/her) biological father sometimes stay with you?
YES ......................................................... 1
NO ........................................................... 2
I6. In the past year, how much say has [YOUTH]’s biological father had in making decisions about
(his/her) care and upbringing? Would you say it was...?
None, .................................................... 1 Some, or................................................ 2 A lot? ..................................................... 3
I7. What is the plan of visits between [YOUTH] and (his/her) biological father?
Would you say it was...?
A few times a week, ................................ 1 Once a week, .......................................... 2 A few times a month, .............................. 3 Once a month, ........................................ 4 Less often than that, or ........................... 5 That there is no plan? ............................. 6 (GO TO I9)
I8. Is this plan usually kept?
YES ......................................................... 1
NO ........................................................... 2
I9. In the last year, about how often has [YOUTH] seen (his/her) biological father?
Would you say it was...?
Several times a week, ............................. 1
About once a week, ................................ 2
1 to 3 times a month, .............................. 3
Several times a year, .............................. 4
About once a year, or .............................. 5
Not at all? ................................................ 6 (GO TO I11)
I10. Would you say the visits were supervised...?
All of the time, ......................................... 1 Some of the time, or ................................ 2 Never?..................................................... 3
I11. Is [YOUTH]’s birth mother still alive?
YES ......................................................... 1
NO ........................................................... 2 (GO TO SECTION J)
DON’T KNOW ......................................... 8 (GO TO SECTION J)
GO TO SECTION J

Westat
B-42
I12. Where does she currently live? Is it...?
In her own home with a spouse or partner, ................................... 01
In her own home alone or with roommates, ................................... 02
With other relatives or friends, ....................................................... 03
In jail or prison, ............................................................................... 04
In a hospital or other medical facility, ............................................. 05
Changing, because she moves a lot or is homeless, or ................ 06
Somewhere else? (SPECIFY) _________________________ ... 07
I13. In the last 30 days, how often have you talked to [YOUTHS]'s birth mother? Would you say...?
Every day, ............................................... 01
Several times a week, ............................. 02
About once a week, ................................ 03
1 to 3 times a month, .............................. 04
Several times a year, .............................. 05
About once a year, or .............................. 06
Not at all .................................................. 07
I14. In the last year, how would you describe your relationship with [YOUTH]’s birth mother? Would
you say...?
Very friendly, ........................................... 1
Somewhat friendly, ................................. 2
Somewhat unfriendly, or ......................... 3
Very unfriendly? ...................................... 4
NO RELATIONSHIP ............................... 5
I15. Does (his/her) birth mother sometimes stay with you?
YES ......................................................... 1
NO ........................................................... 2
I16. In the past year, how much say has [YOUTH]’s birth mother had in making decisions about
(his/her) care and upbringing? Would you say it was...?
None, ...................................................... 1
Some, or.................................................. 2
A lot? ....................................................... 3

Westat
B-43
I17. What is the plan of visits between [YOUTH] and (his/her) birth mother? Would you say it was...?
A few times a week, ................................ 1
Once a week, .......................................... 2
A few times a month, .............................. 3
Once a month, ........................................ 4
Less often than that, or ........................... 5
That there is no plan? ............................. 6 (GO TO I19)
I18. Is this plan usually kept?
YES ......................................................... 1
NO ........................................................... 2
I19. In the last year, about how often has [YOUTH] seen (his/her) birth mother? Would you say it
was...?
Several times a week, ............................. 1
About once a week, ................................ 2
1 to 3 times a month, .............................. 4
About once a year, or .............................. 5
Not at all? ............................................. 6 (GO TO SECTION J)
I20. Would you say the visits were supervised...?
All of the time, ......................................... 1
Some of the time, or ................................ 2
Never?..................................................... 3

Westat
B-44
_______________________ ID
J. CONTACT INFORMATION
Because we want to contact you again for the followup interview, I would like to get some information
from you that will help us locate you in case you move.
J1. Your home phone number: |__| |__| |__| - |__| |__| |__| - |__| |__| |__| |__|
J2. Whose name is the phone listed under? ______________________________________
J3. Your cell phone number: |__| |__| |__| - |__| |__| |__| - |__| |__| |__| |__|
J4. Your email address: _____________________________________________
J5. Please tell me the name, address and telephone numbers of three individuals who will always
know where you are or how to reach you. We will only contact these individuals if we are unable
to locate you at your current address or telephone number. Anyone we contact will be asked only
if they know how to reach you. They won’t be given any information, and they won’t be
interviewed.
Name Address
Home telephone
number
Cell or work
telephone number
Relationship to
you (e.g., family,
friend, co-worker,
etc.)
[PROVIDE RESPONDENT WITH $20.00 CASH INCENTIVE]
That is all. Thank you very much for helping us with our study.
TIME ENDED: __________ AM/PM
(CIRCLE ONE)

Appendix C
Survey Response for the Youth and Caregiver Interviews


C-1
Initial interviews were attempted with all eligible and in-scope youth and caregivers who
had been assigned to the waiver through December 31, 2007, in the three study regions. Youth
were considered ineligible or out of scope for the interview sample if consent had not been
granted by the DCFS Guardian for the interview, the youth was determined to be too disabled for
the interview by the caregiver, the youth had moved too far from the study area for an in-person
interview, the youth was living in a group home or institution, the youth had been reunified with
a parent, or the youth had run away and did not return before the end of the study period. The
caregivers of these youth could be interviewed under a few special circumstances: namely, if the
youth was disabled and the DCFS Guardian gave consent to interview the caregiver only and
where the family had moved and the caregiver could be interviewed over the telephone. A total
of 665 initial interviews were completed with youth, and 749 initial interviews were completed
with caregivers. Initial interviews were completed with the youth, the caregiver, or both for 754
cases (370 demonstration, 384 control).
The study design called for follow-up interviews to be conducted when the youth exited
care through adoption or subsidized guardianship, turned 18, or at the end of the study,
whichever came first. There was considerable variability in the length of time between the initial
and follow-up interviews as the follow-up interview did not occur at a set interval but depended
on the youth’s age and movement into permanence. The mean length of time between the initial
and follow-up interview was 15.5 months (median = 13.8 months), but one-quarter of the sample
had a follow-up interview after fewer than 8.5 months, and one-quarter had a follow-up
interview that was 21.0 or more months after the initial interview. Follow-up interviews were
scheduled only for cases where a youth or caregiver had been interviewed for the initial
interview. Due in part to delays in the consent process, in many cases youth turned 18, were
adopted, or went into subsidized guardianship either before the initial interview or shortly
thereafter.1 In these cases, only one interview was completed with the youth and caregiver as
these youth had already met the criteria for the follow-up interview at the time of the initial
interview. In other cases, a follow-up interview could not be fielded because the youth had been
reunified, was institutionalized, had run away, or had moved from the study area and could not
be interviewed in-person.
1 In order to allow enough time between the initial and follow-up interview to measure change, an interval of at
least 6 months had to pass before the youth could be interviewed for the follow-up interview. If the youth turned
18 before 6 months passed between the initial and follow-up interview, only one interview was conducted.

C-2
As shown in Table C.1, a total of 919 youth in the three study regions who were assigned
to the waiver through December 31, 2007, were also eligible for the interview sample. After
excluding youth for reasons discussed below, the final initial interview samples included 761
youth and 850 caregivers. Response rates for the initial interviews were relatively high, even
when including out-of-scope cases (defined below): 72.4 percent of eligible assigned youth and
81.6 percent of eligible caregivers were interviewed. When we excluded cases where consent
was denied and those that were out of scope, response rates were 87.4 percent for youth and 88.2
percent for caregivers.
Table C.1: Response Rates for Initial Interviews
Total eligible youth randomly assigned 919
Total eligible youth in scope with consent 761
Total eligible caregivers in scope with consent 850
Total youth interviews completed 665
Youth response rate for all eligible cases 72.4%
Youth response rate for all eligible and in-scope cases 87.4%
Total caregiver interviews completed 750
Caregiver response rate for all eligible cases 81.6%
Caregiver response rate for all eligible and in-scope cases 88.2%
As noted previously, before we could interview any youth we had to obtain written
consent from the DCFS Guardian, and one reason that some cases were excluded was a delay or
denial of consent from the Guardian. There were sometimes delays between the youth’s
eligibility for the interview and the time that consent was obtained from the Guardian’s office,
and 30 youth exited foster care through reunification before consent was obtained. These youth
were excluded from the interview sample. In addition, the Guardian denied consent for 16 youth,
who were then also excluded from the sample.
Another reason for exclusion was that a case was out of scope. Youth were deemed out of
scope when the youth was too disabled to be interviewed (53 youth); the family had moved out
of the study area and the youth could not be interviewed in-person as required (42 youth); the
youth was living in a group home or institution (11 youth); and the youth had run away (7
youth). Caregivers were deemed out of scope for many of the same reasons, except that they
could be interviewed by telephone. Caregivers were excluded when the youth had been reunified
(30 caregivers), the DCFS Guardian denied consent (16 caregivers), the youth had been
institutionalized and was not expected to return to the caregiver’s home (11 caregivers), the

C-3
caregiver had moved out of state and could not be reached by telephone (7 caregivers), and the
youth had run away (6 caregivers). After excluding out-of-scope cases from the samples, the
final sample of eligible youth for whom consent was granted included 759 youth. The caregiver
sample was larger: 848 caregivers.
From the 754 cases with an initial caregiver or youth interview, 287 (38.1%) youth were
ineligible for a follow-up interview. Table C.2 shows the reasons why youth were not eligible for
a follow-up interview for the demonstration and control groups. Overall, the reasons for
ineligibility for a follow-up interview were similar between the two groups.
Table C.2: Reasons Why Youth Were Not Eligible for Follow-Up Interviews for
All Cases with Initial Interviews
Reason Demonstration* Control* Total*
Age 18 at or shortly after initial interview 55 (14.9%) 40 (10.4%) 95 (12.6%)
Adopted at or shortly after initial interview 8 (2.2%) 19 (4.9%) 27 (3.6%)
In subsidized guardianship at or shortly
after initial interview 20 (5.4%) 19 (4.9%) 39 (5.2%)
Reunified before follow-up interview 21 (5.7%) 20 (5.2%) 41 (5.4%)
Youth too disabled for interview 16 (4.3%) 14 (3.6%) 30 (4.0%)
Institutionalized 10 (2.7%) 19 (4.9%) 29 (3.8%)
Moved out of study area 10 (2.7%) 7 (1.8%) 17 (2.3%)
Runaway/whereabouts unknown 0 7 (1.8%) 7 (0.9%)
Deceased 1 (0.3%) 0 1 (0.1%)
Other 0 1 (0.3%) 1 (0.1%)
Total cases with initial interview 370 384 754
*Percent is of total cases with an initial caregiver or youth interview.
A total of 467 youth were eligible to be interviewed for a follow-up interview. Interviews
were completed with 433 youth (92.7%). Table C.3 shows the final disposition codes for all
youth eligible for a follow-up interview. The response rate for the control group was slightly
lower than the response rate for the demonstration group, though both exceeded 90 percent.
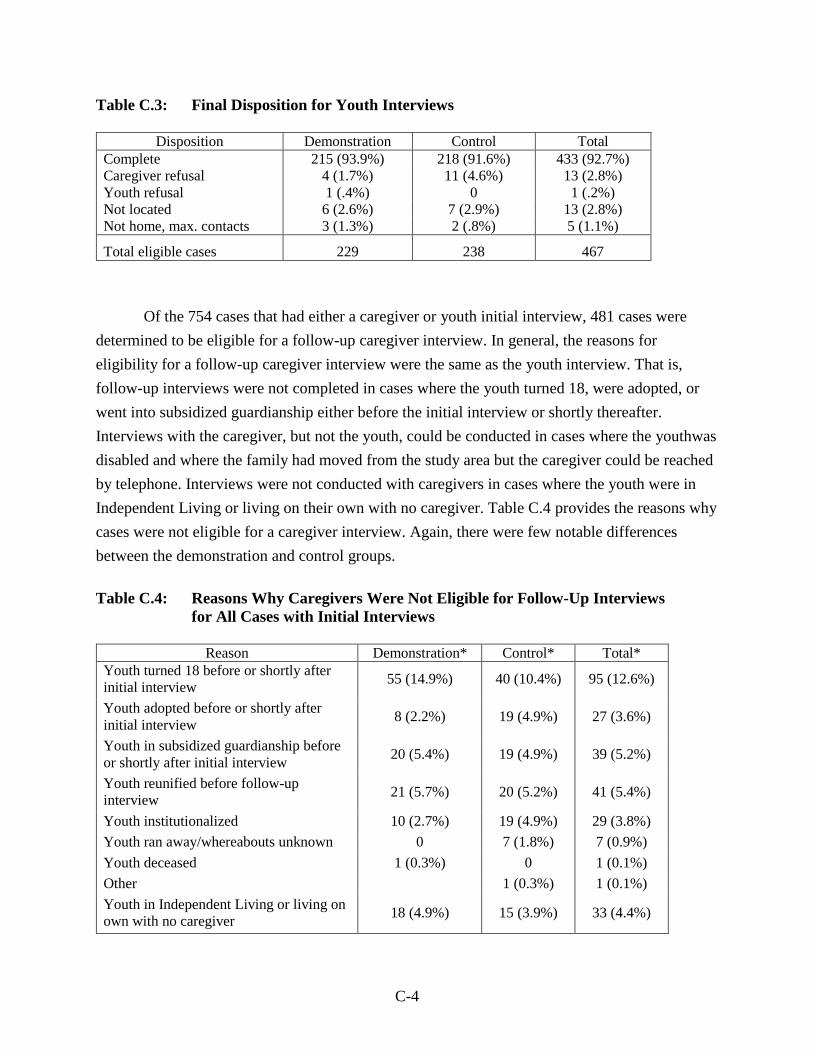
C-4
Table C.3: Final Disposition for Youth Interviews
Disposition Demonstration Control Total
Complete 215 (93.9%) 218 (91.6%) 433 (92.7%)
Caregiver refusal 4 (1.7%) 11 (4.6%) 13 (2.8%)
Youth refusal 1 (.4%) 0 1 (.2%)
Not located 6 (2.6%) 7 (2.9%) 13 (2.8%)
Not home, max. contacts 3 (1.3%) 2 (.8%) 5 (1.1%)
Total eligible cases 229 238 467
Of the 754 cases that had either a caregiver or youth initial interview, 481 cases were
determined to be eligible for a follow-up caregiver interview. In general, the reasons for
eligibility for a follow-up caregiver interview were the same as the youth interview. That is,
follow-up interviews were not completed in cases where the youth turned 18, were adopted, or
went into subsidized guardianship either before the initial interview or shortly thereafter.
Interviews with the caregiver, but not the youth, could be conducted in cases where the youthwas
disabled and where the family had moved from the study area but the caregiver could be reached
by telephone. Interviews were not conducted with caregivers in cases where the youth were in
Independent Living or living on their own with no caregiver. Table C.4 provides the reasons why
cases were not eligible for a caregiver interview. Again, there were few notable differences
between the demonstration and control groups.
Table C.4: Reasons Why Caregivers Were Not Eligible for Follow-Up Interviews
for All Cases with Initial Interviews
Reason Demonstration* Control* Total*
Youth turned 18 before or shortly after
initial interview 55 (14.9%) 40 (10.4%) 95 (12.6%)
Youth adopted before or shortly after
initial interview 8 (2.2%) 19 (4.9%) 27 (3.6%)
Youth in subsidized guardianship before
or shortly after initial interview 20 (5.4%) 19 (4.9%) 39 (5.2%)
Youth reunified before follow-up
interview 21 (5.7%) 20 (5.2%) 41 (5.4%)
Youth institutionalized 10 (2.7%) 19 (4.9%) 29 (3.8%)
Youth ran away/whereabouts unknown 0 7 (1.8%) 7 (0.9%)
Youth deceased 1 (0.3%) 0 1 (0.1%)
Other 1 (0.3%) 1 (0.1%)
Youth in Independent Living or living on
own with no caregiver 18 (4.9%) 15 (3.9%) 33 (4.4%)

C-5
Reason Demonstration* Control* Total*
Total cases with initial interview 370 384 754
*Percent is of total cases with an initial caregiver or youth interview.
Follow-up caregiver interviews were completed for 446 of the 481 (92.7%) cases eligible
for a caregiver follow-up. Table C.5 shows the final disposition of all cases eligible for a follow-
up caregiver interview. Response rates for the caregiver were similar for the demonstration group
and control group (93.2% and 92.2%, respectively).
Table C.5: Final Disposition for Caregiver Interviews
Disposition Demonstration Control Total
Complete 221 (93.2%) 225 (92.2%) 446 (92.7%)
Caregiver refusal 6 (2.5%) 9 (3.7%) 15 (3.1%)
Not located 7 (3.0%) 8 (3.3%) 15 (3.1%)
Not home, max. contacts 3 (1.3%) 2 (0.8%) 5 (1.0%)
Total eligible cases 237 244 481
The Latest Interview and Time 1/Time 2 Datasets. For cases where the initial interview
occurred after permanence had been achieved (66 cases) or where the youth had turned 18 before
or shortly after the initial interview (95 cases), the initial interview was the only interview
conducted (note that the same instrument was used for both interviews). Given the number of
cases for which only one interview was feasible, a dataset was constructed of the ―latest‖
interview for the caregiver or youth, whether it was close to time of assignment or at the end of
the data collection period. These datasets for the caregiver and youth provide the most current
interview information available regarding the youth’s well-being and permanency
decisionmaking.
The latest interview youth dataset contains 678 records, 245 from cases with only one
interview and 433 from cases where there are two interviews, where the latest interview is
included. The number of days between when the youth was eligible for the Older Wards Waiver
and when the youth was interviewed for the latest interview varied from 14 days to 1,251 days,
with a mean of 468 days. There were no significant differences between the demonstration and
control groups. The latest interview caregiver dataset contains 748 records, 302 from cases
where there was only one interview and 446 cases with both initial and follow-up interviews.
The Time 1/Time 2 dataset includes all cases with both initial and follow-up interviews.
For 14 youth interviews, there was an initial interview for the caregiver, but the youth could not

C-6
be interviewed at that time. This was typically because the family lived outside of the study area
at the time of the initial interview, and, while the caregiver could be interviewed over the
telephone, the specifications of the youth interview required that the youth be interviewed in-
person. In other cases, the caseworker or caregiver felt that the youth’s disability was too great
for the youth to be interviewed when the caregiver had an initial interview, or the caregiver or
youth refused the initial interview but not the follow-up interview. The Time 1/Time 2 dataset
for the youth interview has 433 records, and the Time 1/Time 2 dataset for the caregiver has 446
records.
Given that fact that many cases were not eligible for a follow-up interview because the
youth was already in permanence or age 18 at the time of the initial interview, the latest
interview dataset is more representative of the total sample than the Time 1/Time 2 dataset. The
Time 1/Time 2 dataset contains information only on youth who were not in permanence at the
time of the initial interview and who were not reunified and did not age out before the follow-up
interview. Analyses in this report therefore typically rely on the latest interview dataset for either
the youth or the caregiver. For variables of interest that look at change between the initial and
follow-up interviews for the selected population who had two interviews, the Time 1/Time 2
dataset is used, and this is noted in the text.
Nonresponse Adjustment. All population numbers presented in this report are
unweighted, but in general the percentages and averages are weighted to adjust for nonresponse.
A set of sampling weights was created to weight the information from the responding youth up to
all youth selected into the interview sample. These sampling weights adjust for nonresponse,
taking into account the fact that different groups of youth have different probabilities of
responding. The weight for each responding youth can be thought of as the number of similar
youth represented by that youth.
Assuming all sampled children respond to the survey, the sampling weights are
determined by the sample design, i.e., how the sample of youth was selected. The sum of the
sampling weights is equal to the number of youth in the population from which the sampled
youth were selected. When some youth do not respond to the survey, the sum of the sampling
weights for the responding youth is less than the number of children in the population. Assuming
that each youth has the same probability of responding is equivalent to assuming that the
nonrespondents are like the respondents. Using this assumption, the adjusted sampling weights
can be calculated by scaling up the sampling weights for the respondents so that the total of the
adjusted weights equals the number of children in the population.

C-7
However, if the probability of responding is not the same for all youth, the weighted
survey values may provide biased estimates of the corresponding population values. In this
survey, the response rates were relatively high and the number of nonrespondents is small. As a
result, there is relatively little information from which to assess if the response rates are different
for different groups of youth. At the same time, the difficulty of contacting and interviewing out-
of-state caregivers and caregivers of disabled youth suggested that response rates for those
caregivers might be different from those for other youth. Thus, based on a review of the available
information for adjusting for nonresponse and contact procedures, the weights for the youth data
obtained from the caregivers were adjusted by whether the youth was disabled or out of state. No
factors were identified that were related to nonresponse in the youth interview, and thus the
weights for the youth interview had only an adjustment for overall response rate.


Appendix D
Youth School Status


D-1
Two variables in the administrative data relate to success in school. The first variable is
school status: attending or having completed school versus having been expelled, suspended, or
excluded, or having dropped out. As shown in Table D.1, most of the youth (75.4% overall) had
completed school or were attending school. The proportion is slightly higher for the
demonstration group, but the differences in this table are not statistically significant. (A
cautionary note: there are nearly 23 percent of cases with information unavailable because the
school data are missing, not applicable, or unknown.) Since school status is heavily influenced
by youth’s age, Table 2.9 also shows school status for youth less than 17 years old, age 17, or
age 18 and older on September 30, 2008. For older youth, the proportion that has dropped out,
been expelled, suspended, or excluded is higher than for those less than 17 years old. The
differences between experimental groups are not statistically significant.
Statewide distributions are very similar to those in the study regions (Table D.2). Again,
demonstration/control differences are not significant.
A second education variable available in the DCFS administrative data is the number of
years of education completed by the youth, which also is heavily influenced by age. Table D.3
shows the average number of years of education for the demonstration and control groups in the
study regions, along with the percentage of cases (21.7% overall) for which the information is
missing. For the cases with non-missing data, the average number of years of education overall is
9.49. Differences between demonstration and control groups are not significant. The table also
shows the average years of education for youth less than 17 years old, 17 years old, and 18 years
or older on September 30, 2008.
Table D.4 presents the comparable statewide analysis. Again, the differences are not
significant.

D-2
Table D.1: School Status of Youth in Study Regions on September 30, 2008
School Status
Demonstration Group
%
Control Group
%
Overall
%
All Youth:
Missing, unknown, not applicable 22.1 23.8 23.0
Dropped-out, expelled, excluded, suspended 1.8 1.6 1.7
Attending 71.2 71.7 71.5
Completed 4.8 2.9 3.9
Total 100
(N=497)
100
(N=509)
100
(N=1,006)
Youth Less Than 17 Years Old:
Missing, unknown, not applicable 21.3 24.2 22.8
Dropped-out, expelled, excluded, suspended 0.0 0.0 0.0
Attending 78.7 75.8 77.2
Completed 0.0 0.0 0.0
Total 100
(N=183)
100
(N=190)
100
(N=373)
Youth 17 Years Old:
Missing, unknown, not applicable 14.4 19.2 16.9
Dropped-out, expelled, excluded, suspended 1.1 1.0 1.1
Attending 84.4 79.8 82.0
Completed 0.0 0.0 0.0
Total 100
(N=90)
100
(N=99)
100
(N=189)
Youth 18 Years or Older:
Missing, unknown, not applicable 25.9 25.5 25.79
Dropped-out, expelled, excluded, suspended 3.6 3.2 3.4
Attending 59.8 64.5 62.2
Completed 10.7 6.8 8.8
Total 100
(N=224)
100
(N=220)
100
(N=444)
Chi-square test was based on all children: p=.46

D-3
Table D.2: School Status of Youth Statewide on September 30, 2008
School Status
Demonstration Group
%
Control Group
%
Overall
%
All Youth:
Missing, unknown, not applicable 22.1 23.0 22.6
Dropped out, expelled, excluded, suspended 1.0 12 1.1
Attending 73.0 72.6 72.8
Completed 3.8 3.1 3.5
Total 100
(N=1472)
100
(N=1,468)
100
(N=2,940)
Youth Less than 17 Years Old:
Missing, unknown, not applicable 20.4 20.1 20.3
Dropped out, expelled, excluded, suspended 0.0 0.0 0.0
Attending 79.6 79.9 79.7
Completed 0.0 0.0 0.0
Total 100
(N=598)
100
(N=601)
100
(N=1,199)
Youth 17 Years Old:
Missing, unknown, not applicable 18.3 153 168
Dropped out, expelled, excluded, suspended 0.7 1.0 0.9
Attending 80.6 83.3 81.9
Completed 0.3 0.3 0.3
Total 100
(N=273)
100
(N=281)
100.
(N=610)
Youth 18 Years or Older:
Missing, unknown, not applicable 25.6 29.7 27.6
Dropped out, expelled, excluded, suspended 2.2 2.65 2.4
Attending 63.1 60.1 61.6
Completed 9.2 7.9 8.4
Total 100
(N=601)
100
(N=586)
100
(N=1,187)
Chi-square test was based on all children: p=.65

D-4
Table D.3: Mean Years of Education of Youth in Study Regions on September 30,
2008
Youth’s Education
Demonstration Group
%
Control Group
%
Overall
%
Average years of education:*
All youth 9.42 9.57 9.49
Youth under 17 7.87 8.03 7.95
Youth 17 years old 9.13 9.57 9.37
Youth 18 years of older 11.07 11.02 11.04
Percent of youth with education data:**
Available 77.1 79.6 78.3
Missing, not applicable, unknown 22.9 20.4 21.7
Total 100
(N=497)
100
(N=509)
100
(N=1006)
Kindergarten and prekindergarten coded as 0, GED coded as 12 years.
*Significance test: p=.32 for any differences in mean years of education between study groups.
**Chi-square test: p=.36 for differences in proportion of cases with education data among study groups.
Table D.4: Mean Years of Education of Youth Statewide on September 30, 2008
Youth’s Education
Demonstration Group
%
Control Group
%
Overall
%
Average years of education:*
All youth 9.50 9.48 9.49
Youth under 17 8.05 8.12 8.08
Youth 17 years old 9.62 9.57 9.59
Youth 18 years of older 11.13 11.03 11.08
Percent of children with education data:**
Available 79.6 79.5 79.5
Missing, not applicable,
unknown 20.4 20.5 20.5
Total 100
(N=1472)
100
(N=1468)
100
(N=2940)
Kindergarten and pre-kindergarten coded as 0, GED coded as 12 years.
*Significance test: p=.77 for any differences in mean years of education between study groups.
**Chi-square test: p=.97 for differences in proportion of cases with education data among study groups.

Appendix E
Differences Between Relative and Nonrelative Families


E-1
The Illinois Older Wards Waiver study was not designed to assess the extent or impact of
the differences between families where the youth and caregiver were related and families in
which they were not related. However, Chapters 3, 4, and 5 in this report presented some
statistically significant differences between relative and nonrelative families that bear further
exploration. When the caregiver and youth were related (about a third of the families in the
interview sample), youth and caregivers were more likely to choose or decide on permanence, to
achieve permanence, and to achieve permanence faster. In addition, relative caregivers reported
lower household incomes, lower rates of home ownership, and more financial difficulties than
nonrelative caregivers. So despite their greater financial hardships, these families were
significantly more likely than nonrelated families to achieve both adoption and subsidized
guardianship.
Our first exploration was to see whether demographic characteristics differed between
youth with relatives and those with nonrelatives. The only statistically significant difference we
found was on ethnicity/race. Table E.1 shows that youth who identified as Hispanic were more
likely to be with nonrelative caregivers, and youth who identified as African American were
more likely to be with relatives. Differences for youth who identified as white were not
statistically significant.
Table E.1: Youth Ethnicity/Race by Relative Status of Caregiver (youth interviews)
Youth Ethnicity/Race
Caregiver Is a
Relative
(N = 214)
%
Caregiver Is a
Nonrelative
(N = 459)
%
Overall
(N = 673)
%
Hispanic (p=.006)
Hispanic 7.0 13.3 11.3
Not Hispanic 93.0 86.7 88.7
Total 100 100 100
African American (p=.008)
African American 71.5 61.6 64.8%
Not African American 28.5 38.4% 35.2%
Total 100 100 100%
White (p=.195)
White 22.9 27.2 25.9
Not white 77.1 72.8 74.1
Total 100 100 100

E-2
We next turned to differences in severity of youth needs as a factor that might influence
permanence: families with youth with more severe needs might be less likely to choose
permanence because adoption or guardianship would mean that they would lose eligibility for
needed services and supports. We investigated several possible indicators of higher needs:
disability status, multiple foster care placements, and restrictiveness of foster care placements.
Table E.2 shows that youth with disabilities (as identified by caregivers in their interviews) were
significantly more likely to be living with nonrelatives than were youth without disabilities.
Table E.2: Youth Disability Status by Relative Status of Caregiver (caregiver
interviews)
Youth Disability Status
Caregiver Is a
Relative
(N=239)
%
Caregiver Is a
Nonrelative
(N=502)
%
Overall
(N=741)
%
Youth has disability 36.0 51.2 46.3
Youth has no disability 64.0 48.8 53.7
Total 100 100 100%
p<.001
Frequent moves in foster care can be associated with higher levels of problem behaviors.
Although we did not collect information on extent of youth’s problem behaviors, we did ask
youth how many times they had moved while in foster care. As shown in Table E.3, youth
currently with relative caregivers were significantly more likely to have experienced only one or
two moves while in foster care (over the entire foster care history), and youth with nonrelative
caregivers were significantly more likely to have experienced three or more moves.
Table E.3: Youth Moves by Relative Status of Caregiver (youth interviews)
Number of Moves
While in Care
Caregiver Is a
Relative
(N=212)
%
Caregiver Is a
Nonrelative
(N=461)
%
Overall
(N=673)
%
One 27.4 8.2 14.3
Two 30.2 15.6 20.2
Three 17.9 25.2 22.9
Four or more 24.5 50.9 42.6
Total 100 100 100
p<.001

E-3
Restrictive foster care placements are associated with more severe needs. Placements in
institutions such as residential treatment centers, hospitals, mental health facilities, detention
centers, and group homes often are indicators of high mental health or behavioral needs. In order
to measure this indicator, we examined the total time that youth had spent in living arrangements
with different levels of restrictiveness.1 Note that eligibility for the waiver required that a youth
had been in a licensed foster or relative home for at least 1 year, so youth currently in other types
of placements would not have been eligible. That requirement likely influenced the findings by
increasing the overall amount of time that youth in the waiver had spent in a foster or relative
home, compared to youth who were ineligible for the waiver because they had not been in a
foster or relative home for at least a year. And youth who were in the more restrictive settings
were likely to have more severe mental health needs. Thus, these distributions are not
representative of all youth in foster care, only of all youth who met the requirements for the
waiver.
Table E.4 shows, for the three study regions, the total time (aggregated for all youth) in
each type of living arrangement before either permanence or September 30, 2008, for youth
living with relatives compared to youth living with nonrelatives at the time of assignment to the
waiver. Differences for all living arrangements except ―Other‖ are statistically significant. This
table differs from the information presented in Chapter 2 because it includes youth’s entire foster
care placement history, not just placements after assignment to the waiver; thus, it does not
portray impact findings, only descriptive information about the youth. The important finding in
this table is the row showing percentage of time in institutions: for youth living with nonrelative
caregivers, the percentage of time spent in institutions was significantly higher than for youth
living with relative caregivers (although the percentages were fairly low in both cases). Figure
E.1 following the table portrays the findings in a bar chart; note the difference in the yellow bars
indicating institutional placements. Table E.5 and Figure E.2 present the same information for
youth statewide, rather than just the study regions, and the findings are similar.
1 For this analysis, several types of foster home (typecode = FHA, FHB, FHP, FHS, or FHI), institutional
arrangements (typecode = ICF, IDC, IMH, IOP, IPA, IRS, HHF, or NCF), runaway categories (typecode = RNY,
WCC, WUK, UAP, or UAH), transitional placements (typecode = YIC, CUS, ILO, or TLP), and other living
arrangements (typecode = ASD, DEC, OTH, PND, UNK, JTP, CIL, ABD, YES, or MIS) were combined to create
a smaller number of categories.

E-4
Table E.4: Percentage of Time in Each Living Arrangement in Study Regions
Before Permanence or September 30, 2008, by Living Arrangement
When Eligible for the Waiver (DCFS administrative data)
Living Arrangement
Percentage of Time in Living
Arrangements for Youth Living with:*
p-value
Relative
(N = 320)
%
Nonrelative
(N = 686)
%
Foster home 19.4 79.1 <0.0001
Relative home 73.4 11.5 <0.0001
Institution 1.9 6.7 <0.0001
Transitional 3.2 1.7 0.0114
Unauthorized 1.3 0.6 0.0147
Other 0.7 0.4 0.0576
Total 100 100
*At time of assignment to waiver.
Figure E.1: Total Time in Each Living Arrangement in Study Regions
Before Permanence or September 30, 2008, by Living
Arrangement When Eligible for the Waiver
0%
10%
20%
30%
40%
50%
60%
70%
80%
90%
100%
Foster home Home of relative
Living arrangement when first eligible for the older wards waiver
Other
Unauthorized
Transitional
Institution
Relative home Foster home

E-5
Table E.5: Percentage of Time in Each Living Arrangement Statewide
Before Permanence or September 30, 2008, by Living
Arrangement When Eligible for the Waiver (DCFS
administrative data)
Living Arrangement
Percentage of Time in Living
Arrangements for Youth Living with:*
p-value
Relative
(N = 105)
%
Nonrelative
(N = 1887)
%
Foster Home 16.1 79.5 <0.0001
Relative Home 77.8 11.9 <0.0001
Institution 2.1 6.1 <0.0001
Transitional 2.4 1.4 0.0003
Unauthorized 1.1 0.6 <0.0001
Other 0.5 0.4 0.4014
Total 100 100
*At time of assignment to waiver.
Figure E.2: Total Time in Each Living Arrangement Statewide Before
Permanence or September 30, 2008, by Living Arrangement
When Eligible for the Waiver
0%
10%
20%
30%
40%
50%
60%
70%
80%
90%
100%
Foster home Home of relative
Living arrangement when first eligible for the older wards waiver
Other
Unauthorized
Transitional
Institution
Relative home
Foster home

E-6
Thus, it appears that there were underlying differences between youth living with
relatives and those living with nonrelatives; in other words, these groups are not equivalent. We
next investigated whether caseworkers treated the families differently regarding permanency
decisionmaking. As shown in Table E.6, caseworkers were somewhat more likely to propose
guardianship when the caregiver was a relative, but there were no significant differences on
discussing reunification or adoption.
Table E.6: Caseworker Permanency Discussions by Relative Status of Caregiver
(caregiver interviews)
In the last year, has your caseworker
talked to you about…
Caregiver Is a
Relative
(N=239)
%
Caregiver Is a
Nonrelative
(N=502)
%
Overall
(N=741)
%
Youth going home to live with his/her parents? (p=.992)
Yes 28.5 28.5 28.5
No 71.5 71.5 71.5
Total 100 100 100
Legally adopting youth? (p=.994)
Yes 49.4 49.4 49.4
No 50.6 50.6 50.6
Total 100 100 100
Becoming a legal guardian under the subsidized guardianship program? (p=.041)
Yes 63.2 55.6 58.0
No 36.8 44.4 42.0
Total 100 100 100
As shown in Table E.7, there were no statistically significant differences between
relatives and nonrelatives in the proportion of caregivers in the demonstration group who were
aware of the availability of transition services if they achieved adoption or subsidized
guardianship.

E-7
Table E.7: Awareness of Enhanced Services Among Caregivers in the Demonstration
Group by Relative Status of Caregiver (caregiver interview)
Did your caseworker tell you that youth
can continue receiving transition services
even though you become his/her adoptive
parent or legal guardian?
Caregiver Is a
Relative
(N=117)
%
Caregiver Is a
Nonrelative
(N=213)
%
Overall
(N=330)
%
Yes 68.4 74.6 72.4
No 31.6 25.4 27.6
Total 100 100 100
p=.180
The findings reported in this appendix support a conclusion that youth placed with
relatives had somewhat less severe needs than the youth with nonrelatives. In addition,
caseworkers were more likely to discuss guardianship with relative caregivers than with
nonrelatives. These provide tantalizing but inconclusive evidence about the complexity of
selecting appropriate placement settings. Whenever available and appropriate, relatives are the
first choice for a child in need of foster care. And under the Fostering Connections to Success
and Increasing Adoptions Act of 2008, only relative caregivers are eligible for subsidized
guardianship, making it even more important to understand the difference in permanency
decisionmaking between relative and nonrelative foster families. This is an issue that warrants
further research.