iland Internet Solutions: Leveraging Cassandra for real-time multi-datacenter public cloud analytics
63
Leveraging C* for real-time multi-dc public cloud analytics Julien Anguenot VP Software Engineering @anguenot
-
Upload
datastax-academy -
Category
Technology
-
view
939 -
download
0
Transcript of iland Internet Solutions: Leveraging Cassandra for real-time multi-datacenter public cloud analytics

Leveraging C* for real-time multi-dc public cloud analytics
Julien Anguenot VP Software Engineering
@anguenot

1 iland cloud story & use case
2 data & domain constraints
3 deployment, hardware, configuration and architecture overview
4 lessons learned
5 future platform extensions

3
iland cloud story & use case

Who are we?
• public, private, DRaaS, BaaS cloud provider • Cisco CMSP • VMware Vspp for 7+ years • 20+ years in business • HQ in Houston, TX • http://www.iland.com
4

Yet another cloud provider? Well, …
5
• performance and stability • custom SLA • compliance • security • DRaaS • global datacenter footprint: US, UK and Singapore • dedicated support staff! • iland cloud platform, Web management console and API

The iland cloud platform
6

iland cloud platform essentially
• data warehouse running across multiple data-centers • monitoring (resource consumption / performance) • billing (customers and internal use) • alerting • predictive analytics • cloud management • cloud services (backups, DR, etc.) • desktop and mobile management consoles • API • Cassandra powered!
7

The iland cloud Web management console
8

9

10

11

12

13

14

15

16

17

So, why did we do all this?
• Initial motivations (v1) • vendor software (VMware vCloud Director) lacking:
• performance analytics (real-time and historical) • billing • alerts • cross datacenter visibility
• more private cloud type transparency • abstract ourselves from vendors and integrate an
umbrella of heterogeneous services • modern UX and good looking UI
18

19
data and domain constraints

Constraints
20
• write latency • high throughput • precision (used for billing) • availability • multi-data center • scalability: tens of thousands of VMs • agent-less • pull/poll vs push • high latency environs (multi-dc)

Pipeline
21
• collection of real-time data • store • aggregation • correlation • rollups (historical) • processing
• alerting • billing
• reporting • querying

Real-time collected perf counters
22
• 20 seconds samples • compute, storage, network • 15+ perf counters collected
• ~50 data points per minute and per VM • time series
• (timestamp, value) • metadata
• unit • interval • etc.
• 1 year TTL

VM CPU 20 seconds perf counters
23
Group Name Type
CPU USAGE AVERAGE
CPU USAGE_MHZ AVERAGE
CPU READY SUMMATION
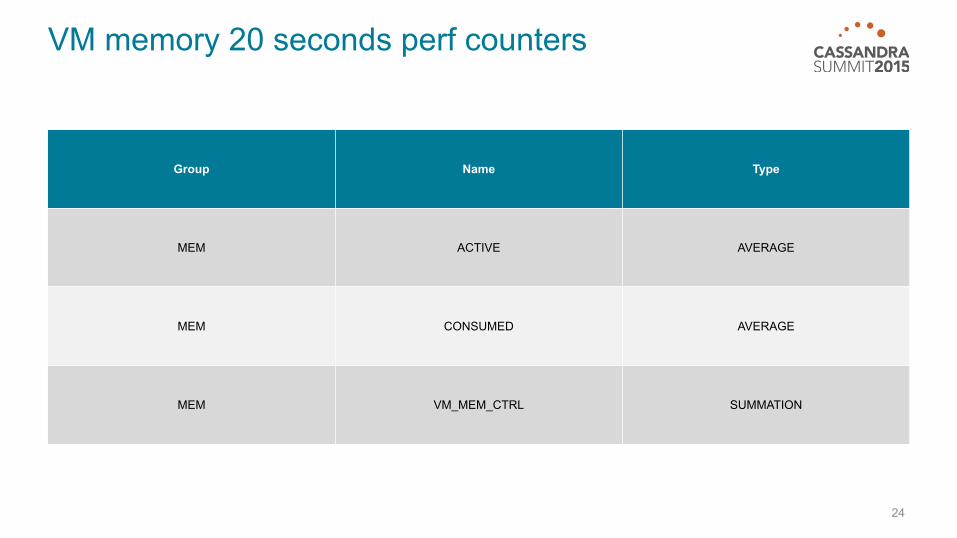
VM memory 20 seconds perf counters
24
Group Name Type
MEM ACTIVE AVERAGE
MEM CONSUMED AVERAGE
MEM VM_MEM_CTRL SUMMATION

VM network 20 seconds perf counters
25
Group Name Type
NET RECEIVED AVERAGE
NET TRANSMITTED AVERAGE
NET USAGE AVERAGE

VM disk 20 seconds perf counters
26
Group Name Type
DISK READ AVERAGE
DISK WRITE AVERAGE
DISK MAX_TOTAL_LATENCY LATEST
DISK USAGE AVERAGE
DISK PROVISIONED LATEST
DISK USED LATEST
DISK NUMBER_WRITE_AVERAGED AVERAGE
DISK NUMBER_READ_AVERAGED AVERAGE

More counters collected for 3rd party services
27
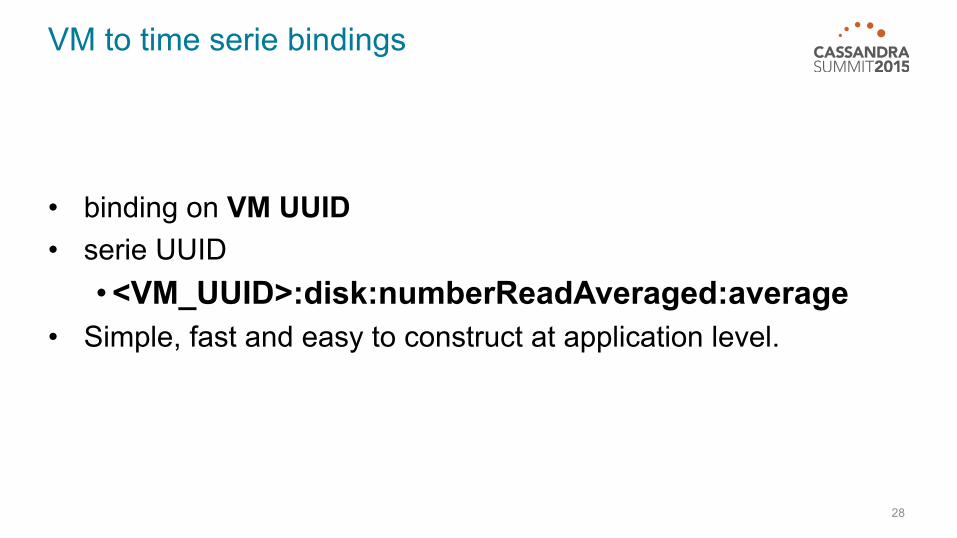
VM to time serie bindings
28
• binding on VM UUID • serie UUID
• <VM_UUID>:disk:numberReadAveraged:average • Simple, fast and easy to construct at application level.

29

30
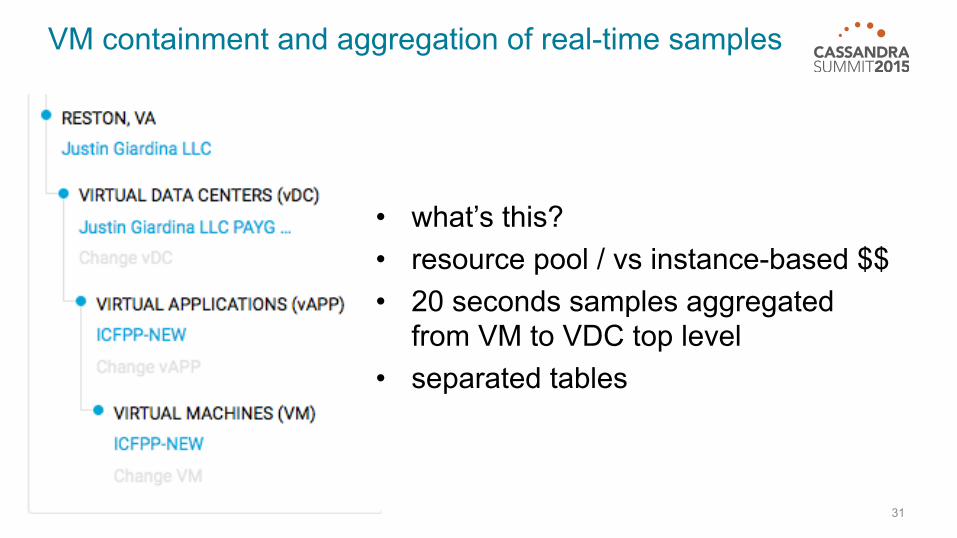
VM containment and aggregation of real-time samples
31
• what’s this? • resource pool / vs instance-based $$ • 20 seconds samples aggregated
from VM to VDC top level • separated tables

Historical rollups and intervals
32
• VM, VAPP, VDC, ORG and network • 1 minute (TTL = 1 year) • 1 hour (used for billing) • 1 day • 1 week • 1 month • separated tables • new performance counter types created • TTL > 3 years for 1h samples for compliance & billing reasons • application level responsibilities

1 minute rollups processing
33
• processed to trigger alerts (usage, billing) • processed to compute real-time billing

1 hour rollups processing
34
• processed for final billing computation • leveraging salesforce.com collected data

Data sources essentially
35
• compute • storage • network • Management • users • cloud configuration • salesforce.com • 3rd party services: backups, DR, etc. • pluggable: add / upgrade / remove services
Cassandra is the sole record keeper
36

37
deployment, configuration, hardware and architecture overview

iland cloud platform foundation
38
• Cisco UCS • VMware ESXi • VMware vSphere (management) • our Cassandra cluster runs on the exact same base
foundation as our customer public clouds.

39
Simplified architecture (each DC)
HAProxy Apache KeyCloak Wildfly AS
Postgres
Wildfly AS Resteasy API
Wildfly AS cluster
Apache Lucene
NFSApache
Cassandra
Compute Storage Network
+ 3rd parties
Salesforce
iland cloud
Cassandra ring
API
AngularJS / API Redis Sentinel
AMQP syslog-ng

Cassandra version history
40
• late 2014: 2.1.x • early 2014: 2.0.x w/ Java CQL driver • late 2013: 2.0 beta w/ Astanyax (CQL3) (v1)
• empty cluster • early 2013: 1.2.x w/ Astanyax (initial proto)

iland’s cassandra cluster overall
41
• 6 datacenters • 1 (one) keyspace • 27 nodes • 1.5 to 2TB per node (TTL)

42
Reston, VALA,CA
Dallas, TX
US
Singapore
Asia
London,UK
Manchester,UK
EU

Each DC
43
• 1 or 2 C* rack(s) of 3 Cassandra nodes • endpoint_snitch: RackInferringSnitch • RF=3

44

Each node
45
• VM • Ubuntu 14.04 LTS • Apache Cassandra Open Source distribution • 32GB of RAM • 16 CPUs • 3 disks: system, commit logs, data

Hardware
46
• Cisco UCS B200 M3 • not very expensive
• Disks • Initially 10K SAS disks • now hybrid array (accelerated SSD)
• reads off SSD (75/25) • boot time • maintenance ops • Cassandra CPU and RAM intensive.
• No need to get crazy on disks initially • C* really runs well on non-SSD

Network
47
• 1G and 10G lines (currently switching all to 10G) • Cassandra chatty but performs well in high latency
environs • network usage is pretty much constant
• 25 Mb/s in between DC: • default C* 2.1 outbound throttle • Increase when streaming node is needed
• Permanent VPN in between DC (no C* SSL)

Network
48
ultimately an API for everything and everywhere
49

50
C* W
iland ReST API
iland core platform iland core platform
iland ReST API
C* R C* RC* W
C* R only deployed in: Dallas, TX - London, UK - Singapore

51
Lessons learned
Tuning Cassandra node: JVM
52
• Java 8 • MAX_HEAP_SIZE=“8G” • HEAP_NEWSIZE=“2G” • Still using CMS but eager to switch to G1 w/ latest
Cassandra version. • no magic bullet
• test and monitor • 2.0.x to 2.1.x: had to revisit drastically

Tuning Cassandra node: some config opts
53
• concurrent_writes / concurrent_reads • nodetool tpstats
• concurrent_compactors • nodetool compactionstats • ++
• auto_snapshot • batch_size_warn_threshold_in_kb
• monitor • no magic bullet
• test and monitor

Minimize C* reads (with Redis in our case)
54
• writes are great / reads are good • application level optimizations • 16G of cached data in every DC
• very little in Redis. Bindings and alerts • in-memory only (no save on disk)

Migration
55
• went live with 2.1.1 because of UDT • suggest waiting for at least 5 or 6 dot releases
• 2.0.x / 2.1.x • have to re-tune the whole cluster • new features can be an issue initially (drivers) • Python driver very slow for data migration

Don’t’s
56
• secondary indexes (or make sure you know what you’re doing) • IN operator • don’t forget TTL
• no easy way around range deletes • complex “relational” type of models
Do’s
57
• design simple data model • queries driven data model • writes are cheap: duplicate data to accommodate queries • prepared statements • batches • minimize reads from C* • UDT

#pain
58
• bootstrapping new DC • streaming very hard to complete OK w/ 2.0 • temp node tuning during streaming • Cassandra 2.2 should help with bootstrap resume
• repairs • very long and costly op • incremental repairs broken until late 2.1.x

59
future platform extensions

Issue with in-app server aggregations and rollups
60
• JEE container works great but… • lack of traceability / monitoring around jobs • separation of concerns • need to minimize reads against Cassandra
• in-memory computation • code base growing fast (200k+ Java loc)

Spark for aggregations and rollups
61
• tackling issues in previous slides • multiple new use cases:
• for instance, heavy throughput data for network analysis
• machine learning • Kafka & Spark Streaming • currently experimenting

Multiple Keyspaces
62
• compliance / data isolation • lower network traffic

Thank you