iJO1366 Escherichia coli Model - Utah State University Escherichia coli Overview.pdfOrth, J. D., et...
61
Lesson: Escherichia coli BIE 5500/6500 Utah State University H. Scott Hinton, 2018 Constraint - based Metabolic Reconstructions & Analysis -1- iJO1366 Escherichia coli Model
Transcript of iJO1366 Escherichia coli Model - Utah State University Escherichia coli Overview.pdfOrth, J. D., et...

Lesson: Escherichia coliBIE 5500/6500Utah State University
H. Scott Hinton, 2018Constraint-based Metabolic Reconstructions & Analysis -1-
iJO1366 Escherichia coli Model

Lesson: Escherichia coliBIE 5500/6500Utah State University
H. Scott Hinton, 2018Constraint-based Metabolic Reconstructions & Analysis -2-
“iJO1366 E.coli Model” Learning Objectives
• Describe the major differences between the iAF1260 and iJO1366 E.coli models.
• Describe the properties of the gaps and orphans found in the iJO1366 model
• Outline the subsystems included in the iJO1366 model
• Describe the supplementary material available for the iJO1366 model
Each student should be able to:

Lesson: Escherichia coliBIE 5500/6500Utah State University
H. Scott Hinton, 2018Constraint-based Metabolic Reconstructions & Analysis -3-
“iJO1366 E.coli Model” Lesson Outline
• Overview
• iAF1260 vs iJO1366 Comparison
• iJO1366 Gaps and Orphans
• iJO1366 Subsystems
• Supplementary Material
Orth, J. D., et al. (2011). "A comprehensive genome-scale reconstruction of Escherichia coli metabolism--2011." Mol Syst Biol 7: 535.

Lesson: Escherichia coliBIE 5500/6500Utah State University
H. Scott Hinton, 2018Constraint-based Metabolic Reconstructions & Analysis -4-
iJO1366 E.coli Model OverviewThe initial genome-scale reconstruction of the metabolic network of Escherichia coli K-12 MG1655 was assembled in 2000. It has been updated and periodically released since then based on new and curated genomic and biochemical knowledge.
An update has now been built, named iJO1366, which accounts for 1366 genes, 2251 metabolic reactions, and 1136 unique metabolites. iJO1366 was
(1) updated in part using a new experimental screen of 1075 gene knockout strains, illuminating cases where alternative pathways and isozymes are yet to be discovered,
(2) compared with its predecessor and to experimental data sets to confirm that it continues to make accurate phenotypic predictions of growth on different substrates and for gene knockout strains, and
(3) mapped to the genomes of all available sequenced E. coli strains, including pathogens, leading to the identification of hundreds of unannotated genes in these organisms.
Like its predecessors, the iJO1366 reconstruction is expected to be widely deployed for studying the systems biology of E. coli and for metabolic engineering applications.
Orth, J. D., et al. (2011). "A comprehensive genome-scale reconstruction of Escherichia coli metabolism--2011." Mol Syst Biol 7: 535.

Lesson: Escherichia coliBIE 5500/6500Utah State University
H. Scott Hinton, 2018Constraint-based Metabolic Reconstructions & Analysis -5-
History of Constraint-based E.coli Models• The first genome-scale reconstruction of E. coli was iJE660 (Edwards and Palsson, 2000). This network was constructed through extensive
searches of literature and databases to ensure correct stoichiometry and cofactor usage, and was the most extensive metabolic network reconstruction in existence at that time.
• An updated version of this reconstruction, iJR904 (Reed et al, 2003), had an expanded scope, including pathways for the consumption of alternate carbon sources and more specific quinone usage in the electron transport system. Hundreds of new genes and reactions were added, gene–protein–reaction associations (GPRs) were included for the first time to connect reactions with genes, and all reactions were elementally and charged balanced through the inclusion of protons.
• In the next update, iAF1260 (Feist et al, 2007), the scope of the network was expanded again, now including many reactions for the synthesis of cell wall components, and all metabolites were assigned to the cytoplasm, periplasm, or extracellular space. The thermodynamic properties of each reaction were calculated, and this was used to set lower bounds on predicted irreversible reactions. iAF1260 contained 2077 reactions, 1039 metabolites, and 1260 genes.
• The iJO1366 model includes many newly characterized genes and reactions. Since the iAF1260 model was a very complete representation of the known metabolism of E. coli, only minor expansions in the scope of the network were made. Still, new discoveries since 2007 have made this model update necessary. Several genes were added based on the results of an experimental screen of E. coli knockout strains in four different media conditions. The gaps in the iAF1260 network were identified and characterized, and new reactions and genes were added to reduce the total number of gaps.
• The iJO1366 reconstruction can serve as a basis for metabolic network reconstructions of other E. coli strains and closely related organisms.
Orth, J. D., et al. (2011). "A comprehensive genome-scale reconstruction of Escherichia coli metabolism--2011." Mol Syst Biol 7: 535.

Lesson: Escherichia coliBIE 5500/6500Utah State University
H. Scott Hinton, 2018Constraint-based Metabolic Reconstructions & Analysis -6-
“iJO1366 E.coli Model” Lesson Outline
• Overview
• iAF1260 vs iJO1366 Comparison
• iJO1366 Gaps and Orphans
• iJO1366 Subsystems
• Supplementary Material
Orth, J. D., et al. (2011). "A comprehensive genome-scale reconstruction of Escherichia coli metabolism--2011." Mol Syst Biol 7: 535.

Lesson: Escherichia coliBIE 5500/6500Utah State University
H. Scott Hinton, 2018Constraint-based Metabolic Reconstructions & Analysis -7-
Properties of iJO1366 and iAF1260
Orth, J. D., et al. (2011). "A comprehensive genome-scale reconstruction of Escherichia coli metabolism--2011." Mol Syst Biol 7: 535.
Lesson: Escherichia coliBIE 5500/6500Utah State University
H. Scott Hinton, 2018Constraint-based Metabolic Reconstructions & Analysis -8-
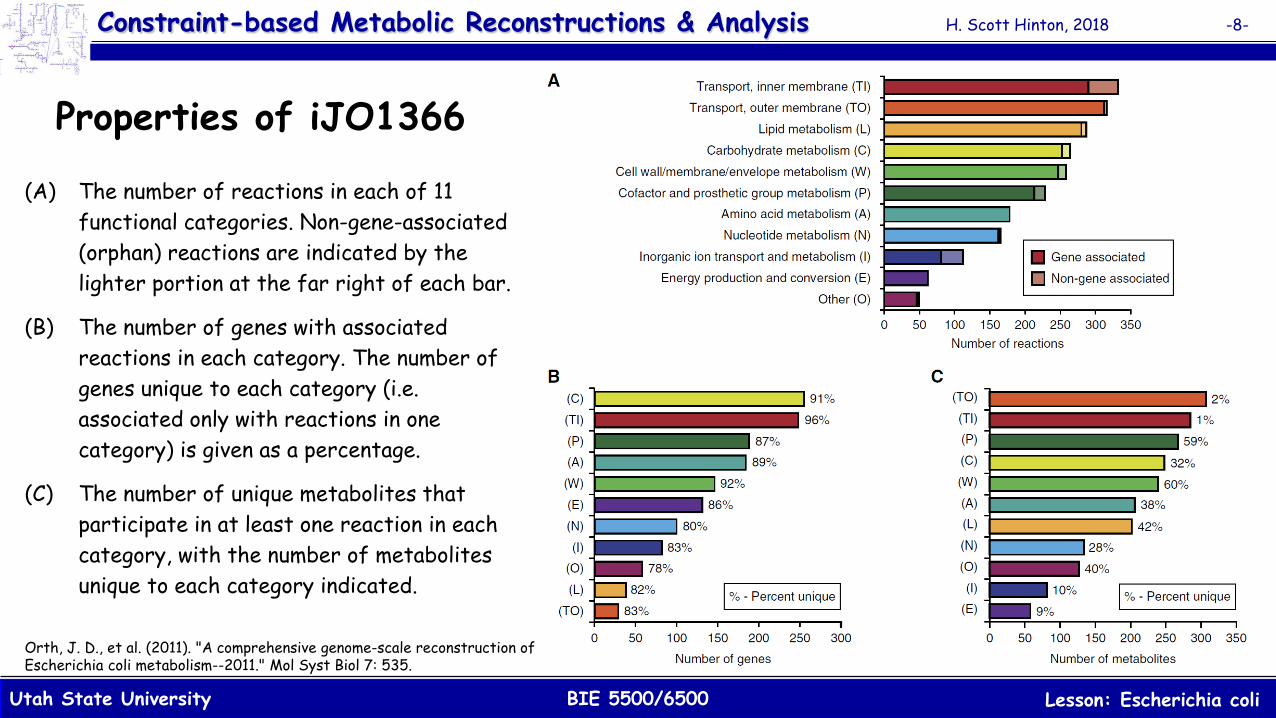
Properties of iJO1366
(A) The number of reactions in each of 11 functional categories. Non-gene-associated (orphan) reactions are indicated by the lighter portion at the far right of each bar.
(B) The number of genes with associated reactions in each category. The number of genes unique to each category (i.e. associated only with reactions in one category) is given as a percentage.
(C) The number of unique metabolites that participate in at least one reaction in each category, with the number of metabolites unique to each category indicated.
Orth, J. D., et al. (2011). "A comprehensive genome-scale reconstruction of Escherichia coli metabolism--2011." Mol Syst Biol 7: 535.

Lesson: Escherichia coliBIE 5500/6500Utah State University
H. Scott Hinton, 2018Constraint-based Metabolic Reconstructions & Analysis -9-
Properties of iJO1366(II)
(D) Histogram of the years in which the function of each of the 107 new genes was first unambiguously identified.
(E) Classification of each of the 107 new genes in iJO1366. ‘New content added’ includes genes associated with new (non-gap-filling) pathways and systems in the model. ‘Orphan fill’ includes genes associated with orphan reactions from iAF1260. ‘New gene with existing reaction’ includes new isozymes for existing gene-associated reactions in iAF1260. ‘Gap fill’ includes genes associated with new gap-filling reactions. ‘Others’ includes genes that are associated both with new, non-gap-filling reactions, and with a previous orphan reaction or as a new isozyme.
Orth, J. D., et al. (2011). "A comprehensive genome-scale reconstruction of Escherichia coli metabolism--2011." Mol Syst Biol 7: 535.

Lesson: Escherichia coliBIE 5500/6500Utah State University
H. Scott Hinton, 2018Constraint-based Metabolic Reconstructions & Analysis -10-
Growth Predictions
Orth, J. D., et al. (2011). "A comprehensive genome-scale reconstruction of Escherichia coli metabolism--2011." Mol Syst Biol 7: 535.
A total of 180 of the 285 possible carbon sources were found to be growth supporting. There are several reasons why a carbon containing metabolite cannot serve as a carbon source.
First, not all extracellular compounds have transport reactions that allow them to enter the cell. Some may only have efflux reactions that allow them to be excreted. Second, some compounds are not connected to the central reactions of metabolism from which all essential biomass components are constructed. For example, cob(I)alamin can be converted only to vitamin B12, but not to any other biomass components. Third, carbon sources must also generally serve as energy sources for E. coli, so a highly oxidized compound such as CO2 cannot be growth supporting.
Not all compounds can serve as nitrogen, phosphorus, and sulfur sources for similar reasons. Some compounds may serve as a source of more than one essential element, such as L-alanine, which can provide both carbon and nitrogen simultaneously.
The potential growth supporting carbon, nitrogen, phosphorus, and sulfur sources were also predicted using the iAF1260 E. coli model. iJO1366 contains the same number of growth supporting phosphorus and sulfur sources, but has new sources for carbon and nitrogen. Thus, the scope of the environmental conditions that can be analyzed through modeling has now been increased.
FBA was used to predict growth on every possible carbon, nitrogen, phosphorus, and sulfur source, one at a time, under aerobic conditions. For each prediction, only one of the four element source reactions was changed, and the default sources of the other three elements were used. The default carbon, nitrogen, phosphorus, and sulfur sources are glucose, ammonium, inorganic phosphate, and inorganic sulfate, respectively. If a growth rate above zero was predicted by FBA using the core biomass reaction as the objective, then a source was designated as growth supporting.
Presenter
Presentation Notes
Prediction of all growth-supporting carbon, nitrogen, phosphorus, and sulfur sources The iJO1366 computational model contains exchange reactions for 324 different compounds. 285 of these compounds contain at least one carbon atom, 178 contain nitrogen, 64 contain phosphorus, and 28 contain sulfur. It is therefore possible to use iJO1366 to predict the growth capabilities of E. coli on a very wide range of media conditions. As a demonstration of the prediction of growth capabilities, FBA was used to predict growth on every possible carbon, nitrogen, phosphorus, and sulfur source, one at a time, under aerobic conditions (Table II and Supplementary Table 12). For each prediction, only one of the four element source reactions was changed, and the default sources of the other three elements were used. The default carbon, nitrogen, phosphorus, and sulfur sources are glucose, ammonium, inorganic phosphate, and inorganic sulfate, respectively. If a growth rate above zero was predicted by FBA using the core biomass reaction as the objective, then a source was designated as growth supporting. A total of 180 of the 285 possible carbon sources were found to be growth supporting. There are several reasons why a carbon containing metabolite cannot serve as a carbon source. First, not all extracellular compounds have transport reactions that allow them to enter the cell. Some may only have efflux reactions that allow them to be excreted. Second, some compounds are not connected to the central reactions of metabolism from which all essential biomass components are constructed. For example, cob(I)alamin can be converted only to vitamin B12, but not to any other biomass components. Third, carbon sources must also generally serve as energy sources for E. coli, so a highly oxidized compound such as CO2 cannot be growth supporting. Not all compounds can serve as nitrogen, phosphorus, and sulfur sources for similar reasons. Some compounds may serve as a source of more than one essential element, such as L-alanine, which can provide both carbon and nitrogen simultaneously. The potential growth supporting carbon, nitrogen, phosphorus, and sulfur sources were also predicted using the iAF1260 E. coli model. iJO1366 contains the same number of growth supporting phosphorus and sulfur sources, but has new sources for carbon and nitrogen. Thus, the scope of the environmental conditions that can be analyzed through modeling has now been increased.

Lesson: Escherichia coliBIE 5500/6500Utah State University
H. Scott Hinton, 2018Constraint-based Metabolic Reconstructions & Analysis -11-
Gene Essentiality Predictions
Orth, J. D., et al. (2011). "A comprehensive genome-scale reconstruction of Escherichia coli metabolism--2011." Mol Syst Biol 7: 535.
iJO1366 is slightly less accurate at predicting overall gene essentiality than iAF1260, when compared to the same datasets. This is because the 107 new genes added to this model version are from less well-studied systems and pathways than the existing genes in iAF1260.
The GPR associations of every reaction in iJO1366 allow this model to predict the effects of gene knockouts. FBA was used to predict the optimal growth rate of E. coli growing on both glucose and glycerol with all 1366 genes knocked out one at a time. These computational knockout screens were then compared to experimental screens of the entire Keio. The final iJO1366 model was used to make these predictions.
There are four possible outcomes, TP, TN, FP, and FN, when one compares computationally predicted to experimental gene essentiality data.
FP predictions can be made when a model contains some unrealistic capabilities, such as pathways that are normally not expressed during the particular growth conditions. Because iJO1366 is a metabolic network model that does not contain regulatory systems, FP predictions are possible.
FN cases, on the other hand, indicate that some realistic content such as an essential transport or enzymatic reaction may be missing from the model.
When compared to the experimental gene essentiality data, most of the predictions made by iJO1366 are correct, confirming its overall accuracy (91%). Still, there are 80 FPs and 39 FNs among the 1366 predictions for growth on glucose minimal media. Predictions of growth on glycerol minimal media achieved similar accuracy.
Presenter
Presentation Notes
Prediction of gene essentiality (Supplementary material) The GPR associations of every reaction in iJO1366 allow this model to predict the effects of gene knockouts. We used FBA to predict the optimal growth rate of E. coli growing on both glucose and glycerol with all 1366 genes knocked out one at a time. These computational knockout screens were then compared to experimental screens of the entire Keio Collection (Table III and Supplementary Table 13) (Baba et al, 2006; Joyce et al, 2006; Yamamoto et al, 2009). Unlike the gene essentiality predictions presented above in Experimental phenotypic screens, the final iJO1366 model was used to make these predictions. There are four possible outcomes, TP, TN, FP, and FN, when one compares computationally predicted to experimental gene essentiality data (as discussed above Experimental phenotypic screens). FP predictions can be made when a model contains some unrealistic capabilities, such as pathways that are normally not expressed during the particular growth conditions. Because iJO1366 is a metabolic network model that does not contain regulatory systems, FP predictions are possible. FN cases, on the other hand, indicate that some realistic content such as an essential transport or enzymatic reaction may be missing from the model. These predictions can be used to drive model-based biological discovery (Joyce et al, 2006; Reed et al, 2006b). When compared to the experimental gene essentiality data, most of the predictions made by iJO1366 are correct, confirming its overall accuracy (91%). Still, there are 80 FPs and 39 FNs among the 1366 predictions for growth on glucose minimal media. Predictions of growth on glycerol minimal media achieved similar accuracy. iJO1366 is slightly less accurate at predicting overall gene essentiality than iAF1260, when compared to the same datasets. This is because the 107 new genes added to this model version are from less well-studied systems and pathways than the existing genes in iAF1260. Many of these new genes are associated with peripheral metabolic systems, while the well-studied central metabolic genes were already included in previous model versions. The overall accuracy of gene essentiality predictions for the 107 new genes is only 89%.
Lesson: Escherichia coliBIE 5500/6500Utah State University
H. Scott Hinton, 2018Constraint-based Metabolic Reconstructions & Analysis -12-
“iJO1366 E.coli Model” Lesson Outline
• Overview
• iAF1260 vs iJO1366 Comparison
• iJO1366 Gaps and Orphans
• iJO1366 Subsystems
• Supplementary Material
Orth, J. D., et al. (2011). "A comprehensive genome-scale reconstruction of Escherichia coli metabolism--2011." Mol Syst Biol 7: 535.

Lesson: Escherichia coliBIE 5500/6500Utah State University
H. Scott Hinton, 2018Constraint-based Metabolic Reconstructions & Analysis -13-
(A) Numbers of root no-production, root no-consumption, no-production downstream, and no-consumption upstream gaps in the network.
Properties of the Gaps and Orphan Reactions in iJO1366
(B) Histogram of the number of downstream or upstream blocked metabolites for each root gap. Most root gaps only result in one downstream gap.
Orth, J. D., et al. (2011). "A comprehensive genome-scale reconstruction of Escherichia coli metabolism--2011." Mol Syst Biol 7: 535.
Presenter
Presentation Notes
Supplementary Figure 3. Properties of the gaps and orphan reactions in iJO1366. (A) Numbers of root no-production, root no-consumption, no-production downstream, and no-consumption upstream gaps in the network. (B) Histogram of the number of downstream or upstream blocked metabolites for each root gap. Most root gaps only result in one downstream gap. (C) The 85 knowledge gaps (no scope gaps) in iJO1366 by type of gap. “Others” includes special cases such as metabolites that are both root and downstream gaps. (D) The 85 knowledge gaps by the primary metabolic functional category (see Figure 1) of the reactions in which the blocked metabolites participate. (E) The 127 orphan reactions (excluding the artificial reaction ATPM) by functional category. Gaps and orphan reactions in the iJO1366 reconstruction The modified GapFind algorithm was used to identify all gaps in the final version of the iJO1366 reconstruction (Supplementary Table 10). Several different types of gaps in metabolic networks are possible. Root no-production gaps are metabolites with consuming reactions but no producing reactions. Root no-consumption gaps are metabolites with producing reactions but no consuming reactions. Downstream gaps are metabolites with producing and consuming reactions but which are unable to be produced at steady state because they are downstream of a root no-production gap. Similarly, upstream gaps are upstream of root no-consumption gaps. The final iJO1366 reconstruction contains 48 root no-production gaps, 63 root no-consumption gaps, 52 downstream gaps, and 69 upstream gaps (Supplementary Figure 3). The total number of blocked metabolites in iJO1366 is 208, with some metabolites occurring as more than one type of gap. In total, 11.5% of the metabolites in iJO1366 are blocked under all conditions due to gaps. All gaps were manually sorted into scope and knowledge gaps. Scope gaps are metabolites that are blocked in a model due to the limited scope of the network reconstruction, but have actual known producing and consuming reactions. Knowledge gaps exist because our knowledge of any metabolic network is incomplete. More than half of the total blocked metabolites in iJO1366 are due to scope gaps. The two main classes of scope gaps in the model are tRNA related and metal ion related. Like its predecessor, iAF1260, iJO1366 contains charging reactions for all 20 standard amino acids as well as several non-standard amino acids such as N-formylmethionine and L-selenocysteine. These reactions are blocked because iJO1366 does not contain producing reactions for the uncharged tRNAs or consuming reactions for the charged tRNAs. These reactions could be used if the metabolic network is connected to a transcription and translation network (Thiele et al, 2009), and thus, they are included for ease of integration and completeness of the reconstruction. iJO1366 contains many reactions involving metal ions. Some metal ions, such as Fe2+, Mg2+, Ca2+, and Na+ are included in the core and wild-type biomass reactions, providing a consuming reaction for these metabolites. Others, such as Ag+, Hg2+, and WO42-, may be toxic to cells or may not serve any essential biological purpose. E. coli contains efflux transporters for such metals, but their exact uptake mechanisms are not known. Other scope gaps are due to metabolites that, like tRNAs, serve non-metabolic functions once they are produced. For example, E. coli resists osmotic stress by producing glycine betaine (Falkenberg & Strom, 1990). Most root gaps have only one or no downstream or upstream gaps (Supplementary Figure 3B). This indicates that few long pathways in iJO1366 are blocked, and that most gaps have very small effects on the network as a whole. There are a few pathways blocked by gaps, however. For example, a set of nine metabolites including carnitine and carnitinyl-CoA are blocked by their downstream product γ-butyrobetainyl-CoA. This compound is not well characterized, but has been shown to be converted to crotobetainyl-CoA by caiA (b0039), although the mechanism and electron acceptor for this reaction are unknown (Molina-Henares et al, 2010). A biologically realistic gap in E. coli K-12 metabolism occurs in the O-antigen synthesis pathway. An IS5 insertion in the rfb operon has left these E. coli strains without a functional rhamnosyltransferase, leaving rhamnosyl-N-acetylglucosamyl-undecaprenyl diphosphate without a producing reaction (Liu & Reeves, 1994; Rubires et al, 1997). Eleven downstream metabolites are also blocked by this gap, which is listed here as a scope gap. This is a real gap in the E. coli metabolic network, and is not due to limited knowledge. Most downstream or upstream blocked metabolites are blocked by only one root gap (Supplementary Figure 3C). If the missing producing or consuming reaction is identified, the downstream or upstream metabolite would be unblocked. There are a few cases, however, in which a metabolite has both upstream and downstream gaps. Mercaptopyruvate, for example, has no known producing reaction in E. coli. This compound is consumed in a reaction catalyzed by sseA (b2521) that produces thiocyanate (Colnaghi et al, 2001). This product has no known consuming reactions (Adams et al, 2002). In this unusual situation, neither of these compounds can be produced until both of these gaps are filled. Knowledge gaps occur throughout the iJO1366 metabolic network, with the largest number occurring in cofactor and prosthetic group metabolism (Supplementary Figure 3D).

Lesson: Escherichia coliBIE 5500/6500Utah State University
H. Scott Hinton, 2018Constraint-based Metabolic Reconstructions & Analysis -14-
Properties of the Gaps and Orphan Reactions in iJO1366 (II)(C) The 85 knowledge gaps (no scope gaps) in iJO1366 by type of gap. “Others” includes special cases such as metabolites that are both root and downstream gaps.
(D) The 85 knowledge gaps by the primary metabolic functional category (see Figure 1) of the reactions in which the blocked metabolites participate.
(E) The 127 orphan reactions (excluding the artificial reaction ATPM) by functional category.
Orth, J. D., et al. (2011). "A comprehensive genome-scale reconstruction of Escherichia coli metabolism--2011." Mol Syst Biol 7: 535.
Presenter
Presentation Notes
Supplementary Figure 3. Properties of the gaps and orphan reactions in iJO1366. (A) Numbers of root no-production, root no-consumption, no-production downstream, and no-consumption upstream gaps in the network. (B) Histogram of the number of downstream or upstream blocked metabolites for each root gap. Most root gaps only result in one downstream gap. (C) The 85 knowledge gaps (no scope gaps) in iJO1366 by type of gap. “Others” includes special cases such as metabolites that are both root and downstream gaps. (D) The 85 knowledge gaps by the primary metabolic functional category (see Figure 1) of the reactions in which the blocked metabolites participate. (E) The 127 orphan reactions (excluding the artificial reaction ATPM) by functional category. In addition to gaps, iJO1366 contains 128 orphan reactions. One of these, the ATP maintenance reaction, is not a real biological reaction, and is used for modeling purposes to simulate the non-growth associated maintenance requirement of E. coli. The other orphan reactions are due to incomplete knowledge of E. coli metabolism. Orphan reactions occur in all of the metabolic systems of iJO1366 except for ‘energy production and conversion’ and ‘amino acid metabolism’ (Supplementary Figure 3E). Most orphan reactions are inner membrane and inorganic ion transport reactions. One possible reason for this is that transport proteins tend to be more difficult to purify and assay than soluble enzymes. Another notable feature of orphan reactions is that they are often adjacent to each other in the iJO1366 network. Two reactions are considered adjacent if they have a common metabolite. Orphan reactions are adjacent to an average of 3.05 other orphans, while the average for all reactions in iJO1366 (excluding biomass, demand, and exchange reactions) is 1.53 adjacent orphans, a significant difference (p= 0.0005, t-test). This characteristic indicates that orphans are more common in certain poorly studied pathways and subsystems than in well-studied pathways.

Lesson: Escherichia coliBIE 5500/6500Utah State University
H. Scott Hinton, 2018Constraint-based Metabolic Reconstructions & Analysis -15-
“iJO1366 E.coli Model” Lesson Outline
• Overview
• iAF1260 vs iJO1366 Comparison
• iJO1366 Gaps and Orphans
• iJO1366 Subsystems
• Supplementary Material
Orth, J. D., et al. (2011). "A comprehensive genome-scale reconstruction of Escherichia coli metabolism--2011." Mol Syst Biol 7: 535.

Lesson: Escherichia coliBIE 5500/6500Utah State University
H. Scott Hinton, 2018Constraint-based Metabolic Reconstructions & Analysis -16-
iJO1366 Subsystems1. Alanine and Aspartate Metabolism 2. Alternate Carbon Metabolism3. Anaplerotic Reactions4. Arginine and Proline Metabolism5. Biomass and maintenance functions6. Cell Envelope Biosynthesis7. Citric Acid Cycle8. Cofactor and Prosthetic Group Biosynthesis9. Cysteine Metabolism10. Extracellular exchange11. Folate Metabolism12. Glutamate Metabolism13. Glycerophospholipid Metabolism14. Glycine and Serine Metabolism15. Glycolysis/Gluconeogenesis16. Glyoxylate Metabolism17. Histidine Metabolism18. Inorganic Ion Transport and Metabolism19. Intracellular demand20. Lipopolysaccharide Biosynthesis / Recycling
21. Membrane Lipid Metabolism22. Methionine Metabolism23. Methylglyoxal Metabolism24. Murein Biosynthesis25. Murein Recycling26. Nitrogen Metabolism27. Nucleotide Salvage Pathway28. Oxidative Phosphorylation29. Pentose Phosphate Pathway30. Purine and Pyrimidine Biosynthesis31. Pyruvate Metabolism32. Threonine and Lysine Metabolism33. Transport, Inner Membrane34. Transport, Outer Membrane35. Transport, Outer Membrane Porin36. Tyrosine, Tryptophan, and Phenylalanine Metabolism37. Unassigned38. Valine, Leucine, and Isoleucine Metabolism39. tRNA Charging
Ecoli_iJO1366_Subystems.mlx or Ecoli_iJO1366_Subystems.pdf

Lesson: Escherichia coliBIE 5500/6500Utah State University
H. Scott Hinton, 2018Constraint-based Metabolic Reconstructions & Analysis -17-
“Alanine and Aspartate” Subsystem
(Includes Asparagine)
Alanine and Aspartate Metabolism Subsystem.json
Presenter
Presentation Notes
The "Alanine and Aspartate Metabolism" subsystem includes the reaction ('ASPTA') which converts the precursor oxalacetate ('oaa_c') to L-Aspartate ('asp__L_c'), reactions ('ASNN', 'ASNS1', and 'ASNS2') that convert L-Aspartate to L-Asparagine ('asn__L_c'), a reaction ('ASPT') that converts L-Aspartate to fumarate ('fum_c'), three reactions ('ALATA_L', 'DAAD', and 'ALAR') that convert the precursor pyruvate ('pyr_c') to L-Alanine, and finally a reaction ('ASNNpp") that converts periplasmic L-Aspartate to periplasmic L-Asparagine.

Lesson: Escherichia coliBIE 5500/6500Utah State University
H. Scott Hinton, 2018Constraint-based Metabolic Reconstructions & Analysis -18-
“Alternate Carbon Metabolism” Subsystem
Alternate Carbon Metabolism Subsystem.json

Lesson: Escherichia coliBIE 5500/6500Utah State University
H. Scott Hinton, 2018Constraint-based Metabolic Reconstructions & Analysis -19-
“Anaplerotic Reactions” Subsystem
Anaplerotic Reaction Subsystem.json

Lesson: Escherichia coliBIE 5500/6500Utah State University
H. Scott Hinton, 2018Constraint-based Metabolic Reconstructions & Analysis -20-
“Arginine and Proline
Metabolism” Subsystem
Arginine and Proline Metabolism Subsystem.json
Presenter
Presentation Notes
This subsystem not only includes the biosynthesis pathways for L-Arginine and L-Proline but also includes the biosynthesis pathways for Putrescine ('ptrc_c') and Spermidine ('spmd_c'). Putrescine and Spermidine are precursors to polyamines and will not be discussed in more detail in this tutorial. This subsystem also includes the pathways that can be used to convert L-Arginine ('arg__L_c') to L-Glutamate ('glu__L_c') and Succinate ('succ_c'). The details of the biosynthesis pathways of L-Arginine and L-Proline will be discussed later.

Lesson: Escherichia coliBIE 5500/6500Utah State University
H. Scott Hinton, 2018Constraint-based Metabolic Reconstructions & Analysis -21-
“Biomass and Maintenance Functions” Subsystem
Biomass and Maintenance Functions Subsystem.json

Lesson: Escherichia coliBIE 5500/6500Utah State University
H. Scott Hinton, 2018Constraint-based Metabolic Reconstructions & Analysis -22-
“Cell Envelope Biosynthesis” Subsystem
• The Cell Envelope Biosynthesis Subsystem contains the following pathways. The synthesis of saturated fatty acids
attached to an acyl carrier protein (ACP) The synthesis of unsaturated fatty acids
attached to an acyl carrier protein (ACP) The synthesis of Murein (peptidoglycan)
precursors The synthesis of Antigen precursors
Cell Envelope Biosynthesis Subsystem.json

Lesson: Escherichia coliBIE 5500/6500Utah State University
H. Scott Hinton, 2018Constraint-based Metabolic Reconstructions & Analysis -23-
“Citric Acid Cycle” Subsystem
Citric Acid Cycle Subsystem.json

Lesson: Escherichia coliBIE 5500/6500Utah State University
H. Scott Hinton, 2018Constraint-based Metabolic Reconstructions & Analysis -24-
“Cofactor and Prosthetic Group
Biosynthesis”Subsystem
Cofactor and Prosthetic Group Biosynthesis Subsystem.json
Lesson: Escherichia coliBIE 5500/6500Utah State University
H. Scott Hinton, 2018Constraint-based Metabolic Reconstructions & Analysis -25-
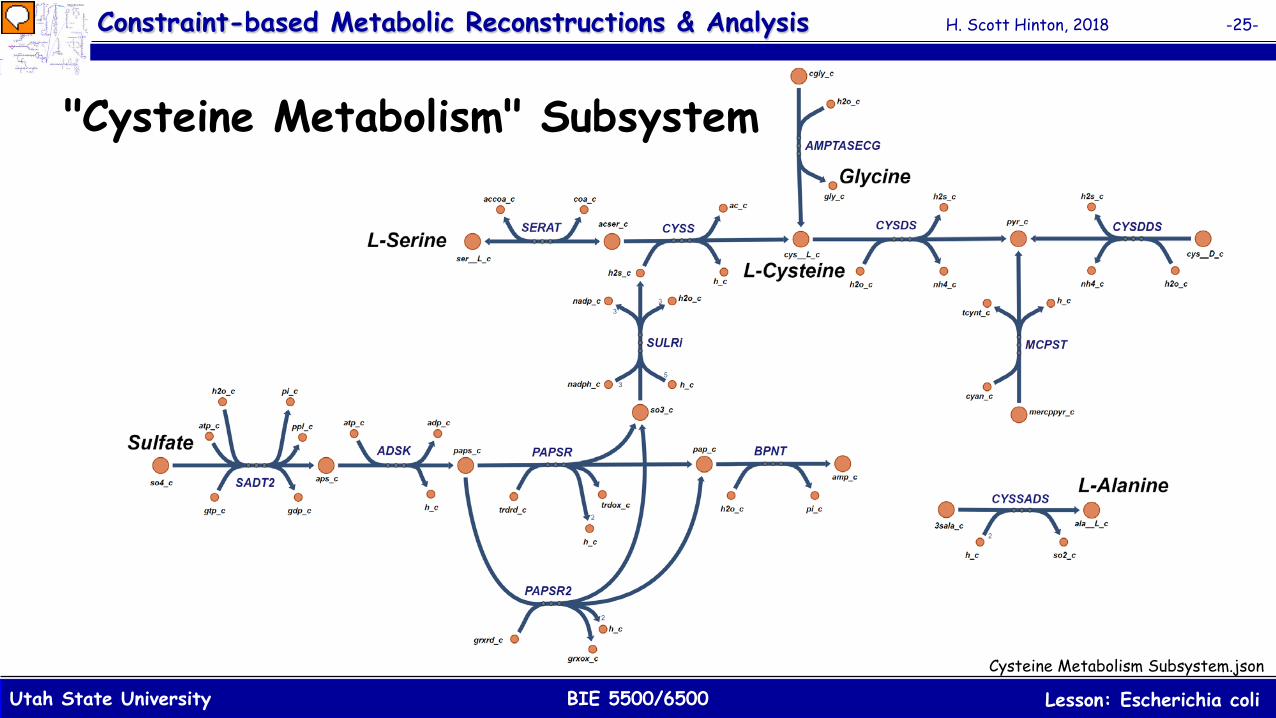
"Cysteine Metabolism" Subsystem
Cysteine Metabolism Subsystem.json
Presenter
Presentation Notes
In this figure, the primary pathway for the biosynthesis of L-Cysteine begins with the L-Serine which accepts an acetyl group from acetyl-CoA ('SERAT'). Sulfide, from the pathway that begins with sulfate ('SADT2', ADSK', 'PAPSR'/'PAPSR2' and 'SULRi'), then displaces the acetyl group ('CYSS') forming L-Cysteine. A second biosynthesis pathway includes 'AMPTASECG' which converts Cys-Gly ('cgly_c') to both L-Cysteine and Glycine. Another pathway in this subsystem ('CYSDS' and 'CYSDDS') provides the conversion of L-Cysteine to D-Cysteine ('cys__D_e'). The reaction 'BPNT' is used to breakdown Adenosine 3',5'-bisphosphate ('pap_c') to Adenosine monophosphate (AMP) ('amp_c') and phosphate ('pi_c'). Finally, there are two blocked reactions included in this subsystem; 'MCPST' and 'CYSSADS'. For the first reaction, 'MCPST', there is no pathway in the iJO1366 model that produces mercaptopyruvate ('mercppyr_c') which prevents the reaction from ever supporting flux. The second reaction, 'CYSSADS', is "blocked" because the model also does not produce the substrate 3-Sulfino-L-alanine ('3sala_c') which prevents flux from flowing through that reaction.

Lesson: Escherichia coliBIE 5500/6500Utah State University
H. Scott Hinton, 2018Constraint-based Metabolic Reconstructions & Analysis -26-
“Folate Metabolism” Subsystem
Folate Metabolism Subsystem.json

Lesson: Escherichia coliBIE 5500/6500Utah State University
H. Scott Hinton, 2018Constraint-based Metabolic Reconstructions & Analysis -27-
"Glutamate Metabolism Subsystem"
(including Glutamine)
The ability to synthesize both L-Glutamate and L-Glutamine within E.coli has importance since it is the only route to incorporate inorganic nitrogen into the cell structure. In E.coli all inorganic nitrogen must be first converted into ammonium ('nh4_c'), which is then incorporated as an amino group of L-Glutamate and L-Glutamine. The amino group from these amino acids is then transferred to other nitrogen containing compounds within the cell. Glutamate Metabolism Subsystem.json
Presenter
Presentation Notes
In this figure, the primary pathway for the biosynthesis of L-Glutamate begins with the precursor "2-oxoacetate" ('akg_c') and includes the single bidirectional reaction 'GLUDy' (Glutamate dehydrogenase (NADP)). Secondary L-Glutamate biosynthesis pathways, 'GLUN' (Glutaminase) and 'GLUSy' (Glutamate synthase (NADPH)), result in the converstion of L-Glutamine to L-Glutamate. The primary pathway of biosynthesis for L-Glutamine begins with the precursor "2-oxoglutarate" ( 'akg_c') and involves two reactions; 'GLUDy' and "GLNS' (Glutamine synthetase). The last two reactions in this subsystem include 'GLUDC' (Glutamate Decarboxylase) and 'GLUNpp' (Glutaminase). The first of these reactions is part of a pathway in the "Arginine and Proline Metabolism" subsystem which leads to the production of succinate. The second of these reactions, 'GLUNpp", allows the conversion of periplasmic L-Glutamine ('gln__L_p') to be converted to periplasmic L-Glutamate ('glu__L_p').

Lesson: Escherichia coliBIE 5500/6500Utah State University
H. Scott Hinton, 2018Constraint-based Metabolic Reconstructions & Analysis -28-
“GlycerophospholipidsMetabolism” Subsystem
Glycerophospholipids Metabolism Subsystem.json
• The Glycerophospholipids Metabolism Subsystem contains the saturated and unsaturated lipids that can be produced by E.coli, they include Phosphatidylethanolamine Phosphatidylglycerol Cardiolipin
• The length of the lipids spans from 12 to 18 carbons.
• The lipids actively included in simulations are determined by the biomass function.

Lesson: Escherichia coliBIE 5500/6500Utah State University
H. Scott Hinton, 2018Constraint-based Metabolic Reconstructions & Analysis -29-
"Glycine and Serine Metabolism" Subsystem
Glycine_Serine_Subsystem.json
Presenter
Presentation Notes
This subsystem begins with the precursor 3-Phospho-D-glycerate ('3pg_c') and a shared path that includes 'PGCD', 'PSERT', and 'PSP_L'. This shared path results in the production of L-Serine. L-Serine can also be produced through a short pathway ('DESRDHr' and 'LSERDHr') that converts D-Serine ('ser__D_c') into L-serine. In addition, L-Serine can be produced from glycine through the bidirectional 'GHMT2r' reaction that can balance the ratio of Glycine to L-Serine. Glycine can be produced from L-Serine or can be produced from L-Threonine through two reactions 'THRD' and 'GLYAT' or from sarcosine ('sarcs_c') through the reaction 'SARCOX'. There are also three other reactions included in the "Glycine and Serine Metabolism" subsystem, they include 'GLYCK2', 'MTRPOX', and 'PSP_Lpp'.

Lesson: Escherichia coliBIE 5500/6500Utah State University
H. Scott Hinton, 2018Constraint-based Metabolic Reconstructions & Analysis -30-
“Glycolysis/Gluconeogenesis”Subsystem
Glycolysis/Gluconeogenesis Subsystem.json

Lesson: Escherichia coliBIE 5500/6500Utah State University
H. Scott Hinton, 2018Constraint-based Metabolic Reconstructions & Analysis -31-
“Glyoxylate Metabolism” Subsystem
Glyoxylate Metabolism Subsystem.json

Lesson: Escherichia coliBIE 5500/6500Utah State University
H. Scott Hinton, 2018Constraint-based Metabolic Reconstructions & Analysis -32-
"Histidine Metabolism" Subsystem
Histidine Metabolism Subsystem.json
Presenter
Presentation Notes
This map for the "Histidine Metabolism" subsystem shows a long linear pathway that starts with the precursor 'r5p_c' and ends with L-Histidine (his__L_c').

Lesson: Escherichia coliBIE 5500/6500Utah State University
H. Scott Hinton, 2018Constraint-based Metabolic Reconstructions & Analysis -33-
“Inorganic Ion Transport and Metabolism” Subsystem
• The Inorganic Ion Transport and Metabolism contains the transport and secretion reactions for the following metabolites. Iron derivatives, including ferric 2,3-dihydrooxybenzoylserine, fe(III)dicitrate, enterochelin, fe(III)hydroxamate, ferrichrome,
ferroxamine, coprogen, and aerobactin. Ammonia, calcium, cadmium, chloride, cobalt, copper, sulfur dioxide, sulfate, sulfite, thiosulfate, tungstate, zinc, silver, mercury,
potassium, magnesium, manganese, molybdate, nickel, nictric oxide, nitrious oxide, nitrite, nitrate, oxygen, phosphate, selenite, selenite, and sodium. Inorganic Ion Transport and Metabolism Subsystem.json

Lesson: Escherichia coliBIE 5500/6500Utah State University
H. Scott Hinton, 2018Constraint-based Metabolic Reconstructions & Analysis -34-
“Intracellular Demand” Subsystem
Intracellular demand Subsystem.json

Lesson: Escherichia coliBIE 5500/6500Utah State University
H. Scott Hinton, 2018Constraint-based Metabolic Reconstructions & Analysis -35-
“Lipopolysaccharide Biosynthesis/Recycling” Subsystem
Lipopolysaccharide Biosynthesis - Recycling Subsystem.json
• The Lipopolysaccharide (LPS) Biosynthesis - Recycling Subsystem contains the following pathways. The synthesis of Lipid A The synthesis of KDO and the LPS
core The synthesis of antigens including
the enterobacterial common antigen, the O16 antigen, the lipid A diphosphate antigen, and the Ara4N antigen
The biomass function is used to determine the antigen included in the model simulations.

Lesson: Escherichia coliBIE 5500/6500Utah State University
H. Scott Hinton, 2018Constraint-based Metabolic Reconstructions & Analysis -36-
“Membrane Lipid Metabolism” Subsystem
• The Membrane Lipid Metabolism Subsystem contains the pathway for fatty acid catabolism.
• This subsystem is not used in the synthesis of the cell envelope.
• When fatty acids are not used as a carbon source this pathway needs to be disabled of the optimization software will select it over the natural pathway included in the Cell Envelope Biosynthesis Subsystem.
Membrane Lipid Metabolism Subsystem.json

Lesson: Escherichia coliBIE 5500/6500Utah State University
H. Scott Hinton, 2018Constraint-based Metabolic Reconstructions & Analysis -37-
“L-Methionine Metabolism" Subsystem
Methionine_Metabolism_Subsystem.mlx Methionine_Subsystem.json
Presenter
Presentation Notes
In this figure, the primary pathway for the biosynthesis of L-Methionine begins with the L-Cysteine and includes 'HSST,' 'SHSL1', 'CYSTL' and 'METS'. Other alternate pathways that provide parallel options to the 'METS' reaction include the reactions 'HCYSMT' and 'HCYSMT2". Four other pathways that can produce L-Methionine from either L-Methionine Sulfoxide ('metsox_S__L_c') or L-methionine-R-sulfoxide ('metsox_R__L_c'). In the first case, the reaction 'METOX1s' consumes L-Methionine to produce L-Methionine Sulfoxide while 'METSOXR1' produces L-Methionine Sulfoxide from L-Methionine. In the second case, the reaction 'METOX2s' consumes L-Methionine to produce L-Methionine-R-sulfoxide while 'METSOXR2' produces L-Methionine-R-sulfoxide from L-Methionine.Finally, there are a couple of pathways that consume L-Methionine to produce (2R,4S)-2-methyl-2,3,3,4-tetrahydroxytetrahydrofuran ('mtfthf_c') which include 'METAT', 'AHCYSNS', 'RHCCE', 'DHPTDCs2', and 'MTHTHFSs'.

Lesson: Escherichia coliBIE 5500/6500Utah State University
H. Scott Hinton, 2018Constraint-based Metabolic Reconstructions & Analysis -38-
“Methylglyoxal Metabolism” Subsystem
Methylglyoxal Metabolism Subsystem.json

Lesson: Escherichia coliBIE 5500/6500Utah State University
H. Scott Hinton, 2018Constraint-based Metabolic Reconstructions & Analysis -39-
“Murein Biosynthesis” Subsystem
• This subsystem models the production of the murein repeating units used to create the murein sacculus.
• The murein sacculus is modeled through the biomass function that determines the assumed murein molecules required for cell growth. The Core biomass function
(“BF_Core”) only assumes one murein peptide.
The Wild Type biomass function (“BF_WT”) assumes five different murein peoptides,
Murein Biosynthesis Subsystem.json

Lesson: Escherichia coliBIE 5500/6500Utah State University
H. Scott Hinton, 2018Constraint-based Metabolic Reconstructions & Analysis -40-
“Murein Recycling” Subsystem
• E. coli contains up to 20 murein hydrolases.
• Murein hydrolases are enzymes that digest murein or murein fragments into small, soluble fragments.
• These hydrolases include autolysins and lytic transglycosylases.
• About 40-50% of the murein in the murein sacculus recycled per generation.
• About 90% of the recycled murein is reinserted back into the murein sacculus. Murein Recycling Subsystem.json

Lesson: Escherichia coliBIE 5500/6500Utah State University
H. Scott Hinton, 2018Constraint-based Metabolic Reconstructions & Analysis -41-
“Nitrogen Metabolism”Subsystem
Nitrogen Metabolism Subsystem.json

Lesson: Escherichia coliBIE 5500/6500Utah State University
H. Scott Hinton, 2018Constraint-based Metabolic Reconstructions & Analysis -42-
“Nucleotide Salvage Pathway”Subsystem
Nucleotide Salvage Pathway Subsystem.json

Lesson: Escherichia coliBIE 5500/6500Utah State University
H. Scott Hinton, 2018Constraint-based Metabolic Reconstructions & Analysis -43-
“Oxidative Phosphorylation”
Subsystem
Oxidative Phosphorylation Subsystem.json

Lesson: Escherichia coliBIE 5500/6500Utah State University
H. Scott Hinton, 2018Constraint-based Metabolic Reconstructions & Analysis -44-
“Pentose Phosphate Pathway” Subsystem
Pentose Phosphate Pathway Subsystem.json

Lesson: Escherichia coliBIE 5500/6500Utah State University
H. Scott Hinton, 2018Constraint-based Metabolic Reconstructions & Analysis -45-
“Purine and Pyrimidine
Biosynthesis”Subsystem
Purine and Pyrimidine Biosynthesis Subsystem.json

Lesson: Escherichia coliBIE 5500/6500Utah State University
H. Scott Hinton, 2018Constraint-based Metabolic Reconstructions & Analysis -46-
“Pyruvate Metabolism” Subsystem
Pyruvate Metabolism Subsystem.json

Lesson: Escherichia coliBIE 5500/6500Utah State University
H. Scott Hinton, 2018Constraint-based Metabolic Reconstructions & Analysis -47-
"Threonine and Lysine" Metabolism Subsystem
Threonine_Lysine_Subsystem.json
Presenter
Presentation Notes
The "Threonine and Lysine Metabolism" subsystem includes the primary biosynthesis pathways for both L-Threonine and L-Lysine. Both of these pathways begin with L-Aspartate and pass through two common reactions; 'ASPK' and 'ASAD'. The pathway to L-Lysine involves seven additional reactions ('DHDPS', 'DHDPRy', 'THDPS', 'SDPTA', 'SDPDS', 'DAPE', and 'DAPDC') while the pathway to L-Threonine on requires three additional reactions ('HSDy', 'HSK', and 'THRS'). There is one L-Lysine consuming reaction included in this subsystem, 'LYSDC'. There is also one L-Threonine consuming reaction included in this subsystem, 'THRAi', that produces Glycine. For some reason, these is also a partial pathway that can lead to the biosynthesis of Glycine from the beginning metabolite of 1-Aminopropan-2-ol. Finally there is a reaction ('PTHRpp') that converts periplasmic L-Threonine O-3-phosphate ('thrp_p') to periplamic L-Threonine ('thr__L_p').

Lesson: Escherichia coliBIE 5500/6500Utah State University
H. Scott Hinton, 2018Constraint-based Metabolic Reconstructions & Analysis -48-
“Transport, Inner Membrane” Subsystem• The Transport, Inner Membrane
Subsystem contains the following. 332 Reactions Passive bidirectional and
unidirectional diffusion Facilitated irreversible diffusion Active unidirectional transport using
the ABC system Active unidirectional transport using
the PTS system Active symporters and antiporters Reductases Permeases

Lesson: Escherichia coliBIE 5500/6500Utah State University
H. Scott Hinton, 2018Constraint-based Metabolic Reconstructions & Analysis -49-
“Transport, Outer Membrane” Subsystem• The Transport, Outer Membrane Subsystem
contains the following 46 reactions Passive bidirectional diffusion of 10
metabolites, Passive unidirectional diffusion of 9
metabolites using an undefined system, Facilitated irreversible diffusion of 7
metabolites, Active TonB system unidirectional transport
of 11 metabolites, Active proton antiport transport of 1
metabolites, Active TolC system unidirectional secretion
of 7 metabolites, Active unidirectional secretion of 1
metabolites using an undefined system.

Lesson: Escherichia coliBIE 5500/6500Utah State University
H. Scott Hinton, 2018Constraint-based Metabolic Reconstructions & Analysis -50-
The Transport, Outer Membrane PorinSubsystem includes the passive bidirectional diffusion of 270 metabolites.
Diffusion of metabolites from the extracellular space to the periplasm.
Uses the “tex” suffix for each reaction name
Periplasm
Extracellular
OM
Diffusion
H2O, O2, CO2
H2O, O2, CO2
Outer Membrane Porin
“Transport, Outer Membrane Porin” Subsystem

Lesson: Escherichia coliBIE 5500/6500Utah State University
H. Scott Hinton, 2018Constraint-based Metabolic Reconstructions & Analysis -51-
"Tyrosine, Tryptophan, and Phenylalanine Metabolism"
Subsystem
Tyrosine_Tryptophan_ Phenylalanine_Subsystem.json
Presenter
Presentation Notes
As can be seen in this figure, there are two potential pathways that can create the metabolite 'chor_c' which is common to the production of all three amino acids. This pathway as shown in this subsystem begins with either/or D-Erythrose 4-phosphate ('e4p_c') or quinate ('quin_c') and ends with the production of 'chor_c'. The primary pathway, which begins with 'e4p_c', include the reactions 'DDPA', 'DHQS', 'DHQTi', 'SHK3Dr', 'SHKK', 'PSCVT', 'CHORS'. The second pathway begins with 'quin_c' and includes the reactions 'QUINDH', 'DHQTi', 'SHK3Dr', 'SHKK', 'PSCVT', 'CHORS'. The pathway from this intermediate metabolite ('chor_c') to L-Tryptophan then begins with 'chor_c' and passes through 'ANS (where it adds its amino group through the conversion of L-Glutamine to L-Glutamate), ANPRT', 'PRAi', and 'IGPS'. The pathway then provides three options; the primary pathway includes 'TRPS3' and 'TRPAS2', alternates include TRPS3' and 'TRPS2' or 'TRPS1'. Both of these alternate pathways will require L-Serine to produce L-Tryptophan. This pathway of the subsystem also include the dead-end reaction 'ACANTHAT'. The feeding metabolite for this reaction, 'acanth_c', is not produced in the iJO1366 model. For the production of L-Tyrosine begins with 'chor_c' and includes 'CHORM', 'PPND', and 'TYRTA' (provides the amino group from L-Glutamate). The subsystem also include the periplasmic reaction 'TYRPpp' which converts phosphotyrosine ('tyrp_p') to periplasmic L-Tyrosine ('tyr__L_p'). Finally, the production of L-Phenylalanine ('phe__L_c') begins with 'chor_c' and includes the reactions 'CHORM', 'PPNDH', and 'PHETA1'(provides the amino group from L-Glutamate).

Lesson: Escherichia coliBIE 5500/6500Utah State University
H. Scott Hinton, 2018Constraint-based Metabolic Reconstructions & Analysis -52-
"Valine, Leucine, and Isoleucine Metabolism" Subsystem
Valine_Leucine_Isoleucine_Metabolism_Subsystem.json
Presenter
Presentation Notes
The "Valine, Leucine, and Isoleucine Metabolism" contains pathways for the biosynthesis and production of L-Valine, L-Leucine, and L-Isoleucine. The shortest of these pathways is for the production of L-Valine. There are five reactions involved in the primary production pathway of L-Valine; 'ACLS', 'KARA1', 'DHAD1', 'VALTA' and 'VPAMTr'. The pathways begins with the precursor Pyruvate, pass through three reaction ('ACLS', 'KARA1', 'DHAD1') and then obtains its amino group from ether L-Glutamate ( 'VALTA' ) in an aerobic environment (Valine_Leucine_Isoleucine_Metabolism_Subsystem_Aerobic.png) or L-Alanine ('VPAMTr') under anaerobic conditions (Valine_Leucine_Isoleucine_Metabolism_Subsystem_Anaerobic.png). The biosynthesis pathway for L-Leucine involves the first three reactions ('ACLS', 'KARA1', 'DHAD1') required for the L-Valine production in addition to six other reactions, including 'IPPS', 'IPPMIb', 'IPPMIa', 'IPMD', 'OMCDC' and 'LEUTAi'. This pathway requires the precursors Pyruvate and Acetyl-CoA in addition to the amino acid L-Glutamate which provides L-Leucine's amino group. The biosynthesis pathway for L-Isoleucine begins with the amino acid L-Threonine and then followed with five reactions, including 'THRD', 'ACHBS', 'KARA2', 'DHAD2', and 'ILETA'. This pathway also requires the precursor Pyruvate in addition to the amino acid L-Glutamate to provide L-Leucine's amino group.

Lesson: Escherichia coliBIE 5500/6500Utah State University
H. Scott Hinton, 2018Constraint-based Metabolic Reconstructions & Analysis -53-
“tRNA Charging” Subsystem
tRNA Charging Subsystem.json

Lesson: Escherichia coliBIE 5500/6500Utah State University
H. Scott Hinton, 2018Constraint-based Metabolic Reconstructions & Analysis -54-
“iJO1366 E.coli Model” Lesson Outline
• Overview
• iAF1260 vs iJO1366 Comparison
• iJO1366 Gaps and Orphans
• iJO1366 Subsystems
• Supplementary Material
Orth, J. D., et al. (2011). "A comprehensive genome-scale reconstruction of Escherichia coli metabolism--2011." Mol Syst Biol 7: 535.

Lesson: Escherichia coliBIE 5500/6500Utah State University
H. Scott Hinton, 2018Constraint-based Metabolic Reconstructions & Analysis -55-
iJO1366 Supplementary Tables (Excel File)(https://onlinelibrary.wiley.com/doi/full/10.1038/msb.2011.65)
• Supplementary Table 1 - Results of the experimental growth phenotype screen• Supplementary Table 2 - All reactions in iJO1366• Supplementary Table 3 - All metabolites in iJO1366• Supplementary Table 4 - All references used in constructing iJO1366• Supplementary Table 5 - New genes, reactions, and metabolites in iJO1366• Supplementary Table 6 - The iJO1366 wild-type and core biomass reactions• Supplementary Table 7 - Number of abstracts for each E. coli gene in Medline• Supplementary Table 8 - Comparison of genes in iJO1366 and Seed83333.1 V20.21• Supplementary Table 9 - Comparison of genes in iJO166 and the EchoLocation database• Supplementary Table 10 - All gaps and orphan reactions in iAF1260 and iJO1366• Supplementary Table 11 - Predictions of orphan-filling genes from iJR904• Supplementary Table 12 - All growth supporting carbon, nitrogen, phosphorus, and sulfur sources in iJO1366• Supplementary Table 13 - Essential and non-essential genes in iJO1366• Supplementary Table 14 - Mapping iJO1366 to 38 E. coli and Shigella strains
Orth, J. D., et al. (2011). "A comprehensive genome-scale reconstruction of Escherichia coli metabolism--2011." Mol Syst Biol 7: 535.

Lesson: Escherichia coliBIE 5500/6500Utah State University
H. Scott Hinton, 2018Constraint-based Metabolic Reconstructions & Analysis -56-
Supplementary PDF Document(https://onlinelibrary.wiley.com/doi/full/10.1038/msb.2011.65)
Orth, J. D., et al. (2011). "A comprehensive genome-scale reconstruction of Escherichia coli metabolism--2011." Mol Syst Biol 7: 535.

Lesson: Escherichia coliBIE 5500/6500Utah State University
H. Scott Hinton, 2018Constraint-based Metabolic Reconstructions & Analysis -57-
Lesson/Course Website Supplementary Materialhttps://systemsbiology.usu.edu/E_coli_iJO1366.php
• Additional Presentations• iJO1366 Amino Acid Overview (PDF) • iJO1366 Cell Envelope Operation (PDF, )
• Matlab Live Scripts (ZIP)• iJO1366 Amino Acid Overview (PDF, MLX [zipped]) • iJO1366 Cell Membrane (PDF, MLX [zipped]) • iJO1366 Energy Management (PDF, MLX [zipped]) • iJO1366 Subsystems (Matlab Overview: PDF, MLX [zipped])
• iJO1366 Escher Maps• iJO1366 Escher Maps (Zipped)

Lesson: Escherichia coliBIE 5500/6500Utah State University
H. Scott Hinton, 2018Constraint-based Metabolic Reconstructions & Analysis -58-
“iJO1366 E.coli Model” Lesson Outline
• Overview
• iAF1260 vs iJO1366 Comparison
• iJO1366 Gaps and Orphans
• iJO1366 Subsystems
• Supplementary Material
Orth, J. D., et al. (2011). "A comprehensive genome-scale reconstruction of Escherichia coli metabolism--2011." Mol Syst Biol 7: 535.

Lesson: Escherichia coliBIE 5500/6500Utah State University
H. Scott Hinton, 2018Constraint-based Metabolic Reconstructions & Analysis -59-
Extra Material

Lesson: Escherichia coliBIE 5500/6500Utah State University
H. Scott Hinton, 2018Constraint-based Metabolic Reconstructions & Analysis -60-
Mapping E. coli and Shigella Strains• (A) The number of strain models capable
of producing all components of the iJO1366 core biomass reaction at different PID cutoffs.
• The PID of 40% used in parts (B, C) of this figure is indicated with a yellow square. At a PID of 40%, only four strains are incapable of complete biomass synthesis.
• (B) Biomass components that cannot be produced in one or more models with a PID of 40%. The strains are indicated by their KEGG organism code.
• (C) The fraction of iJO1366 genes present in all 38 strains at a PID of 40%. Strains are listed by their KEGG organism code. Laboratory strains are colored blue, commensal and environmental strains are in green, and pathogens are in red. A dashed line indicates the average fraction of genes present (97%).
Orth, J. D., et al. (2011). "A comprehensive genome-scale reconstruction of Escherichia coli metabolism--2011." Mol Syst Biol 7: 535.
Presenter
Presentation Notes
Figure 2 Results of the mapping between the iJO1366 reconstruction and all 38 available E. coli and Shigella strains. (A) The number of strain models capable of producing all components of the iJO1366 core biomass reaction at different PID cutoffs. The PID of 40% used in parts (B, C) of this figure is indicated with a yellow square. At a PID of 40%, only four strains are incapable of complete biomass synthesis. (B) Biomass components that cannot be produced in one or more models with a PID of 40%. The strains are indicated by their KEGG organism code. (C) The fraction of iJO1366 genes present in all 38 strains at a PID of 40%. Strains are listed by their KEGG organism code. Laboratory strains are colored blue, commensal and environmental strains are in green, and pathogens are in red. A dashed line indicates the average fraction of genes present (97%).

Lesson: Escherichia coliBIE 5500/6500Utah State University
H. Scott Hinton, 2018Constraint-based Metabolic Reconstructions & Analysis -61-
E.coli Strains Used in iJO1366 MappingStrains Used in Mapping
Strain ID Strain Name Year Sequencedeco Escherichia coli K-12 MG1655 1997ecj Escherichia coli K-12 W3110 2001ecd Escherichia coli K-12 DH10B 2008ebw Escherichia coli K-12 MC4100(MuLac) BW2952 2009ece Escherichia coli O157:H7 EDL933 (EHEC) 2001ecs Escherichia coli O157:H7 Sakai (EHEC) 2001ecf Escherichia coli O157:H7 EC4115 (EHEC) 2008etw Escherichia coli O157:H7 TW14359 (EHEC) 2009eoj Escherichia coli O26:H11 11368 (EHEC) 2009eoi Escherichia coli O111:H- 11128 (EHEC) 2009eoh Escherichia coli O103:H2 12009 (EHEC) 2009ecg Escherichia coli O127:H6 E2348/69 (EPEC) 2008eok Escherichia coli O55:H7 CB9615 (EPEC) 2010ecc Escherichia coli O6:K2:H1 CFT073 (UPEC) 2002ecp Escherichia coli O6:K15:H31 536 (UPEC) 2006eci Escherichia coli O18:K1:H7 UTI89 (UPEC) 2006ecv Escherichia coli O1:K1:H7 (APEC) 2006ecx Escherichia coli O9 HS (commensal) 2007ecw Escherichia coli O139:H28 E24377A (ETEC) 2007ecm Escherichia coli SMS-3-5 (environmental) 2008
Strains Used in MappingStrain ID Strain Name Year Sequencedecy Escherichia coli O152:H28 SE11 (commensal) 2008ecr Escherichia coli O8 IAI1 (commensal) 2009ecq Escherichia coli O81 ED1a (commensal) 2009eck Escherichia coli 55989 (EAEC) 2009ect Escherichia coli O7:K1 IAI39 (ExPEC) 2009eum Escherichia coli O17:K52:H18 UMN026 (ExPEC) 2009ecz Escherichia coli O45:K1:H7 S88 (ExPEC) 2009ecl Escherichia coli C ATCC 8739 2008ebr Escherichia coli B REL606 2009ebd Escherichia coli BL21-Gold(DE3)pLysS AG 2009efe Escherichia fergusonii 2008sfl Shigella flexneri 301 (serotype 2a) 2002sfx Shigella flexneri 2457T (serotype 2a) 2003sfv Shigella flexneri 8401 (serotype 5b) 2006ssn Shigella sonnei 2005sbo Shigella boydii Sb227 2005sbc Shigella boydii CDC 3083-94 2008sdy Shigella dysenteriae 2005
Orth, J. D., et al. (2011). "A comprehensive genome-scale reconstruction of Escherichia coli metabolism--2011." Mol Syst Biol 7: 535.