IJNlVERSITY OF HAWAII LIBRARY EMERGENCY ROOM …...Introdnctlon Between 1992 and 2002, emergency...
23
IJNlVERSITY OF HAWAII LIBRARY EMERGENCY ROOM UTILIZATION BY ETHNICITY AND ALTERNATIVE HEALTH CARE PRACTICES IN HAW AI'I A THESIS SUBMITTED TO THE GRADUATE DMSION OF THE UNIVERSITY OF HAW AI'I IN PARTIAL FULFILLMENT OF THE REQUIREMENTS FOR THE DEGREE OF MASTER OF SCIENCE IN PUBLIC HEALTH AUGUST 2007 By Kavitha Alimineti Thesis Committee: Jimmy T Efird, Chairperson Peter Holck A1anR. Katz
Transcript of IJNlVERSITY OF HAWAII LIBRARY EMERGENCY ROOM …...Introdnctlon Between 1992 and 2002, emergency...
IJNlVERSITY OF HAWAII LIBRARY
EMERGENCY ROOM UTILIZATION BY ETHNICITY AND ALTERNATIVE HEALTH
CARE PRACTICES IN HAW AI'I
A THESIS SUBMITTED TO THE GRADUATE DMSION OF THE UNIVERSITY OF
HAW AI'I IN PARTIAL FULFILLMENT OF THE REQUIREMENTS FOR THE DEGREE OF
MASTER OF SCIENCE
IN
PUBLIC HEALTH
AUGUST 2007
By Kavitha Alimineti
Thesis Committee:
Jimmy T Efird, Chairperson
Peter Holck
A1anR. Katz

We certify that we have read this thesis and that, in our opinion, it is satisfactory in scope and quality as a thesis for the degree of Master of Science in Public Health (Epidemiology).
ii

Copyright © 2007
Kavitba Alimineti
iii

ACKNOWLDGEMENTS
[ would like to thank my thesis chair person Dr. Jimmy Efird and advisor Dr. Peter Holck. and
my committee member, Dr. Al Katz, for their guidance and support.
Much appreciation goes to Dr. Rosanne Harrigan and the Dept of ComplimentarY and
Alternative Medicine for their invaluable support and co-sponsorsbip of this survey.
[ also thank Dr. Katherine Baker from Hawai'i State Dept Health for her support and providing
documentation ofHHS survey. I also thank Dr. Poille Dararith Bith for her suggestions and proof
reading the manuscript.
The survey was sponsored by Hawai'i State Dept of Health, and conducted by SMS Consulting.
iv
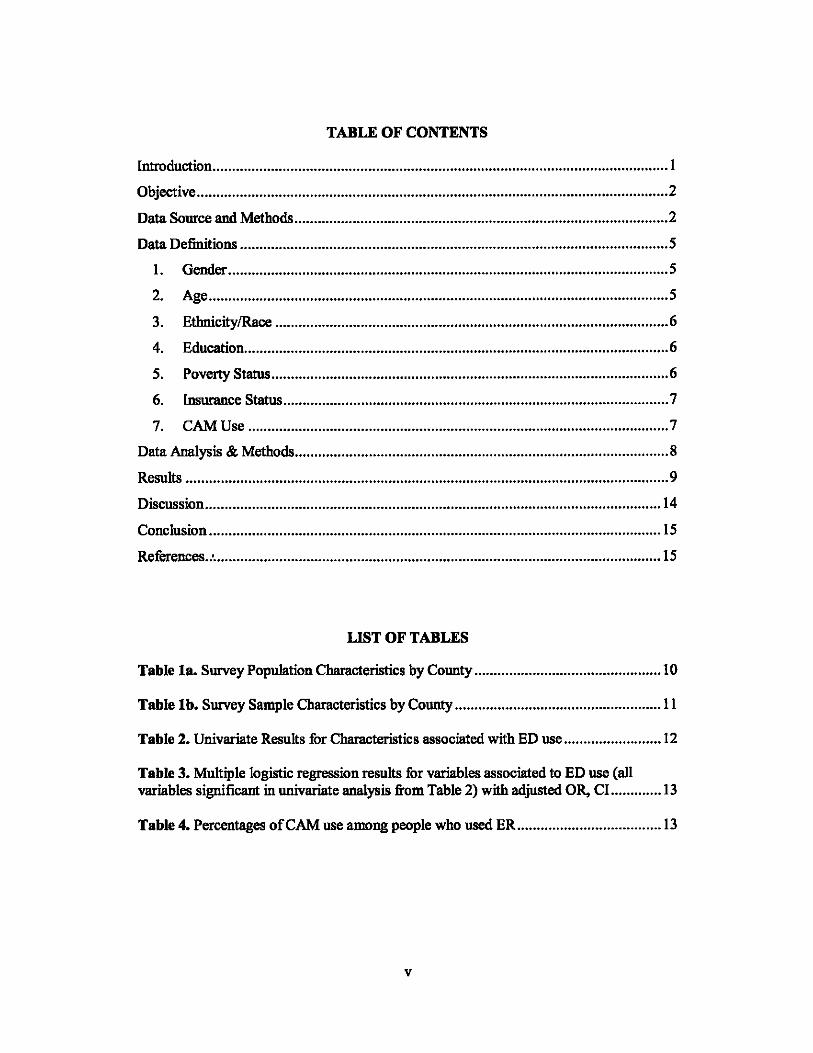
TABLE OF CONTENTS
Introduction ..................................................................................................................... I
Objective ...........................................................•........••.......••..................................•....... 2
Data Source and Methods ...............................................•.............••..•..••........................•. 2
Data Definitions .............................................................................................................. 5
I. Gender ................................................................................................................. 5
2. Age ...................................................................................................................... 5
3. EthnicitylRace ..................................................................................................... 6
4. Education ............................................................................................................. 6
5. Poverty Status .................................................•...•....••......................................••.. 6
6. Insurance Status .....•...........•...••.......•.•...........................................•....•................. 7
7. CAM Use ............................................................................................................ 7
Data Analysis & Methods .............••.........................................................•....................... 8
Results ••..................................................••............•.•...............................•.........••............ 9
Discussion ..........................................................................••......•.................................. 14
Conclusion .................................................................................................................... 15
References ...................................................................................................................... 15
LIST OF TABLES
Table la. Survey Population Characteristics by County ..............................•....••........... 10
Table lb. Survey Sample Characteristics by County .•............•..............••...••................. 11
Table 2. Univariate Results for Characteristics associated with ED use ......................... 12
Table 3. Multiple logistic regression results for variables associated to ED use (all variables significant in univariate analysis from Table 2) with adjusted OR. CI ............. 13
Table 4. Percentages of CAM use among people who used ER ..................................... 13
v

vi

Introdnctlon
Between 1992 and 2002, emergency department (ED) hospitalization in the United States
increased 230/ .. from 89.8 million to 110 million visits.' Various factors contnbute to increased
demand in ED utilization, such as insurance status, lack ofusual source of care, general health
statos and economic statos.2 Sorondo et al., for example, found that statistically significant
factors associated with those utilizing ED services included females, unmarried persons who are
lacking prescription medical insurance, and the poor who have less than a college educati9J1. 3
Race and/or ethnicit)' are also factors Sorondo et al reported influencing ED hospital visits; 4.'
however, others reported that it was not an important determinant of ED visitation statos after
adjusting for age, insurance, regular source of care, and difficulty obtaining tnmsportation to
physician's office." Stratmann and Ullman found, after adjusting for insurance and health statos,
that race was not significantly associated with ED visitation statos.7
The use of compIimentary and alternative medicine (CAM) increased substantially during the
1990's in the United States. The 2002 National Health Interview Survey (NHIS) conducted by
the Centers for Disease Control and Prevention (COC) reported that 74% of people have engaged
in some forms of CAM therapy while 62% of adults have been treated with CAM in the last 12
months.8 CompIimentary and alternative medicines are being used by a majority of ED patients.8
An examination of the association of ED and CAM use indicates that CAM users do not differ in
their utilization of ED when compared to non-users.· A prospective observational study found
that many ED patients have either tried or are willing to use alternative medicine. '0 Among ED
users, 54% bad tried alternative medicine. Also, 87"10 of ED users felt alternative medicine was
effective. Most patients were willing to try alternative medicine (63%) for their current problems,
and wanted their personal physicians to know more about alternative medicine (75%), and also
1

wanted their physicians to use alternative medicine (84%).10 These authors (Singer AJ, Gulla .0
suggested that emergency room physicians should specifically query patients regarding prior use
of alternative medicine and explore the use of alternative medicine for their patients. These
studies have limitations and the results cannot be generalized to a broad population since most of
these studies were done in a clinical setting or an individual department.
So far, there is limited research on the use of ED and CAM in the general population in Hawai'i,
particularly among native Hawai'ians and Pacific Islanders. A better understanding of the
relationship between ethnicity and the use of CAM in an emergency department is essential for
directing or re-directing resources in order to improve health care services. Also, cultora1 beliefs
may influence a particular individual's utilization of CAM and ER. This thesis analyzes the
Hawai'i Health Survey data to provide a deeper understanding of ED and CAM use in Hawai'i
Objective
The main objective of this thesis is to determine whether racelethnicity is an important
deterutinant of ED use and to determine the association between CAM and ED use in the general
population in Hawai'i.
Data Source and Methods
Data for this study came from the Hawai'i Health Survey 2003 (HHS). This survey was
developed by the Hawai'i Department of Health (DOH) to provide estimates that descnbe the
curreot health status of the population, access to and utilization of health care, and the distribution
of the population by sex, age, and ethnicity. The HHS is administered by telephone among 5,000
stratified, randomly selected households from each of the Hawai'ian Islands. This survey
2
instrument is modeled after the National Household Interview Survey (NHIS), which is
conducted by the National Centers for Health Statistics (NCHS). 11 All survey respondents are
adult residents who live in the state ofHawai'i and supply information on all household members.
The principal objective of the survey is to provide statewide estimates of population parameters
that descnbe: I) the current health status of the population; 2) access to and utilization of health
care; and 3) the annnal distnbution of the population by a broad range of demographic and socio
economic characteristics.
This survey is administered by the Hawai'i State Department of Health Office of Health Status
Monitoring (OHSM), and has been conducted by SMS Research & Marketing Services, Inc. since
1995. SMS was responsible for survey design, instrumentation, sampling, data collection, and
processing. The survey is conducted by telephone in English during the months of February to
November. The target population ofHHS is the civilian noninstitutionalized population of
Hawai'i. People who reside in long-term care institotions (e.g., nursing homes for the elderly,
hospitals for the chronically ill, disabled, or mentaIly retarded, as well as wards for abused and/or
neglected children), correctional facilities (e.g., prisons or jails,juvenile detention centers, and
haIf\vay houses), and active duty Armed Forces personnel (although their dependents are
included) were excluded. A multistage cluster sample design is used to select a representative
sample of households annually across the state for the HHS. Considerable effort is made to
ensore accurate reporting; however, the information from both proxy and self-respondents may be
inaccurate because the respondent may be unaware of relevant information, may have forgotten
it, does not wish to reveal it to an interviewer, or does not nnderstand the intended meaning of the
question.
Computer assisted telephone interviewing (CATI) was used to conduct all interviews of the
survey. CATI system dials telephone numbers selected from a Random Digit Dialing sample file
3
and provides a means of recording the status of every call administered, schedules subsequent call
backs, and stores completed survey results in an analysis file. The CA TI system used for HHS
interviews bas two characteristics that have become important to tha HHS data quality. The first
is rostering -, the ability to roster the numbers of the household and recall the roster as needed.
The second feature of the CA TI system is Voice capture that permits capture of verhatim
responses to open-ended survey items and records them digitally into the data file. All reguIar
shift interviews were conducted on weekdays between the hours ofS:OO p.m and 9:00 p.m, and
on Saturdays and Sundays between the hours of 10:00 a.m and 9:00 p.m As many as S call
backs were made to phone numbers resulting in incompletion and were rescheduled for a
convenient time and date for the respondent.
The sample is disproportionately weighted by island so that people in 4 counties are represented
roughly equally. Families without a working phone and those homeless were excluded.
However, census estimates of those without telephone service and the Hawai'i Homeless Study
2003 indicate that these omissions do not pose a serious problem with the reliability of the data
since it was estimated that these individuals apprise only 2% of the population in question. The
sample data are statistically adjusted to provide representative data for tha population of the state
as a whole. The fina\ statistical adjustment for (weighting) each person is a product of the
following factors: (1) disproportionate sampling of households across the given regions; (2)
multiple residential telephone lines per household; (3) household size; and (4) post-stratification
by age and sex-strata.
The HHS data provide accurate estimates for the population of the State of Hawai' i within plus
or-minus 2 perceotage points at the 9S percent confidence leveL Since almost all residents of the
state speak English, language harriers were not identified as an issue in the administration of the
survey.
4
In early 2003, The University of Hawaii's John A. Bums School of Medicine (JABSOM)
contracted with SMS Research and Marketing Services, Inc. to incorporate questions related to
the use of CAM into the 2003 Hawai'i Health Survey. Analyses reported in this study reflect data
collected for that year. All estimates of percents, frequencies, associated standard errors, and
confidence intervals shown in this thesis were generated with SUDAAN, a software package
designed to account for a complex sample design.12
A major strength of the HHS data is that it was collected for a representative sample of the state's
population. All questions were asked of all respondents regardless of gender. The 1arge sample
facilitated investigation of self reported health status, access to care, and medical insurance
coverage. CAM data has several limitations. The CAM data is dependent on the respondent's
knowledge of CAM therapies. Second, collection of data at only one point in time results in an
inability to monitor changes that occur over time.
Data Definitions
1. Gender
Household members are either classified as male or female according to information supplied by
the respondent
2. Age
A person's age refers to their last birthday as reported by the respondent. Respondents are 18
years of age or older. Missing age data are imputed using the "hot deck" method. Hot deck
method is discussed in data analysis and methods section.
5
3. EthnlcltylRace
Each respondent is asked to choose a single racial/ethnic class that best describes his or her ethnic
background Response choices included White/Caucasian, Hawai'ian, Chinese, Filipino,
Japanese, Korean, Vietnamese, Asian Indian, Other Asian, Samoan/fongan, Black! African
American, Native American! Aleut/EskimoJlnuit, Puerto Rican, Mexican, Portuguese,
G"amanianlChamorro, and Other Pacific Islander. In addition, the interviewer can mark an
"other" category and record an ethnic background not included in the above list. The interviewer
can also record responses of "don't know" (if respondent did not know all ethnic background
classifications of all household members), or "refused" (for those who choose not to report ethnic
or racial data). The "other" etbnicities specified are coded back into the prescnlled race and
ethnicity categories if possible.
4. Education
The level of education refers to the highest grade completed at the time of the survey. These
categories are kindergarten, grades 1-8, grades 9-10, grade 12 or GED, 1-3 years of college, 4 or
more years of college, and unknown or refused
5. Poverty Stulus
The respondent is asked to report the after-tax income for the calendar year prior to the survey.
Responses are recorded in 11 categories from "less than $5,000" through "$150, 000 or more,"
"don't know" and "refused" Two (2) additional questions provide further information on
household income. If reported income is within a category that included an HHS poverty
guideline for a specific household size, the respondent is asked if the household income is above
or below the HHS guideline. Respondents are asked how many household members were
dependent on the reported income. For households with no identified income, income is imputed
using the hot deck method. Poverty status is determined from household income and household
6

size based on the Poverty guidelines updated annually using figures released by the US
Department of Health and Human Services specific to Hawai'i. Households below 100 percent
of the guideline are classified as being "below poverty." Individuals with percent poverty values
below 100 percent of the guideline are classified as those "living below poverty."
6. Insurance Status
All members of the household are classified as either insured or uninsured, meaning currently
covered or not by health insurance regardless of age.
7. CAMVse
Health care pmctices and products that are not presently considered to be part of Western
medicine are called Complimentary and Alternative Medicine (CAM). Complementary medicine
is used together with Western medicine. Alternative medicine is used in place of Western
medicine. Questions on CAM in this survey explored the use of 10 different types of alternative
medicine, such as Aywveda, Naturopathy, Curanderismo, Hypnosis, Chiropmcty, Chelation,
Massage thempy, Reiki, Acupuncture and Biofeedback.
The term acupuncture describes a family of procedures involving stimulation of anatomical points
on the body by a variety of techniques. The acupuncture technique that has been most studied
scientifically involves penetrating the skin with thin, solid, metallic needles that are manipulated
by the hands or by electrical stimulation. I3 Chiropmcty, Chelation and Massage thempy are
body-based methods that involve manipulation and/or movement of one or more parts of the
body.14 Ayurveda is a system of medicine that originated in India 5,000 years ago. Ayurveda
includes diet and hetbal remedies and emphasizes the use of body, mind, and spirit in disease
prevention and treatment through using heated oils and herbs to trigger the body's natural healing
processes, to enhance the immune system, to increase metabolism, to soften the skin, and to bring
7
deep relaxation and peace of mind 14 Naturopathy is an alternative medical system in which
practitioners work with the natura1 hea1ing forces within the body, with the goal of aiding the
body to heal from disease and further auain better health. Practices may include dietary
modifications, massage, exercise, acupuncture, minor surgery, and various other interventions.13
Curanderismo is a mind-body-spirit healing approach steeped in tradition and ceremony. It is a
remedy-based system in which faith, prayer (or visualization), traditional wisdom, observation,
and the scientific method combine to effect healing. Reild, Acupuncture, and Biofeedback are
therapies that are intended to affect energy fields that surround and penetrate the human body.
Data AIIalysIs & Methods
Data Analysis is done with SUDAAN statistical software version 9 (Research Triangle lnstitote,
Research Triangle Park, NC), a software package designed to account for a complex sample
design. Taylor Series (With Replacement) method was used for variance estimation. Logistic
regression techniques were used to test the association between the respondent characteristics and
the dependent variable emergency room use. The factors that were significant in the univariate
analysis (adjusted for multiplicity via the Hochberg sequential adsptive procedure I') are then
entered into multivariate logistic regression analysis to find factors independently associated with
ER use. When performing (k) multiple tests of Significance, the probability of rejecting the null
hypothesis inappropriately is given by l-(l-a.j". Prior to entering variables into the multivariate
model, the Hochberg sequential rejective method is used to control the Type I error rete across
the set of univariate analyses (Hochberg and Benjamini 1990). Results of the logistic regression
analysis are presented as odds retios (ORs) and 95% confidence intervals (CIs). All analyses use
corresponding survey weights that account for probability of selection and differential non
response. The likelihood ratio method is used to compute the p values for variables. Alpba of
0.05 is used as the sigoificance level.
8
Hot decking chooses a response from another sample person, with similar demographic and
economic characteristics, to replace the missing data item. This imputation procedure is
performed one item at a time and only for items that require a response in order to calculate
weights or to supply key demographic data for analysis. These characteristics include age, sex,
and household income. For age 0.83% of the data were imputed in this analysis, and 25.7% of
income data were imputed. The response mte of the survey was measured with the Council of
American Survey Research Organization (CASRO) 16 response mte. The CASRO response mte
for HHS 2003 was estimated to be about 52%.
Resnlts
Ovemll, 16.9"10 of the respondeots in the survey used Emergency Room services in the past I
year. ER use over the past 12 months did not differ between genders, different age groups, users
and non-users of CAM, and those varying in insumnce status.
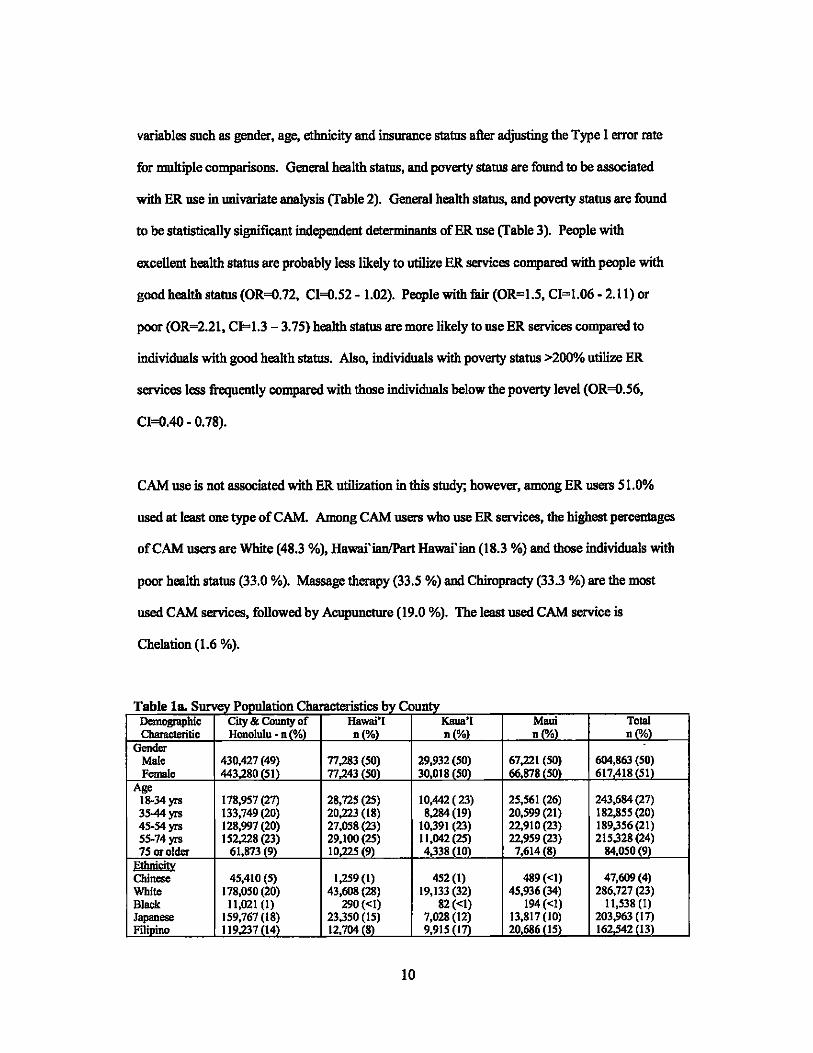
Tabella sbows the population demographic and social characteristics of the HHS data.
Population statistics represent weighted sample estimates. Within age and sex categories the
population was evenly distributed across counties (Table la). However, only 9-10% of the
estimated population was 75 years or older. There were a greater number of whites (23%)
compared with other ethnicities; however, Hawai'ian/Part Hawai'ians comprised 21 % of the
sample. Higher percentage of the population is in good health status with one or more insurance
covemge and >200% poverty. Table Ib sbows the sample demographic and social
characteristics of the HHS data.
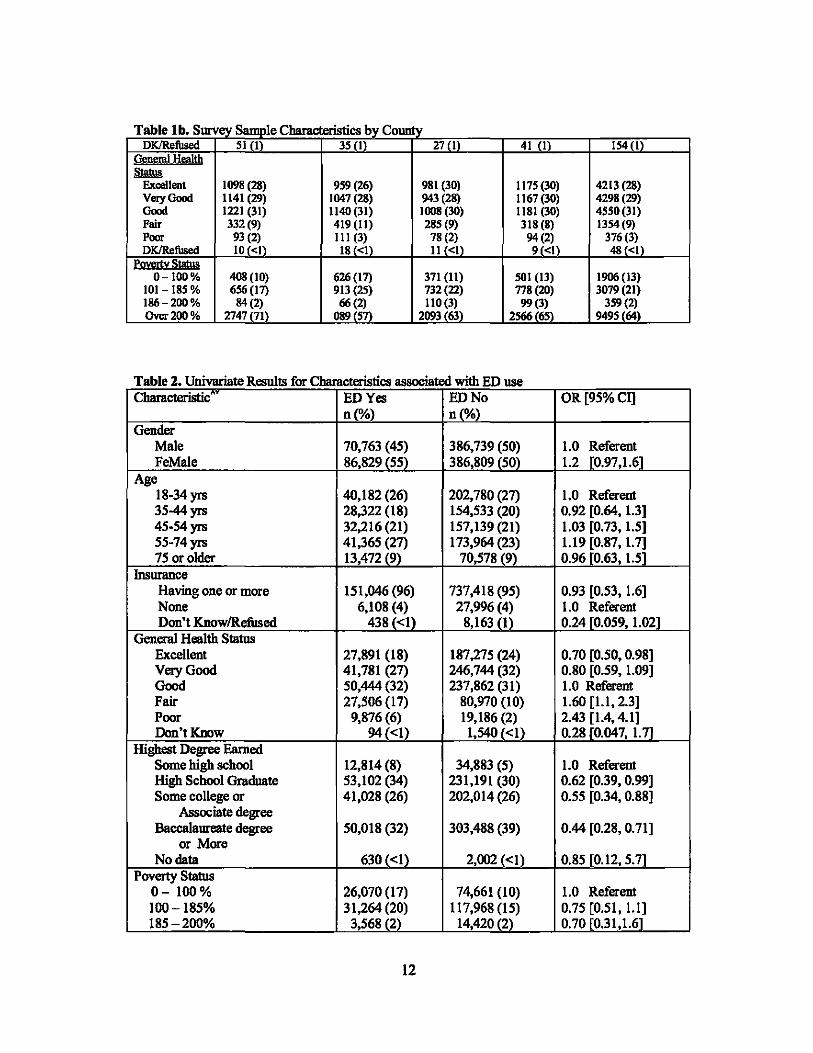
There were no statistically significant differences between ER users and non-ER users for
9
variables such as gender, age, ethnicity and insurance status after adjusting the Type I error mte
for multiple comparisons. General health status, and poverty status are found to be associated
with ER use in univariate analysis (Table 2). General health status, and poverty status are found
to be statistically sigoificant independent determinants of ER use (Table 3). People with
excellent health status are probably less likely to utilize ER services compared with people with
good health status (OR=O.72, CI=O.52 - 1.02). People with fair (OR=1.5, CI=1.06 - 2.11) or
poor (OR=2.21, CI=1.3 - 3.75) health status are more likely to use ER services compared to
individuals with good health status. Also, individuals with poverty status >200% utilize ER
services less frequently compared with those individuals below the poverty level (OR=O.56,
CI=O.40 - 0.78).
CAM use is not associated with ER utilization in this study; however, among ER users 51.0%
used at least one type of CAM. Among CAM users who use ER services, the highest percentages
of CAM users are White (48.3 %), Hawai'ianlPart Hawai'ian (18.3 %) and those individuals with
poor health status (33.0 %). Massage thempy (33.5 %) and Chiropmcty (33.3 %) are the most
used CAM services, followed by Acupuncture (19.0 %). The least used CAM service is
Chelation (1.6 %).
Table Is. Sur 'e'i PoouJation Characteristics bv Countv Oem_hie city & County of Hawai'I Kaua'I Maui Total Cbarac1eritie Honolulu - 0 (%) 0(%) 0("/0) 0(%) ~(OM
Gender Male 430~i~~~~~ ~~~g~~ 29,93~~~~ 67,221
1 ~~~ 604,863 (50)
Female 443 80 51 77 43 50 30,018 50 66 878 50 617418i51i Age
18-34 yrs 178,957 (27) 28,725 (25) 10,442 (23) 25,561 (26) 243,684 (27) 3544yrs 133,749 (20) 20,223 (18) 8,284 (19) 20,599 (21) 182,855 (20) 45-54 yrs 128,997 (20) 27,058 (23) 10,391 (23) 22,910 (23) 189,356(21) 55-74 yrs 152,228 (23) 29,100(25) 11,042 (25) 22,959 (23) 215,328 (24) 75 or older 61,873 (9) 10,225 (9)' 4,338 (loi 7,614 (8) 84,050 (9)
Ethnicity Chinese 45,410 (5) 1,259 (I) 452 (I) 489 «I) 47,609 (4) White 178,050 (20) 43,608 (28) 19,133 (32) 45,936 (34) 286,727 (23) Black 11,021 (I) 290 «I) 82 «I) 194 «I) 11,538 (I) Japanese 159,767 (18) 23,350 (IS) 7,028 (12) 13,817 (10) 203,963 (I~ Filioino 119,237 il4i 12,704 (8)' 9,915 (l7i 20686 (lSi 162,542 (13
10

Table Is. Survey Population Characteristics by County Korean 9,000 (I) 532 «I) 66«1) 639 «I) 10,236 (I) SamoanITongan 16,206 (2) 359 «I) 146 «I) 515 «I) 17,226 (I) Other 28,644 (3) 3,991 (3) 975 (2) 4,113 (3) 37,722 (3) Mixed (except 122,201 (14) 20,938 (14) 7,956 (13) 15,411 (II) 166,507 (14)
Hawai'ian) Hawai'ian/Part 169,964 (19) 44,652 (29) 13,532 (23) 30,341 (23) 258,490 (21)
Hawai'ian DKRofiJsed 14,206(2) 2,843 (2) 665 (2) 1,958 (I) 19,672 (2)
I!!suraru:e None 16,468 (2) 6,557 (4) 1,718 (3) 6, 160 (5) 30,903 (3) Having on. 846,102 (97) 146,353 (95) 57,770(96) 126,549 (94) 1,176,773 (96)
ormoro DKlRefiJsed 11137(1) 1,617(1) 461(1) 1.391 (I) 14605111
~eml~Jtb ~
Excellent 248,250 (28) 39,970 (26) 17,759 (30) 40,653 (30) 346,632 (28) Very Good 254,868 (29) 43,701 (28) 17,073 (28) 39,482 (29) 355,124 (29) Good 270,933 (31) 48,299 (31) 18,565 (31) 39,543 (29) 377,340(31) Fair 75,385 (9) 17,323 (II) 4,999 (8) 10,947 (8) 108,654(9) Poor 21,807 (2) 4,458 (3) 1,34~~:?1) 3,17~ ~:)1) 30,787 (3) DKlRefiJsed 2,464«1) 775 (Ii 204 <1 303 <1 3,745i<1l
fovertv Statu§ 0-100% 95,438 (II) 26,969(17) 6,778 (11) 16,546(12) 145,731 (12)
101-185% 145,259 (17) 38,938 (25) 13,211 (22) 26,056(19) 223,464 (18) 186- 200% 19,029 (2) 2,74;~;~ 2,14~~:~) 3,3~~~ 27,29~ (~2~) Over 200% 613,982 (70) 85,874 5 37,816 63 88120 825792 68
Table Ib S S 1 Cbaracteristi b County • urvey SlII11J)le cs Dyl Demographic City & County of Hawai'I Kaua'! Maui Total Cbamcteritic Honolulu - n (%) ;(o1.l ;(010) nc;/~ ~ ;';1.)
Gender Mal. 1906 (49) 1811 (49) 1~~~l 188~~~l 7245 (49) Female 1989 (51i 1883 (51i 1666 50 2056 52 7594 i51i
Age 18-34 yrs 784 (27) 624 (23) 521 (22) 708 (24) 2637 (24) 3544yrs 563 (20) 473 (17) 446 (18) 593 (20) 2075 (20) 45-54 yrs 587 (20) 677 (24) 577 (24) 668 (23) 2509 (23) 55-74yrs 680 (24) 747(27) 636 (26) 713 (25) 2776 (25) 75 or older 251 (9)- 246(9)- 238 (10i 223 (8)- 9S8(9i
Etbnici!)! Chinese 196 (5) 33 (1) 24(1) 17 «1) 270 (2) White 772 (20) 1068 (29) 1058 (32) 1305 (33) 4203 (28) Black 45(1) 7«1) 4«1) 7«1) 63 «1) Japan..., 698 (18) 562 (15) 399 (12) 395 (10) 2054 (14) Filipino 528 (14) 298 (8) 537 (16) 648 (16) 2011 (14) Korean 38(1) 14 «I) 3 «I) 19 «1) 74 «I) SamoanITongan 71 (2) 8«1) 8«1) 16«1) 103 (I) Other 122(3) 91 (2) 52(2) 116 (3) 381 (3) Mixed (oxcop! 547(14) 500 (14) 441 (13) 440(11) 1928 (13)
Hawai'ian) H.wai'ian/Part 813 (21) 1047 (28) 745 (23) 923 (23) 3528 (24)
Hawai'ian DKRefiJsed 65(2) 66 (2) 35(1) 58 (I) 22412\ msumnBi
None 72(2) 152 (4) 90(3) 179 (5) 493 (3) Having one 3m (97) 3507 (95) 3189(96) 3724 (94) 14192 (96)
or more
11
~ Excellent Very Good Good Fair Poor
1098 (28) 1141 (29) 1221 (31) 332 (9) 93 (2)
959 (26)
Table 2 Univariate Results for Cbaracteristics associated with ED use . Characteristic ED Yes ED No
n(%) n(%) Gender
Male 70,763 (45) 386,739 (50) FeMale 86,829 (55) 386,809 (50)
Age 18-34 yrs 40,182 (26) 202,780 (27) 35-44yrs 28,322 (18) 154,533 (20) 45-54yrs 32,216 (21) 157,139 (21) 55-74yrs 41,365 (27) 173,964 (23) 75 or older 13,472 (9) 70,578 (9)
1nsurance Having one or more 151,046 (96) 737,418 (95) None 6,108 (4) 27,996(4) Don't KnowlRefused 438 «1) 8,163 (1)
General Health Status Excellent 27,891 (18) 187,275 (24) Very Good 41,781 (27) 246,744 (32) Good 50,444 (32) 237,862 (31) Fair 27,506 (17) 80,970 (10) Poor 9,876 (6) 19,186 (2) Don't Know 94«1) 1,540 «1)
Highest Degree Earned Some high school 12,814 (8) 34,883 (5) High School Graduate 53,\02 (34) 231,191 (30) Some college or 41,028 (26) 202,014 (26)
Associate degree Baccalaureate degree 50,018 (32) 303,488 (39)
or More No data 630 «1) 2,002 «1)
Poverty Status 0- 100 % 26,070 (17) 74,661 (10) 100-185% 31,264 (20) 117,968 (15) 185-200% 3,568 (2)· 14,420 (2)
12
OR [95%CI]
1.0 Referent 1.2 [0.97,1.6]
1.0 Referent 0.92 [0.64, 1.3] 1.03 [0.73, 1.5] 1.19 [0.87, 1.7] 0.96 [0.63, 1.5j
0.93 [0.53, 1.6] 1.0 Referent 0.24 [0.059, 1.021
0.70 [0.50,0.98] 0.80 [0.59, 1.09] 1.0 Referent 1.60 [l.I, 2.3] 2.43 [1.4,4.1] 0.28 [0.047, 1.7]
1.0 Referent 0.62 [0.39, 0.99] 0.55 [0.34, 0.88]
0.44 [0.28, 0.71]
0.85 [0.12, 5.71
1.0 Referent 0.75 [0.51, 1.1] 0.70 [0.31,1.61
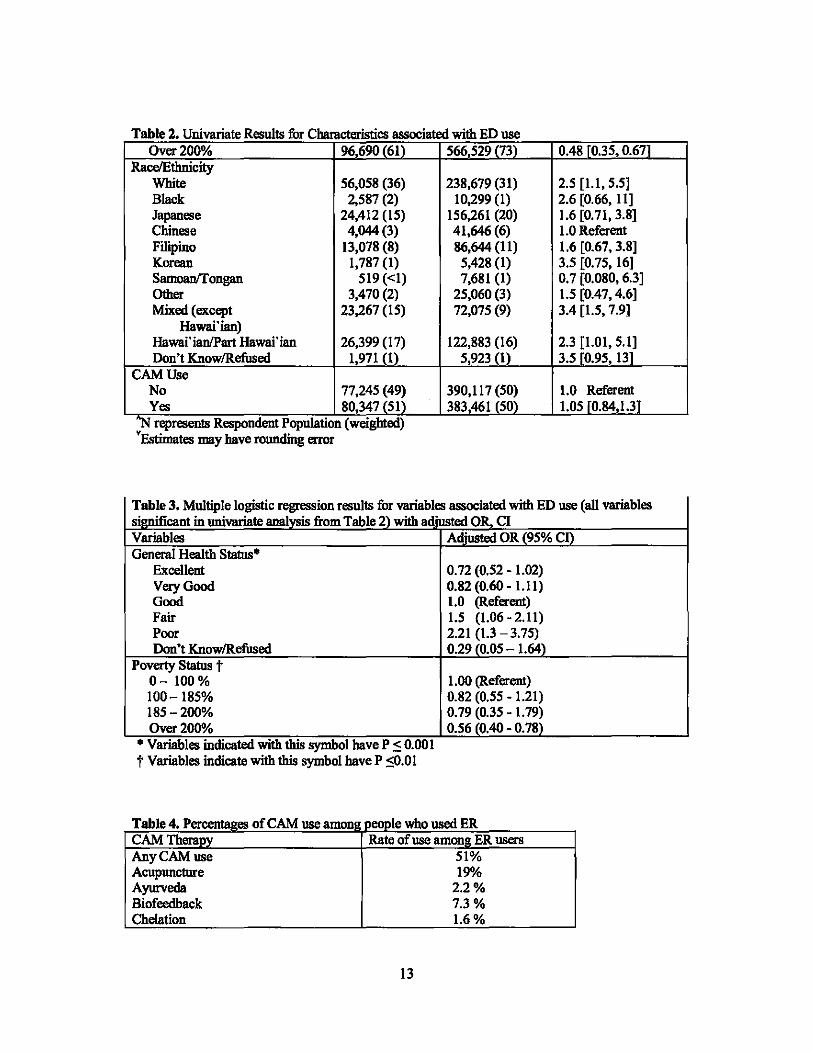
Table 2 Univariate Results for Characteristics associated with ED use . Over 200010 96690(61) 566 529(73) 0.48 [0.35,0.671
RacelEthnicity White 56,058 (36) 238,679 (31) 2.5 [1.1, 5.5] Black 2,587 (2) 10,299 (1) 2.6 [0.66, 11] Japanese 24,412 (15) 156,261 (20) 1.6 [0.71, 3.8] Chinese 4,044(3) 41,646 (6) 1.0 Referent Filipino 13,078 (8) 86,644 (11) 1.6 [0.67,3.8] Korean 1,787 (1) 5,428 (1) 3.5 [0.75, 16] Samoan!fongan 519 «1) 7,681 (1) 0.7 [0.080, 6.3] Other 3,470 (2) 25,060 (3) 1.5 [0.47,4.6] Mixed (except 23,267 (15) 72,075 (9) 3.4 [1.5, 7.91
Hawai'ian) Hawai'ian/Part Hawai'ian 26,399 (17) 122,883 (16) 2.3 [1.01, 5.1] Don't KnowlRefused 1,971 (1) 5,923(1) 3.5 [0.95, 13f
CAM Use No 77,245 (49) 390,117 (50) 1.0 Referent Yes 80,347 (51) 383,461 (50) 1.05 [0.84,1.3]
"N resents R ndentP ulation (weighted) • rep espo op Estimates may have rounding error
Table 3. Multiple logistic regression results for variables associated with ED use (all variables si' t in nnivariate analysis from Table 2) with adjusted OR,_ CI Variables General Health Status·
Excellent Very Good Good Fair Poor Don't KnowlRefused
Poverty Status t 0- 100% 100-185% 185 -200% Over 200010
• Variables mdicated WIth this symbol have P =s 0.001 t Variables indicate with this symbol have P =SO.OI
Adiusted OR (95% cn
0.72 (0.52 - 1.02) 0.82 (0.60 - 1.11) 1.0 (Referent) 1.5 (1.06 - 2.11) 2.21 (1.3 -3.75) 0.29 (0.05 - 1.64)
1.00 (Referent) 0.82 (0.55 - 1.21) 0.79 (0.35 - 1.79) 0.56 (0.40 - 0.78)
Table 4. P es of CAM use amanu POODle who used ER CAM Therapy Rate of use among ER users Any CAM use 51% Acupuncture 19% Ayurveda 2.2% Biofeedback 7.3% Chelation 1.6%
13

Table 4. Percentages of CAM use amon~ people who used ER CAM Therapy Rate of use among ER users Chiropractic 33% Curanderismo 3.6% Reiki 8.5% Hypnosis 6.4% Massage Therapy 34% Naturopathy 12%
Dlseusslon
Understanding an accurate relationship between patient characteristics and ER use is important to
design successful policies and to direct appropriate resources to health care. Gender, age, and
insurance status are equally distributed among ER users and among non-ER users. Ethnicity was
found to be significantly associated with ER use; however, this result is inconsistent with one past
stody which reported that race was not a mctor influencing ER use after adjusting for insurance
and health status. 7 Our results may be an underlying reflection ofHawai'i's diverse population
with its multiple ethnicities. We also found that poor health was strongly associated with ER use,
which is consistent with many other stodies.2
Another finding of the stody is that CAM users do not differ in their utilimtion of ER, which is
consistent with another past study • that showed no association between CAM use and ER use.
Respondents with exce1lent health status have signifICantly less probability of using ER
(OR=O.72); however the confidence interval spanned unity and respondents with :fuir and poor
health status have an increased probability of using ER (OR=I.5, 2.21 respectively) compared
with those who have good health status. Some results found in this stody are consistent with
prior studies (Weber, E.J., et aL, Li, JZ., et al.') but these results also conflict with findings from
other studies (Stratmann, W.C. and R. Ullman'). This inconsistency may be due to the filet that
most of the past studies were conducted in the setting of an individual department or in a clinical
14
setting.
A major strength of this data is that it was collecled for a representative sample of the state's
population. All questions were asked of all respondents regardless of gender and age. The large
sample facilitated investigation of self reported health status, access to healthcare, and medical
insurance coverage. CAM data has several limitations. First, they are dependent on the
respondent's knowledge of CAM therapies. Second, collection of data at only one point results io
an ioahility to study changes that occur over time.
ConclnsloD
Ethnicity was not an important determioant of ER use after adjusting for general health status and
poverty level CAM use was not a significant predictor of ER use io a univariate model and
multivariate analysis results did not change substantially regardless if CAM use was iocluded io
the model. It seems likely that CAM use does not differ between ER users and non-users io this
population. Population studies of ER use should be conducted to further evaluate whether CAM
use differences exist among those usiog ER services that are not exp1aioed by differences io
demographics, health, socio economic status or other determinants of ER use.
References
1. McCaig, L. and C. Burt, Nationol Hospital Ambulatory Medical Care Survey: 2002
emergency department summary. Advance data from vital and health statistics. No 340,
2004. Hyattsville, MD: National Center. for Health Statistics.
2. Weber, E.J., et aI., Does lack of a usual source of care or health insurance increase the
likelihood of an emergency department visit? Results of a natlonol population-based
study. Ann Emerg Med, 2005. 45(1): p. 4-12.
15

3. Sorondo, B., et aI., Factors contributing to Increased emergency department use among
potients with chronic conditions. Ann Emer Med, October 2004. 44(4): p. S 117.
4. Perkofl: G.T. and M. Anderson, Relationship between demographic characteristics.
potient's chief complaint. and medical care destination in an emergency room. Med Care,
1970.8(4): p. 309-23.
5. White-Means, S.1. and M.C. Thornton, Nonemergency visits to hospital emergency
rooms: a comparison of blacks and whites. Milbank Q, 1989.67(1): p. 35-57.
6. Baker, D. W., C.D. Stevens, and R.H. Brook, Determinants of emergency department use:
are race and ethnlcity important? Ann Emer Med, 1996. 28(6): p. 677-82.
7. Stratmann, W.C. and R. Ullman, A study of consumer attitudes about health care: the
role of the emergency room. Med Care, 1975. 13(12): p. 1033-43.
8. Barnes, P.M, et aI., Complementary and alternative medicine use among adults: United
States. 2002. Advance data from vital and health statistics. No. 343, 2004. Hyattsville,
Maryland: National Center for Health Statistics.
9. Li, JZ., et al., Patterns of complementary and alternative medicine use in ED patients
and its association with health care utilization. Am J Emerg Med, 2004. 22(3): p. 187-91.
10. Singer, A. and J. Gulla, Have emergency department patients used or are willing to use
alternative medicine? AnnofEmer Med, October 1999. 34(4): p. S64.
11. Hawat '/ Health Survey. 2003 Procedure Manual. Hawai'j Department ofHea1th.
Office of Health Status Monitoring.
12. Research Triangle Institute. SUDAAN. Available at
http://www.rtLorgipage.cfin?nav=285&objectid=86A27EB6-19B8-44C7-
88E6BCB1 D44B9D90. Accessed Apr 15, 2006.
16

13. Get the facts: what Is acupuncture. National Centers for Complimentary and Alternative
Medicine Use. Available at h!tp:llnccam.nikgovlhea/thlacupuncturelacupuncture.pt{f
Accessed May 20, 2006.
14. Get the facts: what Is complimentary and alternative medicine. National Centers for
Complimentary and Alternative Medicine Use. Available at
hnp:llnccam.nlkgov/healthlwhatiscam/pq[lwhatlscam.p4f Accessed May 20, 2006.
15. Hochberg Y, Benjamini Y. More poweiful procedures/or multiple significance
testing. Stat Med 1990;9:811-818.
16. Frankel LR. The report a/the CASRO task/orce on response rates. Available at:
www.casro.org/resprates.cfin. Accessed May 12, 2007.
17