1 Excess Non-Psychiatric Hospitalization and Emergency Department Use Among Medi-Cal Beneficiaries...
26
1 Excess Non-Psychiatric Excess Non-Psychiatric Hospitalization and Emergency Hospitalization and Emergency Department Use Department Use Among Medi-Cal Beneficiaries with Among Medi-Cal Beneficiaries with Serious Mental Illness Serious Mental Illness Preliminary Results Preliminary Results Cheryl E. Cashin, Ph.D. Cheryl E. Cashin, Ph.D. UC Berkeley School of Public Health UC Berkeley School of Public Health California Institute of Mental Health California Institute of Mental Health February 7, 2008 February 7, 2008 California Mental Health Care California Mental Health Care Management Program (CalMEND): Management Program (CalMEND): A Quality Improvement Collaborative A Quality Improvement Collaborative
-
Upload
abraham-garlington -
Category
Documents
-
view
217 -
download
3
Transcript of 1 Excess Non-Psychiatric Hospitalization and Emergency Department Use Among Medi-Cal Beneficiaries...

1
Excess Non-Psychiatric Hospitalization and Excess Non-Psychiatric Hospitalization and Emergency Department Use Emergency Department Use
Among Medi-Cal Beneficiaries with Among Medi-Cal Beneficiaries with Serious Mental IllnessSerious Mental Illness
Preliminary ResultsPreliminary Results
Cheryl E. Cashin, Ph.D.Cheryl E. Cashin, Ph.D.UC Berkeley School of Public Health UC Berkeley School of Public Health California Institute of Mental HealthCalifornia Institute of Mental Health
February 7, 2008February 7, 2008
California Mental Health Care California Mental Health Care Management Program (CalMEND): Management Program (CalMEND): A Quality Improvement A Quality Improvement CollaborativeCollaborative
California Mental Health Care California Mental Health Care Management Program (CalMEND): Management Program (CalMEND): A Quality Improvement A Quality Improvement CollaborativeCollaborative

2
AcknowledgmentsAcknowledgments Funding from the National Institute of Mental Health (Mental
Health Economics Research Training Grant)
The CalMEND Team
Special thanks to the research team: Dr. Barry Handon, DHCS Marco Gonzales, DHCS Pauline Chan, DHCS
and Julie Cheung, CalMEND Karin Kalk, CalMEND Jim Klein, DHCS

3
The ProblemThe Problem
Compared with the general population, individuals with serious mental illness:
have higher rates higher rates ofof physical illnessphysical illness and reduced life reduced life expectancyexpectancy
have greater likelihood of multiple co-occurring chronic greater likelihood of multiple co-occurring chronic conditionsconditions
may have less accessless access to timely, appropriate primary health care
Untreated medical conditions may lead to lower quality lower quality of lifeof life, barriers to recoverybarriers to recovery, and overuse of costly overuse of costly servicesservices

4
Evidence from Other StatesEvidence from Other States Growing awareness that Medicaid beneficiaries with
multiple chronic conditions are the costliest:
4% of Medicaid beneficiaries nationally account for 50% of expenditures
Adults with chronic conditions make up 40% of the Medicaid population but > 80% of expenditures
Little evidence specific to the SMI population
Results from NY suggest total claims for the SMI population can be up to 2x claims for other disabled population (Billings and Mijanovich 2007)
5
Objectives of the StudyObjectives of the Study
Examine differences in the patterns of health patterns of health care utilizationcare utilization between individuals with and without SMI
Identify excess hospitalization excess hospitalization and emergency emergency department use department use and costs costs attributable to having a SMI
Identify characteristics of health service characteristics of health service deliverydelivery and quality of carequality of care associated with excess costs that are amenable to intervention
6
DataData
Medi-Cal eligibility and claims files for individuals with and without SMI from 2002-2006
Criteria for identification of SMI: Short-Doyle claim and/or Antipsychotic prescription
Other selection criteria:
Continuous Medi-Cal eligibility (2002-2006)
Age between 18 and 64
Fee-for-service only (not enrolled in managed care)
7
Measures to Protect ConfidentialityMeasures to Protect Confidentiality
CPHS approval of the research project
Protected health information analyzed contains no no identifying informationidentifying information (e.g. name, address, SSN)
Data are encrypted, password-protected, and stored in a locked room
Results will be presented as aggregate statistical analysis only

8
Sample SizeSample Size
SMI
Control (Non-SMI)Total 268,732
88,476
180,256
# of Beneficiaries Included
SMI
Control (Non-SMI)Total 268,732
88,476
180,256
# of Beneficiaries Included

9
The Study Population: The Study Population: Total Claims in 2006Total Claims in 2006
$5.3 $5.4
$0.0
$1.0
$2.0
$3.0
$4.0
$5.0
$6.0
SMI Non-SMI
Bil
lio
n $
billion billion

10
The Study Population: The Study Population: Per Capita Claims in 2006Per Capita Claims in 2006
$59,790
$29,957
$0
$10,000
$20,000
$30,000
$40,000
$50,000
$60,000
$70,000
SMI Non-SMI
$

11
MethodsMethods
Comparison of mean hospitalization ratesmean hospitalization rates between the SMI and control population
Unadjusted means
Logistic regressionLogistic regression to adjust means to control for age, gender and ethnicity
Estimate the probability of hospitalization given specific individual characteristics
Examine statistical significance of the effect of SMI on the probability of hospitalization

12
Results:Results:Unadjusted MeansUnadjusted Means
Chi-2 = 710.56Pr = 0.000**
Hospitalized Not Hospitalized
Total
SMI 14.2%14.2%
(12,545)
85.8%
(75,931)
88,476
Non-SMI 10.7%10.7%
(19,193)
89.3%
(161,063)
180,256
Total 11.8%
(312,738)
88.2% (236,994)
268,732

13
Results:Results:Logistic RegressionLogistic Regression
SMI is associated with a 31.2% increase31.2% increase in the odds of being hospitalized in a given year, controlling for individual characteristics
This effect is statistically significant at the 1% level
Age, gender and ethnicity also have statistically significant effects

14
0.0%
5.0%
10.0%
15.0%
20.0%
25.0%
30.0%
Afr
ican
Am
eric
an
Latin
o
Whi
te
Asi
an a
ndot
her
Afr
ican
Am
eric
an
Latin
o
Whi
te
Asi
an a
ndot
her
Male Female
SMI
No SMI
Gender and Ethnic Differences in Gender and Ethnic Differences in Impact of SMI on Non-Psychiatric HospitalizationImpact of SMI on Non-Psychiatric Hospitalization
Age 56-64
Highest Hospitalization RatesLow Impact of SMI
% H
ospi
taliz
ed

15
0.0%
5.0%
10.0%
15.0%
20.0%
25.0%
30.0%
Afr
ican
Am
eric
an
Latin
o
Whi
te
Asi
an a
ndot
her
Afr
ican
Am
eric
an
Latin
o
Whi
te
Asi
an a
ndot
her
Male Female
SMI
No SMI
Gender and Ethnic Differences in Gender and Ethnic Differences in Impact of SMI on Non-Psychiatric HospitalizationImpact of SMI on Non-Psychiatric Hospitalization
Age 56-64
Lowest Hospitalization RatesLow Impact of SMI
% H
ospi
taliz
ed

16
0.0%
5.0%
10.0%
15.0%
20.0%
25.0%
30.0%
Afr
ican
Am
eric
an
Latin
o
Whi
te
Asi
an a
ndot
her
Afr
ican
Am
eric
an
Latin
o
Whi
te
Asi
an a
ndot
her
Male Female
SMI
No SMI
Gender and Ethnic Differences in Gender and Ethnic Differences in Impact of SMI on Non-Psychiatric HospitalizationImpact of SMI on Non-Psychiatric Hospitalization
Age 56-64
Highest Impact of SMI
% H
ospi
taliz
ed
17
0.0%
5.0%
10.0%
15.0%
20.0%
25.0%
30.0%
Afr
ican
Am
eric
an
Latin
o
Whi
te
Asi
an a
ndot
her
Bla
ck
Latin
o
Whi
te
Asi
an a
ndot
her
Male Female
SMI
No SMI
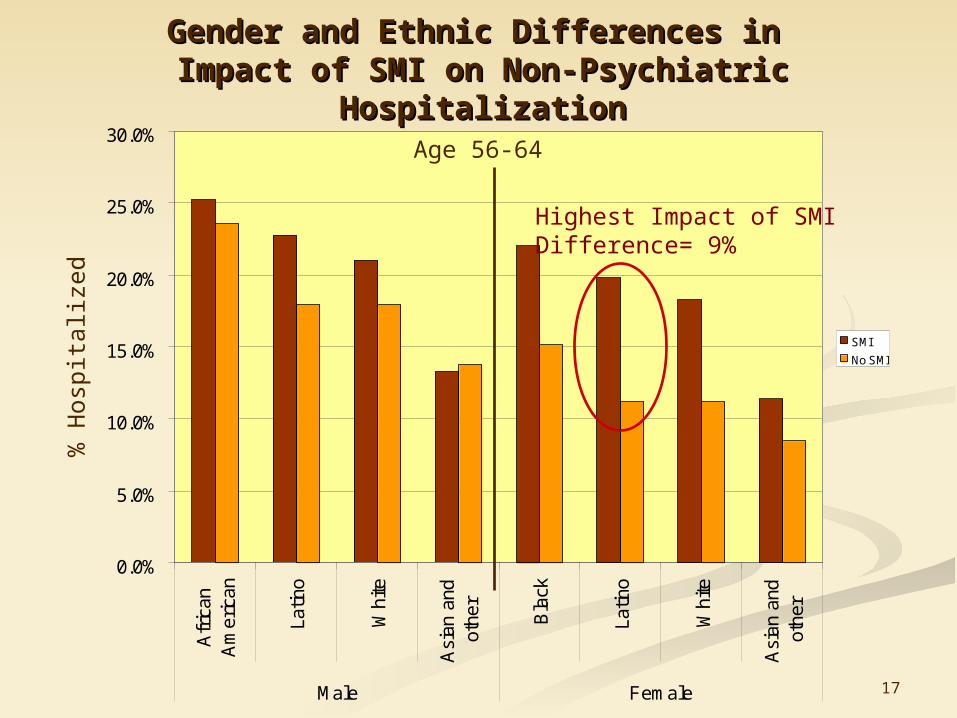
Gender and Ethnic Differences in Gender and Ethnic Differences in Impact of SMI on Non-Psychiatric HospitalizationImpact of SMI on Non-Psychiatric Hospitalization
Age 56-64
Highest Impact of SMIDifference= 9%
% H
ospi
taliz
ed

18
Ambulatory Care-Sensitive Ambulatory Care-Sensitive HospitalizationHospitalization
Ambulatory care sensitive (ACS) hospitalization
a hospital admission that should be avoidablehospital admission that should be avoidable with effective intervention at the primary health care level
ACS hospitalization is widely used:
As an indicator of access, quality and effectiveness of primary health care
To measure/monitor health disparities

19
Ambulatory Care-Sensitive Diabetes Ambulatory Care-Sensitive Diabetes HospitalizationHospitalization
Used Institute of Medicine ICD-9 criteria for ambulatory care-sensitive diabetes hospitalization
Primary diagnosis ICD-9 code =
2500-2503, 2508, or 2509

20
Results:Results:Unadjusted MeansUnadjusted Means
Chi-2 = 39.65Pr = 0.000**
Hospitalized for ACS Diabetes
Diagnosis
Not Hospitalized
Total
SMI 0.30%0.30%
(265)
99.7%
(88,211)
88,476
Non-SMI 0.10%0.10%
(233)
99.9%
(180,023)
180,256
Total 0.02%
(498)
99.8%
(268,234)
268,732

21
Results:Results:Logistic RegressionLogistic Regression
SMI is associated with a 53.0% increase53.0% increase in the odds of being hospitalized in a given year, controlling for individual characteristics
This effect is statistically significant at the 1% level
Age, gender and ethnicity also have statistically significant effects.

22
Gender and Ethnic Differences in Gender and Ethnic Differences in Impact of SMI on ACS-Diabetes HospitalizationImpact of SMI on ACS-Diabetes Hospitalization
0.0%
0.1%
0.2%
0.3%
0.4%
0.5%
0.6%
0.7%
0.8%
AfricanAmerican
Latino White Asian andother
AfricanAmerican
Latino White Asian andother
Male Female
SMI
No SMI
Age 46-55
No significantdifference
No significantdifference
Highest hospitalization rates
% H
ospi
taliz
ed

23
Gender and Ethnic Differences in Gender and Ethnic Differences in Impact of SMI on ACS-Diabetes HospitalizationImpact of SMI on ACS-Diabetes Hospitalization
0.0%
0.1%
0.2%
0.3%
0.4%
0.5%
0.6%
0.7%
0.8%
AfricanAmerican
Latino White Asian andother
AfricanAmerican
Latino White Asian andother
Male Female
SMI
No SMI
Age 46-55
No significantdifference
No significantdifference
Highest impact of SMI
% H
ospi
taliz
ed

24
What Does This Tell Us So Far?What Does This Tell Us So Far?
Medi-Cal beneficiaries with SMI have significantly non-psychiatric hospitalization, even relative to another high-need population
African Americans, with and without SMI, have the highest rates of hospitalization
Females and Latinos are particularly vulnerable to the impact of SMI
Specific chronic conditions, such as diabetes, may be important causes of excess hospitalization among the SMI population

25
How can the results be used?How can the results be used?
Next steps required:
Quantifying the excess costs of excess hospitalization among the SMI population can justify investment in justify investment in interventionsinterventions.
Identifying factors associated with increased hospitalization among the SMI population can contribute to the design of interventionscontribute to the design of interventions.

26
Thank you.Thank you.
Cheryl E. Cashin, Ph.D.Cheryl E. Cashin, Ph.D.
California Mental Health Care Management Program (CalMEND): A Quality Improvement Collaborative