ii - University of Mississippi
43
Measurements of the Primary Bjerknes Force in a Cavitating Ultrasonic Field By Mason Smith A thesis submitted to the faculty of The University of Mississippi in partial fulfillment of the requirements of the Sally McDonnell Barksdale Honors College. Oxford May 2019 Approved by ________________________________ Advisor: Dr. Joel Mobley ________________________________ Reader: Dr. Cecille Labuda ________________________________ Reader: Dr. Joseph Gladden
Transcript of ii - University of Mississippi
MeasurementsofthePrimaryBjerknesForceinaCavitatingUltrasonicFieldBy
MasonSmith
AthesissubmittedtothefacultyofTheUniversityofMississippiinpartialfulfillmentoftherequirementsoftheSallyMcDonnellBarksdaleHonorsCollege.
OxfordMay2019
Approvedby
________________________________Advisor:Dr.JoelMobley
________________________________Reader:Dr.CecilleLabuda
________________________________Reader:Dr.JosephGladden

ii
©2019BradleyMasonSmithALLRIGHTSRESERVED

iii
DEDICATION
Iwouldliketodedicatethisworktomyparents,BillyandRochelle.Iamforever
gratefulfortheamountofloveandcarethattheyhaveinvestedinme.
iv
ACKNOWLEGEMENTS
IwouldfirstliketothankDr.JoelMobley.Hehasbeenanexcellentmentor
andresearchadvisor.IfitwerenotforDr.Mobley,thenIwouldneverhavelearned
abouttheBasicAcousticSummerSchool(BASS)program.ItwasduringtheBASS
programthatIparticipatedinresearchattheNationalCenterforPhysicalAcoustics
(NCPA).IamverythankfulforDr.Mobleyallowingmetheopportunitytoworkwith
himandamthankfulforhispatienceincompletingthisthesis.
Iwouldnextliketothankmyreaders.Dr.LabudaandDr.Gladdenvery
kindlyagreedtobereadersforthiswork,soifitwerenotforthem,Iwouldnothave
beenabletocompletethisthesis.
MynextthankyouisforRandaBaioni.Shehasbeenmybestfriendsincewe
firstmetinHonors101.Shehashelpedmethroughtoughtimesandcontinuesto
stillsupportme.Iamverygratefulforourfriendship.
Tomyfather,mother,andbrothers,thankyouforbelievinginme.Thankyou
foryourloveandsupportofme.
Andfinally,IwouldliketothanktheSallyMcDonnellBarksdaleHonors
Collegeforencouragingmetocompletethisthesis.Iamverythankfulforthis
opportunitytosharemyresearch.
v
ABSTRACT
Cavitationistheresultwhentherearerapidchangesinpressureinaliquid.
Thesevapor-filledcavitiescanoccurwhenultrasoundpropagatesthroughwaterat
sufficientpower.Thevolumesofthesecavitiescanpulsateandcanevencouplewith
theradiationpressurefromtheultrasound.Theresultisatranslationalforceonthe
bubbles.ThistranslationalforceonthebubbleiscalledtheprimaryBjerknesforce.
ThesecondaryBjerknesforceistheresultoftwopulsatingcavities,butthisforceis
ignoredsincethebuoyantforceandtheprimaryBjerknesforcearethedominant
forces.Immediatelybeforeabubblebeginstorise,thenetforceonthebubbleis
equaltozero.Therefore,theprimaryBjerknesforceandthebuoyantforceare
equal.TheprimaryBjerknesforcecanbeindirectlymeasuredbymeasuringthe
diameter(andthusthevolume)ofabubbleimmediatelybeforeitrises.Diameters
ofbubblesweremeasuredusingavideocamcorderandanopen-sourceprogram
calledImageJ.Threesetsofdataweretaken.Eachsetofdataincludesfourcritical
bubbles.TheprimaryBjerknesforcerangesfrom0.15µNto0.41µN.Recent
researchandfutureworkarediscussed.

vi
TABLEOFCONTENTS
1INTRODUCTION......................................................................................................................................1
2THEPROPAGATIONOFULTRASOUNDTHROUGHWATER...............................................2
3THEPRIMARYBJERKNESFORCE...................................................................................................3
3.1THEORYOFTHEPRMIARYBJERKNESFORCE................................................................3
3.2EQUATIONOFTHEPRIMARYBJERKNESFORCE...........................................................5
4INITIALRESEARCHOFTHEPRIMARYBJERKNESFORCE..................................................6
4.1SETUPFORTHESCATTEREDLIGHTMETHOD...............................................................6
4.2METHODS.......................................................................................................................................12
4.3DATAANDRESULTS.................................................................................................................20
5RECENTRESEARCHOFTHEPRIMARYBJERKNESFORCE...............................................26
5.1IMPROVEMENTOFMETHODS..............................................................................................26
5.2RECENTDATAANDRESULTS...............................................................................................28
6CONCLUSIONS.......................................................................................................................................31
7FUTUREWORK.....................................................................................................................................32

vii
LISTOFFIGURESANDTABLES
Figure1:PictureofVilhelmBjerknes.............................................................................................12
Figure2:Schematicdiagramofthesetup.....................................................................................15
Figure3:Pictureofsetup.....................................................................................................................16
Figure4:Close-upoftransducerandreflector...........................................................................17
Figure5:Lineofbubbles......................................................................................................................19
Figure6:Fieldofcavitation.................................................................................................................21
Figure7:Close-upofcavitation.........................................................................................................22
Figure8:Close-uptoillustratestructure......................................................................................23
Figure9:Schematicsetupoflaserlight.........................................................................................25
Figure10:Laserwithcollimatorandaperture..........................................................................26
Figure11:Illuminatingaplaneofcavitation...............................................................................28
Figure12:Close-upofaplaneofbubbles.....................................................................................29
Figure13:CriticalDiameters..............................................................................................................30
Figure14:CriticalVolumes.................................................................................................................31
Figure15:CriticalForces.....................................................................................................................32
Table1:ClassificationofBubbles.....................................................................................................33
Table2:SomeDataforSets.................................................................................................................33
Table3:SummaryofMeasurements...............................................................................................33
Figure16:Bubblesindiffuselight...................................................................................................35
Figure17:Recentmeasurement.......................................................................................................37
Figure18:Side-by-sidecomparison................................................................................................38
Figure19:Hydrophonescanoftransducer..................................................................................41

1INTRODUCTION
Thephysicalphenomenonofsoundisonethatmostpeoplearefamiliarwith.
Thebranchofphysicsthatisconcernedwiththepropagationofmechanicalwaves
throughsolids,liquids,andgasesisknownasacoustics.Thestudyofacousticsdates
back to the 6th century BCE when Pythagoras mathematically described the
propertiesofstringedmusicalinstruments(Karamanides,2006).Astimeprogressed
andthestudyofnaturally-occurringphenomenawasunifiedinwhatwenowknow
asthescienceofphysics,mechanicalwavesbecamebetterunderstoodanddescribed
inmathematicalterms(Berg,2018).Soundcanbeclassifiedaccordingtofrequency.
Theseclassificationsare infrasound(soundwithfrequenciesbelowwhichhumans
canhear),sound(soundswithfrequencieswhichhumanscanhear),andultrasound
(sound with frequencies above which humans can hear). While the study of
infrasoundandsoundcoveravarietyofsubjects,thestudyofultrasoundrevealsa
widevarietyofapplicationsandunusualphenomena.
Ultrasound was first encountered in the 18th century by Italian scientist
Lazzaro Spallanzani during his study of echolocation in bats (Bates, 2011).
UltrasoundwasfirstproducedbyhumanswhenSirFrancisGaltoncreatedwhatis
nowknownasaGaltonwhistle(HistoryofUltrasound|Timelinesince1794,2014).
Ultrasoundhasmanyusefulapplications.Oneoftheseapplicationsisnon-destructive
testing(NDT)whichwasfirstproposedin1929byRussianscientist
1

Sergei Sokolov (A Brief History of Non-Destructive Testing, 2014). The use of
ultrasoundinmodernmedicineismadepossiblebytheuseofultrasonictransducers.
Thesetransducersmakeuseofthepiezoelectriceffect,whichwasdiscoveredin1880
byFrenchphysicistsPierreandPaul-JacquesCurie(Piezoelectricity,2018).Thestudy
of the primary Bjerknes force is one that ismotivated by innovations inmodern
medicinefordrugdelivery.Oneproposedwayofdeliveringdrugstoparticularsites
withinabodyistousepolymer-coatedmicrobubbles(Memolietal,2018).Therefore,
itisimportanttoknowhowtheprimaryBjerknesforceinteractswithmicrobubbles.
2

2THEPROPAGATIONOFULTRASOUNDTHROUGHWATER
Whenultrasoundofsufficientpowerpropagatesthroughwater,itcancreate
cavitationbubbles.Thesearegas-filledcavitiesthatareformedduringthenegative
pressure phase of the acoustic cycle. A small air pocket on a piece of particulate
matter,whichisitselftoosmalltobeseen,growsduringthenegativepressurephase.
As itgrows,gasesdissolved in thewateraredrawninto thebubble,allowing it to
grow to a size large enough to be visualized. Acoustic cavitation is a high power
phenomenon. At low powers, ultrasound will propagate through the water as a
normalwavewithoutchangingthestructure(e.g.,introductioncavitationbubbles)
ofthemedium.Oncethebubblesaregenerated,theycanbetrappedbythegradient
intheultrasonicpressurefield.
3

3THEPRIMARYBJERKNESFORCE
3.1THEORYOFTHEPRIMARYBJERKNESFORCE
It was in 1906 when Norwegian physicist Vilhelm Bjerknes (Figure 1)
publishedFieldsofForce.InFieldsofForce,Bjerknesbeginsbydescribingelectric
andmagneticfields.Hethenextendsthistreatmentofelectricandmagneticfieldsto
fields–specificallythoseinhydrodynamics–thathaveanalogousproperties.Itwas
inthiswaythatBjerkneswasabletomathematicallyderivethetranslationalforceon
bubblesinanacousticfield.
Gasesaredissolvedinliquids.Thesegasesinwatercanbeexcitedandthus
canincreaseinvolume.Whenthesegasesincreaseinvolume,gas-filledbubblesform.
Gas-filled bubbles that are subject to an acoustic pressure field undergo volume
oscillations.Thesevolumeoscillationscancouplewithanon-zeroacousticpressure
gradient.TheresultisatranslationalforceknownastheprimaryBjerknesforce.The
primaryBjerknesforceisequaltothenegativeproductofthetime-varyingvolumeof
abubbleandthepressuregradient. If thisproductvarieswithtime, thenthetime
averageistaken.
𝐹 = − 𝑉 𝑡 𝛻𝑃(𝑟, 𝑡)
ThistranslationalforcewasfirstformulatedbyBjerknes(1906)butwaslater
described by Blake (1949). As ultrasound travels through water, dissolved gases
increaseinvolumeandbecomegas-filledbubbles.Ifthesegas-filledbubbles
4

Figure1
PictureofVilhelmBjerknes.Bjerknes(1862-1951) was a Norwegian physicist whohelped establish the modern field ofmeteorology. It is after Bjerknes for whichthe primary Bjerknes force is named.https://snl.no/Vilhelm_Bjerknes
5

occur at pressure antinodes, theymigrate away. These gas-filled bubbles become
trappedbypressuregradientsandbegintocoalesce.Theforcesonthesebubblesare
thebuoyantforce,theprimaryBjerknesforce,andthesecondaryBjerknesforce.The
secondary Bjerknes force is a force between two pulsating bubbles and is not
consideredinthisworkbecauseweareassumingthatthetheprimaryBjerknesforce
hasthemostinfluenceonthetrappingofabubbleinthefield.
3.2EQUATIONOFTHEPRIMARYBJERKNESFORCE
TheprimaryBjerknesforceisgivenby
𝐹 = − 𝑉 𝑡 𝛻𝑃(𝑟, 𝑡)
The time-varyingvolume𝑉(𝑡) canbedescribed in termsof a time-varying radius
givenby
𝑅𝑅 +32𝑅i =
1𝜌 𝑃k +
2𝜎𝑅k
− 𝑃m𝑅k𝑅
no
−2𝜎𝑅−4𝜇𝑅𝑅
− 𝑃k − 𝑃 𝑡
where𝑅kistheequilibriumradiusofabubble,𝑃kisthehydrostaticpressure,𝑃misthe
vaporpressureinsidethebubble,𝜅isthepolytropicindexofthegas,𝑃(𝑡)isthetime-
varyingpressure,and𝜌, 𝜎,and𝜇aretheliquiddensity,thesurfacetension,andthe
viscosityoftheliquid,respectively(Leighton,1989).Thisequationisknownasthe
Rayleigh-PlessetequationandisderivedfromtheNavier-Stokesequationunderthe
assumption that thebubblesare spherically symmetric.When theacoustic field is
continuous,themagnitudeoftheprimaryBjerknesforcecanbewrittenas
𝐹 = 𝛼𝑃u𝜋𝑓𝑉k𝑐y
where 𝛼 is a constant, 𝑃u is the pressure amplitude, 𝑓 is the frequency, 𝑉k is the
equilibriumvolumeofabubble,and𝑐yisthespeedofsoundinwater.
6

4INITIALRESEARCHOFTHEPRIMARYBJERKNESFORCE
4.1EXPERIMENTALSETUP
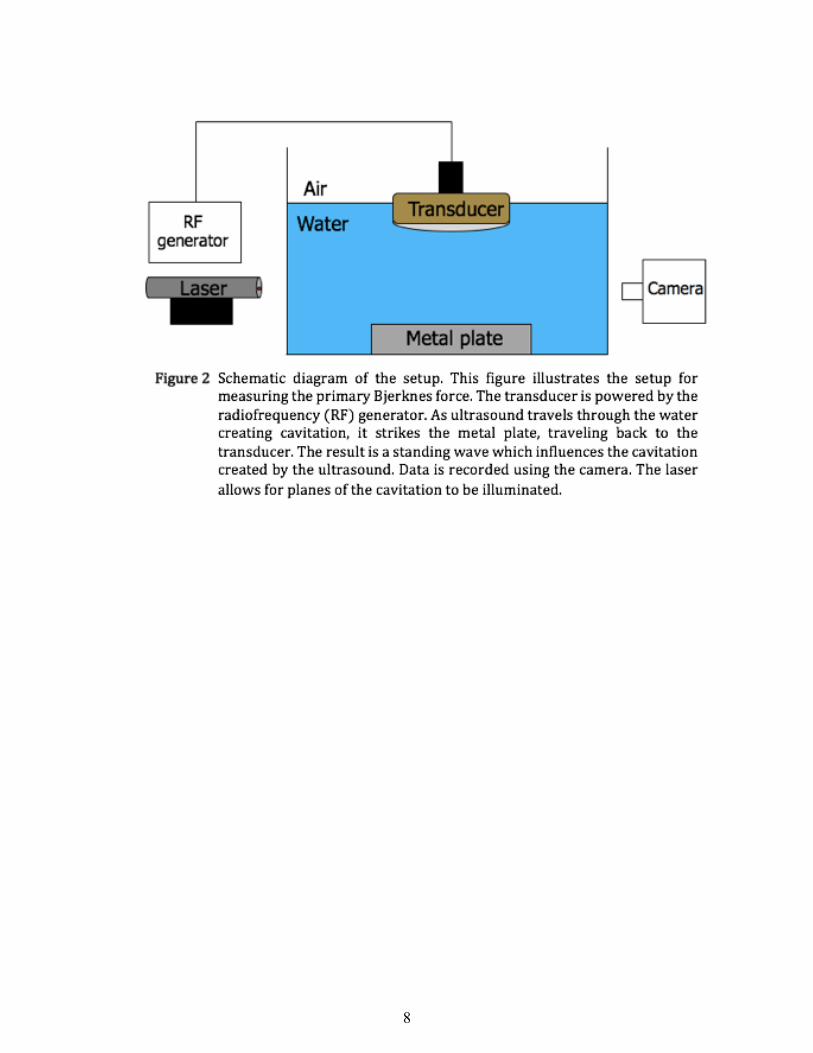
ThesetupformeasuringtheprimaryBjerknesforceincludesbothopticaland
acoustic instruments. The purpose of the measurement system is to provide
estimatesoftheprimaryBjerknesforce.Theapproachisknownasthescatteredlight
methodandwas themethodused in thiswork todetermine the force.This setup
allowsforthedirectmeasurementofthevolumesofbubbles.Fromthevolumesof
bubbles, buoyant forces can be calculated. It is from the buoyant forces that the
primaryBjerknesforceonbubblescanbecalculated.Inthismethod,lightisscattered
offofthebubblesinaforwardscatteringmanner.Whenlightisforwardscattered,
thebubbles areonly visible fromaparticulardirection (i.e., from thedirection in
whichthelightistraveling).Thisisanalogoustoseeingdustinaroominasunbeam.
Thesunlightthatisincidentofthedustscattersforwardinawaythatmakesthedust
visible,whileinthebackwarddirectionthedustisnotvisible.Figure2isaschematic
diagramofthesetupforthescatteredlightmethod.Figure3isapictureofthesetup.
Anultrasonictransducerisimmersedinwaterandisconnectedtoaradiofrequency
(RF)generator.TheRFgeneratorprovidesasinusoidalvoltagetothepiezoelectric
crystal in the transducer and allows for adjustments of the frequency and power
appliedtothetransducer.Figure4isapictureofthetransducerandthemetalplate.
Theredblockisusedtoraisethereflectorsoitis
7
8

9

10

closertothetransducer.Asultrasoundpropagatesthroughthewater,itstrikesthe
reflector and travels back towards the transducer. Ultrasound in a liquid is a
longitudinalwave,andtheinterferenceofthecounter-propagatingwavescreatesa
standingwave.Thewavesgeneratecavitationbubbleswhicharetrappedinthenodes
ofthestandingwave.Conversely,theantinodesofthestandingwaveareplacesfrom
whichbubblesmove.Figure5isapicturethatdemonstratesbubblesthataretrapped
in nodes. These nodes are places where pressure is zero, and conversely, the
antinodesareplaceswhere thepressure oscillateswithmaximumamplitude.The
spacingbetweenthebubblesisequaltoone-halfofthewavelengthoftheultrasound.
The speed of sound in water 𝑐 can be calculated by using a fifth-order
polynomialthatwasfittedtoexperimentaldatapoints(Marczak,1997).Thisfifth-
orderpolynomialis
𝑐 = 𝑎`𝑇`b
`cd
where𝑎earecoefficientsandwhere𝑇istemperaturein°C.Pluggingthecoefficients
intothissum,
𝑐 = 1.402385×10j + 5.038813×10lj 𝑇 + −5.799136×10lb 𝑇o
+ 3.287156×10lp 𝑇j + −1.398845×10lq 𝑇r
+ 2.787860×10lso 𝑇b
Thetemperatureofthewaterwas21°CinFigure5.Thismeansthat𝑐 ≈ 1485m/s.
Thefrequency𝑓oftheultrasonictransducerwas1.2MHz.Therefore,thewavelength
𝜆oftheultrasoundwas
𝜆 =𝑐𝑓
11

12

𝜆 =1485m ∙ sls
1.2×10lysls
𝜆 = 1.24mm
Thewavelengthwasmeasuredtobe1.27mm,apercentdifferenceofonly2%relative
tothetheoreticalvalue.
4.2METHODS
Aswasmentionedintheprevioussection,thecavitationiscapturedonavideo
camcorder that isplaced in frontof the tankandadjustedso that thebubblesare
clearlyvisualized.Figure6isanimagetakenofthecavitation.Atfirstglanceitmay
not appear that there is much regularity in the cavitation field, but there exist
repeatingstructures.ThiscanbeseeninFigures7and8.Anexamplesofastructure
thatrepeatsmultipletimesthroughoutthecavitationfieldisthesidelobe.
Oneofthegoalsofthisresearchwastoclassifybubblesbasedontheirsizes
andhowtheybehave.Thebubblesthatareexaminedfirstarethosethatweclassify
assmall.Inthismethod,itwasnotpossibletodeterminetheforcesonthesebubbles
becausetheyremaintrappedthroughouttheexperiment,sothesebubblesarenot
mentioned in Table 1. Nevertheless, these smaller bubbles are important and
therefore are described here. They have a radius of approximately 0.05mm. The
bubbles that aremost prominent among them are the ones along strands. These
bubbles are stationary relative to the larger bubble types. Their motion consists
mostly of small displacements from what can be considered their equilibrium
positions. As a result, they remain fixed in the ultrasound field. Medium, or
transitional, bubblesoccurwhere stationarybubbles coalesce.Theybegin tohave
largedisplacementsfromwhatcanbeconsideredtheirequilibriumpositions.Large,
13

Figure6Fieldofcavitation.Thisfigureshowsthe“cloud”ofcavitation.
14

15

16

orcritical,bubblesareofprimaryinterest.Criticalbubblesmaybethesamesizeor
largerthantransitionalbubbles.Beforecriticalbubblesbegintorise,theirrangesof
motion are quite large. A critical bubblewill begin to rise once its buoyant force
exceedstheprimaryBjerknesforce.
ToestimatethemagnitudeoftheprimaryBjerknesforce,thevolumeofthe
bubbleneedstobemeasured.DevelopedbytheNationalInstitutesofHealth(NIH)
in 1997, ImageJ (https://imagej.nih.gov/ij/download.html) is an open-source
programthatwasusedtomeasurethediameterofbubbles.ImageJcanhelpfacilitate
precisemeasurements.However,theprecisionofmeasurementsisonlyasgoodas
thescalesetbyauser.
There were two main issues encountered when identifying and tracking
criticalbubbles.Thefirstissuewasthenumberofbubblesinthecloudofcavitation.
Thereexistalargenumberofbubblesinacloud.Usingwaterthathasbeendistilled
anddegassedhelpsreducetheamountofcavitationbutnotbyasignificantamount.
Thesecondissuewasidentifyingthelocationofthebubblewithinthecloud.Datais
recordedwithavideocamcorder,and it isnotpossible tomeasure thedepthofa
criticalbubblefromatwo-dimensionalimage.Asolutiontothesetwoproblemsisto
illuminate a plane of the field of cavitation. This is analogous to computed
tomography(CT),aninvaluablediagnosticimagingtoolthatallowsdoctorstoview
“slices” of patients’ bodies. The concept of illuminating a plane in the cloud of
cavitationisillustratedinFigure9.Laserlightiscollimatedandispassedthrougha
thinaperture.ThisisshowninFigure10.Theresultisaplane-likebeamofcollimated
laser light that is incident on the field of cavitation. Figure 11 shows how the
17

Figure9 Schematicsetupoflaserlight.Thisfigureillustratestheconceptforilluminatingaplaneofcavitationwithlaserlight.
18

Figure10 Laserwithcollimatorandaperture.Attachedtothislaser isabeamexpanderandanaperture.Thebeamexpanderwidensthediametersof the the laser light and forms it into a column, and the aperturerestricts the laser light to a plane thatwill illuminate a sliceof thecavitationcloud.
19

cavitation field appearswhenever a plane of interest is illuminated. Thismethod
allows one to focus on a single plane rather than the entire cavitation field. The
advantageisthatwecanfocusattentiononagroupofbubblesratherthananentire
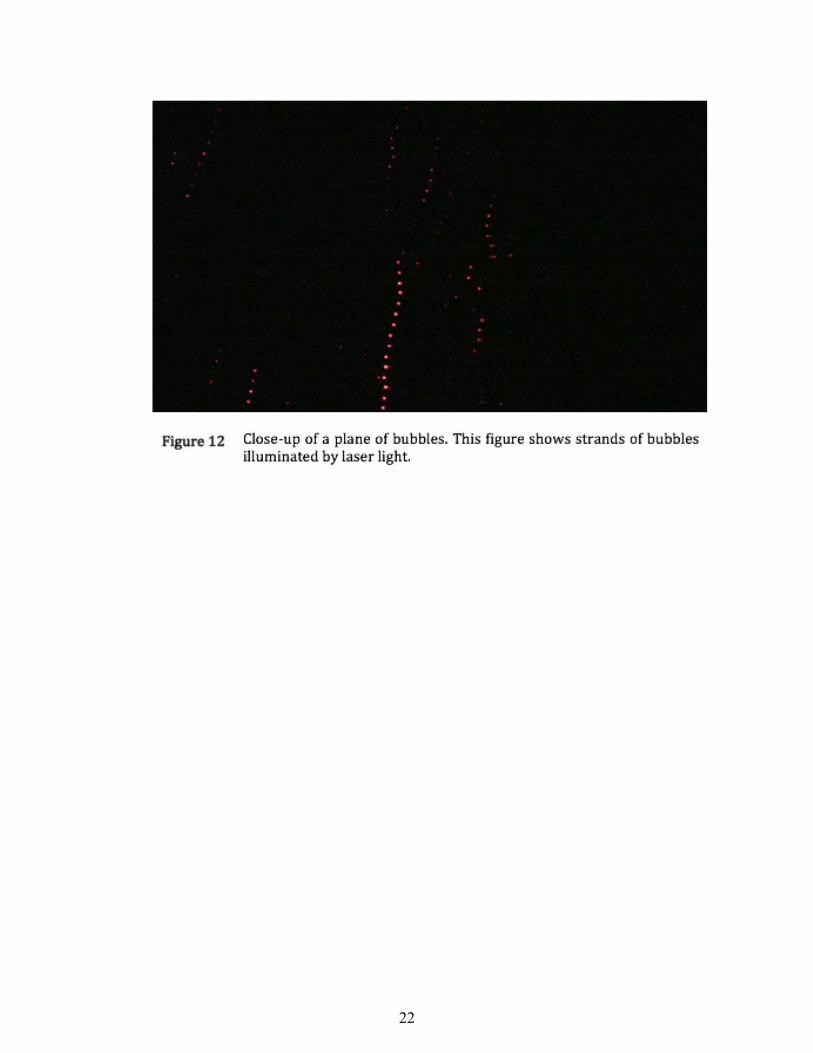
cavitation cloud, as visualized in Figure 12. This makes it easier to identify the
positionsofcriticalbubbles.
4.3DATAANDRESULTS
Data were collected in three sets. Each set of data consists of four
measurements.Thedata includes thepowerand the frequencysettingson theRF
generatorandtheapproximatelocationofthecriticalbubbles.Table2listssomeof
thedata.Theseapproximatelocationsareidentifiedfromthefrontofthesetup(i.e.,
from where the video camcorder was placed). The reason that the power and
frequencywere variedwas so that the reflectedpower from the generator to the
transducerwasataminimum.Inotherwords,thepowerandfrequencywerevaried
sothatthemaximumamountofpowerprovidedwasusedbythetransducer.Figures
13through15listtheaveragecriticaldiameters,theaveragecriticalvolumes,andthe
averagecriticalforces,respectively,foreachdataset.Thediameterofeachbubbleis
measuredineachset.Thecriticaldiametersarethenaveraged.Inasimilarway,the
criticalvolumesandthecriticalforcesarecalculatedforeachbubbleineachset.Table
3summarizestheinformationpresentedinthesefigures.
20

Figure11 Illuminating a plane of cavitation. The top picture is a referencepicturefor thebottompicture.Thebottompictureshowsaplaneofbubblesthatisilluminatedwithlaserlight.
21
22

23

24

25

Table1:ClassificationofBubbles MotionSmall/stationary Slightlymovearoundandarearranged
instrandsMedium/transitional Movearoundmorethanstationary
bubblesbutdonotriseLarge/critical Movearoundjustasmuchas
transitionalbubblesandareabletoriseTable1Thistablesummarizestheclassificationofbubbles.
Table2:SomeDataforSets Power(W) Frequency(MHz) Approximate
Location
Set1 10 1.12
Middleoffieldbetweenthe
transducerandthereflector
Set2 15 1.10
Middleofthefieldbetweenthe
transducerandthereflector
Set3 20 1.00Middleofthefieldtotherightofthe
transducerTable2Thistablelistssomedataforthesetsofbubbles.
Table3:SummaryofMeasurements AverageCritical
Diameter(mm)AverageCriticalVolume(pmR)
AverageCriticalForces(µN)
Set1 0.30(5) 15(6) 0.15(6)Set2 0.38(3) 28(5) 0.28(5)Set3 0.43(1) 41(2) 0.41(2)
Thistableliststheaveragecriticaldiameters,averagecriticalvolumes,and average critical forces for the sets. The numbers in parenthesesindicatetheuncertaintyinthelastdigit.
Table3
26

5RECENTRESEARCHOFTHEPRIMARYBJERKNESFORCE
5.1IMPROVEMENTOFMETHODS
TheinitialmeasurementsoftheprimaryBjerknesforcerangedfrom0.15µN
to0.41µN.Asmentionedbefore,thesemeasurementsshouldreallybereferredtoas
estimates.AforcethatiscomparabletotheprimaryBjerknesforceistheweight(on
Earth)ofasinglegrainofsand.
One problem with the scattered light method was the uncertainty of the
diameterofthebubbles.Inadditiontonotknowingtheexactdiametersofbubbles,
the exact location of the bubbles remained unknown. Again, the locations of the
bubbles were approximate and were based on their positions relative to the
transducer.Fortunately,thesetwoproblemscanberesolved.
Thefirstoftheseproblemsarisesfromthescatteredlight.Whenlightscatters
fromabubble,itmayrefractseveraltimesinsideabubblebeforeitexits.Thismakes
thebubbleappearbright.Theresultisabubblethatisnotwelldefined.Insteadof
scatteringlightfromthebubbles,itwasdecidedthatitwouldbebettertohavelight
bediffusedandtobebehindthebubbles.Thisallowstheedgesofthebubblestobe
welldefined,asshowninFigure16.
Asolutiontothesecondproblemmentionedistosimplyuseasecondcamera
thatis90°fromthefirst.Thisallowsforthedeterminationofthepositionsofcritical
bubblesinthreedimensions.
27

Figure16 Bubbles in diffuse light. This figure shows how well defined thebubblesarewheneverlightisdiffusedbehindthebubbles.
28

5.2RECENTDATAANDRESULTS
Results from the improved setup agreewith results from the initial setup.
Figure17showsacriticalbubble(indicatedbythearrow)thathasadiameterof1.04
mm.Itsposition,asmeasuredfromtheorigin𝑂oftheaxis,isalsogivenandisinunits
ofmm.TheprimaryBjerknesforceonthiscriticalbubblewascalculatedtobe5.8µN.
Figure18showsaside-by-sidecomparisonofacriticalbubblethatisviewedfrom
differentangles.TheimprovementofmethodsformeasuringtheprimaryBjerknes
forceispartofanon-goingworktobereportedinthefuture.
29

𝑂
Figure17 Recentmeasurement.ThisisFigure13butincludesameasurementthat offers a more precise determination of the diameter andpositionofthebubblethanisofferedbythescatteredlightmethod.
30

Figure18 Side-by-sidecomparison.Thebubblesthatareencircledinredarethesamebubbles.Thepictureon the left is taken from the frontof thetank,andthepictureontherightistakenfromthesideoftank.
31

6CONCLUSIONS
Measuring the primary Bjerknes forces on bubbles is possible by first
measuringthediametersofbubbles.Oncethediametersofbubblesareknown,the
volumesofthebubblescanbecalculated,thusleadingtothebuoyantforces.These
buoyantforcesareequalinmagnitudetotheprimaryBjerknesforcesimmediately
beforethebubblesbegintorise.TheprimaryBjerknesforcesrangedfrom0.15µNto
0.48µN.TheinitialmeasurementsoftheprimaryBjerknesforcewerebasedonthe
scatteredlightmethod.Thismethodwillberefinedinfutureworkbyusingdiffuse
lightinsteadofscatteredlight.Inadditiontothediffuselight,asecondcamerawillbe
usedsothatthelocationofthebubblesinthreedimensionscanbemeasured.
32
7FUTUREWORK
Measurements of theprimaryBjerknes forcehavebeen establishedbut do
needtoberefined.Onegoaloffutureworkistoimprovethequalityoftheimagesso
that the diameters of the bubbles can be better determined. In addition to better
measurementsof thediametersofbubbles,more setsofdata shouldberecorded.
Eachsetofdatashouldvaryinpowerandfrequencysothattrendscanbeidentified.
Also, measurements of the primary Bjerknes force should be compared to
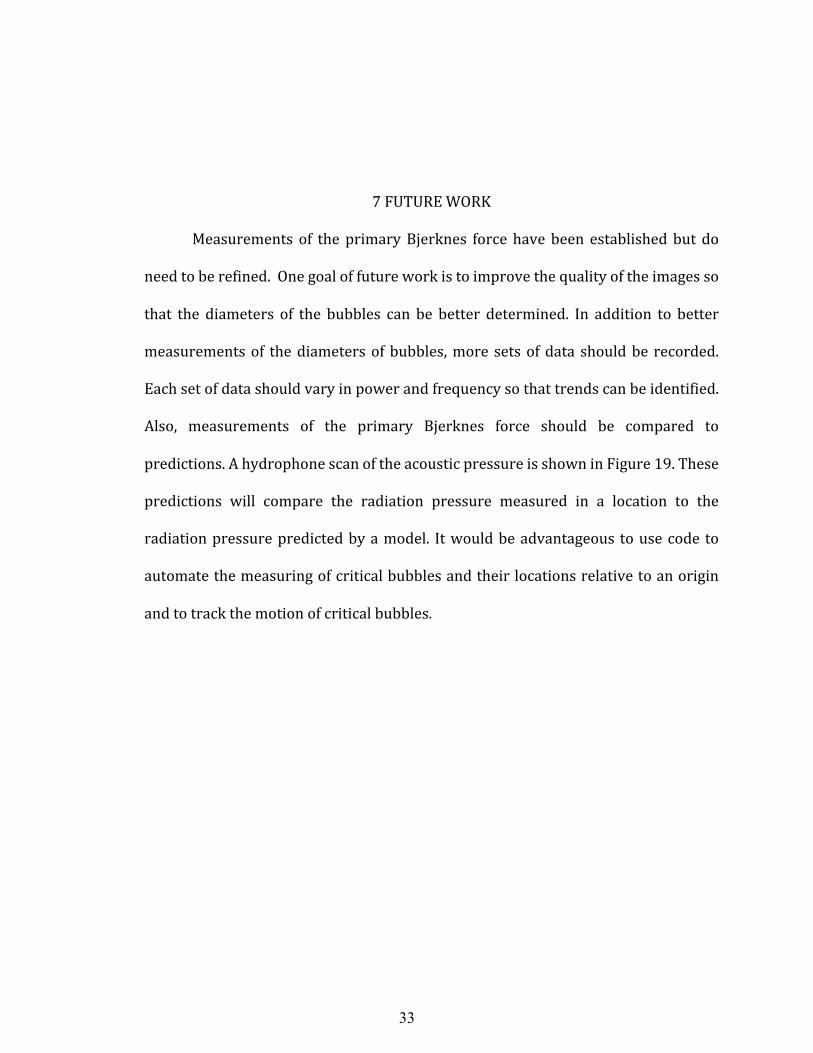
predictions.AhydrophonescanoftheacousticpressureisshowninFigure19.These
predictions will compare the radiation pressure measured in a location to the
radiationpressurepredictedbyamodel. Itwouldbeadvantageous tousecode to
automatethemeasuringofcriticalbubblesandtheirlocationsrelativetoanorigin
andtotrackthemotionofcriticalbubbles.
33

Figure19 Hydrophonescanoftransducer.Thesegraphsshowthemagnitudeoftheacousticpressureasafunctionofdistance.Thepictureontheleftshowstheacousticpressureasviewedlookingdirectlyupatthefaceofthetransduceratadistanceofapproximately7cm.Thepictureoftherightisaside-viewofthemagnitudeoftheacousticpressure.
34

REFERENCES
Bates,M.(2011).Discoveringsonarinbats,AmericanAssociationfortheAdvancementofScience,Available:https://www.aaas.org/discovering-sonar-bats,(datelastviewed:01-May-19).RetrievedMay1,2019,fromhttps://www.aaas.org/discovering-sonar-batsABriefHistoryofNon-DestructiveTesting,(2014).ABriefHistoryofNon-DestructiveTesting-Non-DestructiveTesting(NDT)Blog,Available:http://tspndt.com/non-destructive-testing-industrial-supplies-blog/a-brief-history-of-non-destructive-testing,(datelastviewed:01-May-19).RetrievedMay1,2019,fromhttp://tspndt.com/non-destructive-testing-industrial-supplies-blog/a-brief-history-of-non-destructive-testingBerg,R.E.(2018).Acoustics,EncyclopædiaBritannica,Available:https://www.britannica.com/science/acoustics/Modern-advances,(datelastviewed:01-May-19).RetrievedMay1,2019,fromhttps://www.britannica.com/science/acoustics/Modern-advancesBlake,F.G.,Jr.(1949).“BjerknesForcesinStationarySoundFields,”TheJournaloftheAcousticalSocietyofAmerica,21,551–551.HistoryofUltrasound|Timelinesince1794,(2014).UltrasoundTechnicianSchools,Available:http://ultrasoundschoolsguide.com/history-of-ultrasound/,(datelastviewed:01-May-19).RetrievedMay1,2019,fromhttp://ultrasoundschoolsguide.com/history-of-ultrasound/Karamanides,D.(2006).Pythagoras:pioneeringmathematicianandmusicaltheoristofAncientGreece,RosenCentral,NewYorkLeighton,T.G.,Walton,A.J.,andPickworth,M.J.W.(1990).“PrimaryBjerknesforces,”EuropeanJournalofPhysics,11,47–50.Marczak,W.(1997).“Waterasastandardinthemeasurementsofspeedofsoundinliquids,”TheJournaloftheAcousticalSocietyofAmerica,102,2776–2779.Memoli,G.;Baxter,K.O.;Jones,H.G.;Mingard,K.P.;Zeqiri,B.AcoustofluidicMeasurementsonPolymer-CoatedMicrobubbles:PrimaryandSecondaryBjerknesForces.Micromachines2018,9,404.Piezoelectricity,EncyclopædiaBritannica(2018),Available:https://www.britannica.com/science/piezoelectricity,(datelastviewed:01-May-19).RetrievedMay1,2019,fromhttps://www.britannica.com/science/piezoelectricity
35

TheHistoryofUltrasound,BMUS,Available:https://www.bmus.org/about-ultrasound/history-of-ultrasound/,(datelastviewed:01-May-19).RetrievedMay1,2019,fromhttps://www.bmus.org/about-ultrasound/history-of-ultrasound/
36