Iglo Foods Holdings Limited/media/Investor Relations Documents/Annual report... · Net Sales of the...
77
Iglo Foods Holdings Limited Annual Report & Financial Statements 2014
Transcript of Iglo Foods Holdings Limited/media/Investor Relations Documents/Annual report... · Net Sales of the...

Iglo Foods Holdings Lim
ited Annual Report &
Financial Statements 2014

Iglo Foods Holdings Lim
ited Annual Report &
Financial Statements 2014
A fresh look at frozen
Iglo Foods Holdings LimitedAnnual Report & Financial Statements 2014

We create great tasting food to be enjoyed every day, at
every meal, by everybody. Our food is always delicious,
good for you and easy to prepare. Because our food is less
wasteful it helps people feel better about what they eat.
At Iglo our dream is to make mealtimes the best moments
of the day and everything we do is designed to inspire
more people to enjoy better meals together.
is to make B E T T E R M E A L S
T O G E T H E R
THE MISSION OF IGLO GROUP
Contents
GOVERNANCE
30 Board of Directors32 Strategic Report33 Directors’ Report34 Statement of Directors’
Responsibilities
BUSINESS OVERVIEW
01 Financial and operational highlights02 Our business at a glance04 Chairman’s Statement06 Chief Executive Officer’s Review08 Business Review16 Brand Reviews19 Corporate Social Responsibility22 Chief Financial Officer’s Review
FINANCIAL STATEMENTS
34 Independent Auditors’ Report to the Members of Iglo Foods Holdings Limited
36 Consolidated Income Statement36 Consolidated Statement of
Comprehensive Income37 Consolidated Statement
of Changes in Equity38 Consolidated Statement
of Financial Position39 Consolidated Statement
of Cash Flows40 Notes to the Financial Statements72 Glossary72 Other Information

2014 Highlights
Gross margin of the Iglo Group business increased by 1.8ppts to 35.3% (at constant currency exchange rates)
GROSS MARGIN 2014
2013
2012
2011
2010
33.5%35.3%
34.7%
33.2%34.4%1.8ppts
Net Sales of the Iglo Group business decreased by 1.9% to €1,469.5 million (at constant currency exchange rates)
NET SALES €m 2014
2013
2012
2011
2010
1,469.5 1,498.5
1,569.0 1,548.1
1,541.8 -1.9%
EBITDA before exceptional items decreased by 0.1% to €297.8 million (at constant currency exchange rates)
EBITDA €m 2014
2013
2012
2011
2010
298.0 297.8
342.1
304.1 325.3 -0.1%
Net Debt (excluding investor funded loan notes) decreased during the year as a result of the refinancing
NET DEBT €m 2014
2013
2012
2011
2010
1,514 1,414
1,629
1,559 1,410 -100m
Operating cash flow conversion of 90% was generated at reported exchange rates
OPERATING CASH FLOW CONVERSION
2014
2013
2012
2011
2010
97%90%
87%
127%106%
The reported average €/£ exchange rate for 2014 was 1.24. The constant currency results have been determined by translating the local currency denominated results for the year ended 31 December 2014 and for earlier comparative years to the 2014 budgeted €/£ exchange rate of 1.16.
Net Debt is defined as total bank and bond debt less cash and cash equivalents.
Decrease 2013-2014 Decrease 2013-2014
Increase 2013-2014
Decrease 2013-2014
Business highlights
• Launched three new innovation platforms - Inspirations, Steamfresh and Stir Your Senses
• Inspirations ranked as the UK’s best-selling new innovative FMCG launch in 2014 by Kantar
• Grew Net Sales in 8 out of 12 markets with a 5th successive quarter of growth in Italy
• Launched our Food of Life campaign with a new brand positioning, new packaging design, new advertising and omnichannels, plus digital focus, supported by A&P spend + 11% year-on-year
• Best-in-class models developed for digital engagement, Perfect Store shopper experience and portfolio mix management
• Launched our Forever Food Together CSR programme with particular focus on the role frozen can play in reducing food waste
Financial highlights
• Reported Net Sales broadly flat year-on-year; -1.9% in constant currency versus category trend of -0.5%, reflecting difficult market conditions in the UK and Germany
• Gross margin increase of 1.8% year-on-year to 35.3%
• Constant currency EBITDA broadly flat; 20.3% margin in line with our strategic target
• 4th successive year of negative working capital; operating cash conversion of 90%
• Net Debt reduced by €100m year-on-year; leverage reduced to 4.6x (2013: 5.0x)
Busi
ness
ove
rvie
wG
over
nanc
eFi
nanc
ial s
tate
men
ts
I G LO F O O DS H O L D I N G S L I M IT E D — 1
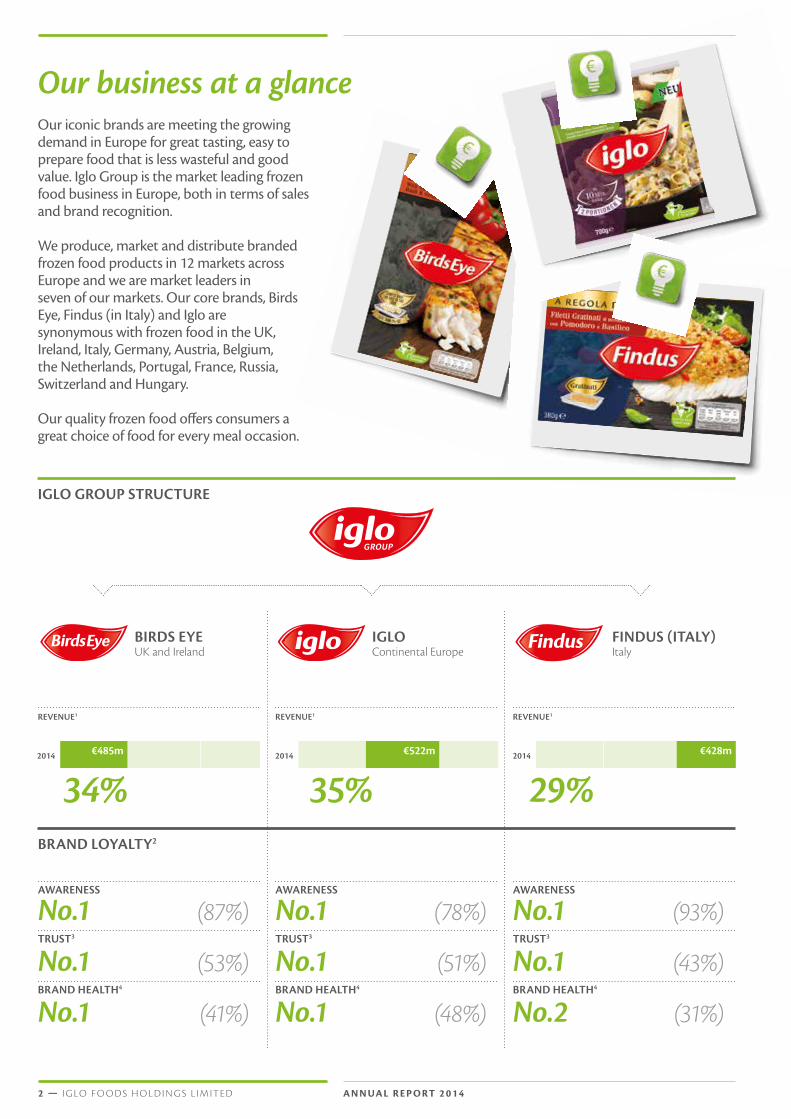
BRAND LOYALTY2
AWARENESS
No.1 (87%) AWARENESS
No.1 (78%) AWARENESS
No.1 (93%) TRUST3
No.1 (53%) TRUST3
No.1 (51%) TRUST3
No.1 (43%) BRAND HEALTH4
No.1 (41%) BRAND HEALTH4
No.1 (48%) BRAND HEALTH4
No.2 (31%)
IGLO GROUP STRUCTURE
Our business at a glanceOur iconic brands are meeting the growing demand in Europe for great tasting, easy to prepare food that is less wasteful and good value. Iglo Group is the market leading frozen food business in Europe, both in terms of sales and brand recognition.
We produce, market and distribute branded frozen food products in 12 markets across Europe and we are market leaders in seven of our markets. Our core brands, Birds Eye, Findus (in Italy) and Iglo are synonymous with frozen food in the UK, Ireland, Italy, Germany, Austria, Belgium, the Netherlands, Portugal, France, Russia, Switzerland and Hungary.
Our quality frozen food offers consumers a great choice of food for every meal occasion.
BIRDS EYEUK and Ireland
IGLO Continental Europe
FINDUS (ITALY)Italy
REVENUE1 REVENUE1 REVENUE1
2014 2014 2014€485m €522m €428m
34% 35% 29%
2 — I G LO F O O DS H O L D I N G S L I M IT E D A N N UA L R E P O RT 2 0 1 4

CLEAR NO. 1 IN EUROPEAN FROZEN FOOD5
Direct market access
Access via distribution
Not present
1
1
1
1
1
1
1
2
Iglo Group 9.2%
Oetker-Gruppe 4.2%
Findus Group 4.0%
Nestlé SA (incl. Wagner) 3.8%
McCain Foods Ltd 2.9%
STRONG LEADERSHIPMARKET SHARE %
2.2X
Source: Company information, Euromonitor, AC Nielsen, IRI, Ipsos.(1) Revenues are in constant currency for the year ended 31 December 2014. Relates to frozen food market. Iglo values shown are
results in Germany.(2) Relates to frozen food market.(3) December 2014 YTD average. Trust % based on questionnaire: thinking about the food brands shown here, please consider
each of the statements based on 5 of participants below and for each one please indicate which brands you think it applies to. You can indicate as many brands as you like for each statement. Which of these... is a brand I trust?
(4) Brand Health at December 2014. Source: Ipsos.(5) Relative position to No.2 branded competitor as per Nielsen and IRI data.
Net Sales growth in 8 out of 12
markets
8 out of 12
Fina
ncia
l sta
tem
ents
Gov
erna
nce
Busi
ness
ove
rvie
w
I G LO F O O DS H O L D I N G S L I M IT E D — 3

2014 was another tough year for the branded frozen food category in Europe. Difficult economic conditions, constrained shopping budgets and an evolving retail environment created challenges for our sector as a whole. They contributed to a disappointing decline in overall sales for Iglo.
However, our success in repositioning the company for growth, and the momentum we have started to build in a number of markets, strongly suggests that our strategy is starting to deliver some positive results.
This has been a year of change for our business, in which our people have responded very positively to the journey we are taking, and the immediate challenges that we face. In the pages of this report, you will read about the progress we’ve made in changing how our consumers relate to our brands, changing how we innovate and bring new products to market, and changing how we work together. We’ve evolved our culture to be more externally focused, ready to compete more effectively: not just in frozen, but whenever somebody decides which meal to prepare, and which food to put on the plate.
The 1.9% decline in sales on a constant currency basis suffered by Iglo as a whole reflects the challenging trading environment for branded frozen food across Europe. It also reflects the one-off benefit in the red meat category in the prior year, where many own-label competitor products were withdrawn from shelves in 2013 following the horsemeat scandal, but returned in 2014. Market conditions are expected to remain challenging in the near future, but the innovations that we are bringing to market will position us well to overcome these challenges. We improved our gross margin by 180 basis points during the year and maintained our EBITDA performance. The improved margin performance has been reinvested in the business through increased media spend behind the roll out of the new Food of Life campaign and the innovation launches.
Erhard Schoewel Chairman
We’ve evolved our culture to be more externally focused, ready to compete more effectively: not just in frozen, but whenever somebody decides which meal to prepare, and which food to put on the plate
A transformative yearCHAIRMAN’S STATEMENT
Frozen food over-trades by up to 200% online200%
4 — I G LO F O O DS H O L D I N G S L I M IT E D A N N UA L R E P O RT 2 0 1 4

We succeeded in growing Net Sales in 8 of the 12 markets where we operate. Our new innovation platforms emerged as our primary drivers of sales growth, and our more collaborative, cross-functional approach to operations has helped us to find new efficiencies and grow our margins.
In Italy, where we were able to launch our new branding and Better Meals Together strategy in the final quarter of 2013, we have now delivered five consecutive quarters of Net Sales growth. In markets such as Portugal, we’ve proved that innovation can grow sales even in tough economic conditions. In the Netherlands and Belgium, we’ve shown how a new approach to management can transform performance from negative to positive. Meanwhile, in the UK, we have continued to grow our share of online sales. As online shopping spreads across Europe over the next few years, the expertise that we have established bodes well for Iglo.
We have strengthened our management team to continue to drive our new vision forward – and the fact that 6 out of 15 senior management roles have been filled from within Iglo shows the strength of our talent pipeline. We’ve renewed our marketing function during the year, and embedded a new strategic framework for identifying opportunities and guiding innovation that gives us a clarity of purpose across all that we do.
We are committed to managing our portfolio effectively and we have done so by discontinuing lines that delivered sales but little profit. Measures such as this have had an additional negative impact on our sales during the year – but they position our business far more strongly for sustainable, profitable growth in the future.
We have continued to reduce Iglo’s net external debt whilst investing in the innovation that will drive growth over the coming years. Iglo remains extremely focused on cash generation and ended the year with negative working capital for the fourth successive year.
In July, we completed a refinancing of the Group’s Senior debt, replacing the existing facilities with two new tranches of Senior debt of €620 million and £400 million respectively. In addition, the Group issued a €500 million floating rate bond on the Luxembourg Stock Exchange. The maturity on all of the Group’s debt now extends to 2020 and the new debt arrangements are expected to deliver annual interest savings of around €14 million.
Market conditions will continue to be tough in 2015. However, the innovation platforms and new systems and processes that we have introduced are equipping Iglo well to deal with these challenges. We are building a nimbler, leaner and more competitive business. And the momentum that we have established behind our innovative new brand and products will continue to help mitigate the effects of the overall economic environment.
We succeeded in growing Net Sales in 8 of the 12 markets where we operate
Stir Your Senses allows home cooks to simply stir the ingredients to gradually unlock aromas, colours and tastes from around the world.
Our team in the Netherlands has set a new world record by creating the biggest fishfinger.
Busi
ness
ove
rvie
wG
over
nanc
eFi
nanc
ial s
tate
men
ts
I G LO F O O DS H O L D I N G S L I M IT E D — 5

Elio Leoni Sceti Chief Executive Officer
Our mission is to make Better Meals Together, and between them, those three words capture every aspect of the journey our business is making
A fresh look at frozenCHIEF EXECUTIVE OFFICER’S REVIEW
Frozen food is 47% less likely to be wasted than fresh or chilled47%
Last year, one in ten of the meals prepared in European homes included some frozen food. But that’s only part of the story. For every one of these meals that included frozen food, there were another three when the person choosing the food thought about making frozen a part of the meal – but decided against it. The maths is simple – and it adds up to a huge opportunity for Iglo.
If we can persuade people to take a fresh look at frozen, to use it on those extra three occasions when it doesn’t yet make it onto the plate, then we can significantly grow the size of our business.
In the last financial year, we have taken our first steps towards persuading both consumers and our retail partners to take that fresh look at frozen. This has not grown the size of our business overnight. But it has given us unmistakable momentum in the markets where we’ve rolled out our new strategy. Our mission is to make Better Meals Together, and between them, those three words capture every aspect of the journey our business is making.
To make our food ‘Better’, we need to innovate – and innovate responsibly. We’ve done this by developing innovation platforms: new eating experiences that address the emotional needs around food that people in all of our markets share. We are inviting those people to prepare and enjoy our food in different ways – and we’ve promised them that the new recipes we develop will offer a healthier choice. Our results for this year show that innovation is now the fundamental driver of growth for our business.
To grow frozen’s share of the plate, we’re encouraging both consumers and retailers to think differently about the role it plays within ‘Meals’. We’re doing this through our new, European-wide advertising campaign, Food of Life, which elevates the role of our brand in people’s daily lives and evolves it from a functional choice to an emotional one. We’re doing it too through innovative digital marketing that presents our food in new contexts, and links it to other purchases to help show the range of occasions when frozen can make meals better. Our results show that this approach is working. We’ve grown our Net Sales in 8 out of 12 markets during the year.
To succeed, we need to take this journey ‘Together’, building a high-performance organisation that can deliver excellence in all areas, and compete effectively against all of the food choices that consumers have. During 2014 we strengthened our senior management team, with 6 out of 15 roles filled from within Iglo, and brought in important new skills in areas such as digital marketing. We’ve reinvigorated our values to help bring our organisation together and make it more competitive.
6 — I G LO F O O DS H O L D I N G S L I M IT E D A N N UA L R E P O RT 2 0 1 4
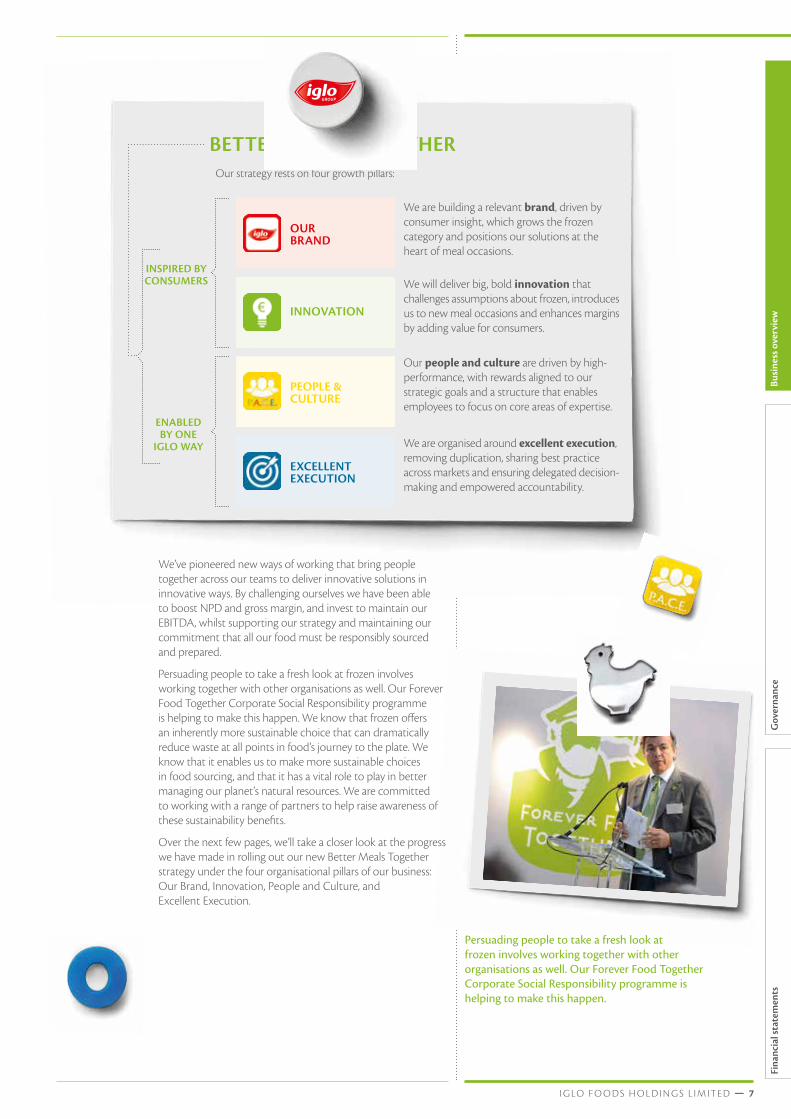
BETTER MEALS TOGETHER
INNOVATION
EXCELLENT EXECUTION
OUR BRAND
PEOPLE & CULTURE
INSPIRED BY CONSUMERS
ENABLED BY ONE
IGLO WAY
Our strategy rests on four growth pillars:
We are building a relevant brand, driven by consumer insight, which grows the frozen category and positions our solutions at the heart of meal occasions.
We will deliver big, bold innovation that challenges assumptions about frozen, introduces us to new meal occasions and enhances margins by adding value for consumers.
Our people and culture are driven by high-performance, with rewards aligned to our strategic goals and a structure that enables employees to focus on core areas of expertise.
We are organised around excellent execution, removing duplication, sharing best practice across markets and ensuring delegated decision-making and empowered accountability.
Persuading people to take a fresh look at frozen involves working together with other organisations as well. Our Forever Food Together Corporate Social Responsibility programme is helping to make this happen.
We’ve pioneered new ways of working that bring people together across our teams to deliver innovative solutions in innovative ways. By challenging ourselves we have been able to boost NPD and gross margin, and invest to maintain our EBITDA, whilst supporting our strategy and maintaining our commitment that all our food must be responsibly sourced and prepared.
Persuading people to take a fresh look at frozen involves working together with other organisations as well. Our Forever Food Together Corporate Social Responsibility programme is helping to make this happen. We know that frozen offers an inherently more sustainable choice that can dramatically reduce waste at all points in food’s journey to the plate. We know that it enables us to make more sustainable choices in food sourcing, and that it has a vital role to play in better managing our planet’s natural resources. We are committed to working with a range of partners to help raise awareness of these sustainability benefits.
Over the next few pages, we’ll take a closer look at the progress we have made in rolling out our new Better Meals Together strategy under the four organisational pillars of our business: Our Brand, Innovation, People and Culture, and Excellent Execution.
Busi
ness
ove
rvie
wG
over
nanc
eFi
nanc
ial s
tate
men
ts
I G LO F O O DS H O L D I N G S L I M IT E D — 7

K E Y achievements
Our BrandBUSINESS REVIEW
This has been a transformative year for Iglo’s brand building and consumer connections. We have brought in proven leaders, rooted our brand strategy in the emotional relationship that people have with food, and launched a pan-European advertising campaign that brings this strategy to life effectively and efficiently across markets and media channels.
In April we welcomed Luca Miggiano as Iglo’s new Chief Marketing Officer. Luca has pioneered a powerful new approach to identifying the most relevant opportunities for Iglo. Under our new ‘Consumer Game Board’ framework, we analyse the occasion-based needs that people have around food, and identify those that Iglo can play a credible role in satisfying. This strategic approach confirms key elements of our position in the market: a provider of family and adult favourites, but not of snacks; a provider of authentic and natural food, rather than treats. And it has helped to unite all pillars of our business around a cohesive and consistent approach. Already, at the end of our first year of making Better Meals Together, consumers are beginning to have a clearer idea of what Iglo stands for.
Our advertising has played a big part in getting the message across. We rolled out our Food of Life advertising campaign across our markets, with more than 30 localised TV executions on air by the end of the year. In most markets, we complemented our TV campaign with other media including topical online video advertising that related our food to key moments such as the FIFA World Cup.
The values at the heart of our Better Meals Together strategy are reflected in everything we do when we communicate with our consumers. During 2014 we launched a new look and feel to our brand, including a new packaging design, created to boost on-shelf impact, product and brand recognition and consumer navigation of the category. We rolled this out in our four biggest markets in the second half of 2014 where it has been positively received and will continue to roll it out across our remaining markets in the first half of 2015.
When it comes to food, tasting is believing. Our Picture House pop-up restaurants brought the new experiences offered by innovative meal platforms like Inspirations and Steamfresh to life, and generated significant social media awareness in markets like the UK, by inviting consumers to upload pictures of their food. At the same time, we have launched an extensive sampling campaign targeted around retailers, to persuade shoppers to try our new Stir Your Senses meal experiences in a location where they can easily follow up by buying them.
• Renewal of our marketing expertise with key senior appointments
• A new strategic framework for planning and executing campaigns
• Launch of Food of Life advertising platform across all media channels in Europe
• Launched a new brand positioning across our markets, including a new packaging design
• Enhanced digital capability, including new appointments, resulting in initiatives such as Picture House pop-up restaurants to grow social media awareness
• Central role for Forever Food Together
• Net Sales growth in 8 out of 12 Iglo markets
8 — I G LO F O O DS H O L D I N G S L I M IT E D A N N UA L R E P O RT 2 0 1 4

Our TV advertising has played a big part in getting our message across. We rolled out our ‘Food of Life’ advertising campaign across our markets, with more than 30 localised executions on air by the end of the year.
We have launched an extensive sampling campaign, to persuade shoppers to try our new meal experiences.
Our Picture House pop-up restaurants brought the new experiences offered by innovative meal platforms and generated significant social media awareness to life.
We also began to move the sustainability benefits of frozen, and our Forever Food Together campaign, towards the centre of our brand story. Our Green Captain Forever Food Together icon now appears prominently on Iglo packaging – and provides consumers with a link to the Forever Food Together website, where they can find out more about the difference choosing our food can make.
The performance of our three brands, Findus Italy, Birds Eye and Iglo, correlates closely with the length of time for which our new brand strategy has been operating in their markets. In Italy, where we launched our new branding at the start of the year, we have seen consistent growth for Findus Italy, driven largely by new product lines. In the UK, while overall sales were held back by a declining market and a difficult customer environment, our new Birds Eye Inspirations platform (launched in the second quarter) has been ranked by Kantar as the best-selling new innovative FMCG product launched in 2014, reflecting the success of our focus on big initiatives. Our Iglo markets saw a full roll-out later in the year and while early sales of our Stir Your Senses product were encouraging, they were insufficient to return the business to growth.
Busi
ness
ove
rvie
wG
over
nanc
eFi
nanc
ial s
tate
men
ts
I G LO F O O DS H O L D I N G S L I M IT E D — 9
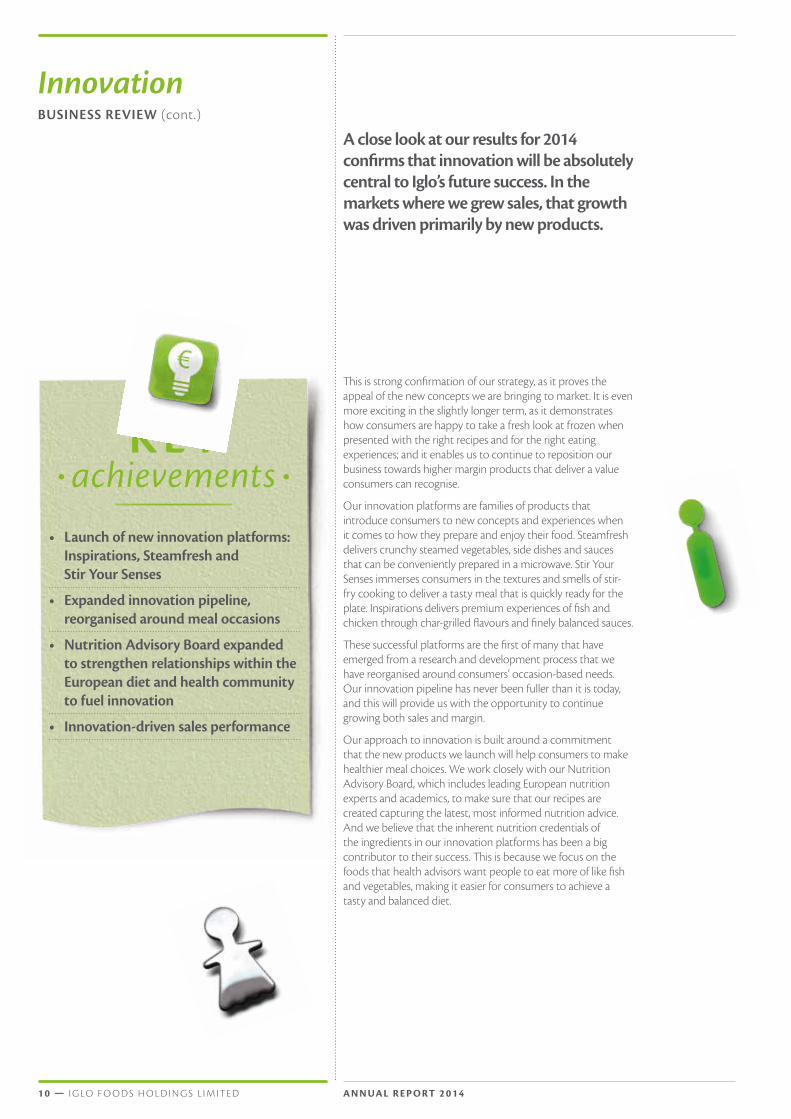
K E Y achievements
InnovationBUSINESS REVIEW (cont.)
A close look at our results for 2014 confirms that innovation will be absolutely central to Iglo’s future success. In the markets where we grew sales, that growth was driven primarily by new products.
This is strong confirmation of our strategy, as it proves the appeal of the new concepts we are bringing to market. It is even more exciting in the slightly longer term, as it demonstrates how consumers are happy to take a fresh look at frozen when presented with the right recipes and for the right eating experiences; and it enables us to continue to reposition our business towards higher margin products that deliver a value consumers can recognise.
Our innovation platforms are families of products that introduce consumers to new concepts and experiences when it comes to how they prepare and enjoy their food. Steamfresh delivers crunchy steamed vegetables, side dishes and sauces that can be conveniently prepared in a microwave. Stir Your Senses immerses consumers in the textures and smells of stir-fry cooking to deliver a tasty meal that is quickly ready for the plate. Inspirations delivers premium experiences of fish and chicken through char-grilled flavours and finely balanced sauces.
These successful platforms are the first of many that have emerged from a research and development process that we have reorganised around consumers’ occasion-based needs. Our innovation pipeline has never been fuller than it is today, and this will provide us with the opportunity to continue growing both sales and margin.
Our approach to innovation is built around a commitment that the new products we launch will help consumers to make healthier meal choices. We work closely with our Nutrition Advisory Board, which includes leading European nutrition experts and academics, to make sure that our recipes are created capturing the latest, most informed nutrition advice. And we believe that the inherent nutrition credentials of the ingredients in our innovation platforms has been a big contributor to their success. This is because we focus on the foods that health advisors want people to eat more of like fish and vegetables, making it easier for consumers to achieve a tasty and balanced diet.
• Launch of new innovation platforms: Inspirations, Steamfresh and Stir Your Senses
• Expanded innovation pipeline, reorganised around meal occasions
• Nutrition Advisory Board expanded to strengthen relationships within the European diet and health community to fuel innovation
• Innovation-driven sales performance
1 0 — I G LO F O O DS H O L D I N G S L I M IT E D A N N UA L R E P O RT 2 0 1 4

Stir Your Senses immerses consumers in the textures and smells of stir-fry cooking to deliver a tasty meal that is quickly ready for the plate.
Inspirations delivers premium experiences of fish and chicken through char-grilled flavours and finely balanced sauces.
Steamfresh delivers crunchy steamed vegetables, side dishes and sauces that can be conveniently prepared in a microwave.
Busi
ness
ove
rvie
wG
over
nanc
eFi
nanc
ial s
tate
men
ts
I G LO F O O DS H O L D I N G S L I M IT E D — 1 1

K E Y achievements
People and CultureBUSINESS REVIEW (cont.)
In 2014 we made great strides in aligning our internal culture, and the way we manage our people, around our new strategy for growth.
We sharpened our PACE values to place a greater emphasis on the behaviours that will enable us to compete to win in the broader food market. ‘Performance’ now embodies the concept of “fighting to win”, through harnessing the collective energy of the entire organisation to beat the competition. Our value of ‘Achievement’ now drives harder the concept of personal accountability. While ‘Collaboration’ continues to underscore the ability of the entire organisation and its component parts to work effectively, we are also actively encouraging constructive challenge. This involves the giving and receiving of views with a positive mind-set to help ensure we deliver the best outcome in everything we do. Finally, we are more focused than ever on driving ‘Energy’ and excitement around the huge growth opportunity available to Iglo.
We moved pro-actively to embed these updated values across our business, particularly in the way that we manage our people and reward their performance. We developed a new bonus scheme with improved line-of-sight metrics, which allow us to reward colleagues who have taken ownership for their areas of responsibility and delivered results.
We launched a new recognition scheme, the Iglo Growth Achievement Awards, which include awards for Brand Equity, Innovation, People and Culture and Excellent Execution, reflecting the four organisational pillars of our business. We have also launched further awards around our commitment to Forever Food Together. In 2014 we had more than 400 nominations for these awards.
At the same time, our ‘150 Ideas’ initiative, which we launched last year, has involved all employees in building an innovation pipeline for Iglo. Several ideas generated by the programme are now in development.
• Launched meal occasion based Category Organisation model and recruited new expertise, including digital marketing
• PACE (Performance, Achievement, Collaboration, Energy) internal values refreshed with a new outward focus
• Successfully implemented a new bonus scheme, aligned to group strategy
• Highest ever cultural index score of 60.4 in ‘What’s Cooking?’ survey
• 6 out of 15 new Executive Leadership Team appointments filled through internal applications
• Iglo & Me people portal launched to drive internal engagement and external employer branding
1 2 — I G LO F O O DS H O L D I N G S L I M IT E D A N N UA L R E P O RT 2 0 1 4
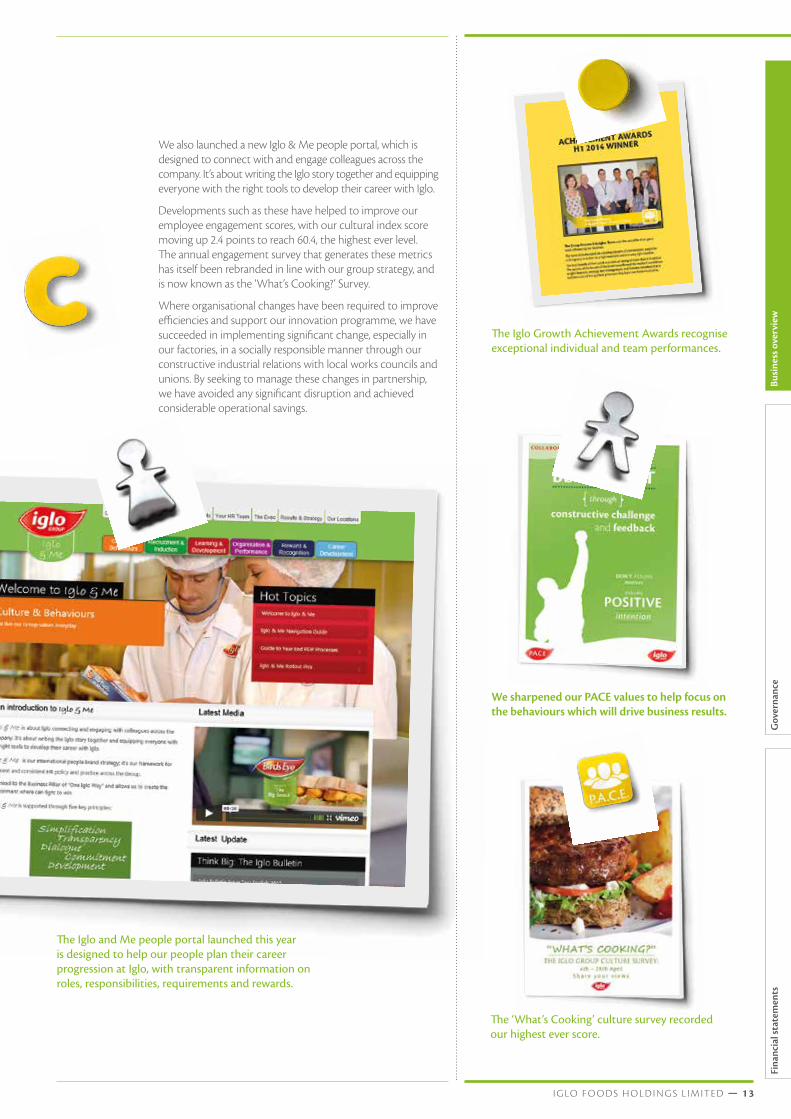
The Iglo and Me people portal launched this year is designed to help our people plan their career progression at Iglo, with transparent information on roles, responsibilities, requirements and rewards.
The Iglo Growth Achievement Awards recognise exceptional individual and team performances.
We sharpened our PACE values to help focus on the behaviours which will drive business results.
The ‘What’s Cooking’ culture survey recorded our highest ever score.
We also launched a new Iglo & Me people portal, which is designed to connect with and engage colleagues across the company. It’s about writing the Iglo story together and equipping everyone with the right tools to develop their career with Iglo.
Developments such as these have helped to improve our employee engagement scores, with our cultural index score moving up 2.4 points to reach 60.4, the highest ever level. The annual engagement survey that generates these metrics has itself been rebranded in line with our group strategy, and is now known as the ‘What’s Cooking?’ Survey.
Where organisational changes have been required to improve efficiencies and support our innovation programme, we have succeeded in implementing significant change, especially in our factories, in a socially responsible manner through our constructive industrial relations with local works councils and unions. By seeking to manage these changes in partnership, we have avoided any significant disruption and achieved considerable operational savings.
Busi
ness
ove
rvie
wG
over
nanc
eFi
nanc
ial s
tate
men
ts
I G LO F O O DS H O L D I N G S L I M IT E D — 1 3
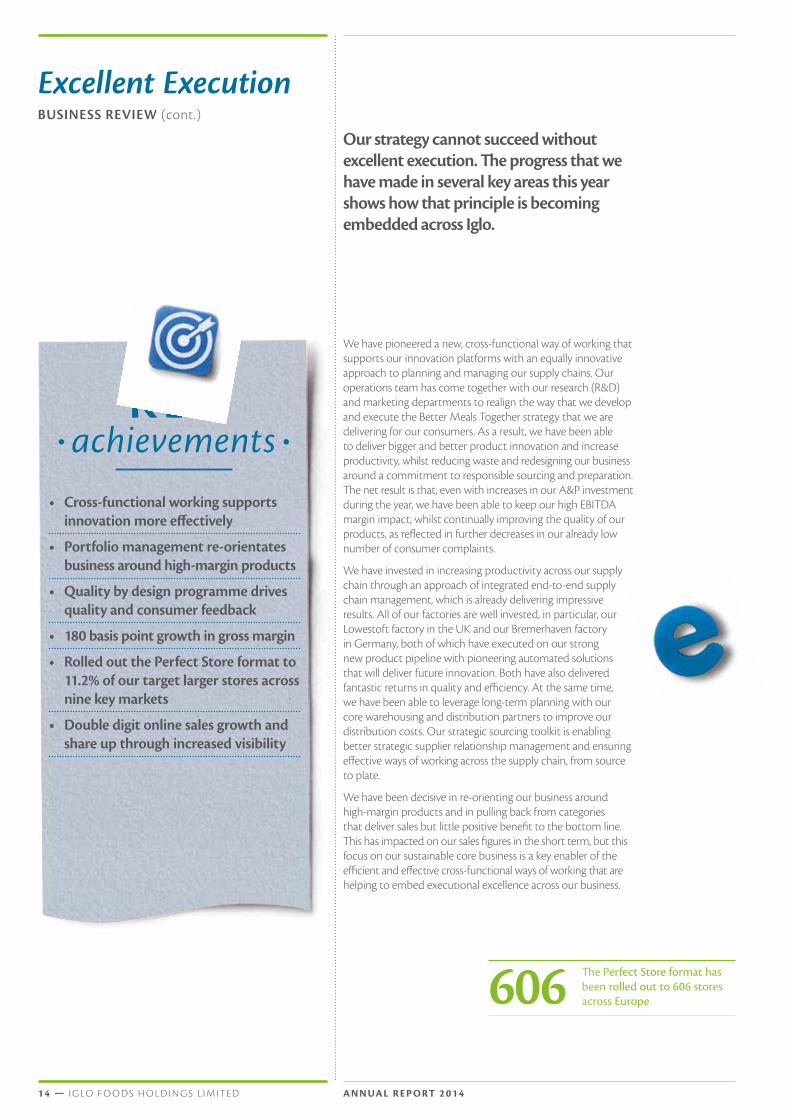
K E Y achievements
Excellent ExecutionBUSINESS REVIEW (cont.)
Our strategy cannot succeed without excellent execution. The progress that we have made in several key areas this year shows how that principle is becoming embedded across Iglo.
We have pioneered a new, cross-functional way of working that supports our innovation platforms with an equally innovative approach to planning and managing our supply chains. Our operations team has come together with our research (R&D) and marketing departments to realign the way that we develop and execute the Better Meals Together strategy that we are delivering for our consumers. As a result, we have been able to deliver bigger and better product innovation and increase productivity, whilst reducing waste and redesigning our business around a commitment to responsible sourcing and preparation. The net result is that, even with increases in our A&P investment during the year, we have been able to keep our high EBITDA margin impact, whilst continually improving the quality of our products, as reflected in further decreases in our already low number of consumer complaints.
We have invested in increasing productivity across our supply chain through an approach of integrated end-to-end supply chain management, which is already delivering impressive results. All of our factories are well invested, in particular, our Lowestoft factory in the UK and our Bremerhaven factory in Germany, both of which have executed on our strong new product pipeline with pioneering automated solutions that will deliver future innovation. Both have also delivered fantastic returns in quality and efficiency. At the same time, we have been able to leverage long-term planning with our core warehousing and distribution partners to improve our distribution costs. Our strategic sourcing toolkit is enabling better strategic supplier relationship management and ensuring effective ways of working across the supply chain, from source to plate.
We have been decisive in re-orienting our business around high-margin products and in pulling back from categories that deliver sales but little positive benefit to the bottom line. This has impacted on our sales figures in the short term, but this focus on our sustainable core business is a key enabler of the efficient and effective cross-functional ways of working that are helping to embed executional excellence across our business.
• Cross-functional working supports innovation more effectively
• Portfolio management re-orientates business around high-margin products
• Quality by design programme drives quality and consumer feedback
• 180 basis point growth in gross margin
• Rolled out the Perfect Store format to 11.2% of our target larger stores across nine key markets
• Double digit online sales growth and share up through increased visibility
The Perfect Store format has been rolled out to 606 stores across Europe606
1 4 — I G LO F O O DS H O L D I N G S L I M IT E D A N N UA L R E P O RT 2 0 1 4

Our Lowestoft factory in the UK has executed on our strong new product pipeline with pioneering automated solutions and also delivered fantastic results in quality and efficiency.
Our Perfect Store programme is improving the atmosphere and orientation of the frozen food aisles in-store.
Improving shopper experience of the frozen category, both in-store and online, is key to successfully redefining the role that our food plays in meal occasions and persuading consumers to take a fresh look at frozen.
Our Perfect Store programme, where we work closely with our retail customers to improve the atmosphere and orientation of the frozen food aisles in-store, has delivered some real successes, particularly in Belgium and Germany, where we have seen sales in stores participating in the programme increase by up to 8% compared to non-participating stores. Our focus for 2015 is to build on this momentum and continue to roll out the programme across Europe, revitalising the frozen aisles and growing the category.
Online grocery sales will be a key driver of future growth for frozen, where we are finding that consumers spend proportionately more on frozen goods when food is bought online. For some retailers we are finding that this can be more than twice as much. Excellent execution is enabling us to grow in line with the market in the UK, where a market survey in 2014 suggested that we are the second most popular online grocery brand by sales value. We have done this by taking a Category Management approach to the channel, with a focus on Brilliant Basics execution and ensuring that our on-site presence is as shopper-focused as possible. Our aim is to deliver a win for all concerned, increasing basket size for the retailer whilst bringing our brand proposition to life in the online space.
Our aim is to deliver a win for all concerned, increasing basket size for the retailer whilst bringing our brand proposition to life in the online space.
Busi
ness
ove
rvie
wG
over
nanc
eFi
nanc
ial s
tate
men
ts
I G LO F O O DS H O L D I N G S L I M IT E D — 1 5

Birds EyeBRAND REVIEW
Andrew Weston-Webb Managing Director, Birds Eye UK & Ireland
Conditions have been challenging for the UK grocery market, and for branded frozen food in particular. As the year progressed, shoppers increasingly turned to discounters and established retailers sought to fight that trend with greater focus on pricing and own-label products at the short-term expense of brands.
For Birds Eye, these challenging conditions were exacerbated by extended negotiations with one medium-sized retailer and our decision to discontinue legacy meals that delivered sales but weakened brand image and contributed little profit.
Against this backdrop our Birds Eye brand experienced a 4.6% decline in sales on a constant currency basis during the year.
Another factor impacting sales in the year-on-year comparison was the one-off impact of the horsemeat scandal in the previous year, when many own-label competitors in the burger category disappeared from shelves. Birds Eye products, which remained on shelf throughout the crisis, consequently delivered significantly higher sales than in a normal year.
Amid these tough market conditions, our new innovation platforms and Food of Life brand campaign have received a positive response from the market, with Inspirations chicken and char-grilled fish leading the way. Kantar has ranked the Inspirations launch as the best-selling new FMCG product launched in 2014, and the range has already delivered retail sales value of €60 million.
The decision to discontinue legacy meals, which impacted sales in the short term, will enable more profitable growth in the future, particularly with the launch of our premium Stir Your Senses ready meals in the first quarter of 2015.
We invested in our online capability with great success, delivering significant growth. Birds Eye is now the second biggest brand in the UK for online grocery sales after Coca-Cola, and as shoppers increasingly choose to buy groceries online, this channel’s importance to our business will continue to grow. We are building constructive working relationships with our retailers in the online space, pioneering innovative combo deals that position our food in new lifestyle contexts whilst growing basket size. We also launched a new consumer website which better reflects the needs and expectations of our consumers in an increasingly digital world.
In Ireland we grew our share of a declining market by 1.7%, by combining effective new promotional tactics with innovation and brand investment. This provides us with a strong blueprint for the current UK environment that we intend to roll out in the coming year.
Whilst the outlook for 2015 will remain challenging, the strong performances of our product launches in 2014 have paved the way for new innovation platforms in the year ahead. We expect to grow our share in key adult meals categories to introduce the Birds Eye brand into new households and to attract new consumers to the category. We intend to continue to build a strong foundation for retail customer partnerships that can succeed amid the current, difficult trading conditions.
Kantar has ranked the Inspirations launch as the best-selling new FMCG product launched in 2014, and the range has already delivered retail sales value of €60m.
1 6 — I G LO F O O DS H O L D I N G S L I M IT E D A N N UA L R E P O RT 2 0 1 4

IgloBRAND REVIEW
Achim Eichenlaub Managing Director, Iglo Markets
The European retail market has been challenging throughout 2014, and frozen food has not been immune from this. Net sales for the Iglo markets as a whole declined 2.8% year-on-year, driven largely by a poor performance in Germany where protracted negotiations with two large supermarket chains resulted in lower promotional support of Iglo products for a period.
Following a change in management in Germany, performance improved slightly in the second half, and the Group anticipates a further improvement in 2015 as the full strategy implementation starts to take effect.
Outside Germany, a combination of decisive management changes, as well as a focus on adult meal categories, delivered strong growth in a promising series of performances. After splitting the management of the Iglo businesses in Belgium and the Netherlands, we experienced a return to sales growth in the former and in the latter succeeded in increasing sales by 8.2%. In Portugal, we innovated successfully, adding adult portions to our fish finger and chicken nugget ranges and increasing our media spend; the result was a strong 8.7% increase in sales. In Russia, we remain the key market leader in value-added fish products, growing that market as whole by 20% in the last year.
In France, we refocused our portfolio to raise our visibility and sharpen our effectiveness, moving away from legacy products that make little positive impact on the bottom line. While this initially meant a decline in top-line sales, this approach stands us in good stead for the year ahead. Sales also declined in Austria but we performed in line with the market as a whole. Following a geographic review of our business, we have decided to cease marketing our products in Romania, Slovakia and Turkey where the frozen category is small in terms of the overall grocery market.
Our Better Meals Together strategy only rolled out in our Iglo markets in the final quarter of the year. The strong performance of our first innovation platform – Stir Your Senses – suggests that the prospects for our other innovation platforms, such as Steamfresh and Burger, will act as a significant boost for 2015.
2014 saw a significant increase in gross margin of 2.4% across our Iglo markets. This positions the brand well for 2015 and reflects strong growth across several of our European markets.
Our outlook for 2015 is a cautiously positive one. The increasingly deflationary environment in Europe and its impact on consumer spending will remain risk factors. However, the successful conclusion of our negotiations with retail customers in Germany will remove a significant drag on performance for that market and we expect our strong innovation pipeline to help offset the challenging retail environment across Europe. The strong performance of our first innovation
platform – Stir Your Senses – suggests that the prospects for our other innovation platforms, such as Steamfresh and Burger, will act as a significant boost for 2015.
Busi
ness
ove
rvie
wG
over
nanc
eFi
nanc
ial s
tate
men
ts
I G LO F O O DS H O L D I N G S L I M IT E D — 1 7

Daniel Pagnoni Managing Director, Findus Italy
In Italy, Iglo has delivered 5 consecutive quarters of growth5
Findus Italy was one of very few FMCG companies to post an increase in sales during 2014, despite market conditions that remained extremely challenging. Of the top 15 FMCG businesses in the country, all but four experienced a decline in sales*. In this context, our success in overcoming constrained shopping budgets and increased own-label competition is very encouraging.
Our Findus brand has now posted five consecutive quarters of growth in top line sales. This performance has been driven by the execution of our Better Meals Together strategy, which we launched in Italy in the final quarter of 2013, making it the first of our markets to roll out the approach. Our strategy is focused on delivering innovation and investing in marketing to support our core portfolio and innovation launches.
The Findus Italy performance also stems from a strongly energised working culture, following the reorganisation of the business during the previous year, and a relentless focus on excellence in execution across our business functions.
We succeeded in distributing innovative new products effectively and efficiently across the market. Our strong sales performance was backed by the Food of Life advertising campaign and a powerful media plan, which doubled our market awareness with the same level of spend. Fish recipes, seafood and our new poultry and burger lines were key drivers of growth over the year, with innovative products targeted at adults accounting for much of our sales growth. Our total poultry sales grew by 42%, driven by the launch of the Inspirations platform, and we gained more than 100 basis points of share in the fish category where Findus Italy sales grew by 4% against category growth of just 1%.
We improved our net working capital position dramatically whilst developing an efficient approach to logistics and improving our stock planning to lower the amount of capital tied up on shelves.
Looking ahead to 2015, there is no doubt that market conditions will remain challenging. However, over the next year, we have plans to further extend and simplify our commitment to innovation and the new product lines that have driven growth in 2014. At the same time we plan to unlock further opportunities by applying the same innovative approach to re-energising the Sofficini and Quattro Salti product lines.
The successful launch of innovative products has been a key driver of the Italian business’ growth during 2014 and, with a strong innovation pipeline extending this to new categories throughout 2015, Findus Italy is well placed for growth in a challenging retail environment.
Fish recipes, seafood and our new poultry and burger lines were key drivers of growth over the year, with innovative products targeted at adults accounting for much of our sales growth.
Findus ItalyBRAND REVIEW
*Source: Company Information, IRI
1 8 — I G LO F O O DS H O L D I N G S L I M IT E D A N N UA L R E P O RT 2 0 1 4

Forever Food TogetherCORPORATE SOCIAL RESPONSIBILITY
Forever Food Together is Iglo’s Corporate Social Responsibility programme which is an integral part of our strategy.
It captures our vision of the role that frozen food, and we, can play in tackling fundamental challenges for society. It also reflects the trust that people have in our brands, and the recognition that with it comes an on going responsibility. We do this through always providing fully traceable, safe, top-quality food, and through doing so in a responsible way that ensures our food will be available forever.
The Forever Food Together programme is built around three goals, or promises to our consumers that set stretching targets for our business over the next five years.
• Goal 1: By 2020, we will educate consumers across Europe about the unique advantages of freezing and frozen food and help tackle food waste
• Goal 2: By 2020, 100% of our innovation will help consumers make healthier meal choices
• Goal 3: By 2020, 100% of our food products will be responsibly sourced and prepared
During 2014, we raised the profile of our Forever Food Together programme, both internally and externally. We have embedded it more deeply within our culture, values and operations and we have made it a fundamental part of our brand positioning.
Frozen offers a more sustainable food choice that can dramatically cut food waste because it inherently extends shelf-life. It enables us to maximise our food resources across the supply chain and into the home, whilst helping household budgets go further. Consumers can plan and shop more efficiently as well.
The sustainable benefits of frozen are thus naturally aligned with our Better Meals Together strategy.
SHARING OUR VISION OF FOREVER FOOD TOGETHER2014 marked the external launch of Forever Food Together at a high-profile event held at the Shard in London, which Baroness Scott chaired, where a panel discussed the difference that freezing and frozen food can make in reducing food waste.
Internally, our Forever Food Together roadshow reached out to more than 620 colleagues at 17 of our key locations across Europe. The roadshows helped embed the principles of Forever Food Together across all areas of our business.
We also established a network of Forever Food Together Ambassadors from every level of the business across all Iglo sites. Our Ambassadors operate with the central CSR team and act as a CSR compass locally, ensuring a two-way flow of information, passing on progress reports, requesting local support when required and offering up new ideas and initiatives to drive the programme.
The Green Captain icon became the public face of our Forever Food Together programme, appearing as a CSR brand icon on all new Iglo packaging with a clear message summarising our three goals in the local language of each market. Our Green Captain points consumers to our Forever Food Together websites, which explain our commitments and our vision of frozen as a more sustainable food choice.
Busi
ness
ove
rvie
wG
over
nanc
eFi
nanc
ial s
tate
men
ts
I G LO F O O DS H O L D I N G S L I M IT E D — 1 9
Forever Food TogetherCORPORATE SOCIAL RESPONSIBILITY (cont.)
PROGRESS AGAINST OUR THREE GOALSThe three goals of our Forever Food Together programme provide us with a clear framework for measuring our progress. We made significant advances towards all three goals during 2014.
Goal 2: 100% of our innovation will help consumers make healthier meal choicesThe world faces an obesity epidemic that proves how challenging it can be for consumers to make healthier eating choices. Our response is to innovate responsibly, offering consumers recipes that are easy and convenient to prepare, and provide a simple route to a balanced diet. Our goal is for 100% of our innovation to help consumers make healthy meal choices by 2020.
Iglo Group’s Nutrition Advisory Board brings together independent experts such as leading nutritionists and academics, to help guide our innovation progress and inform our future plans.
During 2014, we worked with the Board to implement our Forever Food Together Nutrient Profiling Tool which embeds nutrition guidelines at the heart of our Research & Development (R&D), and will track progress towards our goal.
Of all new products launched by Iglo in 2014, 80% met the criteria for offering a healthier food choice that are laid down in the Nutrient Profiling Tool. This represents significant progress towards our goal of 100% of our new products meeting these criteria by 2020.
Goal 1: We will educate consumers across Europe about the unique advantages of freezing and frozen food, and help tackle food wasteMore than a third of the food that the world produces is wasted and EU food waste alone is predicted to reach 126 million tonnes by 2020. The first goal of our Forever Food Together programme is our response to this fundamental societal challenge.
Frozen, our method of food preservation, reduces the possibility of food waste at all points in food’s journey to the plate. Freezing food extends its shelf life and enables it to be transported easily, reducing waste in the supply chain. Up to now though, less has been known for certain about the impact of freezing on use of food within the home.
During 2014, new research was published that sheds light on this area and the findings are significant in the drive towards creating more sustainable food consumption. We commissioned Sheffield Hallam University in the UK to independently investigate how the behaviour of families buying frozen food differed from those buying the equivalent fresh or chilled food products. The study, which was peer reviewed and published in the British Food Journal, showed that, when eating frozen food, domestic food waste was reduced by 47%.
These findings formed the centrepiece in our external launch of the Forever Food Together programme, and will help us to mobilise a broader range of stakeholders around the benefits of frozen food. They demonstrate the role which frozen can play in using our planet’s resources more efficiently and provide a firm foundation for raising awareness. At the Forever Food Together launch, we committed to undertake and support further research in other countries to understand the beneficial impacts of frozen.
Through our Green Captain icon and our supporting Forever Food Together websites, we are getting the word out direct to consumers about the sustainability benefits of frozen. At the same time we are using the Hallam University research to build momentum behind a cross-industry campaign that can take awareness of the importance of freezing food, and reducing waste, to the next level.
At our launch event, we also committed to leveraging the benefits of frozen as extensively as possible within our own supply chains. For key iconic product lines such as fish fingers, peas and spinach and vegetables, we will work with our supply chain partners to demonstrate that 100% of the food resources that pass into our supply chain are used. We have set ourselves the ambitious target of achieving this by 2020, and further demonstrating the unique benefits that quick freezing as a method of food preservation can have on food waste.
Goal 3: 100% of our food products will be responsibly sourced and preparedEstablishing resilient, transparent and certified food supply chains is essential for frozen to fulfil its potential as a sustainable force. Goal 3 of our Forever Food Together programme reflects our commitment to responsible food sourcing through certification, and also our commitment to providing the quality and transparency that consumers expect from Iglo brands.
Under Goal 3, we adopt recognisable, credible global standards for raw materials sourcing, design, production and distribution, and we work to establish such standards where they do not already exist. This has involved taking a long-term leadership position in pioneering the certification of sustainable fisheries in partnership with the Marine Stewardship Council. This has led to Iglo selling more MSC-certified fish in more countries than any other food company in Europe. Our peas and spinach are grown in partnership and meet GlobalGAP, ISO14001 and LEAF standards.
2 0 — I G LO F O O DS H O L D I N G S L I M IT E D A N N UA L R E P O RT 2 0 1 4

We are confident that frozen food has a pivotal role to play in developing more sustainable food consumption solutions for consumers and society. At the heart of our programme is our belief that we are at our most effective when we are able to bring together policymakers, civil society, suppliers and food manufacturers, retailers and consumers and align these efforts with our brand valuesOur approach, Forever Food Together for a sustainable future, reflects this
During 2014, we made important progress with our Goal 3 targets.
Goal 3 status
Independent Verification 2006 2014 Group
2020 Target
Wild Capture Fisheries Marine Stewardship Council 48% 90% >90%
Agricultural Crops & Vegetables GlobalGAP DE & IT & LEAF in UK N/A 100% 100%
Palm Oil Certified Segregated RSPO (highest Standard)
none 90% 100%
Carbon Emissions & Energy N/A -18% -30%
Busi
ness
ove
rvie
wG
over
nanc
eFi
nanc
ial s
tate
men
ts
I G LO F O O DS H O L D I N G S L I M IT E D — 2 1

Despite difficult trading conditions the Group continued to execute its new strategy through investment in marketing and innovation which has improved gross margin and delivered stable EBITDA, as well as another year of strong cash generation with closing Net Debt at 4.6x EBITDA
Improved margins and continued strong cash flowCHIEF FINANCIAL OFFICER’S REVIEW
Paul Kenyon Chief Financial Officer
OUR PERFORMANCEThe Group’s sales performance this year was disappointing, declining in constant currency terms by 1.9% year-on-year. However, Gross Profit and Margin both grew year-on-year as a result of improved mix management, margin-accretive innovation launches and a continued focus on operational cost efficiency. The Group’s EBITDA before exceptional items margin, at 20%, remains at the top end of industry norms.
The business continued to deliver a strong performance in cash management, ending the year with negative working capital for the fourth successive year. This was driven by continued high levels of cash generation by the business, with an operating cash flow conversion percentage of 90% before exceptional items. At the year end, the Net Debt/EBITDA ratio was 4.6x.
TRADING RESULTSTrading results to EBITDA before exceptional items are presented using constant currency exchange rates.
Constant currency results have been determined by translating the local currency denominated results for the year ended 31 December 2014 and for earlier comparative years to the 2014 budgeted €/£ exchange rate of 1.16. This represents a change in methodology to the constant currency results displayed in previous annual reports, which will not be comparable. The change has been made to align the constant currency results with those reported internally to the Chief Operating Decision Maker.
Net SalesTotal Net Sales decreased by 1.9% year-on-year to €1,469.5 million. The European food market has been challenging in 2014, and frozen food has not been immune to this with the defined frozen food market declining by 0.5% during that year. Two of the Group’s key markets saw declines in market size in the year, and against that background it is encouraging that the Group’s Italian business has delivered five successive quarters of Net Sales growth. This performance was driven by the execution of our new strategy through investment in marketing to support the core product lines and our innovation pipeline. In the UK market, the impact of the market decline has been compounded by extended negotiations with a medium-sized retailer which led to a reduction in the assortment listed, a decline in the legacy portfolio of meals and one-off gains of burger listings in 2013 following the horsemeat scandal. However, this decline has been offset to some extent by the successful launch of the Inspirations and Steamfresh platforms. In Germany, a slightly improved performance was seen in the second half of the year following the conclusion of some extended customer negotiations and the launch of the Stir Your Senses platform. Overall, Net Sales growth has been achieved in 8 out of 12 markets.
Gross MarginGross Margin improved this year, increasing by 1.8 ppts to 35.3%. The increase was primarily due to a favourable product mix driven by margin accretive innovation and supply chain continuous improvement.
2 2 — I G LO F O O DS H O L D I N G S L I M IT E D A N N UA L R E P O RT 2 0 1 4

EBITDA excluding exceptional itemsEBITDA before exceptional items remained broadly flat, as the improved margin performance was reinvested in the business through increased media spend behind the roll out of the new Food of Life campaign and the innovation launches. Investments were also directed towards improving the Group’s marketing capability and increasing research & development capacity.
Results at reported and constant currency Table 1: Reported currency€m 2014 2013 Movement %Revenue (Net Sales) 1,500.9 1,505.8 (4.9) (0.3)Gross Profit1 531.3 502.2 29.1 5.8Gross Margin 35.4% 33.4% 2.0EBITDA before exceptional items 306.2 300.1 6.1 2.0Exceptional items (52.9) (83.8)Depreciation (24.8) (23.4)Amortisation (5.6) (4.5)Operating profit 222.9 188.4
Table 2: Constant currency€m 2014 2013 Movement %Revenue (Net Sales) 1,469.5 1,498.5 (29.0) (1.9)Gross Profit 519.2 501.5 17.7 3.5Gross Margin 35.3% 33.5% 1.8EBITDA before exceptional items 297.8 298.0 (0.2) (0.1)
Exceptional itemsExceptional items during the year were €52.9 million (2013: €83.8 million).
The Group has incurred charges of €17.4 million in relation to a strategic review of the Group’s operations and other items (2013: €11.2 million). This includes costs incurred as a result of the decision to cease marketing its products in Romania, Slovakia and Turkey in November 2014, amounts in relation to tax matters from previous accounting periods and costs related to the implementation of the Better Meals Together strategy.
The Group incurred charges of €16.7 million (2013: €13.8 million) related to management incentive schemes. The majority of these costs have been accrued during the year, but are not due for payment until the associated performance conditions are met.
The Group has incurred restructuring costs of €11.6 million (2013: €10.5 million) in the year, principally in our German factories. Restructuring has been implemented as part of a strategy to deliver further operational efficiencies.
€5.5 million has been charged in relation to a fire in August 2014 in the Group’s Italian production facility which produces Findus branded stock for sale in Italy. The charge includes the cost of stock damaged by the fire, the impairment of property as well as ongoing incremental costs incurred as a result of the disruption to operations. The Group has insurance policies in place covering the stock, property and loss of earnings for which claims are currently in process. The proceeds of these claims cannot be recognised until the recoverable amount is judged to be virtually certain. As at 31 December 2014, losses of €8.7 million have been incurred, which has been offset by receipts from the insurers of €3.2 million.
€1.7 million has been incurred in the year (2013: €20.9 million) principally due to a further payment of registration tax related to the acquisition of Findus Italy. The Group is appealing the rulings and has elected to pay the assessed taxes in order to avoid incurring penalties and interest.
In 2013, €27.4 million was charged as a result of the decision to fully provide for the value of goodwill in the Belgium business.
The tax impact on the exceptional items amounts to €7.8 million (2013: €10.4 million).1 Stated after cost of sales of €912.6 million (2013: €939.3 million) and distribution costs of €57.0 million (2013: €64.3 million).
The reported average €/£ exchange rate for 2014 was 1.24. The constant currency results have been determined by translating the local currency denominated results for the year ended 31 December 2014 and for earlier comparative years to the 2014 budgeted €/£ exchange rate of 1.16.
Net Debt is defined as total bank and bond debt less cash and cash equivalents.
Gross margin of the Iglo Group business increased by 1.8ppts to 35.3% (at constant currency exchange rates)
GROSS MARGIN 2014
2013
2012
2011
2010
33.5%35.3%
34.7%
33.2%34.4%34.7%33.5%35.3%
33.2%1.8pptsIncrease 2013-2014
Decrease 2013-2014
Net Sales of the Iglo Group business decreased by 1.9% to €1,469.5 million (at constant currency exchange rates)
NET SALES €m 2014
2013
2012
2011
2010
1,469.5 1,498.5
1,569.0 1,548.1
1,541.8 -1.9%
Decrease 2013-2014
EBITDA before exceptional items decreased by 0.1% to €297.8 million (at constant currency exchange rates)
EBITDA €m 2014
2013
2012
2011
2010
298.0 297.8
342.1
304.1 325.3 -0.1%
Decrease 2013-2014
Net Debt (excluding investor funded loan notes) decreased during the year as a result of the refinancing
NET DEBT €m 2014
2013
2012
2011
2010
1,514 1,414
1,629
1,559 1,410 -100m
Operating cash flow conversion of 90% was generated at reported exchange rates
OPERATING CASH FLOW CONVERSION
2014
2013
2012
2011
2010
97%90%
87%
127%106%
Busi
ness
ove
rvie
wG
over
nanc
eFi
nanc
ial s
tate
men
ts
I G LO F O O DS H O L D I N G S L I M IT E D — 2 3
Finance costsGroup net finance costs were €290.2 million (2013: €227.6 million).
Of the total costs for the year, €87.4 million (2013: €95.7 million) related to interest on bank loans and €129.8 million (2013: €116.7 million) to interest on investor loan notes.
On 17 July 2014, the Group completed a refinancing of its Senior debt with a syndicate of banks. All Senior debt was repaid and replaced with new Senior Euro debt of €620.0 million and Senior GBP debt of £400.0 million, which are both repayable on 30 June 2020. In addition to this, €500.0 million has been raised through the issuance of a floating rate bond issue on the Luxembourg Stock Exchange, with a repayment date of 15 June 2020. The refinancing has allowed the Group to access additional investors and is expected to deliver annual interest savings of around €14 million.
The current year charge also includes a one-off charge of €37.9 million linked to the refinancing in July 2014 of which €34.5 million relates to the write-off of deferred borrowing costs relating to the previous senior debt. The current year charge also includes a loss of €15.6 million (2013: €5.0 million gain) of exchange differences arising on re-translation of financial assets and liabilities and a charge of €7.5 million (2013: €11.8 million) for the amortisation of deferred borrowing costs.
TaxationThe tax expense for the year was €41.8 million (2013: €2.0 million).
This charge is split between a current tax expense of €27.5 million (2013: €16.6 million) and a net deferred tax charge of €14.3 million (2013: credit of €14.6 million).
The current tax charge is higher by €10.9 million due to an increase in taxable profits in 2014 compared to 2013. This is due to a year-on-year reduction in tax deductible costs and other temporary timing differences.
The increase in the deferred tax charge of €28.9 million is driven by significant credits to the P&L in 2013. In 2013, there was a credit of €14.6 million due to a change in deferred tax rates from 23% to 20%. A further credit of €8.3 million was recognised in 2013 as a result of an adjustment to the calculation of deferred tax on intangibles. In 2014, a charge of €7.8 million was incurred following an impairment to our deferred tax assets. This was as a result of matters under discussion with the local tax authorities.
Loss after taxOverall, the Group made a loss after tax of €109.1 million (2013: €41.2 million).
LIQUIDITYIn total, there was a net decrease in cash and cash equivalents of €97.9 million (2013: increase of €101.5 million) leaving a net cash balance of €219.2 million at 31 December 2014 (2013: €317.1 million). The net repayment of loan principal of €236.9 million (2013: €nil) is the key driver behind this decrease in cash.
Operating cash flows Table 3: Operating cash flows€m 2014 2013EBITDA before exceptional items 306.2 300.1Loss on disposal of fixed assets 0.2 –(Increase)/decrease in working capital (0.4) 20.4Decrease in employee benefits provision and other non-cash movements (4.3) (1.8)Cash generated from operations 301.7 318.7
Tax paid (17.1) (30.1)Cash flows related to exceptional items (17.2) (51.3)Net cash from operating activities 267.4 237.3
At an operating level the Group remains highly cash generative.
During the year to 31 December 2014 net cash inflows from operating activities, before exceptional items, was €301.7 million (2013: €318.7 million) and operating cash flow conversion was 90% (2013: 97%).
CHIEF FINANCIAL OFFICER’S REVIEW (cont.)
2 4 — I G LO F O O DS H O L D I N G S L I M IT E D A N N UA L R E P O RT 2 0 1 4

Operating cash flow conversion 2014 90%2013 97%2012 87%2011 106%2010 127%
Working capitalWe continue to maintain very low levels of working capital, achieving negative working capital for the fourth year in a row at 31 December 2014.
Table 4: Working capital analysis€m 2014 2013 Movement Inventory 229.1 221.8 Receivables 49.4 57.6 Payables (313.9) (304.5)Working capital (35.4) (25.1) (10.3)FX and non-trading items 10.7 Increase in working capital 0.4
Other cash flowsTax payments of €17.1 million were lower than the prior year payments of €30.1 million. This is partly due to the timing of payments, as the lower current tax expense in 2013 compared to 2012 meant that year-on-year tax payments reduced. In addition, a tax refund was received in 2014 following an overpayment in 2013.
Cash flows relating to exceptional items of €17.2 million relate primarily to payment for restructuring projects.
Investing cash flows Table 5: Investing cash flows€m 2014 2013 Capital expenditure & other expenditure (26.3) (28.3)Investing cash flows (26.3) (28.3)
€26.3 million was reinvested into capital expenditure, mainly involving upgrading of capacity and improving quality across our production facilities.
Financing cash flows Table 6: Financing cash flows€m 2014 2013 Proceeds from new loans* 1,624.1 0.4Repayment of loan principal* (1,861.0) –Payment of refinancing fees (15.9) (7.0)Interest related payments (91.4) (100.1)Financing cash flows (344.2) (106.7)
*Net repayment of loan principal of €236.9 million (2013: €0.4 million net proceeds from new loans).
On 17 July 2014, the Group completed a refinancing of its Senior debt with a syndicate of banks. All Senior debt as at the balance sheet date was repaid and replaced with new Senior Euro debt of €620 million and Senior GBP debt of £400 million, which are repayable on June 30, 2020. In addition to this, €500 million has been raised through the issuance of a floating rate bond issue on the Luxembourg Stock Exchange, with a repayment date of June 15, 2020. Both the new Senior debt and the bond issue are secured with equal ranking against certain assets of the Group. The refinancing has allowed the Group to access additional investors and is expected to deliver annual interest savings of around €14 million.
Busi
ness
ove
rvie
wG
over
nanc
eFi
nanc
ial s
tate
men
ts
I G LO F O O DS H O L D I N G S L I M IT E D — 2 5
Borrowings Table 7: Debt structure
€m
Bank debt & Bond
debt
Cash and cash
equivalents
Investor Loan
Notes TotalBalance at December 2013 1,831.4 (317.1) 1,149.0 2,663.3Cash generated by business – 103.1 – 103.1Capitalised interest – – 129.8 129.8Net repayment of loan principal (236.9) – – (236.9)Movements due to foreign exchange 39.1 (5.2) – 33.9Total 1,633.6 (219.2) 1,278.8 2,693.2
At the end of December 2014, total bank and bond debt was €1,633.6 million compared to €1,831.4 million at the end of December 2013.
In addition to the bank debt shown above, the Group also has access to a revolving credit facility of €80 million, expiring in December 2019. This is available to finance working capital requirements and for general corporate purposes. Currently, €4.0 million is utilised for letters of credit, overdrafts, customer bonds and bank guarantees.
At the end of December 2014, Net Debt was €1,414.4 million compared to €1,514.4 million at the end of December 2013. Net Debt is defined as total bank and bond debt plus cash and cash equivalents.
Further detail on the Group’s borrowings is set out in note 17 of the financial statements.
FINANCIAL POSITIONGoodwill & other intangible assetsWe review the carrying value of our goodwill and brands on an annual basis. Our review does not indicate any impairment in the current year, but the headroom on the calculation is relatively low for the operations in Italy. Italy has experienced consistent sales growth in the year on the back of increased investment into A&P and new product launches. The headroom has increased in the year although this has mainly been driven by the reduction in WACC. As such, there is still a risk that changes in the market could impact the carrying value of goodwill and brands so that they fall short of that determined by value in use, leading to possible impairment.
See note 11 for further details on intangible assets.
Other liabilities: pensionsThe net pension liabilities relate mainly to obligations in Germany of €114.8 million (2013: €62.1 million) and Italy €5.7 million (2013: €5.4 million). The increase in the liability is driven by a decrease in the discount rate used to calculate the liability at 31 December 2014. This has been most prominent in Germany where the discount rate applied to the defined benefit pension plan has reduced from 3.9% at 31 December 2013 to 2.0% as at December 2014 following a fall in interest rates in the Eurozone and reductions in market yields on long-dated corporate bonds.
See note 19 for further details on employee benefits.
CHIEF FINANCIAL OFFICER’S REVIEW (cont.)
2 6 — I G LO F O O DS H O L D I N G S L I M IT E D A N N UA L R E P O RT 2 0 1 4

Manufacturing and logistics
Our manufacturing and distribution facilities could be disrupted and/or damaged for reasons beyond our control, such as extremes of weather, fire, supplies of material or services, systems failure, workforce actions or environmental issues.
Any significant manufacturing or logistical disruptions could affect our ability to make and sell products which could cause revenues to decline. This is in addition to the risk of cash outflows for asset replacement and the risk to employee safety.
There is an ongoing programme of efficiency improvement initiatives across our production facilities and operations and we have a business continuity planning process in place. All risks of physical property loss or damage and resultant loss of gross profit and increased cost of working are covered by insurance subject to insurable limits.
Technical services quality assurance
As we manufacture food products, any quality failure could impact the health of our consumers and the reputation of the brands.
Product quality is challenged via third parties including customers, consumers, NGOs, local authorities and Port authorities amongst others.
Our sourcing and production standards and quality processes are designed to avoid such issues arising. A quality failure could lead to the delisting of products, a product recall, impairment of stock and a loss of standard accreditation. Weak public relations may damage our brand image leading to a decline in sales.
Our sourcing and production standards and quality processes are designed to avoid such issues arising.
The Consumer Services function contracts a service from a third party digital media communications agency to monitor social media sites for communications related to the Group brands and products. The information is fed back to management to form an appropriate response.
Information technology
We depend on accurate, timely information and numerical data from key software applications to aid day-to-day operations and decision-making.
Any disruption caused by failings in these systems, of underlying equipment or of communication networks, could delay or otherwise impact day-to-day operations or decision-making, or cause financial losses.
Preventative measures are taken by a third party service provider to ensure data security is kept up-to-date and applied throughout the Group.
We have contingency plans in place for such situations, including manual workarounds, offsite systems backups and options for working offsite or from alternative locations. A crisis management protocol is in place for business interruption issues as part of the service level agreement.
Competition and consumer marketing
The frozen food industry is highly competitive.
We compete with other multinational corporations which are focused on special segments of the frozen food market in which both we and they operate, and with retailers who promote their “own labels”.
Furthermore, consumer tastes are susceptible to change. If we are unable to respond successfully to rapid changes in demand or consumer preferences, our sales or margins could be adversely affected.
Monthly management accounts are produced which are reviewed by the Board. These accounts allow performance to be assessed in both absolute and relative market terms and are used by the Board to make decisions.
Legal & regulatory risk management
Employees either make or receive acts of bribery in course of their duties.
A breach of legislation could lead to large fines for the Group and directors.
A code of conduct has been created and issued to employees. Employees are frequently reminded of their responsibilities and are asked to confirm agreement with the code on an annual basis.
Legal & regulatory contractual risk management
Employees enter purchasing arrangements without an approved contract in place.
The Group has controls in place to pre-approve significant contracts for goods and services.
Our Procurement function is aware of the importance of issuing approved Group terms at various point of the sale process, and employees are made aware of the Group policy that guides all supplier contracts and negotiations.
NON FINANCIAL RISK FACTORSOur business and the financial results of our operations could be materially affected by any or all of the following risks that we continue to manage actively:
Busi
ness
ove
rvie
wG
over
nanc
eFi
nanc
ial s
tate
men
ts
I G LO F O O DS H O L D I N G S L I M IT E D — 2 7

Project management and innovation
Failure to deliver new products.
In a competitive market the business must constantly drive forward with business innovation. Effective project management processes are critical to delivering this innovation.
The project management process is driven through regular reviews with cross-functional participation to robustly challenge projects and its deliverables, and to bring issues and risks to the table for addressing. The reviews allow targets and delivery expectations to be monitored and realigned.
Complex customer arrangements
Trade Spend within the retail industry includes a number of complex promotions and discount arrangements.
Trade Spend invested by the Group includes rebates, discounts, incentives, promotional couponing and trade communication costs.
Each customer has a unique agreement that is governed by a series of performance conditions. Controls are in place to ensure that each agreement is approved at the appropriate level.
Throughout each financial year, expected promotions or discounts based on historical trends, prior rebate contracts and customers’ estimated performance levels are accrued after management review and approval.
Extensive controls are in place to ensure that Trade Spend claims against the Group are invoiced on a timely basis. At each financial year end date any Trade Spend incurred but not yet invoiced is accrued. These estimates are subject to review by senior management.
Taxation
The calculation of the Group’s total tax charge involves estimation and judgement in respect of certain matters where the tax impact is uncertain until a conclusion is reached with the relevant tax authority or through a legal process.
The final resolution of these open tax items can take many years as it is not always within the control of the Group and often depends on the efficiency of legal processes in the relevant tax jurisdiction.
Management closely monitor developments in relation to significant tax issues and take external tax advice as necessary. Regular reporting to the Board of tax risks and exposures provides high visibility of issues.
Raw material availability and cost
Our business depends upon the availability, quality and cost of raw materials which we source from around the world.
Key inputs such as fish, vegetables, ingredients, packaging materials and energy are subject to potentially significant price and supply fluctuations.
We monitor changes in our input prices on an ongoing basis and key variances and trends are reported to the Board monthly. Through a combination of our buying and pricing strategies we aim to minimise the impact on our profitability. Iglo Group has a history of successfully sourcing raw materials in times of shortage and in passing through genuine increases in input prices to our customers.
Therefore, whilst we believe that any impact on our profitability from higher raw material prices would be a short-term issue, there can be no assurance that all shortfalls will be recovered. A failure to recover higher costs or shortfalls in availability or quality could decrease our profitability.
CHIEF FINANCIAL OFFICER’S REVIEW (cont.)
2 8 — I G LO F O O DS H O L D I N G S L I M IT E D A N N UA L R E P O RT 2 0 1 4

Interest rate risk
The Group’s income and operating cash flows are substantially independent of changes in interest rates. However, the Group has significant levels of floating rate borrowings and is therefore exposed to the impact of interest rate fluctuations.
The Group’s policy on interest rate risk is designed to limit the Group’s exposure to fluctuating interest rates. This is done using interest rate caps which are designated as cash flow hedges.
At the year end, interest rate caps were in place to cover 95% and 71% of the floating interest rate of the Euro and Sterling Group loans respectively, on which interest is due to be paid in cash in 2015.
Exchange rate risk
The Group is exposed to two types of exchange rate risk: translational risk and transactional risk.
Translational risk arises because the reporting currency of the Group is the Euro and yet the Group earns a significant proportion of its sales and EBITDA in Sterling through its UK based “Birds Eye” business. The Group is exposed to translational foreign exchange impacts as we convert the Sterling results of our UK business into our reporting currency of Euro. A proportion of this risk is structurally hedged through the Group financing structure. As at 31 December 2014, 31% of external debt arrangements were denominated in Sterling, compared to 33% of revenue and 43% of EBITDA of the Group.
Transactional risk arises in three areas. Across the whole Group a significant proportion of the raw material purchases are denominated in US Dollars and Swedish Krona, yet the sales are made in either Euros or Sterling. The UK business suffers further transactional risk related to the raw materials that it purchases in Euros. The Group mitigates this risk by buying forward foreign exchange contracts to cover the value of relevant contractual commitments in the coming year and a proportion of forecast commitments which are not yet contractual. These contracts have a maturity of less than one year.
Credit risk
Credit risk is the risk that a counterparty will be unable to pay amounts in full, when due.
The Group’s policy is to limit counterparty exposures by monitoring each counterparty carefully and, where possible, setting credit limits by reference to published credit ratings. Surplus cash is invested in short-term financial instruments and only deposited with counterparties meeting a minimum credit rating requirement set by the Board.
Counterparty credit ratings are regularly monitored, and there is no significant concentration of credit risk with any single counterparty.
Liquidity risk
Liquidity risk is the risk that cash may not be available to pay obligations when due.
Cash forecasts identifying the liquidity requirements of the Group are produced frequently. These are reviewed regularly by the Board to ensure that sufficient financial headroom exists for a minimum 12 month period. Following the refinancing in 2014, the Group’s borrowings now mature in 2020. As at 31 December 2014, the Group had cash and cash equivalents of €219.2 million and undrawn committed facilities of €76.0 million.
The Group maintains a close relationship with the larger credit insurance companies. We provide regular information to ensure that our financial position is clearly understood and that, where possible, credit insurance cover is readily available to our suppliers.
Capital risk management
Capital risk is the risk that an investor may lose the value of the amount invested.
The Group’s objectives when managing capital are to maximise shareholder value while safeguarding the Group’s ability to continue as a going concern. We will continue to proactively manage our capital structure whilst maintaining flexibility to take advantage of opportunities which arise to grow our business. One element of our strategy is to make targeted, value-enhancing acquisitions. It is intended that these will, where possible, be funded from cash flow and increased borrowings. The availability of suitable acquisitions at acceptable prices is, however, unpredictable.
In common with other private equity portfolio companies, the Group carries a high level of Net Debt compared to equity.
Total capital is calculated as total equity as shown in the consolidated balance sheet, plus Net Debt. Net Debt is calculated as the total of “other interest bearing loans and borrowings” as shown in the consolidated balance sheet, less cash and cash equivalents.
FINANCIAL RISKSThe Group is exposed to a variety of financial risks. The Group’s overall financial risk management programme focuses on the unpredictability of financial markets and seeks to minimise potential risks for the Group. The Board reviews and agrees policies for managing risks. The most important components of financial risk impacting the Group are exchange rate risk, interest rate risk, credit risk and liquidity risk. The Group uses derivative financial instruments to hedge certain risk exposures.
Busi
ness
ove
rvie
wG
over
nanc
eFi
nanc
ial s
tate
men
ts
I G LO F O O DS H O L D I N G S L I M IT E D — 2 9

1
5
2
3
4
1. Elio Leoni Sceti Chief Executive Officer
Elio was appointed as Chief Executive of Iglo Group in May 2013 and has over 20 years’ experience in the FMCG and media sectors. He served as CEO of EMI Music until 2010 where he led the transformation from a traditional record label into a growing consumer-led music company.
Prior to EMI, Elio had an international career in marketing and held senior leadership roles at Procter & Gamble and Reckitt Benckiser, where he was Global Head of Category Development and Innovation and then Head of Europe.
Elio is also Chairman of Beamly and is an independent member of the board of Anheuser-Bush Inbev.
2. Erhard Schoewel Chairman
Erhard has been Chairman of Iglo Group since 2007 and has over 30 years’ experience within the FMCG sector.
In his last role, Erhard was the Executive Vice President of Europe for Reckitt Benckiser. In this role he had responsibility for the entire European operation. Previous to this he held a range of sales, marketing and general management roles within Benckiser, including roles as General Manager for Germany and Italy.
3. Paul Kenyon Chief Financial Officer
Paul joined Iglo Group in June 2012 from AstraZeneca PLC, where his most recent role was CFO for AstraZeneca’s Global Commercial business. Prior to that, Paul was Senior Vice President, Group Finance for three years and for a period held the role of Chairman of AstraTech, AstraZeneca’s medical technology subsidiary.
Paul’s career includes senior finance roles at Allied Domecq PLC, encompassing sales, marketing and operations and experience at Courtaulds PLC and Mars.
Paul is a fellow of the Chartered Institute of Management Accountants.
4. Tania Howarth Chief Operating Officer
Tania joined us in April 2007 with international experience and a proven track record of strategy, delivery and business turnaround in the FMCG sector. She successfully led the business’ separation from Unilever, as well as creating a completely new technology and business process infrastructure fully operational within 18 months. Tania has been COO since January 2010.
Tania previously worked for some of the most prestigious branded goods companies including the Coca-Cola Company, where she was CIO for Europe, the Middle East and Africa, PepsiCo, Sun Microsystems, ICI and PriceWaterhouseCoopers.
5. Luca Miggiano Chief Marketing Officer
Luca joined Iglo Group in April 2014 from Mondelez International where, as Category Vice President Chocolate UK & I & Nordic from 2010, he played a key role in integrating the Cadbury acquisition into Mondelez and invigorated growth across the chocolate portfolio in all countries.
With over 20 years’ international experience in FMCG Marketing and Sales roles, he has held leadership positions in marketing for iconic brands such as Cadbury, Milka, Jacobs Coffee, Kenco, Coca-Cola and Sheba, and sales in B2C and B2B environments at Kraft Foods, Hiestand (now Aryzta), Coca-Cola and Mars.
Board of Directors
3 0 — I G LO F O O DS H O L D I N G S L I M IT E D A N N UA L R E P O RT 2 0 1 4

6
7
8
9
10
6. Andrew Weston-Webb Managing Director, Birds Eye UK & Ireland
Andrew joined Iglo Group in September 2011, bringing 28 years of experience in consumer goods, working on brands such as Colgate, Mars, Snickers, M&Ms, Uncle Bens and Dolmio.
He has extensive knowledge of the UK market and broad international experience, most recently with five years as Regional President of Mars Chocolate in Europe. During a career spanning marketing and general management, Andy previously worked in UK, Belgium, Spain and France prior to becoming Vice President Food Europe and then Regional President Australasia.
7. Daniel Pagnoni Managing Director, Findus Italy
Daniel joined Iglo Group in March 2013 from SC Johnson where he was Vice President and South Zone Director – Europe.
Previous roles include Managing Director at Tech Data, CEO of Canados International and a number of senior leadership roles at Reckitt Benckiser including SVP, Global Category Officer, General Manager Czech and Slovak Republics and Marketing Director Italy. He also spent nine years at Procter & Gamble.
8. Achim Eichenlaub Managing Director, Iglo Markets
Achim joined us in January 2010 as Managing Director for the Iglo European markets. Achim previously worked for 26 years in Reckitt Benckiser.
For the last 13 years at Reckitt Benckiser, he worked as Senior Vice President Regional Director, managing first Central Europe from 1996 to 2001 followed by East Asia from 2002 to 2009.
9. Cheryl Potter Non-Executive Director
Cheryl joined Permira in 1999 and has been a Partner since 2005. She leads the global consumer team and serves on Permira’s Executive Committee. She has worked on numerous transactions including the separation of Iglo Group from Unilever and the subsequent acquisition of Findus Italy, DinoSol Supermercados, Gala Coral Group, Homebase, Maxeda, Creganna and Dr Martens.
Prior to joining Permira, Cheryl was an Investment Manager at Royal Bank Development Capital and worked for six years at Arthur Andersen. Cheryl has a degree in Biochemistry from the University of Liverpool, England, and is a Chartered Accountant.
10. Tara Alhadeff Non-Executive Director
Tara joined Permira in 2008, becoming a Principal in 2014, and focuses on investments in the consumer sector. She has worked on a number of transactions including the acquisition of Findus Italy by Iglo Group, OdigeO (the merger of eDreams with Go Voyages and Opodo) and Dr Martens.
Prior to joining Permira, Tara worked for three years in Investment Banking at Morgan Stanley, in both London and New York.
Tara has a degree in Economics from Cambridge University, England and an MBA from Harvard Business School, USA.
Busi
ness
ove
rvie
wG
over
nanc
eFi
nanc
ial s
tate
men
ts
I G LO F O O DS H O L D I N G S L I M IT E D — 3 1

Strategic Report
The Directors present their Strategic Report on Iglo Foods Holdings Limited (the “Company”) and its subsidiaries (the “Group”) for the year ended 31 December 2014.
Business reviewThe Company is required by the Companies Act 2006 to set out in this report a fair review of the business of the Group during the financial year ended 31 December 2014 and of the position of the Group at the end of the year and a description of the principal risks and uncertainties facing the Group. The information that fulfils these requirements can be found within the Business Review on pages 1 to 29 of this report. This information is incorporated into this report by reference. Details of expected future developments in the business of the Group are also included in the Business Review.
Key performance indicatorsMeasure Defined as How it relates to our strategy PageSales growth at constant currency Sales growth compared to prior year
with the results of the UK business translated at a constant exchange rate
Measures whether we have driven growth of our top line
1
Gross margin Gross margin as a percentage of reported revenue
Measures our ability to expand Gross margin to reinvest back into growth
1
EBITDA EBITDA before exceptional items compared to prior year with the results of the UK business translated at a constant exchange rate
Measure our ability to grow operating profits
1
Operating cash conversion percentage Cash generated from operations less the purchase of property, plant and equipment1 as a percentage of EBITDA before exceptional items
Measures our ability to convert profits into cash
1
Employee engagement Cultural index level in employee survey
Measures employee engagement in order to attract and retain the best employees
12 to 13
1As defined in the Statement of Cash Flows
More detail on the financial key performance indicators is included on page 1.
Other key performance indicators are included in the Corporate Social Responsibility section.
Principal risks and uncertainties are discussed in the Chief Financial Officer’s Review on pages 27 to 29.
Paul Kenyon Director
10 March 2015
Iglo Foods Holdings Limited Building 5 New Square Bedfont Lakes Feltham Middlesex TW14 8HA United Kingdom Registered number: 5879473
3 2 — I G LO F O O DS H O L D I N G S L I M IT E D A N N UA L R E P O RT 2 0 1 4

Directors’ Report
The Directors present their report and audited financial statements for the year ended 31 December 2014 for the Group.
Research and developmentResearch and development within the Group is a centrally managed function, with its main centres located in the manufacturing sites in the UK, Germany, Italy and the Feltham head office. R&D is a key competitive advantage for Iglo Group and is essential in delivering growth for the new strategy.
Financial instrumentsDetails of the Group’s financial risk objectives and policies, and of the Group’s exposure to exchange rate risk, credit risk, liquidity risk and cash flow risk, are included in note 23 to the financial statements and in the Chief Financial Officer’s Review on pages 22 to 29.
EmployeesEmployment policies are designed to support the Iglo business and the delivery of the Group’s strategy. They do so in a manner that takes account of legislation, for example the Disability and Discrimination Act. Internal codes of conduct such as our Code of Principles formalise compliance within the UK Bribery Act. They ensure that all employees are treated with integrity and that Iglo Group is perceived as an employer of choice.
DividendsThe Directors do not recommend the payment of a dividend (2013: €nil).
Going concernThe financial statements have been prepared on a going concern basis.
The Group’s business activities, together with the factors likely to affect its future development, performance and position, are set out in the Business Review on pages 1 to 29. The financial position of the Group, its cash flows, liquidity position and borrowing facilities, and the Group’s objectives, policies and processes for managing its capital are described in the Chief Financial Officer’s Review on pages 22 to 29 of the Business Review. In addition, note 23 to the financial statements includes the Group’s financial risk management objectives; details of its financial instruments and hedging activities; and its exposures to credit risk and liquidity risk.
The Group has considerable financial resources and an established business with a number of customers and suppliers across different geographic areas. As a consequence, the Directors believe that the Group is well placed to manage its business risks successfully despite the current uncertain economic outlook.
The Directors have made an assessment, and satisfied themselves of the Group’s ability to continue as a going concern based on current cash flow projections and the conditions of the senior debt loans entered into on 17 July 2014.
The Directors have a reasonable expectation that the Group has adequate resources to continue in operational existence for at least 12 months from the date of this report. Thus they continue to adopt the going concern basis of accounting in preparing the consolidated annual financial statements.
DirectorsThe Directors of the Company who served throughout the year and to the date of this report, except as noted, were as follows:
Tara Alhadeff
Achim Eichenlaub
Tania Howarth
Paul Kenyon
Elio Leoni Sceti
Luca Miggiano (appointed 17 June 2014)
Daniel Pagnoni
Cheryl Potter
Erhard Schoewel
Andrew Weston-Webb
Biographical details of the current Directors are shown on pages 30 and 31.
Directors’ indemnitiesAs permitted by the Articles of Association, the Directors have the benefit of an indemnity which is a qualifying third party indemnity provision as defined by Section 234 of the Companies Act 2006. The indemnity was in force throughout the last financial year and is currently in force. The Company also purchased and maintained throughout the financial year Directors’ and Officers’ liability insurance in respect of itself and its Directors.
Independent auditorsThe Directors who held office at the date of approval of this Directors’ Report confirm that, so far as they are each aware, there is no relevant audit information of which the Company’s auditors are unaware; and each Director has taken all the steps that he ought to have taken as a Director to make himself aware of any relevant audit information and to establish that the Company’s auditors are aware of that information.
On behalf of the Board
Paul Kenyon Director
10 March 2015
Iglo Foods Holdings Limited Building 5 New Square Bedfont Lakes Feltham Middlesex TW14 8HA United Kingdom Registered number: 5879473
Busi
ness
ove
rvie
wG
over
nanc
eFi
nanc
ial s
tate
men
ts
I G LO F O O DS H O L D I N G S L I M IT E D — 3 3

The Directors are responsible for preparing the Annual Report and the financial statements in accordance with applicable law and regulations.
Company law requires the Directors to prepare financial statements for each financial year. Under that law the Directors have prepared the Group and Parent Company financial statements in accordance with International Financial Reporting Standards (IFRSs) as adopted by the European Union. Under company law the Directors must not approve the financial statements unless they are satisfied that they give a true and fair view of the state of affairs of the Group and the Company and of the profit or loss of the Company and Group for that period. In preparing these financial statements, the Directors are required to:
• select suitable accounting policies and then apply them consistently;
• make judgements and accounting estimates that are reasonable and prudent;
• state whether applicable IFRSs as adopted by the European Union have been followed, subject to any material departures disclosed and explained in the financial statements;
• prepare the financial statements on the going concern basis unless it is inappropriate to presume that the Company and the Group will continue in business.
The Directors are responsible for keeping adequate accounting records that are sufficient to show and explain the Company’s transactions and disclose with reasonable accuracy at any time the financial position of the Company and the Group and enable them to ensure that the financial statements comply with the Companies Act 2006. They are also responsible for safeguarding the assets of the Company and the Group and hence for taking reasonable steps for the prevention and detection of fraud and other irregularities.
The Directors are responsible for the maintenance and integrity of the Company’s website. Legislation in the United Kingdom governing the preparation and dissemination of financial statements may differ from legislation in other jurisdictions.
Report on the financial statementsOur OpinionIn our opinion:
• Iglo Foods Holdings Limited’s Group financial statements and Company financial statements (the “financial statements”) give a true and fair view of the state of the Group’s and of the Company’s affairs as at 31 December 2014 and of the Group’s loss and the Group’s and the Company’s cash flows for the year then ended;
• the Group financial statements have been properly prepared in accordance with International Financial Reporting Standards (“IFRSs”) as adopted by the European Union;
• the Company financial statements have been properly prepared in accordance with International Financial Reporting Standards (“IFRSs”) as adopted by the European Union and as applied in accordance with the provisions of the Companies Act 2006; and
• the financial statements have been prepared in accordance with the requirements of the Companies Act 2006.
What we have audited Iglo Foods Holdings Limited’s financial statements comprise:
• the Consolidated Statements of financial position as at 31 December 2014;
• the Consolidated Income Statement and the Consolidated Statement of Comprehensive Income for the year then ended;
• the Consolidated Statements of Cash Flows for the year then ended;
• the Consolidated Statements of Changes in Equity for the year then ended; and
• the notes to the financial statements, which include a summary of significant accounting policies and other explanatory information.
The financial reporting framework that has been applied in the preparation of the financial statements is applicable law and IFRSs as adopted by the European Union and, as regards the Company financial statements, as applied in accordance with the provisions of the Companies Act 2006.
In applying the financial reporting framework, the Directors have made a number of subjective judgements, for example in respect of significant accounting estimates. In making such estimates, they have made assumptions and considered future events.
Statement of Directors’ Responsibilities
Independent Auditors’ Report to the Members of Iglo Foods Holdings Limited
3 4 — I G LO F O O DS H O L D I N G S L I M IT E D A N N UA L R E P O RT 2 0 1 4

Opinion on other matter prescribed by the Companies Act 2006In our opinion, the information given in the Strategic Report and the Directors’ Report for the financial year for which the financial statements are prepared is consistent with the financial statements.
Other matters on which we are required to report by exceptionAdequacy of accounting records and information and explanations receivedUnder the Companies Act 2006 we are required to report to you if, in our opinion:
• we have not received all the information and explanations we require for our audit; or
• adequate accounting records have not been kept by the Company, or returns adequate for our audit have not been received from branches not visited by us; or
• the Company financial statements are not in agreement with the accounting records and returns.
We have no exceptions to report arising from this responsibility.
Directors’ remunerationUnder the Companies Act 2006 we are required to report to you if, in our opinion, certain disclosures of Directors’ remuneration specified by law are not made. We have no exceptions to report arising from this responsibility.
Responsibilities for the financial statements and the auditOur responsibilities and those of the DirectorsAs explained more fully in the Directors’ Responsibilities Statement set out on page 34, the Directors are responsible for the preparation of the financial statements and for being satisfied that they give a true and fair view.
Our responsibility is to audit and express an opinion on the financial statements in accordance with applicable law and International Standards on Auditing (UK and Ireland) (“ISAs (UK & Ireland)”). Those standards require us to comply with the Auditing Practices Board’s Ethical Standards for Auditors.
This report, including the opinions, has been prepared for and only for the Company’s members as a body in accordance with Chapter 3 of Part 16 of the Companies Act 2006 and for no other purpose. We do not, in giving these opinions, accept or assume responsibility for any other purpose or to any other person to whom this report is shown or into whose hands it may come save where expressly agreed by our prior consent in writing.
What an audit on financial statements involvesWe conducted our audit in accordance with ISAs (UK & Ireland). An audit involves obtaining evidence about the amounts and disclosures in the financial statements sufficient to give reasonable assurance that the financial statements are free from material misstatement, whether caused by fraud or error. This includes an assessment of:
• whether the accounting policies are appropriate to the Group’s and the Company’s circumstances and have been consistently applied and adequately disclosed;
• the reasonableness of significant accounting estimates made by the Directors; and
• the overall presentation of the financial statements.
We primarily focus our work in these areas by assessing the Directors’ judgements against available evidence, forming our own judgements, and evaluating the disclosures in the financial statements.
We test and examine information, using sampling and other auditing techniques, to the extent we consider necessary to provide a reasonable basis for us to draw conclusions. We obtain audit evidence through testing the effectiveness of controls, substantive procedures or a combination of both.
In addition, we read all the financial and non-financial information in the Annual Report to identify material inconsistencies with the audited financial statements and to identify any information that is apparently materially incorrect based on, or materially inconsistent with, the knowledge acquired by us in the course of performing the audit. If we become aware of any apparent material misstatements or inconsistencies we consider the implications for our report.
Martin Hodgson (Senior Statutory Auditor) for and on behalf of PricewaterhouseCoopers LLP Chartered Accountants and Statutory Auditors London 10 March 2015
Busi
ness
ove
rvie
wG
over
nanc
eFi
nanc
ial s
tate
men
ts
I G LO F O O DS H O L D I N G S L I M IT E D — 3 5

Consolidated Income Statement for the year ended 31 December 2014
Group Note 2014Before
exceptional items
€m
2014 Exceptional
items
€m
2014 Group
Total
€m
2013 Before
exceptional items
€m
2013 Exceptional
items
€m
2013 Group Total
€m
Revenue 1 1,500.9 – 1,500.9 1,505.8 – 1,505.8
Cost of sales (912.6) – (912.6) (939.3) – (939.3)
Gross profit 588.3 – 588.3 566.5 – 566.5
Other operating expenses (312.5) (52.9) (365.4) (294.3) (83.8) (378.1)
Operating profit 4, 5 275.8 (52.9) 222.9 272.2 (83.8) 188.4
Finance income 8 6.8 12.4Finance costs 8 (297.0) (240.0)
Net financing costs (290.2) (227.6)
Loss before tax (67.3) (39.2)
Taxation 9 (41.8) (2.0)
Loss for the year (109.1) (41.2)
Attributable to:
Owners of the Parent Company (109.1) (41.2)
The notes on pages 40 to 71 are an integral part of these consolidated financial statements.
The profit for the Company for the year was €nil (2013: €nil).
Group
Note
2014 €m
2013 €m
Loss for the year (109.1) (41.2)
Other comprehensive income/(loss):
Actuarial (losses)/gains on defined benefit pension plans 19 (52.0) 4.8Taxation credit/(charge) on measurement of defined benefit pension plans 13 15.2 (1.6)Items not reclassified to the Income Statement (36.8) 3.2Gain/(loss) on hedge of net investment in foreign subsidiary 27.6 (7.8)Effective portion of changes in fair value of cash flow hedges 21 13.2 (3.3)Taxation (charge)/credit relating to components of other comprehensive income 13 (3.7) 3.3Items that may be subsequently reclassified to the Income Statement 37.1 (7.8)
Other comprehensive income/(loss) for the year, net of tax 0.3 (4.6)
Total comprehensive loss for the year (108.8) (45.8)
Attributable to:Owners of the Parent Company (108.8) (45.8)
Consolidated Statement of Comprehensive Incomefor the year ended 31 December 2014
3 6 — I G LO F O O DS H O L D I N G S L I M IT E D A N N UA L R E P O RT 2 0 1 4

Consolidated Statement of Changes in Equity for the year ended 31 December 2014
Group Note Share capital
€m
Capital reserve
€m
Translation reserve
€m
Cash flow hedging reserve
€m
Accumulated deficit
€m
Total deficit
€m
Balance at 31 December 2012 0.1 – (38.3) (2.1) (466.2) (506.5)
Loss for the year – – – – (41.2) (41.2)Other comprehensive (loss)/income for the year – – (5.3) (2.5) 3.2 (4.6)Total comprehensive loss for the year – – (5.3) (2.5) (38.0) (45.8)Issuance of new share capital – 0.8 – – – 0.8Share based payment charge – 1.1 – – – 1.1Total transactions with owners, recognised directly in equity
– 1.9 – – – 1.9
Balance at 31 December 2013 0.1 1.9 (43.6) (4.6) (504.2) (550.4)
Loss for the year – – – – (109.1) (109.1)Other comprehensive income/(loss) for the year – – 27.6 9.5 (36.8) 0.3Total comprehensive income/(loss) for the year – – 27.6 9.5 (145.9) (108.8)Share based payment charge – 1.7 – – – 1.7Total transactions with owners, recognised directly in equity
– 1.7 – – – 1.7
Balance at 31 December 2014 21 0.1 3.6 (16.0) 4.9 (650.1) (657.5)
Company Note Share capital
€m
Capital reserve
€m
Translation reserve
€m
Cash flow hedging reserve
€m
Retained earnings
€m
Total equity
€m
Balance at 31 December 2012 0.1 – – – 6.9 7.0
Issuance of new share capital – 0.8 – – – 0.8Balance at 31 December 2013 0.1 0.8 – – 6.9 7.8
Balance at 31 December 2014 21 0.1 0.8 – – 6.9 7.8
Busi
ness
ove
rvie
wG
over
nanc
eFi
nanc
ial s
tate
men
ts
I G LO F O O DS H O L D I N G S L I M IT E D — 3 7

Consolidated Statement of Financial Positionfor the year ended 31 December 2014
Note Group2014
€m
Company2014
€m
Group2013
€m
Company2013
€m
Non‒current assets
Intangible assets 11 2,216.4 – 2,174.0 –
Property, plant and equipment 10 254.9 – 252.1 –
Deferred tax assets 13 73.3 – 65.1 –
Investments 12 – 7.8 – 7.8
Total non‒current assets 2,544.6 7.8 2,491.2 7.8
Current assets
Inventories 14 229.1 – 221.8 –
Trade and other receivables 15 49.4 – 57.6 –
Tax receivable – – 1.5 –
Deferred borrowing costs 17 2.1 – – –
Derivative financial instruments 24 11.2 – 0.6 –
Cash and cash equivalents 16 707.0 – 688.5 0.3
Total current assets 998.8 – 970.0 0.3
Total assets 3,543.4 7.8 3,461.2 8.1
Current liabilities
Bank overdrafts 16 487.8 – 371.4 –
Trade and other payables 18 313.9 – 304.5 0.3
Derivative financial instruments 24 1.8 – 7.3 –
Tax payable 8.8 – – –
Loans and borrowings 17 – – 117.2 –
Provisions 20 55.2 – 26.6 –
Total current liabilities 867.5 – 827.0 0.3
Non‒current liabilities
Loans and borrowings 17 2,903.1 – 2,822.2 –
Employee benefits 19 124.2 – 70.9 –
Deferred tax liabilities 13 306.1 – 291.5 –
Total non‒current liabilities 3,333.4 – 3,184.6 –
Total liabilities 4,200.9 – 4,011.6 0.3
Net (liabilities)/assets (657.5) 7.8 (550.4) 7.8(Deficit)/equity attributable to equity holders
Share capital 21 0.1 0.1 0.1 0.1
Capital reserve 21 3.6 0.8 1.9 0.8
Translation reserve (16.0) – (43.6) –
Cash flow hedging reserve 4.9 – (4.6) –
(Accumulated deficit)/retained earnings (650.1) 6.9 (504.2) 6.9
Total (deficit)/equity (657.5) 7.8 (550.4) 7.8
The notes on pages 40 to 71 are an integral part of these consolidated financial statements.These financial statements on pages 32 to 71 were approved by the Board of Directors on 10 March 2015 and were signed on its behalf by:
Paul Kenyon Director
3 8 — I G LO F O O DS H O L D I N G S L I M IT E D A N N UA L R E P O RT 2 0 1 4

Consolidated Statement of Cash Flowsfor the year ended 31 December 2014
Note Group2014
€m
Company2014 €m
Group2013
€m
Company2013
€m
Cash generated from/(used in) operations before tax and exceptional items 22 301.7 (0.3) 318.7 0.3Cash flows relating to exceptional items (17.2) – (51.3) –Tax paid (17.1) – (30.1) –Net cash flow from operating activities 267.4 (0.3) 237.3 0.3
Cash flows from investing activitiesPurchase of property, plant and equipment 10 (24.3) – (26.5) –Purchase of intangibles 11 (2.0) – (1.8) –Net cash used in investing activities (26.3) – (28.3) –
Cash flows from financing activitiesProceeds from new loans and notes 1,624.1 – 0.4 –Repayment of loan principal (1,861.0) – – –Payment of financing fees (15.9) – (7.0) –Payment for interest rate cap premiums (3.0) – (1.5) –Interest paid (95.2) – (105.9) –Interest received 6.8 – 7.3 –Net cash used in financing activities (344.2) – (106.7) –
Net (decrease)/increase in cash and cash equivalents (103.1) (0.3) 102.3 0.3Cash and cash equivalents at beginning of year 16 317.1 0.3 215.6 –Exchange rate gains/(losses) on cash and cash equivalents 5.2 – (0.8) –Cash and cash equivalents at end of year 16 219.2 – 317.1 0.3
The notes on pages 40 to 71 are an integral part of these consolidated financial statements.
Busi
ness
ove
rvie
wG
over
nanc
eFi
nanc
ial s
tate
men
ts
I G LO F O O DS H O L D I N G S L I M IT E D — 3 9

Notes
1) Accounting policiesIglo Foods Holdings Limited (the “Company”) is a company domiciled in the United Kingdom and incorporated in the United Kingdom under the Companies Act 2006 as applicable to companies using IFRS. Both the Company financial statements and the Group financial statements have been prepared in accordance with International Financial Reporting Standards as adopted by the EU (“Adopted IFRSs”) and IFRS Interpretations as the Companies Act 2006 is applicable to companies reporting under IFRS.
By publishing the Company financial statements here together with the Group financial statements, the Company is taking advantage of the exemption in s408 of the Companies Act 2006 not to present its individual Income Statement, Statement of Comprehensive Income and related notes that form a part of these financial statements.
The Directors have made an assessment, and have satisfied themselves of the Group’s ability to continue as a going concern based on current cash flow projections and the conditions of the senior debt loans entered into on 17 July 2014. Thus they continue to adopt the going concern basis of accounting in preparing the Group financial statements.
The accounting policies set out below have, unless otherwise stated, been applied consistently.
The following standard has been adopted by the Group for the first time for the financial year beginning on 1 January 2014:
• Amendments to IAS 32 on Financial instrument asset and liability offsetting
The application of the standard adopted does not have a material impact on the Group.
Judgements made by the Directors in the application of these accounting policies that have a significant effect on the financial statements and key sources of estimation uncertainty which have a significant risk of causing a material adjustment in the next year are discussed in note 2.
a) Measurement convention The financial statements are prepared on the historical cost basis with the exception of derivative financial instruments, which are stated at fair value.
b) Basis of consolidation The Group financial statements consolidate the Company and its subsidiaries (together referred to as the “Group”). Intercompany balances and profits
or losses on intra-group transactions are eliminated. Accounting policies are applied consistently across the Group.
The Company financial statements present information about the Company as a separate legal entity.
Subsidiaries are all entities (including structured entities) over which the Group has control. The Group controls an entity when the Group is exposed to, or has rights to, variable returns from its involvement with the entity and has the ability to affect those returns through its power over the entity. Subsidiaries are fully consolidated from the date on which control is transferred to the Group. They are deconsolidated from the date that control ceases.
The Group uses the acquisition method to account for business combinations. The consideration transferred for the acquisition of a subsidiary is the fair value of the assets transferred, the liabilities incurred and the equity interest issued by the Group. The consideration transferred includes the fair value of any asset or liability resulting from a contingent consideration arrangement. Identifiable assets acquired and liabilities and contingent liabilities assumed in a business combination are measured initially at their fair values at the acquisition date. Acquisition related costs are expensed as incurred.
Investments in subsidiaries are accounted for at cost less impairment. Cost is adjusted to reflect changes in consideration arising from amendments to any contingent consideration arrangements.
c) Foreign currencyThese consolidated financial statements are presented in Euros, which is the Company’s functional currency and the presentation currency of the Group. All financial information has been rounded to the nearest €0.1 million.
i) Foreign currency transactions
Transactions in foreign currencies are translated at the foreign exchange rate ruling at the date of the transaction or where forward foreign exchange contracts have been taken out at contractual rates. Monetary assets and liabilities denominated in foreign currencies are translated at the foreign exchange rate ruling at the financial year end. Non-monetary assets and liabilities that are measured in terms of historical cost in a foreign currency are translated using the exchange rate at the date of the transaction. Non-monetary assets and liabilities denominated in foreign currencies that are stated at fair value are translated at foreign exchange rates ruling at the dates the fair value was determined.
ii) Assets and liabilities of foreign operations
For the purposes of presenting consolidated financial statements, the assets and liabilities of foreign operations, including goodwill and fair value adjustments arising on consolidation, are translated at foreign exchange rates ruling at the financial year end date of £1:€1.28 (2013: £1:€1.20). The revenues and expenses of foreign operations are translated at an average rate for the period where this rate approximates to the foreign exchange rates ruling at the dates of the transactions.
4 0 — I G LO F O O DS H O L D I N G S L I M IT E D A N N UA L R E P O RT 2 0 1 4
iii) Net investment in foreign operations
Exchange differences arising from the translation of foreign operations and of related qualifying hedges are taken directly to the translation reserve within equity. They are released into the Income Statement upon disposal of the related foreign operation.
d) Property, plant and equipment
i) Owned assets
Property, plant and equipment are stated at cost less accumulated depreciation and impairment losses. Cost includes the original purchase price of the asset and the costs attributable to bringing the asset to its working condition for its intended use.
Where parts of an item of property, plant and equipment have different useful lives, they are accounted for as separate items of property, plant and equipment.
ii) Leased assets
Leases in which the Group assumes substantially all the risks and rewards of ownership of the leased asset are classified as finance leases. Where land and buildings are held under finance leases the accounting treatment of the land is considered separately from that of the buildings. Leased assets acquired by way of finance lease are stated at an amount equal to the lower of their fair value and the present value of the minimum lease payments at inception of the lease, less accumulated depreciation and impairment losses.
All other leases are classified as operating leases.
iii) Depreciation
Depreciation is charged to the Income Statement on a straight line basis over the shorter of the lease term and the estimated useful lives of each part of an item of property, plant and equipment once the item is brought into use. Land is not depreciated. The estimated useful lives are as follows:
• Buildings 40 years
• Plant and equipment 5 to 14 years
• Computer equipment 3 to 5 years
The asset’s residual values and useful lives are reviewed on a frequent basis.
e) Goodwill
Goodwill represents amounts arising on acquisition of subsidiaries and associates. Goodwill is the difference between the cost of the acquisition and the fair value of the net identifiable assets acquired.
Goodwill is stated at cost less any accumulated impairment losses. Gains and losses on the disposal of an entity include the carrying amount of goodwill relating to the entity sold.
Goodwill is allocated to cash-generating units and is not amortised but is tested annually for impairment.
f) Other intangible assets
Intangible assets acquired separately are recorded at cost and those acquired as part of a business combination are recorded at fair value as at the date of acquisition.
i) Computer software
Capitalised software costs include the cost of acquired computer software licences and costs that are directly associated with the design, construction and testing of such software where this relates to a major business system.
Costs associated with identifying, sourcing, evaluating or maintaining computer software are recognised as an expense as incurred.
The assets are stated at cost less accumulated amortisation and impairment losses.
Software costs are amortised by equal annual instalments over their estimated useful economic life of five to seven years once the software is capable of being brought into use.
ii) Brands
Based on the market position of the brands, the significant levels of investment in advertising and promoting the brands, and the fact that they have been established for over 50 years, the Directors consider that the Birds Eye, Iglo and Findus brands should be considered to have indefinite lives. Therefore these brands are not amortised but instead held at historical cost less provision for any impairment.
Busi
ness
ove
rvie
wG
over
nanc
eFi
nanc
ial s
tate
men
ts
I G LO F O O DS H O L D I N G S L I M IT E D — 4 1
The Directors considered that one of the brands acquired as part of the acquisitions of Findus Italy, 4Salti in Padella, does not have an indefinite life. This brand is being amortised over ten years.
g) Impairment of non-current assets
The carrying amounts of the Group’s assets are reviewed annually to determine whether there is any indication of impairment. If any such indication exists, the asset’s recoverable amount is estimated. Impairment losses are recognised in the Income Statement in the period in which they arise.
For goodwill and assets that have an indefinite useful life, an impairment review is performed at least annually.
Assets that are subject to amortisation are reviewed for impairment whenever events or changes in circumstances indicate that the net carrying amount may not be recoverable.
An impairment loss is recognised whenever the carrying amount of an asset or its cash-generating unit exceeds its recoverable amount.
i) Calculation of recoverable amount
Recoverable amount is the greater of fair value less costs to sell and value in use. In assessing value in use, the estimated future cash flows of the business are discounted to their present value using a discount rate that reflects current market assessments of the time value of money and the risks specific to the asset. For an asset that does not generate largely independent cash inflows, the recoverable amount is determined for the cash-generating unit to which the asset belongs.
ii) Allocation of impairment losses
Impairment losses recognised in respect of cash-generating units are allocated first to reduce the carrying amount of any goodwill allocated to cash-generating units then any related indefinite life intangible assets, and then to reduce the carrying amount of the other assets in the unit on a pro rata basis. A cash-generating unit is the smallest identifiable group of assets that generates cash inflows that are largely independent of the cash inflows from other assets or groups of assets.
iii) Reversals of impairment
An impairment loss in respect of goodwill is not reversed.
In respect of other assets, an impairment loss is reversed when there is an indication that the impairment loss may no longer exist and there has been a change in the estimates used to determine the recoverable amount. An impairment loss is reversed only to the extent that the asset’s carrying amount does not exceed the carrying amount that would have been determined, net of depreciation or amortisation, if no impairment loss had been recognised.
h) Inventories
Inventories are stated at the lower of cost and net realisable value.
Cost is based on the weighted average principle and includes expenditure incurred in acquiring the inventories and bringing them to their existing location and condition. In the case of manufactured inventories and work in progress, cost includes an appropriate share of overheads based on normal operating capacity.
Provision is made for slow moving, obsolete and defective inventories.
i) Employee benefits
i) Defined contribution plans
Obligations for contributions to defined contribution pension plans are recognised as an expense in the Income Statement as incurred. Prepaid contributions are recognised as an asset to the extent that a cash refund or reduction in the future payments is available.
ii) Defined benefit plans
The Group’s net obligation in respect of defined benefit pension plans and other post-employment benefits is calculated separately for each plan by estimating the amount of future benefit that employees have earned in return for their service in the current and prior periods. That net obligation is discounted to determine its present value.
The calculation is performed by a qualified actuary using the projected unit credit method.
All actuarial gains and losses are recognised in the period they occur through the statement of recognised income and expense.
Past service cost is recognised immediately to the extent that the benefits are already vested, and otherwise amortised on a straight line basis over the average period until the benefits become vested.
4 2 — I G LO F O O DS H O L D I N G S L I M IT E D A N N UA L R E P O RT 2 0 1 4

iii) Share based payment schemes
Schemes fall within the provisions of IFRS 2 “Share Based Payments” and represent equity settled share based payments.
A charge is taken to the Income Statement for the difference between the fair value of the shares at grant date and the amount subscribed, spread over the period until the employees have unconditional access to the benefits of share ownership.
Since the interests granted are in the ultimate controlling party, BEIG LP Inc., and the Group has no obligation to settle the share-based payment transaction, the grant of equity instruments to the employees of the Group is treated as a capital contribution by BEIG LP Inc.
At the end of each reporting period, the Group revises its estimates of the number of interests that are expected to vest based on the non-market vesting conditions. It recognises the impact of the revision to original estimates, if any, in the Income Statement, with a corresponding adjustment to equity.
iv) Other management incentive schemes
If schemes fall outside the scope of IFRS 2, since they are not related to the price or value of equity instruments, but do fall within the scope of IAS 19 “Employee Benefits”, an annual charge is taken over the service period based on an estimate of the amount of future benefit employees will earn in return for their service.
j) Provisions
Provisions are recognised when the Group has a legal or constructive present obligation as a result of a past event, and it is probable that the Group will be required to settle that obligation. Provisions are measured at the Directors’ best estimate of the expenditure required to settle the obligation at the financial year end date, and are discounted to present value where the effect is material.
k) Financial instruments
Financial assets and liabilities are recognised in the Group’s Statement of Financial Position when the Group becomes a party to the contractual provisions of the instrument.
i) Trade receivables
Trade receivables are measured at initial recognition at fair value, and are subsequently measured at amortised cost using the effective interest method, less any impairment. Since trade receivables are due within one year, this equates to initial carrying value less any impairment.
Appropriate allowances for estimated irrecoverable amounts are recognised in the Income Statement when there is objective evidence that the asset is impaired.
Trade receivables are presented net of customer rebate balances.
ii) Cash and cash equivalents
Cash and cash equivalents comprise cash balances and call deposits. Bank overdrafts that are repayable on demand and form an integral part of the Group’s cash management are included as a component of cash and cash equivalents for the purpose of the Statement of Cash Flows only.
iii) Loans and borrowings
a. Valuation
Interest bearing borrowings are recognised initially at fair value less attributable transaction costs.
Subsequent to initial recognition, interest bearing loans and borrowings are stated at amortised cost with any difference between cost and redemption value being recognised in the Income Statement over the expected period of the borrowings on a straight line basis.
b. Capitalisation of borrowing costs
Costs incurred in securing borrowings are carried at cost and amortised over the expected life of the loan.
iv) Trade payables
Trade payables are measured at initial recognition at fair value, and are subsequently measured at amortised cost using the effective interest method. Since trade payables are largely due within one year, this equates to initial carrying value.
v) Derivative financial instruments and hedge accounting
Derivative financial instruments are recognised at fair value. When a derivative financial instrument is not designated in a hedge relationship that qualifies for hedge accounting, all changes in its fair value are recognised immediately in the Income Statement. However, where derivatives qualify for hedge accounting, recognition of any resultant gain or loss depends on the nature of the item being hedged.
Busi
ness
ove
rvie
wG
over
nanc
eFi
nanc
ial s
tate
men
ts
I G LO F O O DS H O L D I N G S L I M IT E D — 4 3

The fair value of interest rate caps represents the time value plus the intrinsic value at the financial year end date.
The fair value of forward exchange contracts is their quoted market price at the financial year end date, being the present value of the quoted forward price.
a. Cash flow hedges
Where a derivative financial instrument is designated as a hedge of the variability in cash flows of a recognised asset or liability, or a highly probable forecast transaction, the effective part of any gain or loss on the derivative financial instrument is recognised directly in the cash flow hedging reserve. Any ineffective portion of the hedge is recognised immediately in the Income Statement.
When a hedging instrument expires or is sold, terminated or exercised, or the entity revokes designation of the hedge relationship but the hedged forecast transaction is still expected to occur, the cumulative gain or loss at that point remains in equity and is recognised when the transaction occurs. If the hedged transaction is no longer expected to take place, the cumulative unrealised gain or loss recognised in equity is recognised in the Income Statement immediately.
b. Net investment hedges
Foreign currency differences arising on the retranslation of a financial liability designated as a hedge of a net investment in a foreign operation are recognised in Other Comprehensive Income to the extent that the hedge is effective, and are presented in the translation reserve within equity. To the extent that the hedge is ineffective, such differences are recognised in the Income Statement. When the hedged net investment is disposed of, the relevant amount in the translation reserve is transferred to the Income Statement as part of the gain or loss on disposal.
l) Revenue
Revenue comprises sales of goods after deduction of discounts and sales taxes. It does not include sales between Group companies. Discounts given by the Group include rebates, price reductions and incentives given to customers, promotional couponing and trade communication costs. At each financial year end date any discount incurred but not yet invoiced is estimated and accrued.
Revenue is recognised when the risks and rewards of the underlying products have been transferred to the customer. The timing of the transfer of risks and rewards varies depending on the individual terms of the sales agreement, usually being on receipt of goods by the customer.
m) Interest income
Interest income is recognised in the Income Statement in the period in which it is earned.
n) Expenses
i) Operating lease payments
Payments made under operating leases are recognised in the Income Statement on a straight line basis over the term of the lease. Lease incentives received are recognised on a straight line basis in the Income Statement as an integral part of the total lease expense.
ii) Borrowing costs
Unless capitalised as part of the cost of borrowing (see note 1 (k)(iii)), borrowing costs are recognised in the Income Statement in the period in which they are incurred.
iii) Exceptional items
The separate reporting of non-recurring exceptional items, which are presented as exceptional within the relevant Income Statement category, helps provide an indication of the Group’s underlying business performance. Exceptional items comprise restructuring costs, impairments or reversal of impairments of intangible assets, operational restructuring, integration and acquisition costs relating to new acquisitions, investigation of strategic opportunities, costs relating to certain management incentive plans and other significant items that are non recurring in nature.
iv) Research and development
Expenditure on research activities is recognised in the Income Statement as an expense as incurred.
o) Taxation
Tax on the profit or loss for the year comprises current and deferred tax. Tax is recognised in the Income Statement except to the extent that it relates to items recognised directly in equity, in which case it is recognised in equity.
Current tax is the expected tax payable on the taxable income for the year, using tax rates enacted or substantively enacted at the financial year end date, and any adjustment to tax payable in respect of previous years.
4 4 — I G LO F O O DS H O L D I N G S L I M IT E D A N N UA L R E P O RT 2 0 1 4

Deferred tax is provided on temporary differences between the carrying amounts of assets and liabilities recognised for financial reporting purposes and the amounts used for taxation purposes on an undiscounted basis. The following temporary differences are not provided for: the initial recognition of goodwill; the initial recognition of assets or liabilities that affect neither accounting nor taxable profit other than in a business combination; and differences relating to investments in subsidiaries to the extent that they will probably not reverse in the foreseeable future. The amount of deferred tax provided is based on the expected manner of realisation or settlement of the carrying amount of assets and liabilities, using tax rates enacted or substantively enacted at the financial year end date.
A deferred tax asset is recognised only to the extent that it is probable that future taxable profits will be available against which the asset can be utilised.
p) Segment reporting
The Chief Operating Decision Maker (‘CODM’) has been determined to be the Executive Committee as they are primarily responsible for the allocation of resources to the segments and the assessment of performance of the segments.
The Group’s operations are primarily organised into brands (Birds Eye – the UK & Ireland, Iglo – Continental Europe; Findus – Italy) with each brand headed by a managing director. Other business units, comprising factories, private label and corporate overheads, make up the rest of the Group’s operations included in the information presented to the CODM. The primary organisation and management of business activities into brands has been used to identify and determine the Group’s operating segments as reported to the CODM.
The CODM uses revenue and earnings before interest, taxation, depreciation and amortisation (“EBITDA”) as the key measure of the segments’ results. Revenue is presented to the CODM using budgeted currency exchange rates as shown in note 3. EBITDA is presented to the CODM at actual exchange rates.
The segmental reporting is shown in note 3.
q) New IFRS not yet adopted
At the date of authorisation of these financial statements, the following Standards and Interpretations which have not been applied in these financial statements were in issue but not yet effective:
• IFRS 9, ‘Financial instruments’
• IFRS 15, ‘Revenue from contracts with customers’
The Directors anticipate that the adoption in future periods of these Standards and Interpretations where they are relevant to the Group will have no material impact on the financial statements of the Group.
2) Accounting estimatesThe key sources of estimation uncertainty at the financial year end date are discussed below:
a) Discounts
Discounts given by the Group include rebates, price reductions and incentives given to customers, promotional couponing and trade communication costs.
At each financial year end date any discount incurred but not yet invoiced is estimated, based on historical trends and rebate contracts with customers, and accrued as ‘trade terms’.
b) Carrying value of goodwill and brands
Determining whether goodwill and brands are impaired requires an estimation of the value in use of the cash-generating units to which goodwill and brands have been allocated. The value in use calculation requires the entity to estimate the future cash flows expected to arise from each cash-generating unit and a suitable discount rate in order to calculate present value. Details of impairment reviews are provided in note 11.
c) Employee benefit obligation
A significant number of estimates are required to calculate the fair value of the retirement benefit obligation at year end.
Note 19 contain details of these assumptions, and the calculation is performed by qualified actuaries.
d) Income tax
Where tax exposures can be quantified, an accrual is made based on best estimates and management’s judgements. Given the inherent uncertainties in assessing the outcomes of these exposures (which can sometimes be binary in nature), Iglo Group could in future periods experience adjustments to these accruals.
Busi
ness
ove
rvie
wG
over
nanc
eFi
nanc
ial s
tate
men
ts
I G LO F O O DS H O L D I N G S L I M IT E D — 4 5

e) Fair value of derivative financial instruments
Note 24(c) includes details of the fair value of the derivative instruments that the Group holds at 31 December 2014 and 2013.
Management has estimated the fair value of these instruments by using valuations based on discounted cash flow calculations.
f) Share based payments
At the end of each reporting period, the Group revises its estimates of the number of interests that are expected to vest based on the non-market vesting conditions.
Note 6 contains details of these assumptions and of the valuation model used.
3) Segment reporting
Segment external revenue2014
€m2013
€m
Birds Eye 515.7 515.0Iglo 521.9 537.0Findus Italy 428.2 419.6Other 35.1 34.2Total external revenue 1,500.9 1,505.8
Birds Eye (at budgeted currency)* 484.5 507.6
* Birds Eye’s results have been translated using a management budget rate of €1.16 to GBP £1.
The CODM is not provided with information about inter-segment revenues.
Segment EBITDA
Note
2014
€m2013
€m
Birds Eye 126.4 131.6Iglo 108.7 98.6Findus Italy 101.4 95.4Other (30.3) (25.5)Total segment EBITDA (before exceptional items) 306.2 300.1
Exceptional items 5 (52.9) (83.8)Depreciation 10 (24.8) (23.4)Amortisation 11 (5.6) (4.5)Operating profit 222.9 188.4
No information on segment assets or liabilities is presented to the CODM.
Product informationManagement considers the products it sells belong to one category, being frozen foods.
Geographical information
External revenue by geography
2014
€m2013
€m
United Kingdom 492.5 496.7Italy 428.3 419.6Germany 298.0 313.1Rest of Europe 282.1 276.4Total external revenue by geography 1,500.9 1,505.8
4 6 — I G LO F O O DS H O L D I N G S L I M IT E D A N N UA L R E P O RT 2 0 1 4

Non-current assets by geography
2014
€m2013
€m
United Kingdom 780.6 730.0Italy 854.3 858.1Germany 464.6 465.2Rest of Europe 371.8 372.8Total non-current assets by geography 2,471.3 2,426.1
Non-current assets exclude deferred tax assets.
4) Operating profitOperating profit is stated after charging:
Operating profit
Note 2014
€m2013
€m
Staff costs 6 180.2 175.5Depreciation of property, plant and equipment 10 24.8 23.3Impairment of property, plant and equipment 10 1.5 –Impairment of goodwill 11 – 27.4Amortisation of software and brands 11 5.6 4.5Operating lease charges 7.5 7.7Exchange losses 6.6 0.5Research & development 15.7 13.2
Auditors’ remuneration
2014
€m 2013
€m
Fees payable to the company’s auditor and its associates for the audit of the parent company and consolidated financial statements 0.4 0.4 Fees payable to the company’s auditor and its associates for other services: – The audit of the company’s subsidiaries 0.5 0.5 – Other services relating to taxation 1.6 0.5 – Services relating to corporate finance 0.1 0.1 – All other services 0.3 – 2.9 1.5
Busi
ness
ove
rvie
wG
over
nanc
eFi
nanc
ial s
tate
men
ts
I G LO F O O DS H O L D I N G S L I M IT E D — 4 7

5) Exceptional itemsExceptional items are made up as follows:
Group 2014 €m
2013 €m
Investigation of strategic opportunities and other items 17.4 11.2Costs related to management incentive plans 16.7 13.8Restructuring costs 11.6 10.5Cisterna fire net costs 5.5 –Costs related to acquisitions 1.7 20.9Impairment of goodwill – 27.4Total exceptional items 52.9 83.8
The Group has incurred charges of €17.4 million in relation to a strategic review of the Group’s operations and other items (2013: €11.2 million). This includes costs incurred as a result of the decision to cease marketing its products in Romania, Slovakia and Turkey on 27 November 2014, amounts in relation to tax matters from previous accounting periods and costs related to the implementation of the Better Meals Together strategy.
The Group incurred charges of €16.7 million related to management incentive schemes (2013: €13.8 million). The majority of these costs have been accrued during the year, but are not due for payment until the associated performance conditions are met. The timing of the triggering events for payment is not defined.
The Group has incurred restructuring costs of €11.6 million (2013: €10.5 million) in the year, principally in our German factories. Restructuring has been implemented as part of a strategy to create further operational efficiencies.
€5.5 million has been charged in relation to a fire in August 2014 in the Group’s Italian production facility which produces Findus branded stock for sale in Italy. The charge includes the cost of stock damaged by the fire, the impairment of property as well as ongoing incremental costs incurred as a result of the disruption to operations. The Group has insurance policies in place covering the stock, property and loss of earnings for which claims are currently in process. The proceeds of these claims cannot be recognised until the recoverable amount is judged to be virtually certain. As at 31 December 2014, losses of €8.7 million have been incurred, which has been offset by receipts from the insurers of €3.2 million.
€1.7 million has been incurred in the year to date (2013: €20.9 million), principally due to a further payment of registration tax related to the acquisition of Findus Italy. The Group is appealing the rulings and has elected to pay the assessed taxes in order to avoid incurring penalties and interest.
In 2013, €27.4 million was charged as a result of the decision to fully provide for the value of goodwill in the Belgium business.
The tax impact on the exceptional items amounts to €7.8 million (2013: €10.4 million).
6) Staff numbers and costsThe average number of persons employed by the Group (including Directors) during the year, analysed by category, was as follows:
Number of employees
Group 2014 2013
Production 1,645 1,712 Administration, distribution & sales 1,101 1,097 Total number of employees 2,746 2,809
The aggregate payroll costs of these persons were as follows:
Group 2014€m
2013€m
Wages and salaries 148.3 143.2Social security costs 24.9 25.4Other pension costs 7.0 6.9Total payroll costs 180.2 175.5
4 8 — I G LO F O O DS H O L D I N G S L I M IT E D A N N UA L R E P O RT 2 0 1 4
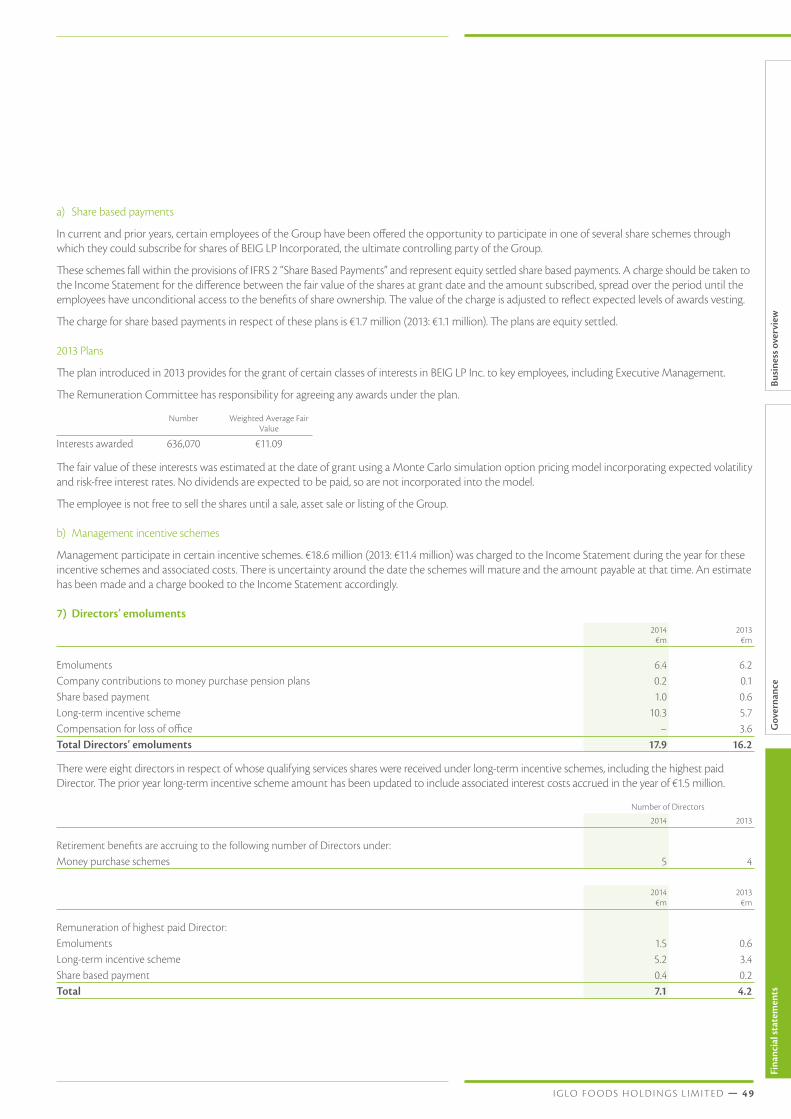
a) Share based payments
In current and prior years, certain employees of the Group have been offered the opportunity to participate in one of several share schemes through which they could subscribe for shares of BEIG LP Incorporated, the ultimate controlling party of the Group.
These schemes fall within the provisions of IFRS 2 “Share Based Payments” and represent equity settled share based payments. A charge should be taken to the Income Statement for the difference between the fair value of the shares at grant date and the amount subscribed, spread over the period until the employees have unconditional access to the benefits of share ownership. The value of the charge is adjusted to reflect expected levels of awards vesting.
The charge for share based payments in respect of these plans is €1.7 million (2013: €1.1 million). The plans are equity settled.
2013 Plans
The plan introduced in 2013 provides for the grant of certain classes of interests in BEIG LP Inc. to key employees, including Executive Management.
The Remuneration Committee has responsibility for agreeing any awards under the plan.
Number Weighted Average Fair Value
Interests awarded 636,070 €11.09
The fair value of these interests was estimated at the date of grant using a Monte Carlo simulation option pricing model incorporating expected volatility and risk-free interest rates. No dividends are expected to be paid, so are not incorporated into the model.
The employee is not free to sell the shares until a sale, asset sale or listing of the Group.
b) Management incentive schemes
Management participate in certain incentive schemes. €18.6 million (2013: €11.4 million) was charged to the Income Statement during the year for these incentive schemes and associated costs. There is uncertainty around the date the schemes will mature and the amount payable at that time. An estimate has been made and a charge booked to the Income Statement accordingly.
7) Directors’ emoluments2014
€m2013
€m
Emoluments 6.4 6.2Company contributions to money purchase pension plans 0.2 0.1Share based payment 1.0 0.6Long-term incentive scheme 10.3 5.7Compensation for loss of office – 3.6Total Directors’ emoluments 17.9 16.2
There were eight directors in respect of whose qualifying services shares were received under long-term incentive schemes, including the highest paid Director. The prior year long-term incentive scheme amount has been updated to include associated interest costs accrued in the year of €1.5 million.
Number of Directors
2014 2013
Retirement benefits are accruing to the following number of Directors under:Money purchase schemes 5 4
2014
€m2013
€m
Remuneration of highest paid Director:Emoluments 1.5 0.6Long-term incentive scheme 5.2 3.4Share based payment 0.4 0.2Total 7.1 4.2
Busi
ness
ove
rvie
wG
over
nanc
eFi
nanc
ial s
tate
men
ts
I G LO F O O DS H O L D I N G S L I M IT E D — 4 9

8) Finance income and costsGroup Note 2014
€m2013
€m
Interest income 6.8 7.4Net foreign exchange gains on retranslation of financial assets and liabilities – 5.0Finance income 6.8 12.4
Capitalised interest (133.4) (119.1)Cash pay interest expense (99.9) (106.6)Interest on defined benefit pension plan obligation 19 (2.7) (2.5)Amortisation of borrowing costs (7.5) (11.8)Net foreign exchange losses on retranslation of financial assets and liabilities (15.6) –Financing costs incurred in amendment of terms of debt* (37.9) –Finance costs (297.0) (240.0)
Net finance costs (290.2) (227.6)
* A one-off charge of €37.9 million was incurred as a consequence of the refinancing in July 2014. Of this, deferred borrowing costs of €34.5 million relating to the previous senior debt were written off.
9) TaxationGroup Note 2014
€m2013
€m
Current tax expenseCurrent tax on profits for the year 29.6 16.2Adjustments in respect of prior years (2.1) 0.4
27.5 16.6Deferred tax expenseOrigination and reversal of temporary differences 12.8 –Impact of change in tax rates 1.5 (14.6)
13 14.3 (14.6)
Total tax expense 41.8 2.0
Reconciliation of effective tax rate:
2014€m
2013€m
Loss before tax (67.3) (39.2)
Tax credit at the standard UK corporation tax rate 21.5% (2013: 23.3%) (14.5) (9.1)Difference in tax rates 7.9 4.7Non tax deductible interest 25.4 14.4Other income and expenses not taxable or deductible 5.3 3.9Unrecognised tax assets 3.0 3.0Provisions for uncertainties 1.8 (1.1)Impact of change in deferred tax rates 1.6 (14.6)Prior year adjustment 11.3 0.8Total tax expense 41.8 2.0
The weighted effective tax rate was 62.1% (2013: 5.1%). The increase is principally caused by changes in the estimates of provisions in respect of matters under discussion with tax authorities and the impact of the reduction in the UK tax rate in 2013.
The Group operates in many different jurisdictions and, in some of these, certain matters are under discussion with local tax authorities. These discussions are often complex and can take many years to resolve. Accruals for tax contingencies require management to make estimates and judgements with respect to the ultimate outcome of a tax audit, and actual results could vary from these estimates. Where tax exposures can be quantified, a provision is made based on best estimates and management’s judgements. Given the inherent uncertainties in assessing the outcomes of these exposures (which can sometimes be binary in nature), we could in future years experience adjustments to this provision.
5 0 — I G LO F O O DS H O L D I N G S L I M IT E D A N N UA L R E P O RT 2 0 1 4

Management believes that the Group’s position on all open matters is robust and that the Group is appropriately provided.
Through the enactment of the Finance Act 2013 the standard rate of corporation tax in the UK changed from 23% to 21% with effect from 1 April 2014, and by a further 1% to 20% from 1 April 2015. As the reductions to 21% and 20% were enacted on 17 July 2013 these rates are reflected in this financial information.
The tax (charge)/credit relating to components of other comprehensive income is as follows:
2014 Note Before tax€m
Tax (charge)/credit€m
After tax€m
Remeasurements of post employment benefit liabilities 52.0 (15.2) 36.8Net investment hedge (27.6) – (27.6)Cash flow hedges (13.2) 3.7 (9.5)Other comprehensive income/(loss) 11.2 (11.5) (0.3)Current tax –Deferred tax 13 (11.5)
(11.5)
2013 Note Before tax€m
Tax (charge)/credit€m
After tax€m
Remeasurements of post employment benefit liabilities (4.8) 1.6 (3.2)Net investment hedge 7.8 (2.5) 5.3Cash flow hedges 3.3 (0.8) 2.5Other comprehensive (loss)/income 6.3 (1.7) 4.6Current tax –Deferred tax 13 (1.7)
(1.7)
Busi
ness
ove
rvie
wG
over
nanc
eFi
nanc
ial s
tate
men
ts
I G LO F O O DS H O L D I N G S L I M IT E D — 5 1
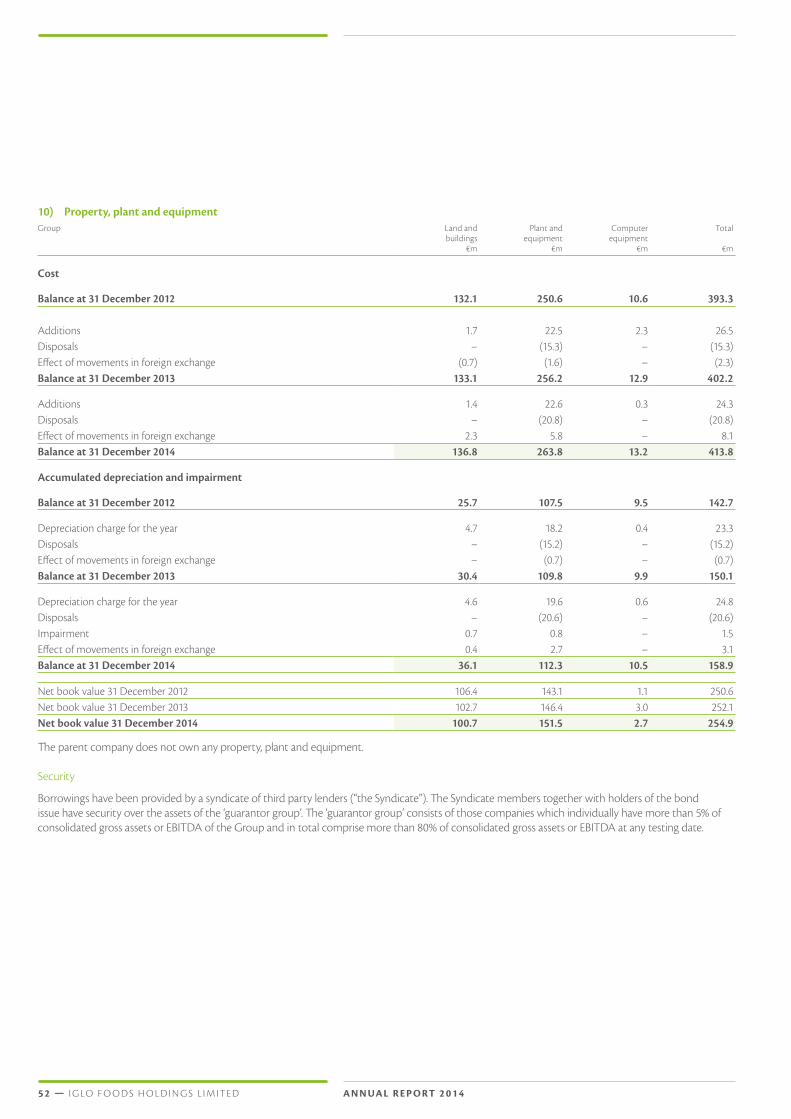
10) Property, plant and equipmentGroup Land and
buildings€m
Plant and equipment
€m
Computer equipment
€m
Total
€m
Cost
Balance at 31 December 2012 132.1 250.6 10.6 393.3
Additions 1.7 22.5 2.3 26.5Disposals – (15.3) – (15.3)Effect of movements in foreign exchange (0.7) (1.6) – (2.3)Balance at 31 December 2013 133.1 256.2 12.9 402.2
Additions 1.4 22.6 0.3 24.3Disposals – (20.8) – (20.8)Effect of movements in foreign exchange 2.3 5.8 – 8.1Balance at 31 December 2014 136.8 263.8 13.2 413.8
Accumulated depreciation and impairment
Balance at 31 December 2012 25.7 107.5 9.5 142.7
Depreciation charge for the year 4.7 18.2 0.4 23.3Disposals – (15.2) – (15.2)Effect of movements in foreign exchange – (0.7) – (0.7)Balance at 31 December 2013 30.4 109.8 9.9 150.1
Depreciation charge for the year 4.6 19.6 0.6 24.8Disposals – (20.6) – (20.6)Impairment 0.7 0.8 – 1.5Effect of movements in foreign exchange 0.4 2.7 – 3.1Balance at 31 December 2014 36.1 112.3 10.5 158.9 Net book value 31 December 2012 106.4 143.1 1.1 250.6Net book value 31 December 2013 102.7 146.4 3.0 252.1Net book value 31 December 2014 100.7 151.5 2.7 254.9
The parent company does not own any property, plant and equipment.
Security
Borrowings have been provided by a syndicate of third party lenders (“the Syndicate”). The Syndicate members together with holders of the bond issue have security over the assets of the ‘guarantor group’. The ‘guarantor group’ consists of those companies which individually have more than 5% of consolidated gross assets or EBITDA of the Group and in total comprise more than 80% of consolidated gross assets or EBITDA at any testing date.
5 2 — I G LO F O O DS H O L D I N G S L I M IT E D A N N UA L R E P O RT 2 0 1 4

11) Intangible assetsGroup Goodwill
€m
Brands
€m
Computer software
€m
Total
€m
Cost
Balance at 31 December 2012 931.5 1,330.2 20.0 2,281.7
Additions – – 1.8 1.8Effect of movements in foreign exchange (4.9) (8.8) – (13.7)Balance at 31 December 2013 926.6 1,321.4 21.8 2,269.8
Additions – – 2.0 2.0Effect of movements in foreign exchange 16.7 29.3 – 46.0Balance at 31 December 2014 943.3 1,350.7 23.8 2,317.8
Accumulated amortisation and impairment
Balance at 31 December 2012 26.5 25.5 11.9 63.9
Amortisation for the year – 1.1 3.4 4.5Impairment 27.4 – – 27.4Balance at 31 December 2013 53.9 26.6 15.3 95.8
Amortisation for the year – 1.1 4.5 5.6Balance at 31 December 2014 53.9 27.7 19.8 101.4 Net book value 31 December 2012 905.0 1,304.7 8.1 2,217.8Net book value 31 December 2013 872.7 1,294.8 6.5 2,174.0Net book value 31 December 2014 889.4 1,323.0 4.0 2,216.4
The parent company does not own any intangible assets.
Amortisation of €5.6 million (2013: €4.5 million) is included in ‘other operating expenses’ in the Income Statement.
As a result of the impairment review in 2013, management decided to fully provide for the value of goodwill of the Belgium business, based on the calculation of the value in use of this cash-generating unit. Further details can be found in the consolidated financial statements for the year ended 31 December 2013.
Goodwill and brand values have been allocated to cash-generating units or groups of cash-generating units as follows:
Goodwill Goodwill Brand Brand
Group 2014€m
2013€m
2014€m
2013€m
United Kingdom and Ireland 275.1 258.4 490.6 461.3Total Birds Eye 275.1 258.4 490.6 461.3
Germany 159.9 159.9 210.0 210.0Austria 63.9 63.9 100.0 100.0Other countries 21.4 21.4 102.0 102.0Total Iglo 245.2 245.2 412.0 412.0
Italy 369.1 369.1 420.4 421.5Total Findus 369.1 369.1 420.4 421.5
Total 889.4 872.7 1,323.0 1,294.8
The Group’s goodwill and brand values have been allocated based on the enterprise value at acquisition of each cash-generating unit (“CGU”). As required by IAS 36 “Impairment of Assets”, an annual review of the carrying amount of the goodwill and the indefinite life brands is carried out to identify whether there is any impairment to these carrying values. This is done by means of comparison of the carrying values to the value in use of each CGU. Value in use is calculated as the net present value of the projected risk-adjusted cash flows of each CGU.
Busi
ness
ove
rvie
wG
over
nanc
eFi
nanc
ial s
tate
men
ts
I G LO F O O DS H O L D I N G S L I M IT E D — 5 3

Key assumptions
The values for the key assumptions were arrived at by taking into consideration detailed historical information and comparison to external sources where appropriate, such as market rates for discount factors.
• Budgeted cash flows: the calculation of value in use has been based on the cash flows forecast in the 2015 budget and applying assumptions for the subsequent two years. These plans have been prepared and approved by management, and incorporate past performance, historical growth rates and projections of developments in key markets. Beyond this, a cash flow growth rate of 0.5% p.a. has been assumed for each territory, this being a reasonable estimate of future growth in the territories in which we operate.
• Sales: projected sales are built up with reference to markets and product platforms. They incorporate past performance, historical growth rates and projections of developments in key markets.
• EBITDA Margin: projected margins reflect historical performance.
• Discount rate: a pre-tax discount rate of between 7.4% and 10.0% (2013: 8.2% and 10.7%) was applied to the cash flows depending on the risk attributed to businesses in each territory.
• Long-term growth rates: as required by IAS 36, growth rates for the period after the detailed forecasts are based on past performance. The growth rate used in the testing was 0.5% (2013: 0.5%). These rates do not reflect the long-term assumptions used by the Group for investment planning.
Sensitivity to changes in assumptions
The performance of the Italian CGU is discussed in the Chief Financial Officer’s Review. No impairment is indicated in the current year as the recoverable amount calculated based on value in use exceeded carrying value by in excess of €100.0 million. A reasonably possible change to the discount rate assumption made by management in assessing the recoverable amount of the Italian CGUs would result in the carrying amount exceeding its recoverable amount, resulting in an impairment to our goodwill balance.
A rise in pre-tax discount rate to 10.9% from 9.7% would remove the remaining headroom.
5 4 — I G LO F O O DS H O L D I N G S L I M IT E D A N N UA L R E P O RT 2 0 1 4

12) Investments2014 €m
2013 €m
Subsidiaries 7.8 7.8
The Company has investments in the following subsidiaries:
ActivityCountry of
incorporation Class of shares heldOwnership 2014 and
2013
Direct investmentsIglo Foods Holdco Limited Holding England Ordinary 100%
Indirect investmentsIglo Foods Finco Limited Holding England Ordinary 100%Iglo Foods Midco Limited Management/Finance England Ordinary 100%Iglo Foods Group Limited Trading England Ordinary 100%Iglo Holding GmbH Holding Germany Ordinary 100%Liberator Germany Newco GmbH Property Germany Ordinary 100%Frozen Fish International GmbH Trading Germany Ordinary 100%Frozen Food Trading GmbH Non-trading Germany Ordinary 100%Iglo GmbH Trading Germany Ordinary 100%Iglo Services GmbH Non-trading Germany Ordinary 100%Birds Eye Ipco Limited Non-trading England Ordinary 100%Birds Eye Limited Trading England Ordinary 100%Birds Eye Foods Limited Non-trading England Ordinary 100%Iglo Foods Bondco plc (incorporated 19 June 2014) Finance England Ordinary 100%Iglo Foods Shortco plc (incorporated 12 June 2014) Non-trading England Ordinary 100%C.S.I. Compagnia Surgelati Italiana S.R.L Trading Italy Ordinary 100%Iglo Austria Holdings GmbH Holding Austria Ordinary 100%Iglo Austria GmbH Trading Austria Ordinary 100%Iglo France S.A.S. Trading France Ordinary 100%Iglo Belgium S.A. Trading Belgium Ordinary 100%Iglo Netherland B.V. Trading Netherlands Ordinary 100%Iglo Portugal Trading Portugal Ordinary 100%Birds Eye Ireland Limited Trading Republic of Ireland Ordinary 100%Iglo Dondurulmus Gida Hizmetleri Limited Sirketi Trading Turkey Ordinary 100%Limited Liability Company Iglo Trading Russia Ordinary 100%Iglo Foods Finance Limited Finance England Ordinary 100%
Busi
ness
ove
rvie
wG
over
nanc
eFi
nanc
ial s
tate
men
ts
I G LO F O O DS H O L D I N G S L I M IT E D — 5 5

13) Deferred tax assets and liabilities
Recognised deferred tax assets and liabilities
Deferred tax assets and liabilities are attributable to the following:
Group Assets2014
€m
Liabilities2014
€m
Total2014
€m
Assets2013
€m
Liabilities2013
€m
Total2013
€m
Property, plant and equipment 8.2 (16.2) (8.0) 6.1 (20.0) (13.9)Intangible assets 2.0 (280.1) (278.1) 2.0 (265.2) (263.2)Employee benefits 23.7 – 23.7 7.9 – 7.9Tax value of loss carry forwards 31.8 – 31.8 40.7 – 40.7Derivative financial instruments 1.4 (3.4) (2.0) 1.7 – 1.7Other 6.2 (6.4) (0.2) 6.7 (6.3) 0.4Tax assets/(liabilities) 73.3 (306.1) (232.8) 65.1 (291.5) (226.4)
Deferred income tax assets are recognised for tax loss carry-forwards to the extent that the realisation of the related tax benefit through future taxable profits is probable. The losses arise as a result of both trading and non-trading losses in Group entities and are expected to be utilised within five years or less.
Deferred tax assets that the Group has not recognised in the financial statements amount to €16.4 million (2013: €13.5 million). These deferred tax assets have not been recognised as the likelihood of recovery is uncertain.
The aggregate deferred tax relating to items that have been charged directly to equity is €10.0 million (2013: €1.0 million credit).
Movement in deferred tax during the year:
2014 Opening balance 1 January 2014
€m
Movement in foreign exchange on
opening balance€m
Recognised in Income Statement
€m
Recognised in equity
€m
31 December 2014
€m
Property, plant and equipment (13.9) – 5.9 – (8.0)Intangible assets (263.2) (3.5) (11.4) – (278.1)Employee benefits 7.9 – 0.6 15.2 23.7Tax value of loss carry forwards 40.7 0.1 (9.0) – 31.8Derivative financial instruments 1.7 (0.2) 0.2 (3.7) (2.0)Other 0.4 – (0.6) – (0.2)Total deferred tax (226.4) (3.6) (14.3) 11.5 (232.8)
2013 Opening balance 1 January 2013
€m
Movement in foreign exchange on
opening balance€m
Recognised in Income Statement
€m
Recognised in equity
€m
31 December 2013
€m
Property, plant and equipment (17.7) – 3.8 – (13.9)Intangible assets (278.3) 1.4 13.7 – (263.2)Employee benefits 9.3 – 0.2 (1.6) 7.9Tax value of loss carry forwards 39.4 – (1.2) 2.5 40.7Derivative financial instruments 1.1 – (0.2) 0.8 1.7Other 2.1 – (1.7) – 0.4Total deferred tax (244.1) 1.4 14.6 1.7 (226.4)
5 6 — I G LO F O O DS H O L D I N G S L I M IT E D A N N UA L R E P O RT 2 0 1 4

14) InventoriesGroup 2014
€m2013
€m
Raw materials and consumables 45.6 52.7Work in progress 39.1 33.9Finished goods and goods for resale 144.4 135.2Total inventories 229.1 221.8
During the year €5.9 million (2013: €4.0 million) was charged to the Income Statement for the write down of inventories. This excludes a €4.8 million write down of stock damaged in the Cisterna fire which has been included within exceptional items.
During the year €890.7 million (2013: €919.5 million) of inventories was recognised as an expense within cost of goods sold.
15) Trade and other receivablesGroup 2014
€m2013
€m
Trade receivables 34.9 34.8Prepayments and accrued income 1.8 1.4Other receivables 12.7 21.4Total trade and other receivables 49.4 57.6
Trade receivables, prepayments and other receivables are expected to be recovered in less than 12 months.
The ageing of trade receivables is detailed below:
Gross2014
€m
Impaired2014
€m
Net2014
€m
Gross2013
€m
Impaired2013
€m
Net2013
€m
Not past due 142.9 – 142.9 137.9 – 137.9Past due less than 1 month 29.4 – 29.4 39.4 – 39.4Past due 1 to 3 months 1.9 (0.4) 1.5 7.0 – 7.0Past due 3 to 6 months 0.5 (0.4) 0.1 0.2 – 0.2Past due more than 6 months 2.6 (2.6) – 0.2 – 0.2Sub-total 177.3 (3.4) 173.9 184.7 – 184.7
Reduction in trade terms (139.0) (149.9)
Total trade receivables 34.9 34.8
All impaired trade receivables have been provided to the extent that they are believed not to be recoverable.
The maximum exposure to credit risk at the reporting date is the fair value of each class of receivable. The Group does not hold any collateral as security.
16) Cash and cash equivalents/Bank overdraftsGroup
2014 €m
Company2014
€m
Group2013
€m
Company2013
€m
Cash and cash equivalents 707.0 – 688.5 0.3Bank overdrafts (487.8) – (371.4) –Cash and cash equivalents per Statement of Cash Flows 219.2 – 317.1 0.3
Cash and cash equivalents comprise cash balances and call deposits. Bank overdrafts that are repayable on demand and form an integral part of the Group’s cash management are included as a component of cash and cash equivalents for the purpose of the Statement of Cash Flows only.
The Group uses a notional cash pooling system where funds are considered on a net basis and grouped together as cash and cash equivalents. Whilst accounting standards require that these balances are shown gross, the net cash balance is available to be utilised by the Group.
Busi
ness
ove
rvie
wG
over
nanc
eFi
nanc
ial s
tate
men
ts
I G LO F O O DS H O L D I N G S L I M IT E D — 5 7

17) Loans and borrowingsThe repayment profile of the syndicated and other loans held by the Group is as follows:
Group 2014€m
2013€m
Current (assets)/liabilitiesSyndicated and other loans – 130.0Less deferred borrowing costs to be amortised within 1 year (2.1) (12.8)Total due in less than one year (2.1) 117.2
Non-current liabilitiesSyndicated and other loans 2,412.4 2,850.42020 floating rate senior secured notes 500.0 –Less deferred borrowing costs to be amortised in 2–5 yrs (8.3) (28.2)Less deferred borrowing costs to be amortised in more than 5 yrs (1.0) –Total due after more than one year 2,903.1 2,822.2
Total borrowings 2,901.0 2,939.4
A more detailed analysis of the repayment profile of the loans is included in note 23.
The table below shows details of individual loans:
Group 2014€m
2013€m
Current (assets)/liabilities – syndicated and other loansSenior B EUR – 49.1Senior B GBP – 22.3Senior I EUR – 58.6Less deferred borrowing costs to be amortised within 1 year (2.1) (12.8)Total current loans and borrowings (2.1) 117.2
Non-current liabilities – syndicated and other loans2020 floating rate senior secured notes 500.0 –Senior B1 EUR 620.0 –Senior B2 GBP 513.5 –Senior C EUR – 31.7Senior D EUR – 23.3Senior C GBP – 22.3Senior E GBP – 7.3Senior F EUR – 811.1Senior G GBP – 587.6Senior I EUR – 218.0German government loan 0.1 0.1Class A loan notes EUR 129.1 116.0Class B loan notes EUR 929.1 834.7Class C loan notes EUR 1.2 1.1Class G loan notes EUR 218.9 196.7Class K loan notes EUR 0.5 0.5Less deferred borrowing costs to be amortised in 2 – 5 years (8.3) (28.2)Less deferred borrowing costs to be amortised in more than 5 yrs (1.0) –Total non-current loans and borrowings 2,903.1 2,822.2 Total borrowings 2,901.0 2,939.4
Borrowings under the syndicated loan facility and floating rate notes 1,622.1 1,790.3
Interest on the loan notes is not paid in cash but is added to the principal of the draw down amounts. From 1 January 2013, the interest rate on these loan notes has been 11%.
5 8 — I G LO F O O DS H O L D I N G S L I M IT E D A N N UA L R E P O RT 2 0 1 4

The interest rate on all other loans and the floating rate senior secured notes are re-priced within one year to the relevant EURIBOR or LIBOR rate.
On 17 July 2014, the Group completed a refinancing of its Senior debt with a syndicate of banks. All Senior debt as at the balance sheet date was repaid and replaced with new Senior Euro debt of €620.0 million and Senior GBP debt of £400.0 million, which are repayable on 30 June 2020. In addition to this, €500.0 million has been raised through the issuance of a floating rate bond issue on the Luxembourg Stock Exchange, with a repayment date of 15 June 2020. Both the new Senior debt and the bond issue are secured with equal ranking against certain assets of the Group.
Eligible transaction costs of €12.5 million have been capitalised as part of the refinancing and will be amortised over the life of the debt. As a consequence of the refinancing, deferred borrowing costs relating to the old senior debt of €34.5 million have been written off through financing costs in the year.
In addition to this, the existing multicurrency revolving credit facility was replaced with a new €80.0 million facility. This facility is available until 31 December 2019. As at 31 December 2014 €4.0 million has been utilised for letters of credit, overdrafts, customer bonds and bank guarantees against the revolving credit facility.
The Syndicate members have security over the assets of the ‘guarantor group’. The ‘guarantor group’ consists of those companies which individually have more than 5% of consolidated gross assets or EBITDA of the Group and in total comprise more than 80% of consolidated gross assets or EBITDA at any testing date.
18) Trade and other payablesGroup
2014€m
Company2014
€m
Group2013
€m
Company2013
€m
Trade payables 244.8 – 246.2 –Accruals and deferred income 49.4 – 41.3 –Social security and other taxes 13.7 – 8.7 –Other payables 1.2 – 1.8 –Financial payables 4.8 – 6.5 –Amounts owed to Group undertakings – – – 0.3Total trade and other payables 313.9 – 304.5 0.3
19) Employee benefitsThe Group operates defined benefit pension plans in Germany, Italy and Austria as well as various defined contribution plans in other countries. The defined benefit pension plans are partially funded in Germany and Austria and unfunded in Italy. In addition, an unfunded post-retirement medical plan is operated in Austria. In Germany and Italy long-term service awards are in operation and various other countries provide other employee benefits.
Group 2014€m
2013€m
Total employee benefits – Germany 114.8 62.1Total employee benefits – Italy 5.7 5.4Total employee benefits – Austria 3.1 2.9Sub-total 123.6 70.4
Total net employee benefits – other countries 0.6 0.5 Total net employee benefits 124.2 70.9
The present value of defined benefit obligations and fair value of plan assets have increased from the prior year. The increase in the obligation is caused by the reduction in the discount rates, principally in Germany, as a result of a decrease in the market yields on high quality corporate bonds.
The obligation of €0.6 million (2013: €0.5 million) in respect of other countries is the aggregate of a large number of different types of minor schemes, each one not being considered material. Consequently, detailed disclosure of these schemes is not provided.
Busi
ness
ove
rvie
wG
over
nanc
eFi
nanc
ial s
tate
men
ts
I G LO F O O DS H O L D I N G S L I M IT E D — 5 9

The amount included in the Statement of Financial Position arising from the Group’s obligations in respect of its defined benefit retirement plans and post-employment benefits is as follows:
Defined benefit retirement plansPost‒employment medical benefits
and other benefits Total
2014€m
2013€m
2014€m
2013€m
2014€m
2013€m
Present value of unfunded defined benefit obligations 5.3 6.8 6.3 5.8 11.6 12.6Present value of funded defined benefit obligations 189.9 132.4 – – 189.9 132.4Subtotal present value of defined benefit obligations 195.2 139.2 6.3 5.8 201.5 145.0
Fair value of plan assets (77.9) (74.6) – – (77.9) (74.6)Recognised liability for net defined benefit obligations 117.3 64.6 6.3 5.8 123.6 70.4
Movements in recognised liability for net defined benefit obligations:
Defined benefit retirement plansPost‒employment medical benefits
and other benefits Total
2014€m
2013€m
2014€m
2013€m
2014€m
2013€m
Opening balance 1 January 64.6 69.2 5.8 5.3 70.4 74.5Current service cost 2.6 2.8 0.3 0.4 2.9 3.2Interest cost 2.5 2.4 0.2 0.1 2.7 2.5Actuarial losses/(gains) 52.0 (4.8) – – 52.0 (4.8)Contributions to plan (1.1) (1.2) 0.1 – (1.0) (1.2)Benefits paid (3.3) (3.8) (0.1) – (3.4) (3.8)As at 31 December 117.3 64.6 6.3 5.8 123.6 70.4
Movements in present value of defined benefit obligations:
Defined benefit retirement plansPost‒employment medical benefits
and other benefits Total
2014€m
2013€m
2014€m
2013€m
2014€m
2013€m
Opening balance 1 January 139.2 145.6 5.8 5.3 145.0 150.9Current service cost 2.6 2.8 0.3 0.4 2.9 3.2Interest cost 5.3 5.3 0.2 0.1 5.5 5.4Actuarial losses/(gains) 53.9 (8.1) – – 53.9 (8.1)Contributions by members – – 0.1 – 0.1 –Benefits paid (5.8) (6.4) (0.1) – (5.9) (6.4)As at 31 December 195.2 139.2 6.3 5.8 201.5 145.0
Movements in fair value of plan assets of defined benefit retirement plans:
2014€m
2013€m
Opening balance 1 January 74.6 76.4Expected return on assets 2.8 2.9Actuarial gains/(losses) 1.9 (3.3)Contributions by employer 0.6 0.6Contributions by members 0.5 0.6Benefits paid (2.5) (2.6)At 31 December 77.9 74.6
6 0 — I G LO F O O DS H O L D I N G S L I M IT E D A N N UA L R E P O RT 2 0 1 4

Expense recognised in the Consolidated Income Statement:
Defined benefit retirement plansPost‒employment medical benefits
and other benefits Total
2014€m
2013€m
2014€m
2013€m
2014€m
2013€m
Current service cost 2.6 2.8 0.3 0.4 2.9 3.2Interest on defined benefit pension plan obligation 2.5 2.4 0.2 0.1 2.7 2.5Total 5.1 5.2 0.5 0.5 5.6 5.7
Current service cost is disclosed in cost of sales and interest on net defined benefit obligation is disclosed in net financing costs.
Amount recognised in the Consolidated Statement of Comprehensive Income:
2014€m
2013€m
Actuarial (losses)/gains on defined benefit obligation (53.9) 8.1Actuarial gains/(losses) on plan assets 1.9 (3.3)Total (52.0) 4.8
2014€m
2013€m
Cumulative amount of actuarial losses recognised in Statement of Comprehensive Income (55.0) (3.0)
The fair value of plan assets, all at quoted prices, are as follows:
2014€m
2013€m
Equities 6.9 2.8Debt instruments 60.3 61.2Property 9.1 9.4Other 1.6 1.2Total 77.9 74.6
Principal actuarial assumptions at the year-end were as follows:
Defined benefit retirement plansPost‒employment medical benefits
and other benefits
2014Germany
2014Austria
2014Italy
2014Germany
2014Austria
Discount rate 2.0% 2.5% 1.7% 1.4% 2.5%Inflation rate 2.0% – 1.8% 2.0% – Rate of increase in salaries 2.7% 3.0% 3.0% 2.7% 3.0%Rate of increase for pensions in payment 1%/2% 1.7% – – – Long‒term medical cost of inflation – – – – 2.0%
Defined benefit retirement plansPost‒employment medical benefits
and other benefits
2013Germany
2013Austria
2013Italy
2013Germany
2013Austria
Discount rate 3.9% 3.8% 3.2% 2.8% 3.8%Inflation rate 2.0% – 2.0% 2.0% – Rate of increase in salaries 2.7% 3.0% 3.0% 2.7% 3.0%Rate of increase for pensions in payment 2.0% 1.8% – – – Long‒term medical cost of inflation – – – – 4.5%
Busi
ness
ove
rvie
wG
over
nanc
eFi
nanc
ial s
tate
men
ts
I G LO F O O DS H O L D I N G S L I M IT E D — 6 1

In valuing the liabilities of the pension fund at 31 December 2014, mortality assumptions have been made as indicated below. The assumptions relating to longevity underlying the pension liabilities at the financial year end date are based on standard actuarial mortality tables and include an allowance for future improvements in longevity. The assumptions are based on the following mortality tables:
• Germany: Richttafeln 2005
• Austria : AVO 2008
• Italy: RG48
These three references are to the specific standard rates of mortality that are published and widely used in each country for the use of actuarial assessment of pension liabilities and take account of local current and future average life expectancy.
These tables translate into an average life expectancy in years for a pensioner retiring at age 65:
2014
Germany2014
Austria2014 Italy
Retiring at the end of the year:– Male 19 20 17– Female 23 24 21
Retiring 20 years after the end of the year:– Male 22 23 17– Female 26 26 21
The five year history of experience adjustments for the defined benefit retirement plans is as follows:
2014€m
2013€m
2012€m
2011€m
2010€m
Present value of defined benefit obligations 195.2 139.2 145.6 116.9 119.8Fair value of plan assets (77.9) (74.6) (76.4) (70.8) (69.4)Asset ceiling – – 0.1 0.2 0.2Recognised liability in the scheme 117.3 64.6 69.3 46.3 50.6
Experience adjustments on scheme liabilities (0.7) (1.8) 22.9 (0.1) 3.1Experience adjustments on scheme assets 1.6 (3.2) 3.7 (0.2) 3.1
Post-employment medical benefits – sensitivity analysis
The effect of a 1% movement in the assumed medical cost trend rate is as follows:
2014 Increase€m
Decrease€m
Effect on the aggregate of the current service and interest cost – – Effect on the post‒employment benefit obligation – –
Defined benefit obligation – sensitivity analysis
The effect of a 1% movement in the discount rate is as follows:
2014 Increase €m
Decrease €m
Effect on the post‒employment benefit obligation (34.7) 40.3
Defined contribution plans
The Group operates a number of defined contribution pension plans. The total expense relating to these plans in the current year was €4.6 million (2013: €4.3 million).
6 2 — I G LO F O O DS H O L D I N G S L I M IT E D A N N UA L R E P O RT 2 0 1 4

20) ProvisionsGroup Management
incentive plan€m
Restructuring
€m
Other
€m
Total
€m
Balance at 31 December 2013 11.6 5.3 9.7 26.6
Additional provision in the year 18.6 12.8 4.3 35.7Utilisation of provision – (5.6) (1.5) (7.1)Balance at 31 December 2014 30.2 12.5 12.5 55.2
Management incentive plan
See note 6b for detail on the management incentive plan.
Restructuring
€12.5 million relates to committed plans for certain operational restructuring activities which are due to be completed within the next 12 months. The amounts have been provided based on information available on the likely expenditure required to complete the committed plans.
Other
€6.5 million (2013: €7.2 million) relates to CSI for potential obligations under Italian law for three principal items: a legal case involving disputed overtime entitlement, obligations potentially payable to agents of the Company and a provision for the scrapping of freezer cabinets. A further €3.9 million has been provided for in the year in relation to tax matters from previous accounting years.
21) Share capital and reservesGroup 2014
€m2013
€m
Share capital 0.1 0.1Capital reserve 3.6 1.9
Company 2014€m
2013€m
Share capital 0.1 0.1Capital reserve 0.8 0.8
In May 2013, the Board of Directors approved the issuance of 500,000 Class I shares and 500,000 Class J ordinary shares. The Class J ordinary shares rank pari passu with existing ordinary shares. Holders of the Class I interests are entitled to a return if performance criteria are met.
Details of class of shares:
Class of share capital Number of shares
Nominal value per share
Share capital value
Share premium in capital reserve
Ordinary GBP 1 £1.00 €1 –Ordinary E interests 6,000,000 €0.01 €60,000 –Ordinary H interests 16,755 €1.00 €16,755 –Ordinary I interests 500,000 €0.05 €25,000 €64,050Ordinary J interests 500,000 €0.05 €25,000 €731,923
The holders of ordinary shares are entitled to receive dividends as declared from time to time and are entitled to one vote per share at meetings of the Company.
Busi
ness
ove
rvie
wG
over
nanc
eFi
nanc
ial s
tate
men
ts
I G LO F O O DS H O L D I N G S L I M IT E D — 6 3

The Group has the following reserves:
Capital reserve
The Group and Company capital reserve balance comprises €0.8 million share premium on Class ‘I’ and ‘J’ shares issued in the year. The remaining €2.8 million in Group relates to the share based payment charge, see note 6 for detail.
Translation reserve
The translation reserve comprises all foreign exchange differences arising from the translation of the financial statements of foreign operations, as well as from the translation of liabilities that hedge the Company’s net investment in a foreign subsidiary.
Cash flow hedging reserve
The hedging reserve comprises the effective portion of the cumulative net change in the fair value of cash flow hedging instruments related to hedged transactions that have not yet occurred.
The table below shows the movement in the cash flow hedging reserve during the year, including the gains or losses arising on the revaluation of hedging instruments during the year and the amount reclassified from other comprehensive income to the income statement in the year.
2014€m
2013€m
Gains/(losses) arising during the year 15.9 (6.3)Less: Reclassification adjustments for (losses)/gains included in profit or loss (2.7) 3.0Total 13.2 (3.3)
22) Cash flows from operating activitiesNote Group
2014€m
Company 2014
€m
Group 2013
€m
Company 2013
€m
Cash flows from operating activitiesLoss for the year (109.1) – (41.2) –Adjustments for:Exceptional items 5 52.9 – 83.8 –Depreciation charge 10 24.8 – 23.3 –Amortisation 11 5.6 – 4.5 –Loss on disposal of property, plant and equipment 0.2 – 0.1 –Finance costs 8 297.0 – 240.0 –Finance income 8 (6.8) – (12.4) –Taxation 9 41.8 – 2.0 –
Operating cash flow before changes in working capital, provisions and exceptional items 306.4 – 300.1 –
Decrease in inventories 1.9 – 20.0 –Decrease/(increase) in trade and other receivables 10.7 – (0.7) –(Decrease)/increase in trade and other payables (13.0) (0.3) 1.1 0.3Decrease in employee benefit and other provisions (4.3) – (1.8) –
Cash generated from operations before tax and exceptional items 301.7 (0.3) 318.7 0.3
6 4 — I G LO F O O DS H O L D I N G S L I M IT E D A N N UA L R E P O RT 2 0 1 4
23) Financial risk management
a) Overall risk management policy
The Group’s activities expose it to a variety of financial risks, including currency risk, interest rate risk, credit risk and liquidity risk.
The Group’s overall risk management programme focuses on minimising potential adverse effects on the Group’s financial performance. The Group uses derivative financial instruments to hedge certain risk exposures.
Risk management is led by senior management and is mainly carried out by a central treasury department which identifies, evaluates and hedges financial risks in close cooperation with the Group’s operating units.
Details of capital risk management objectives are contained in the Chief Financial Officer’s Review.
b) Market risk (including currency risk and interest rate risk)
In managing market risks, the Group aims to minimise the impact of short-term fluctuations on the Group’s earnings. Over the longer term, however, permanent changes in foreign exchange rates and interest rates will have an impact on consolidated earnings.
Currency risk Foreign currency risk on assets and liabilities in currencies other than functional currencyDescription The Group is exposed to foreign exchange risk arising from the retranslation of assets and liabilities in currencies other than
the functional currency of each company in the Group. This affects particularly the Sterling loans and overdraft balances.The GBP value of these liabilities is retranslated at closing exchange rates into Euro for inclusion in the financial statements. Fluctuations in the value of these liabilities are caused by variation in the closing GBP-EUR exchange rate.
Mitigation & impact onStatement of Financial Position/ Equity/Income Statement
100% of the Group’s GBP loans are designated as hedges against the Group’s investment in its subsidiaries in the UK. As at 31 December 2014, this represented 51% of the net assets of the UK businesses (2013: 67%).The impact of the net investment hedge is taken directly to equity via the foreign currency translation reserve. The amount taken to this reserve which arose on the retranslation of the Sterling loans was a loss of €39.5 million (2013: gain of €13.0 million). There was no ineffectiveness in the net investment hedge in either 2014 or 2013.The fair value of the GBP denominated loans at 31 December 2014 is €497.0 million (2013: €639.5 million) (at closing financial year end rates).
Sensitivity analysis During 2014, the Euro weakened by 6.9% against Sterling.For each 1% that the Euro strengthens or weakens, assuming all other variables remain constant, the impact on the Sterling loans would be a credit or debit to the Group’s equity of €5.1 million, and on the Sterling overdraft balances would be a credit or debit to the Group’s Income Statement of €1.9 million.In addition, the impact on the related interest charge would be to decrease or increase the charge by €0.3 million for each 1% change in the exchange rate.
Currency risk Foreign currency risk on purchasesDescription The Group is exposed to foreign exchange risk where a business unit makes purchases in a currency other than its functional
currency.For the Group, the most significant of these exposures is the purchase of fish inventories in US dollars, the purchase of goods and services in Euros by the UK business and purchases of goods in Swedish Krona by the Italian business.
Mitigation & impact on Statement of Financial Position/Equity/Income Statement
The Group’s policy is to reduce this risk by using foreign exchange forward contracts which are designated as cash flow hedges.These contracts all have a maturity of less than one year.The fair value of the US dollar forward contracts at 31 December 2014 is an asset of €11.1 million (2013: €5.4 million liability). All forecast transactions are still expected to occur.As at 31 December 2014, 77% of forecast future dollar payments for the next 12 months were hedged (2013: 82%).The fair value of the Swedish Krona forward contracts at 31 December 2014 is a liability of €0.1 million (2013: €0.1 million). All forecast transactions are still expected to occur.As at 31 December 2014, 43% of anticipated future Swedish Krona payments for the next 12 months were hedged (2013: 45%)The fair value of the Euro forward contracts in subsidiaries with a Sterling functional currency at 31 December 2014 is a liability of €1.7 million (2013: €1.8 million).As at 31 December 2014, 63% of anticipated future Euro net payments by the UK business for the next 12 months were hedged (2013: 81%).
Busi
ness
ove
rvie
wG
over
nanc
eFi
nanc
ial s
tate
men
ts
I G LO F O O DS H O L D I N G S L I M IT E D — 6 5

Sensitivity analysis During 2014, the Euro weakened by 6.9% against Sterling, and weakened by 11.8% against the US dollar and strengthened by 5.1% against the Swedish Krona.For each 1% that the Euro strengthens or weakens against Sterling, assuming all other variables remain constant, the impact relating to these purchases would be to increase or decrease the Group’s loss before tax by approximately €0.7 million (2013: €1.0 million) for the year ended 31 December 2014, excluding the impact of any forward contracts.For each 1% that the Euro strengthens or weakens against the US dollar, assuming all other variables remain constant, the impact would be to increase or decrease the Group’s loss before tax by approximately €1.8 million (2013: €1.8 million) for the year ended 31 December 2014, excluding the impact of any forward contracts.For each 1% that the Euro strengthens or weakens against Swedish Krona, assuming all other variables remain constant, the impact relating to these purchases would be to increase or decrease the Group’s loss before tax by approximately €0.2 million (2013: €0.3 million) for the year ended 31 December 2014, excluding the impact of any forward contracts.
Interest rate riskDescription The Group has significant levels of floating rate borrowings and is therefore exposed to the impact of interest rate
fluctuations.Mitigation & impact on Equity/Income Statement
The Group’s policy on interest rate risk is designed to limit the Group’s exposure to fluctuating interest rates. The Group designates interest rate caps which limit the maximum interest rate as cash flow hedges.Interest rate caps hedge 95% (2013: 75%) of the Group’s Sterling debt during 2015 and 71% (2013: 71%) of the Group’s Euro debt during 2015.The interest expense in the Income Statement is shown including the effect of the interest rate caps. It is intended to hold these instruments until maturity so that although the fair value of the instruments will fluctuate over the course of their life due to changes in market rates, the instruments will have nil value on expiry.During 2014 €nil (2013: €nil) was taken to equity relating to the change in fair value of these instruments and €nil (2013: €0.8 million) was recycled to the Income Statement.
Sensitivity analysis In 2014, LIBOR rates were consistent with 2013 and EURIBOR rates decreased by 0.2 percentage points.It is estimated that an increase or decrease of one percentage point in the interest rate charge on borrowings would correspondingly decrease or increase the Group’s loss before tax for the year ended 31 December 2014 by approximately €16.3 million.
c) Credit risk
Description Credit risk arises on cash and cash equivalents and derivative financial instruments with banks and financial institutions, as well as on credit exposures to customers. See note 15 for analysis of the trade receivables balance and note 16 for analysis of the cash and cash equivalents balance.
Mitigation The Group limits counterparty exposures by monitoring each counterparty carefully and, where possible, setting credit limits by reference to published ratings. We limit our exposure to individual financial institutions by spreading our forward foreign exchange contracts and surplus cash deposits between several institutions.The credit quality of customers is assessed taking into account their financial position, past experience and other factors. Credit limits are set for customers and regularly monitored. The Group aims to ensure that the maximum exposure to one financial institution does not exceed €75.0 million and that the long-term credit rating does not fall below Low Double A.
d) Liquidity risk
Description The Group is exposed to the risk that it is unable to meet its commitments as they fall due. The Group has financial conditions imposed by its lenders which it must achieve in order to maintain its current level of borrowings. A single Net Debt covenant is carried out quarterly and at the end of each financial year. There has been no breach of the covenant throughout the year.
Mitigation The Group ensures that it has sufficient cash and available funding through regular cash flow and covenant forecasting. In addition, the Group has access to a revolving credit facility of €80.0 million, expiring in December 2019. This is available to finance working capital requirements and for general corporate purposes. Currently €4.0 million is utilised for letters of credit, overdrafts, customer bonds and bank guarantees.
6 6 — I G LO F O O DS H O L D I N G S L I M IT E D A N N UA L R E P O RT 2 0 1 4

Maturity analysis
The tables below show a maturity analysis of contractual undiscounted cash flows, showing items at the earliest date on which the Group could be required to pay the liability:Group
2014 2015€m
2016€m
2017€m
2018€m
2019€m
Over 5 years€m
Total€m
Borrowings – principal – – – – – 2,912.4 2,912.4Borrowings - interest 77.0 77.2 77.0 77.0 77.0 1,151.3 1,536.5Forward contracts 173.1 – – – – – 173.1Trade payables 244.8 – – – – – 244.8Other current liabilities 69.1 – – – – – 69.1Total 564.0 77.2 77.0 77.0 77.0 4,063.7 4,935.9
2013 2014€m
2015€m
2016€m
2017€m
2018€m
Over 5 years€m
Total€m
Borrowings – principal 130.0 54.0 30.7 1,398.7 218.0 1,149.0 2,980.4Borrowings – interest 92.7 89.8 86.9 73.7 1.0 1,242.2 1,586.3Forward contracts 244.8 – – – – – 244.8Trade payables 246.2 – – – – – 246.2Other current liabilities 58.3 – – – – – 58.3Total 772.0 143.8 117.6 1,472.4 219.0 2,391.2 5,303.9
Busi
ness
ove
rvie
wG
over
nanc
eFi
nanc
ial s
tate
men
ts
I G LO F O O DS H O L D I N G S L I M IT E D — 6 7

24) Financial instruments
a) Categories of financial instruments
The following table shows the carrying amount of each Statement of Financial Position class split into the relevant category of financial instrument as defined in IAS 39 “Financial Instruments: Recognition & Measurement”.Group
2014 Loans and receivables
€m
Derivatives used for hedging (see c)
€m
Financial liabilities at amortised cost
€m
Total
€m
AssetsTrade receivables 34.9 – – 34.9Derivative financial instruments – 11.2 – 11.2Cash and cash equivalents 707.0 – – 707.0
LiabilitiesBank overdraft – – (487.8) (487.8)Trade payables – – (244.8) (244.8)Derivative financial instruments – (1.8) – (1.8)Loans and borrowings – – (2,912.4) (2,912.4)
Total 741.9 9.4 (3,645.0) (2,893.7)
2013 Loans and receivables
€m
Derivatives used for hedging (see c)
€m
Financial liabilities at amortised cost
€m
Total
€m
AssetsTrade receivables 34.8 – – 34.8Derivative financial instruments – 0.6 – 0.6Cash and cash equivalents 688.5 – – 688.5
LiabilitiesBank overdraft – – (371.4) (371.4)Trade payables – – (246.2) (246.2)Derivative financial instruments – (7.3) – (7.3)Loans and borrowings – – (2,980.4) (2,980.4)
Total 723.3 (6.7) (3,598.0) (2,881.4)
Trade receivables are the only financial assets that are off-set on the Statement of Financial Position. See note 15 for split between gross receivables and trade terms.
6 8 — I G LO F O O DS H O L D I N G S L I M IT E D A N N UA L R E P O RT 2 0 1 4

b) Fair values
The following summarises the methods and assumptions of estimating the fair values of financial instruments held by the Group.
• Derivative financial instruments
Derivative financial instruments are held at fair value. There is no difference between carrying value and fair value. The financial instruments are not traded in an active market, and so the fair value of these instruments is determined from the implied forward rate. The valuation technique utilised by the Group maximises the use of observable market data where it is available. All significant inputs required to fair value the instrument are observable. These are classified as level 2 instruments as defined in IFRS 13 ‘Fair value measurement’.
• Trade and other payables/receivables
The notional amounts of trade and other payables/receivables are deemed to be carried at fair value, short term, and settled in cash.
• Cash and cash equivalents/overdrafts
The carrying value of cash is deemed to equal fair value.
• Interest bearing loans and liabilities
The fair value of senior loans and senior secured notes is determined by reference to price quotations in the active market in which they are traded. The loan notes are not actively traded, and therefore fair values have been calculated using a discounted cash flow calculation.
Fair value Fair value Carrying value Carrying value
2014
€m2013
€m2014
€m2013
€m
Senior loans 1,104.1 1,831.3 1,133.6 1,831.42020 floating rate senior secured notes 484.5 – 500.0 –Loan notes 1,211.4 965.8 1,278.8 1,149.0Total interest bearing loans 2,800.0 2,797.1 2,912.4 2,980.4
c) Derivatives
The notional principal amounts of the outstanding forward foreign exchange contracts at 31 December 2014 were €173.1 million (2013: €208.6 million).
2014 €m
2013 €m
Interest rate caps 0.1 0.6USD Forward foreign exchange contracts 11.1 –Total assets 11.2 0.6
GBP Forward foreign exchange contracts (1.7) (1.8)USD Forward foreign exchange contracts – (5.4)SEK Forward foreign exchange contracts (0.1) (0.1)Total liabilities (1.8) (7.3)
Total 9.4 (6.7)
Busi
ness
ove
rvie
wG
over
nanc
eFi
nanc
ial s
tate
men
ts
I G LO F O O DS H O L D I N G S L I M IT E D — 6 9
Off-setting of derivatives
Derivative contracts are held under ISDA agreements with financial institutions. An ISDA is an enforceable master netting agreement that permits the Group to settle net in the event of default.
2014 Gross value of financial assets
available for offsetting
€m
Gross value of financial liabilities
available for offsetting
€m
Net amount available for
offsetting
€m
Derivatives – assets 10.2 (0.8) 9.4
2014 Gross value of financial liabilities
available for offsetting
€m
Gross value of financial assets
available for offsetting
€m
Net amount available for
offsetting
€m
Derivatives – liabilities (0.8) 0.8 –
2013 Gross value of financial assets
available for offsetting
€m
Gross value of financial liabilities
available for offsetting
€m
Net amount available for
offsetting
€m
Derivatives – assets 0.6 – 0.6
2013 Gross value of financial liabilities
available for offsetting
€m
Gross value of financial assets
available for offsetting
€m
Net amount available for
offsetting
€m
Derivatives – liabilities (7.3) – (7.3)
25) Operating leases
Non-cancellable operating lease rentals relate to total future aggregate minimum lease payments and are payable as follows:
Group
2014 €m
2013 €m
Less than one year 5.0 4.9Between one and five years 11.9 11.1More than five years 6.6 3.4Total 23.5 19.4
Non-cancellable operating leases relate to equipment, motor vehicles and land and buildings.
26) Capital commitments
The Group has capital commitments amounting to €5.1 million at 31 December 2014 (2013: €0.7 million).
27) Contingent liabilities
The Group is currently in discussions with the tax authorities in one of its markets regarding the treatment of the 2006 acquisition of the Group. Under the original Sale and Purchase Agreement the Group has a warranty in respect of this tax issue.
7 0 — I G LO F O O DS H O L D I N G S L I M IT E D A N N UA L R E P O RT 2 0 1 4

28) Related parties
BEIG LP Incorporated
The Group is controlled by BEIG LP Incorporated (“the Partnership”), which owns 100% of the share capital of the Company.
In 2006, Iglo Foods Holdco Limited, a subsidiary of the Company, issued 17% fixed rate subordinated unsecured Class A, B and C Loan Notes of €1 each to BEIG LP Incorporated. From 1 January 2013, the interest rate on these loan notes was reduced to 11%.
In 2010, as part of the funding for the acquisition of CSI, Iglo Foods Holdco Limited issued 15% fixed rate subordinated unsecured €167.4 million of Class G Loan Notes of €1 each to BEIG LP Incorporated. From 1 January 2013, the interest rate on these loan notes was reduced to 11%.
During 2013, Iglo Foods Holdco Limited, a subsidiary of the Company, issued 11% fixed rate subordinated unsecured Class K Loan Notes of €1 each to BEIG LP Incorporated.
The amounts outstanding at 31 December 2014 and 2013 on these Loan Notes including capitalised interest are disclosed in note 17.
Permira Holdings Limited
The Group is backed by funds advised by Permira Holdings Limited and its subsidiary entities. A Shareholder Agreement was entered into on 3 November 2006, whereby Iglo Foods Holdings Limited or one of its subsidiaries is obliged to pay an annual monitoring fee of €1.0 million. For the years ended 31 December 2014 and 2013, the Permira entity designated to receive the annual monitoring fee is Permira Advisers LLP.
Key Management
All significant management decision making authority is vested solely with individuals who were also Directors of the Company. Therefore key management was deemed to be only the Directors of the Company. Their remuneration has been disclosed in note 7.
Cheryl Potter, of Permira Advisers LLP, held indirect economic interests in the loan notes and the equity of the Group through the Partnership.
All Directors of the Company, with the exception of Cheryl Potter and Tara Alhadeff, held equity interests in the Partnership during the year and as at 31 December 2014, either directly or through a trust structure.
During the year and as at 31 December 2014, Erhard Schoewel and Daniel Pagnoni held interests in the Loan Notes held by the Partnership.
Loan Notes to related parties
The following transactions have occurred through the Partnership, between the Group and related parties, in relation to Loan Notes.
Management
€mPermira Funds
€m
Balance at 31 December 2012 5.2 1,022.8
Replacement of Directors (0.9) –New loan notes issued 0.5 –Interest accrued 0.5 115.6 Balance at 31 December 2013 5.3 1,138.4
Interest accrued 0.5 128.7 Balance at 31 December 2014 5.8 1,267.1
29) Ultimate Parent Company
The ultimate controlling party is BEIG LP Incorporated, a partnership registered in Guernsey. No other consolidated financial statements include the results of the Group.
Busi
ness
ove
rvie
wG
over
nanc
eFi
nanc
ial s
tate
men
ts
I G LO F O O DS H O L D I N G S L I M IT E D — 7 1

Glossary
A&P Advertising & Promotion
CAGR Compound annual growth rate
CO2 Carbon Dioxide
CODM Chief Operating Decision Maker
CSI Compagnia Surgelati Italiana S.R.L
EBITDA Earnings Before Interest, Taxation, Depreciation & Amortisation
EU European Union
EURIBOR Euro Interbank Offered Rate
FMCG Fast Moving Consumer Goods
FY Financial Year
IFRS International Financial Reporting Standards
Iglo Group Iglo Foods Holdings Limited
IRAP Italian regional tax on productive activities
LIBOR London Interbank Offered Rate
M&A Mergers & Acquisitions
MSC Marine Stewardship Council
NPD New Product Development
ppts Percentage points
R&D Research & Development
UK United Kingdom
% Percentage
Iglo Foods Holdings Limited
Registered in England & Wales Company Registered Number: 5879473
Registered office
Building 5 New Square Bedfont Lakes Feltham Middlesex TW14 8HA
Directors
Tara Alhadeff Achim Eichenlaub Tania Howarth Paul Kenyon Elio Leoni Sceti Luca Miggiano Daniel Pagnoni Cheryl Potter Erhard Schoewel, Chairman Andrew Weston-Webb
Company Secretary
Catherine Goates
Independent Auditors
PricewaterhouseCoopers LLP Chartered Accountants and Statutory Auditors 1 Embankment Place London WC2N 6RH
Other Information
7 2 — I G LO F O O DS H O L D I N G S L I M IT E D A N N UA L R E P O RT 2 0 1 4


Iglo Foods Holdings Lim
ited Annual Report &
Financial Statements 2014
IGLO FOODS HOLDINGS LIMITED 5 New SquareBedford Lakes Business Park FelthamMiddlesexTW14 8HA
www.iglo.com