IETE July August 2007 (Main File)
146
IETE TECHNICAL REVIEW The Institution of Electronics and Telecommunication Engineers ISSN 0256-4602 SUBSCRIBER COPY : NOT FOR RESALE VOLUME 24 NUMBER 4 JULY-AUGUST 2007 Let us do great things together ‘Interactive ECTs - A Focus on Rural India’ Special Issue to commemorate 50 th Annual Technical Convention
-
Upload
lazeezcoin -
Category
Documents
-
view
1.022 -
download
8
Transcript of IETE July August 2007 (Main File)
IETE TECHNICAL REVIEWThe Institution of Electronics and Telecommunication Engineers
ISSN 0256-4602
SUBSCRIBER COPY : NOT FOR RESALE
VOLUME 24 NUMBER 4 JULY-AUGUST 2007
Let us do great things together
‘Interactive ECTs - A Focus on Rural India’Special Issue
to commemorate50th Annual Technical Convention
President S Narayana
Vice-Presidents A K AgarwalR P BajpaiDavinder Kumar
Publications Committee
Chairman H O Agrawal
Co-Chairman K S Prakash Rao
Members T K DeS N GuptaH KaushalS K KshirsagarK Babu RaoT S RathoreR P SinghB P Srivastava
Coopted A K BhatnagarDilip Sahay
Special Invitee M Jagadesh Kumar
EDITORIAL BOARD
Chairman Dilip SahayMembers H O Agrawal
A K BhatnagarR G GuptaS S MotialNeeru Mohan BiswasH Kaushal
Secretary General V K Panday
Dy Managing Editor A P Sharma
IETE Technical Review is published bimonthly bythe Institution of Electronics and TelecommunicationEngineers. All rights of publication are reserved by theIETE.
Copyright and Reprint permission : Abstracting ispermitted with credit to the source. Libraries are permit-ted to photocopy for private use of readers. AnnualSubscription : Subscription and Advertising rates areavailable on request and can be seen on website: iete.org
The IETE Technical Review invites articlespreferably readable without mathematical expressions,state-of-the-art review papers on current and futuristictechnologies in the areas of electronics,telecommunication, computer science & engineering,information technology (IT) and related disciplines. Inaddition, informative and general interest articlesdescribing innovative products & applications, analysisof technical events, articles on technology assessment& comparison, new & emerging topics of interest toprofessionals are also welcome. While all the paperssubmitted will go through the same detailed reviewprocess, short papers and Practical Designs will receivespecial attention to enable early publication. Manuscriptsmay please be submitted in triplicate to the ManagingEditor along with a soft copy on floppy/CD/e-mail.Detailed guidelines to authors may be seen on IETEWebsite : http://www.iete.org under the headingPublications.Address for correspondence :Managing EditorIETE2, Institutional AreaLodi Road,New Delhi 110 003
Telephone : +91 (011)-2431820/30/40/50/ Ext:43Telefax : +91 (011) 24649429email : [email protected]
[email protected] : http://www.iete.org
FREE TO IETE CORPORATE MEMBERS(Cost of Production: Rs.19.00)
COPYRIGHT
It is the IETE policy to own the copyright of the scientific and technical papers it publishes on behalf ofthe authors and their employers, and to facilitate the appropriate reuse of this material by others. Authorsare required to sign an IETE copyright transfer form before publication. A copy of this form is availablein the most recent January issue of IETE publications, and online in IETE website:www.iete.org. IETEretains the authors’ and their employers’ right to reuse their material for their own purposes.
IETE TECHNICAL REVIEW The Institution of Electronics and Telecommunication Engineers
191
IETE TECHNICAL REVIEWPublished bimonthly by the Institution of Electronics and Telecommunication Engineers
July-August 2007 Vol 24 No 4
CONTENTS
Note : The Institution of Electronics and Telecommunication Engineers assumes no responsibility for the statements andopinions expressed by individual authors and speakers.
192 Guest Editorial
B L Deekshatulu
INVITED PAPERS
195 Broadband to Empower Rural India
Ashok Jhunjhunwala, David Koilpillai andBhaskar Ramamurthi
203 MIMO Communications - Motivation anda Practical Realization
G Kalyana Krishnan and V Umapathi Reddy
215 Role of Satellite Communication andRemote Sensing in Rural Development
A S Manjunath, D S Jain, Rajendra Kumar and RV G Anjaneyulu
225 Design of a TDD Multisector TDM MAC forthe WiFiRe Proposal for Rural BroadbandAccess
Anitha Varghese and Anurag Kumar
243 Trends in VLSI Technology - RuralApplications Perspective
K Lal Kishore
249 Temporally Adaptive, PartiallyUnsupervised Classifiers for RemoteSensing Images
Shilpa Inamdar and Subhasis Chaudhuri
257 Texture Feature Matching Methods forContent based Image Retrieval
Ivy Majumdar and B N Chatterji
271 Building a Strong Nation - The ECT way
R Sreehari Rao
277 Satellite Technology Utilization for Ruraland Urban India
S Pal and V S Rao
287 A Programmable Built-in Self-Test forEmbedded Memory Cores
Shibaji Banerjee, Dipanwita Roy Chowdhuryand Bhargab B Bhattacharya
313 Space Enabled ICT Applications for RuralUpliftment - Experience of ParticipatoryWatershed Development
P D Diwakar and V Jayaraman
CONTRIBUTED PAPER
323 Performance Analysis of SC DS-CDMAand MC DS-CDMA Systems overNakagami-m Fading Channel
S Anuradha, S Srigowri, K S Rama Krishna andK V V S Reddy
SHORT PAPERS
331 Design of a FIR Filtering Core for HighSpeed Application
M Arif
335 Interactive Education through ECT - AFocus on Rural India
S Arumuga Perumal
Special Issueon
‘Interactive ECTs - A Focus on Rural India’
Guest Editorial
Electronics & Communication Technologies (ECTs) is a vast canvas covering several inter connectedtopics and technologies, almost everything we need in our daily life: digital communications, VLSI, tele-medicine,tele-education, networking, signal processing, information for all etc. The theme of this special issue is“Interactive ECTs — A focus on rural India”. Of the many topics this issue could cover, IETE received 11invited papers from experts in this field, besides three contributed/short articles.
Prof Jhunjhunwala et al, in their paper “Broad band to empower rural India” mentions about the urban/ruraldivide and that the TV has made known this difference to the rural masses as to where they stand. The paperpresents many Broadband wireless technologies that could alleviate this gap to a great extent by providing higherdata speeds and system gain.
Dr V U Reddy et al, in their paper, deal with the spatial multiplexing aspects of Multiple Input Multipleoutput (MIMO) communication systems-an exciting development. Various architectures are discussed. Also,brought out how fading, considered usually as undesirable phenomena, can be exploited to attain high spectralefficiencies under MIMO.
Advances in Satellite communications, Remote sensing and GIS (Geographic Information System) haveprovided solutions to various national development programs, such as disaster management, tele-education, tele-medicine, creative 3D image representations of human organs etc, besides land use planning and integratedrural/urban development. Mr A S Manjunath et al discussed how advanced sensor technologies and dataprocessing techniques have made this possible.
Rural broadband access is developed with the help of the widely available and highly cost reduced WiFi chipsets. Prof Anurag Kumar et al, discussed in detail, the design issues related to Medium Access Control (MAC)for packet voice telephony and for Internet access.
Dr Lal Kishore has given a review of the various VLSI technologies, research work currently in vogue, andthe future perspective. Hosting of Websites/portals with information useful to rural areas is proving to be a boon.VLSI has its significant contribution in this.
Remote sensing with its high resolution and multi spectral sensors is providing valuable data/ information forland cover classification. Pre processing and data processing techniques have also commensurately advancedfor analyzing such data. Prof Subhasis Chaudhuri et al, describe a temporally adaptive partially unsupervisedclassification technique for remote sensing data.
Retrieving images, similar to a given query image, from a huge image data bank is a challenging task. Thisis because, ultimately human perception / understanding is involved in the interpretation of the word “similar” forvalidation/ evaluation of the retrieved images. Prof B N Chatterjee et al have presented, with a few examples,a host of techniques currently available in content-based image retrieval (CBIR).
Government’s vision to make India a developed nation by 2020 is not a simple task. Dr Srihari Raoenumerates the various ECT technologies that empower the rural people and transform them to a knowledgepowered PURA (providing urban amenities to rural areas).
Dr Surendra Pal et al, describe in their paper “Satellite Technology utilization for rural and urban India” thatspace communication has changed society beyond imagination. Many technological reversals have been seen:like the telephone which should have been on the wired network has become wireless, while the TV which wason wireless earlier, now works on cable. Satellite technology connects the total country irrespective of location.This paper describes also the services provided through satellites.
192

Testing in VLSI is important and complex. Prof Bhargav Bhattacharya et al developed a programmablebuilt in self-test for embedded memory cores for detecting neighborhood pattern sensitive faults including staticand active. A programmable BIST (built in self test) architecture is also designed.
Dr V Jayaraman et al, in their paper on “Use of GIS and MIS in participatory watershed development”discussed about the Earth Observation (EO) inputs and spatial data modeling for integrated land and waterresource development at grass roots level. EO inputs are judicious mix of GIS and MIS (managementinformation system). Implementation and monitoring through webGIS tools in a project mode in an area inKarnataka, has brought about significant impacts on natural resource conservation and living conditions in thearea.
Anuradha et al, in their contributed paper, discuss the simulation of Nakagami-m fading in wireless channelsusing generalized SC DS-CDMA and MC DS-CDMA schemes, using binary phase shift keying modulationtechniques. It is observed that bit error rate decreases with increasing m for both SC DS-CDMA and MC DS-CDMA.
This volume ends with two short papers, one on design of a FIR filtering core for high-speed application, andanother on interactive education through ECT for rural India.
I feel what we covered in this volume is only a drop in the ocean of the subject matter. We thank immenselyall the contributors of this special issue. Hope the reader gets a flavor of the ever changing/ growing ECT, andthe directions in which it is heading to reach the benefits to rural India.
Thanks to IETE for giving me this opportunity to be a guest editor and to interact with the many experts. Thepublication wing of IETE headquarters have done an excellent job of getting this volume printed in time.
Prof B L DeekshatuluCouncil Member & Distinguished Fellow IETE,
Guest Editor, IETE Technical Review,Visiting Professor University of Hyderabad.
Residence Address : 10-3-123/3, East Maredpally,Secunderabad 500 026 (AP).
Email [email protected]: 9908499081
GUEST EDITORIAL 193
Guest Editor
194
Dr B L Deekshatulu hasdistinguished himself through hisresearch and technological contributionsin the field of Control systems, DigitalImage Processing and Remote Sensing. Dr Deekshatulu obtained BSc (Engg -Electrical) degree in 1958 from theBanaras Hindu University and ME andPhD degrees from the Indian Instituteof Science (IISc), Bangalore. He was
awarded Martin Foster Medal by IISc, for Best PhD thesis. Hejoined as Lecturer in 1964 at IISc., Bangalore and became Professorin 1970 and continued in that position till 1976. Dr Deekshatuluvisited USSR during 1968 as a Government of India delegate forsetting up School of Automation at IISc, Bangalore.
Dr Deekshatulu worked as Visiting Scientist at the IBMWatson Research Centre, York Town Heights, New York, andat the Environmental Research Institute of Michigan during1971-72 on Digital Image Processing and Remote Sensing. Hedesigned and fabricated for the first time in India, Grey scale andcolor Drum Scanners for Computer Picture processing whichhas subsequently won him and his group a NRDC Award.
Dr Deekshatulu joined the National Remote Sensing Agency,Hyderabad as Head, Technical Division in April 1976 andbecame Director in January 1982 - promoted to the grade“Outstanding Scientist” in July 1989 and “DistinguishedScientist” (grade of Secretary) in July 1995 and retired fromNRSA in October 1996. He has been responsible for theupbringing of the National Remote Sensing Agency in all itsfacets and for executing National and State level projects inmany disciplines of Remote Sensing applications.
He has over 130 research publications to his credit. He hasguided 12 PhD Scholars and over 60 MTech. Students’dissertations. He has visited 27 countries in the world. He isFellow of many Scientific/Engineering Academies such as FNA,
FASc, FNAE, FNASc, Distinguished Fellow IETE etc. FellowIEEE (USA), Fellow Third World Academy of Sciences (Italy).His current interests are Remote Sensing Data Analysis, DigitalImage Processing and Neural Networks.
He is a recipient of many awards such as the Bharat Ratna,Sir M Visveswaraya Award for “Outstanding Engineer” in1984, NRDC Invention Awards in Jan 1986 and in Aug 1993,and Dr Biren Roy Space Science Award in 1988, “Padamsri”medal in Jan 1991 by President of India, Brahm Prakash Medalfor significant contributions to Engineering Technology, OmPrakash Bhasin Award for Science and Technology for 1995.Received “Sivananda Eminent Citizen Award” from VicePresident of India in Dec 1998 and Gold Medal from IndianGeophysical Union 1997. He was Chairman, National Committeeon International Geosphere, Biosphere Programme (IGBP) during1994-97, Chairman of Remote Sensing Applications Missions,India 1987-96. Awarded Boon Indrambarya Gold Medal byThailand Remote Sensing and GIS Association in November1999 in Hong Kong for contributions to Remote Sensing. Awarded2002 Aryabhatta Award by Astronautical Society of India, forlifetime contributions to Remote Sensing. Awarded DistinguishedAlumni Award from IISc, Bangalore.
Dr Deekshatulu was a UN / FAO consultant in Beijingduring November, 1981. He was the Government representativein the UN/ESCAP/RSSP Directors’ meetings and InterGovernmental Consultative Committee meetings from 1985-95. He was a UN/ESCAP Senior Consultant during September-November, 1996. He was Director of Centre for Space Scienceand Technology Education in Asia and the Pacific (CSSTE-AP),Affiliated to the United Nations, IIRS Campus, Dehra Dun,from November 1995 to April 2002.
Currently, Dr Deekshatulu is a Visiting Professor in theDept of Computer & Information Sciences, University ofHyderabad pursuing research and teaching in Image pro.
195
Paper No 125-A; Copyright © 2007 by the IETE.*The paper is based on and borrows from some recentarticles on Telecom in rural India [1-3].
IETE Technical ReviewVol 24, No 4, July-August 2007, pp 195-201
Broadband to Empower Rural IndiaASHOK JHUNJHUNWALA
ESB 331 A, TeNeT Office, 2nd Floor, Department of Electrical Engineering,Indian Institute of Technology Madras, Chennai 600 036, India.
DAVID KOILPILLAI AND BHASKAR RAMAMURTHI
Department of Electrical Engineering,Indian Institute of Technology Madras, Chennai 600 036, India.
email: [email protected]; [email protected]; [email protected]
comprises 250-300 households, and occupies an areaof 5 km2. Most of this is farmland, and typically thehouses are in one or two clusters. Villages are thusspaced 2-3 km apart, and spread out in all directionsfrom the market towns. The market centres aretypically spaced 30-40 km apart. Each such marketcentre serves a catchment of around 250-300 villagesin a radius of about 20 km. As the population and theeconomy grow, large villages morph continually intotowns and market centres. The villages arecharacterized by low incomes. About 85% of thehouseholds have an income less than Rs 3000/- permonth (amounting to Rs 600/- per month per person,assuming a family of five). Two-thirds of thehouseholds are dependent on agriculture for income,and this is often seasonal and dependent on rainfall.Rural India now has very little industry. Its people aremostly under-employed in agriculture. At the sametime, agricultural growth in India has slowed down to1% over the last decade, falling behind even thepopulation growth.
Fortunately, most of rural India has some form ofroad connectivity today (even though often much of itmay be in a bad condition) and at least one bus wouldply to each village every day. A railway station is alsonot very far off. Highways connect towns, which arerarely farther than 15 kms from any village. Also, asignificant number of villages are on the electricalgrid. However, the grid supplies power only duringthe period when the demand in urban (and industrial)areas is low. During peak-demand period the urbanareas have the capability of sapping all the powerproduced and the rural areas are supplied only whateveris leftover. So, even when the power flows into therural grid (0-18 hours per day, depending on theState), the voltage could fluctuate between 90V(reflecting higher demand) to 440 V (during nightswhen demand is low). Decentralized power generation
1. INTRODUCTION
URBAN India has been on the move over the lastten years and its growth has accelerated especially
during the last five. However, the same cannot be saidabout rural India. Urban Indians are full of confidence,but rural Indians do not see much of a future forthemselves. The only change in the lives of many ruralpeople is the availability of television, which in fact,has created greater aspirations amongst them. Theycan now clearly see the difference between life inurban India and rural India and cannot understandwhy they are being left so far behind.
In a democratic set up, where some form ofelection (central, state or local) takes place constitutealmost every year and a half, the feeling of deprivationamongst the rural people plays havoc, especially asrural people constitute 70% of India’s population. Everypolitician would be forced to promise more and moreto rectify this deprivation and Government policieswould be forced to be populist. Yet there are a fewconstructive programs which can really change life inrural India. Governments will be over-turned frequently,as no populist measure would rectify the great dividethat is getting accentuated with India’s urban growth.In fact, the policies required to sustain even urbangrowth would be under threat and would not beconsistently pursued. The only answer is a quick andurgent focus on rural areas towards ruraltransformation.
2. RURAL INDIA TODAY
Rural India consists of approximately 700 millionpeople, living in 638000 villages. The average village
INVITED PAPER
196 IETE TECHNICAL REVIEW, Vol 24, No 4, July-August 2007
in rural India may be the only answer to this problem inthe short run.
Telecom technology has advanced very rapidly.Even though only a small percentage of villages havereliable telecommunications connectivity today, thesituation is changing fast. With the rural thrust, it isreasonable to expect that most villages in India willhave mobile coverage as well as broadband Internetconnection within the next three to four years.
3. THE TELECOM SITUATION TODAY
The mobile revolution of the last five years hasseen base stations sprouting in most towns, owned andoperated by multiple operators, including the state-owned company BSNL. The base stations of BSNL,as well as those of the new operators are alsonetworked using optical fibre laid in the last five years.There is a lot of dark fibre, and seemingly unlimitedscope for bandwidth expansion.
The solid telecom backbone that knits the countryends abruptly at the towns and larger villages. Beyondthat, cellular coverage extends mobile telephoneconnectivity only up to a radius of 5 km, and then thetelecommunication services simply peter out. Cellularcoverage can and will grow, but this will depend on therate at which infrastructure costs and operating costsdrop, and the rate at which rural incomes rise. Fixedwireless telephones have been provided in tens ofthousands of villages, but it would be safe to concludethat the telecommunications challenge in rural Indiaremains the “last ten miles”. This is particularly true ifone were to include broadband Internet access inone’s scope, since the wireless technologies currentlybeing deployed can barely support dial-up speeds.
This then is the rural India in search of appropriatebroadband wireless technology: characterized by fatoptical-fiber POPa within 15-20 km of most villages,fairly homogenous distribution of villages in the plains,poor rural cellular coverage, and low incomes. Thelast aspect makes the provision of basictelecommunications as well as broadband internetservices all the more urgent, since ICT is an enablerfor wealth creation.
3.1. GSM and CDMA dominate today but3G will be available in time
Before we look at broadband technologies forrural India, let us take a look at mobile technologies oftoday (we will mostly focus on GSM, though CDMAsystems are also present in India today). It may not bereadily apparent that the bottleneck in rolling out services
to rural areas is not the cost of electronic equipment,but is actually due to the following:
i) The most significant cost component is thesite preparation and the erection of the tower.Infrastructure like roads and electricity mayhave to be first set up. The towers are about40 m tall, and require considerable amounts ofexpensive steel.
ii) The second highest contributor to the cost isthe electrical power infrastructure – RF cablesrunning to the top of the tower, the poweramplifiers, RF filtering and the transceivers.Roughly 55% of the cost of the base stationequipment is in these RF components [4].
iii) The maintenance of cell site infrastructurerequires local personnel who should be trainedto deal with the problems that arise in wirelessequipment.
iv) Availability of ultra-low cost (ULC) mobilephones at costs below Rs 1500/- with financingpackages.
v) Proper distribution infrastructure for phones,SIMs, spares and accessories in the remoteareas, and availability of basic training to usersso that they can use the phones properly.
vi) Billing and collection infrastructure for pre-and post-paid subscribers.
If one accepts these as the real bottleneck, then itis immediately evident that as soon as there is sufficientGSM voice coverage across India, we are alreadypast the key hurdles for upgrading. The cell sites andtowers are set up and maintenance, distribution, usertraining and billing/collection infrastructure put in place.
One cannot afford to deploy any new cell sites,but only add electronic equipment at existing cell sites.To deploy 3G equipment at a cell site, the Node B hasto be installed (instead of, or in addition to, the GSMBTS). The cost of Node B equipment has been fallingby approximately 40% each year over the last 4 years.Taken together with the fact that 3G offers morecapacity than GSM, the 3G Node B is just 50% moreexpensive today than the GSM BTS to deploy thesame voice capacity [4]. It has already been seen that55% of the cost of base station equipment is in the RF.Since a single 3G channel of 5 MHz replaces manyGSM channels of 200 kHz required achieving thesame capacity – the RF costs of 3G systems should,over time, be lower than that of GSM systems. Thus3G will eventually lead to cheaper equipment thanGSM, resulting in mobile broadband infrastructure inIndia.
4. BROADBAND FOR RURAL INDIA
When considering any technology for rural India,the question of affordability must be addressed first.Given the income levels, one must work backwards todetermine the cost of an economically sustainablesolution. Approximately 200 households in a typicalvillage having disposable incomes can spend on anaverage Rs 50-100/- per month for telephony and dataservices. Assuming an average of two public kiosksper village, the revenue of a public kiosk can be of theorder of Rs 5000/- per month. Apart from this, a fewwealthy households in each village can afford privateconnections. After providing for the cost of the terminals,it is estimated that, a cost of at most Rs 15000/- issustainable for the connection. This includes the userequipment, as well the per-subscriber cost of thenetwork equipment and infrastructure (towers) linkingthe user up to the optical fiber POP.
4.1. Coverage, system gain, and cost oftowers
It has been mentioned that one needs to cover aradius of 15-20 km from the fibre POP using wirelesstechnology. The ‘system gain’ is a measure of the linkbudget available for overcoming propagation loss andpenetration losses (through foliage and buildings), whilestill guaranteeing satisfactory system performance.Mobile cellular telephone systems have a system gaintypically of 150-160 dB, and achieve indoor penetrationwithin a radius of about 5 km. They do this with BaseStation towers of 40 m height, which cost about Rs500,000/- each. If a roof-top antenna is mounted at thesubscriber-end at a height of 6 m from the ground,coverage can be extended up to 15-20 km. When thesystem gain is lower at around 135 dB, as in any line-of-sight system, the coverage is limited to approx 10km and the antenna-height at the subscriber-end hasto be 10 m in order to clear the tree tops. Thisincreases the cost of the installation by about Rs 1000/- per connection.
Thus, roof-top antennas in the villages are a mustif one is to obtain the required coverage from the fiberPOP. A broadband wireless system will also need asystem gain of around 150 dB if it is to be deployedwith 6 m poles. This system gain may be difficult toobtain at the higher bit-rates supported by emergingtechnology, and one may have to employ taller poles inorder to support higher bit-rates at distant villages.
There is an important relationship betweencoverage and the heights of the towers and poles, andthus, indirectly, their cost. The Base Station tower
must usually be at least 40 m high even for line-of-sight deployment, as trees have a height of 10-12 mand even in the plains, one can expect a terrain variationof at least 20-25 m over a 15-20 km radius. TallerBase Station towers will help, but the cost goes upexponentially with height. A shorter tower will meanthat the subscriber-end installation will need a 20 mmast. At around Rs 20,000/-, this is substantially costlierthan a pole, even if the mast is guyed and not self-standing. The cost of 250-300 masts of this type isvery high compared to the incremental cost of a 40 mtower over a 30 m one. With 40 m towers, poles aresufficient at the subscriber-end, and only rarely needto be more than 12 m high.
In summary, for a cost-effective solution, the systemgain should be of the order of 150 dB (at least for thelower bit rates), a 40 m tower should be deployed atthe fiber POP, and roof-top antennas with 6-12 mpoles at the subscriber-end. The cost per subscriber ofthe tower and pole (assuming a modest 300 subscribersper tower) is Rs 3000/-. This leaves about Rs 12000/-per subscriber for the wireless system itself, inclusiveof both the infrastructure and terminal sides.
4.2. What constitutes broadband?
The Telecom Regulatory Authority of India hasdefined broadband services [4] as those provided witha minimum data rate of 256 kbps. At this bit-rate,browsing is fast, video-conferencing can be supported,and applications such as telemedicine and distanceeducation using multi-media are feasible. There is nodoubt that a village kiosk could easily utilize a muchhigher bit-rate, and as technology evolves, this too willbecome available. However, it is important to notethat even at 256 kbps, since kiosks can be expected togenerate a sustained flow of traffic, 300 kiosks willgenerate of the order of 75 Mbps. This is a non-triviallevel of traffic to carry over the air in each BaseStation, even with a spectrum allocation of 20 MHz.
4.3. Suitability of broadband wirelesstechnologies
One of the pre-requisites for any wirelesstechnology for it to cost under Rs 12,000/- is that itmust be a mass-market solution. This will ensure thatthe cost of the electronics is driven down by volumesand competition to the lowest possible levels. As anexample, both GSM and CDMA mobile telephonetechnologies can today meet the above cost target,(however, an even lower cost is needed for a non-broadband technology since the services provided arelimited).
ASHOK JHUNJHUNWALA et al : BROADBAND TO EMPOWER RURAL INDIA 197
198 IETE TECHNICAL REVIEW, Vol 24, No 4, July-August 2007
The third-generation cellular telephone technologieswill probably continue to meet this cost target whileoffering higher bit-rate data services. However, theywill not be able to provide broadband services asdefined above (as at most they will provide 64 kbps toeach user).
If one were to turn one’s attention to recentlystandardised broadband technologies such asWiMAX-d (IEEE 802.16d) [5], it is found that atpresent, the volumes are low and costs high. Of these,WiMAX-d has a lower system gain than the others(which are all around the required 150 dB). All ofthem will give a spectral efficiency of around 2 bps/Hz/cell (after taking spectrum re-use into account),and thus can potentially deliver 40 Mbps at each BaseStation with a 20 MHz allocation. However, high costdue to low volumes is the inhibitory factor with thesetechnologies.
It is likely that one or more OFDMA-basedbroadband technologies will become widely acceptedstandards soon. One such technology is WiMAX-e(IEEE 802.16e) [6] that is emerging rapidly. Thesewill certainly have a higher spectral efficiency, andmore importantly, if they become popular and successful,the cost will be low. However, it will be several yearsbefore a widely-adopted technology derives the benefitsof market size and the cost drops to affordable levelsfor rural India. The obvious question is whether thereare alternatives in the interim that meet our performanceand cost objectives.
4.4. Near-term Technologies
4.4.1. Broadband CorDECT technology
One of the earliest and most widely deployedexamples of such re-engineering is the corDECTWireless Access System developed in India [7]. Itprovided toll-quality voice service and 35/70 kbpsInternet access to each subscriber without thebandwidth having to be shared. The next-generationBroadband corDECT system has also been launchedrecently, capable of supporting 70 Mbps per cell witha 5 MHz bandwidth (supporting 144 full-duplex 256kbps connections simultaneously). With this system,each subscriber will get 256 kbps dedicated Internetaccess, in addition to toll-quality telephony. Thesesystems are built around the electronics of the EuropeanDECT standard, which was designed for local areatelephony and data services.
Broadband corDECT incorporates addedproprietary extensions to the DECT physical layer
that increase the bit-rate by three times, while beingbackward compatible to the DECT standard. Thus,the spectral efficiency goes up three times whencompared to conventional DECT. Additionally, dual-polarization antennas have been used to exploitpolarization isolation while till operating within theDECT MAC framework, and further double spectralefficiency. More importantly, all this has been donewhile retaining the use of the low-cost DECT chipsets.
The system gain in Broadband corDECT for 256kbps service is 125 dB. This can be increased by afew dB, where required, by increasing the antennagain at the subscriber-end (which is currently 11 dBi).This is sufficient for 10 km coverage under line-of-sight conditions (40 m tower for BS and 10-12 m poleat subscriber side). A repeater is used, as in thecorDECT system, for extending the coverage to 25km. The corDECT system, and now the broadbandcorDECT system, both meet the rural price-performance requirement comfortably, but with theadditional encumbrance of 10-12 m poles and onelevel of repeaters. The first-generation technology isproven in the urban and rural Indian environment, andmuch is known about how to deploy it successfully.The Broadband corDECT system works with thesame deployment strategy. It is being deployed insignificant numbers beginning 2007.
4.4.2. WiFi rural extension (WiFiRe) [8]: Anew WiFi-based wide-area ruralbroadband technology
In recent years, there have been some sustainedefforts to build a rural broadband technology usingWiFi chipsets. The WiFi bit rates go all the way upto 54 Mbps. The system gain is about 132 dB for11 Mbps service, and as in corDECT, one requires a40 m tower at the fibre POP and 10-12 m poles at thesubscriber-end. The attraction of WiFi technology isthe de-licensing of spectrum for it in many countries,including India. In rural areas, where the spectrum ishardly used, WiFi is an attractive option, provided itslimitations when used over a wide-area are overcome.
Various experiments with off-the-shelf equipmenthave demonstrated the feasibility of using WiFi forlong-distance rural point-to-point links. The more seriousissue with regard to the 802.11 standard is that thecommonly supported MAC protocol is a Carrier SenseMultiple Access (CSMA) protocol suited only for aLAN deployment. When standard WiFi equipment isused to set up a wide-area network, medium accessefficiency becomes very poor, and spectrum cannotbe re-used efficiently, even in opposite sectors of abase station.
A solution for this problem is to replace the MACprotocol of 802.11 with a MAC protocol more suitedto wide-area deployment. Such a new MAC, christenedWiFiRe, has indeed been defined [8] carefully suchthat a low-cost WiFi chipset can still be used, and thein-built WiFi MAC in it can be by-passed. The newMAC can be implemented on a separate general-purpose processor with only a modest increase incost. With the new WiFiRe MAC, it is estimated thatusing a single WiFi carrier, one can support about 25Mbps (uplink + downlink) per cell. This would besufficient for about 100 villages in a 10-15 km radius.Repeaters, possibly operating on a different frequency,will be needed for covering more villages over agreater distance.
4.5. Tomorrow’s Broadband Technologies
In a few years time, we expect to see significantlyenhanced broadband technologies, which could providethe 150 dB system gain, even while offering dataspeeds of 256 kbps or more for each connection. Thethree most promising technologies are all standard-based and are therefore expected to meet the pricetargets required for Rural India. These technologiesare: (i) IEEE 802.16 m, (ii) 3GPP-LTE, (iii) 3GPP2-UMB.
We present each of these efforts in brief.
4.5.1. IEEE 802.16 m [6]
This is an OFDMA based standard emerging outof efforts of IEEE. The earlier version of the standardis IEEE 802.16 e which was finalized in 2006 and ispopularly known as WiMAX. This broadband wirelessstandard, using state of art modulation, coding, schedulingand multiplexing would use smart antennas to enablepeak data rates of 100 Mbpsec for mobile users in a20 MHz spectrum. The working group finalizing thestandard aims to finalize the requirements, channelmodel and evaluation methodology by May 2007 andmake a proposal to ITU-R Working Party 8F (WP8F)for IMT-advanced requirements by March 2008. Theprincipal stakeholders driving this effort are vendorsdeveloping 802.16 products, licensed carriers using802.16 products and members of WiMAX ForumTM.
4.5.2. 3GPP LTE [9]
The Third Generation Partnership Project (3GPP)Long Term Evolution (LTE) was started with feasibilitystudy on evolution of Universal Terrestrial RadioAccess Network (UTRAN) in 2004 and grew withthe recommendations for delivery of mobile broadband
services by Next generation Mobile Networks(NGMN) initiative in 2006. A Technical Report (TR25.913) provides detailed requirements, which includedownlink peak date rate of 100 Mbps within a downlinkspectrum of 20 MHz using the OFDMA technology.The uplink peak data rate is expected to be 50 Mbpswith a 20 MHz uplink spectrum using SC-FDMAtechnique. It is proposed to support 200 users in activestate in each cell. The users are expected to get highperformance even with mobility as high as 120 Kmph.MIMO is expected to be used and an enhancedmultimedia service is expected to be a part of thestandard.
4.5.3. 3G-PP2 [10]
The CDMA Development group (CDG) iscollaborating with Third generation Partnership Project2 (3GPP2) to define Ultra Mobile Broadband (UMB)standard as an evolution of CDMA 2000. The systemsrequirement document was approved in May 2006and uses scalable bandwidth up to 20 MHz. Theforward direction peak data rate is expected to be ashigh as 500 Mbps in fixed and 100 Mbps in mobileenvironment using OFDMA. The reverse directiondata rate is to be 150 Mbps in fixed and 50 Mbps inmobile environment using qusi-orthogonal transmissionbased on OFDMA, together with non-orthogonal usermultiplexing with layered superposed OFDMA (LS-OFDMA). The reverse link also supports CDMA forcontrol and low-rate, low latency traffic. The advancedair interface agreement has been reached by Technicalspecification group C (TSG-C) based on a consolidatedframework proposal submitted by several operatorsand equipment vendors worldwide. The detailedtechnical specification of air interface framework isexpected by end of second quarter of 2007 and theTechnological Evolution Framework (TEF) outlinesthe evolution strategy beyond the 2010 time frame.
5. IMPLICATIONS FOR INDIA
These next generation broadband wirelessstandards are important for India, as it would enablebroadband wireless to reach urban as well as ruralIndia, just like GSM / CDMA mobiles do today. TheBroadband Wireless Consortium of India (BWCI) hasbeen formed (see: cewit.org.in) between operators,equipment manufacturers, component suppliers,academia and contribute the standardization effortsbased on OFDMA technologies defined above. Whilethese technologies would be available beginning 2009,the operators are starting to use Broadband corDECTin small towns and rural India. The next-generationwireless system would have the capability required to
ASHOK JHUNJHUNWALA et al : BROADBAND TO EMPOWER RURAL INDIA 199
200 IETE TECHNICAL REVIEW, Vol 24, No 4, July-August 2007
deliver broadband to all villages. The bit-pipes wouldbe there. The challenge beyond would be use the bit-pipes to transform the rural economy.
REFERENCES
1. Ashok Jhunjhunwala, Next Generation Wireless ForRural Areas, IJRSP, Special Issue on Rural WirelessCommunication, vol 36, no 3, June 2007.
2. Bhaskar Ramamurthi, Broadband wirelesstechnology for rural India, IJRSP, Special Issue onRural Wireless Communication, vol 36, no 3, June2007.
3. G Venkatesh & Ashwin Ramachandra, Can 3Gtechnologies benefit rural India?, IJRSP, SpecialIssue on Rural Wireless Communication, vol 36, no3, June 2007.
4. http://www.dotindia.com/ntp/broadbandpolicy2004.html
5. IEEE Standard for Local and metropolitan areanetworks, Part 16: Air Interface for Fixed BroadbandWireless Access Systems, IEEE Std 802.16™-2004(Revision of IEEE Std 802.16-2001).
6. Draft IEEE Standard for Local and metropolitan areanetworks “Part 16: Air Interface for Fixed andMobile Broadband Wireless Access Systems, IEEEP802.16e/D5, September 2004.
7. corDECT, Wireless access system, Technical reportof Midas Communication Technologies, Chennai,India, December 2000.
8. Paul Krishna, Varghese Anitha, Iyer Sridhar,Ramamurthi Bhaskar & Kumar Anurag, WiFiRe:Rural Area Broadband Access using the WiFi PHYand a new MAC, IEEE Commun Mag (USA), Jan2007 (accepted).
9. http//www.3gpp.org/ftp/pcg/Beijing workshoppresentation
10. www.3g-pp2/CDG Press Release (Aug 15, 2006).
Ashok Jhunjhunwala is Professorof the Department of ElectricalEngineering, Indian Institute ofTechnology, Chennai, India and wasdepartment Chair till recently. Hereceived his BTech degree from IIT,Kanpur, and his MS and PhD degreesfrom the University of Maine. From1979 to 1981, he was with WashingtonState University as Assistant Professor.Since 1981, he has been teaching at IIT, Madras.
Dr Jhunjhunwala leads the Telecommunications andComputer Networks group (TeNeT) at IIT Madras. This groupis closely working with industry in the development of a numberof Telecommunications and Computer Network Systems. TeNeTgroup has incubated a number of technology companies whichwork in partnership with TeNeT group to develop world classTelecom and Banking products for Rural Markets.
Dr Ashok Jhunjhunwala has been awarded Padma Shri inthe year 2002. He has been awarded Shanti Swarup BhatnagarAward in 1998, Dr Vikram Sarabhai Research Award for theyear 1997, Millennium Medal at Indian Science Congress in theyear 2000 and H K Firodia for “Excellence in Science &Technology” for the year 2002, Shri Om Prakash BhasinFoundation Award for Science & Technology for the year 2004,Awarded Jawaharlal Nehru Birth Centenary Lecture Award byINSA for the year 2006 and IBM Innovation and LeadershipForum Award by IBM for the year 2006. He is a Fellow ofINAE, IAS, INSA and NAS.
Dr Jhunjhunwala is a Director in the Board of SBI. He isalso a Board member of several companies in India, includingTTML, BEL, Polaris, 3i Infotech, Sasken, Tejas, NRDC, andIDRBT. He is member of Prime Minister’s Setup Scientific
Authors
Advisory Committee. His research interests are :Telecommunications and Wireless Systems; Technologies forRural Areas.
* * *
Bhaskar Ramamurthi, a foundingmember of TeNeT, holds an MS (1982)and a PhD (1985) degree in ElectricalEngineering from the University ofCalifornia, Santa Barbara, USA. In 1986,he joined the faculty at the Departmentof Electrical Engineering, Indian Instituteof Technology Madras (IIT-M), hisalma mater. He had earlier graduated fromIIT-M in 1980 with a BTech inElectronics Engineering. He is Dean (Planning) of IIT Madrassince 2005, the youngest faculty member ever to become a deanat IIT Madras.
Image Coding using Vector Quantization, an area in whichhe did some of his early work, formed the subject of his doctoralthesis. Soon after obtaining his doctorate, he joined the AT&TBell Laboratories, USA, where he worked on problems in indoorwireless communications.
Awarded University of California, Regents Fellowship for1980-81 and 1981-82. The paper titled “Perfect-Capture ALOHAfor Local Radio Communications” selected for reprinting in IEEEPress book on Key Papers in Multiple Access Communications.Joined the Fellowship of Indian National Academy of Engineeringin the year 2000, awarded Vasvik Award for Electronic Sciencesand Technology in the year 2000, awarded Tamil Nadu ScientistAward 2003 for Engineering and Technology.
Member of the Board of Directors in MidasCommunications Technologies, N-Logue Communications,Valued Epistemics (P) Ltd and Hon Director and Member,Governing Council, Centre of Excellence in WirelessTechnology (CEWiT), Chennai.
He is a member of National Frequency Allocation ReviewCommittee 2001, QoS Specifications Committee of TRAI forILD VoIP Services and member Sectional Committee of INAE.
His research interests: Modulation and coding for MobileCommunications; Wireless Communication Networks; Designand Implementation of Wireless Local Loop Systems.
* * *
David Koilpillai received theBTech degree from IIT Madras, and theMS and PhD degrees (all in ElectricalEngineering) from California Instituteof Technology, Pasadena, USA.
In June 2002, David joined IITMadras as a Professor of ElectricalEngineering, and is a member of theTeNeT group. During January 2007-July 2007, David is on leave from IITM and is working as theChief Scientist, Centre of Excellence in Wireless Technology(CEWiT), a public-private R&D initiative of the Govt of India.At CEWiT, David is leading a national project – BroadbandWireless Consortium of India (BWCI), focusing on emergingbroadband wireless standards. Prior to joining IITM, David wasat Ericsson USA for twelve years, where he held differenttechnical and managerial positions. In 2000, he became theDirector of the Ericsson’s Advanced Technologies and ResearchDepartment at RTP, North Carolina and a member of the globalmanagement team of Ericsson Mobile Platforms, an Ericsson
company developing all components of mobile phone technology.In this role, he was responsible for an R&D team of 75 engineersdeveloping GPRS/EDGE handset technology, with an annualbudget of US $20 million. David has actively provided technicalinputs to Ericsson efforts in 3G standardization, and has beenpresenting extensively on 3G and cellular evolution. David’stechnical areas of expertise include 3G/3.5G cellular systems,broadband wireless systems, and DSP techniques for wirelesscommunications.
His technical contributions at Ericsson have resulted in 32US patents, 10 journal papers and 26 conference publications. In1999, David received the “Ericsson Inventor of the Year” award,the highest technical recognition within Ericsson. In addition, hehas received numerous management awards for contributions inthe areas of technical management and intellectual propertyrights. He has served as a technical expert for Ericsson intechnology-related litigations.
In November 2003, David was elected as Fellow of theIndian National Academy of Engineering.
As part of IITM’s TeNeT group, David’s research andteaching focus is in the areas of DSP applications in wirelesscommunications. He is involved in research and consultancyprojects in wireless and cellular systems. Some of David’s projectsare listed below:
• DSP applications in cellular systems (WCDMA, HSPA,LTE, CDMA 2000)o Algorithms for improved PHY performance – CDMA
and OFDMo DSP techniques for software radio applicationso Cost-optimized GSM / EDGE basestation
* * *
ASHOK JHUNJHUNWALA et al : BROADBAND TO EMPOWER RURAL INDIA 201
203
Paper No 125-C; Copyright © 2007 by the IETE.
IETE Technical ReviewVol 24, No 4, July-August 2007, pp 203-213
MIMO Communications - Motivation anda Practical Realization
G KALYANA KRISHNAN AND V UMAPATHI REDDY, FIETE
Hellosoft India Pvt. Ltd., 8-2-703, Road No.12, Banjara Hills,Hyderabad 500 034, India.
email: {kallu, vur}@hyd.hellosoft.com
Under rich scattering environment, Multiple Input Multiple Output (MIMO) systems havethe potential to achieve capacities inconceivable by Single Input Single Output (SISO)systems. This makes it one of the most exciting developments to have occurred in wirelesscommunications. Within a short duration, it has matured from a reasearch topic into atechnology to find a place in upcoming wireless communication standards. This paperfocuses on the spatial multiplexing aspects of MIMO. Starting from AWGN channels, we bringout how fading, which is typically an undesirable phenomenon, can be gainfully exploited toattain large capacities under MIMO configuration. We first briefly discuss some MIMOarchitectures initially designed to realize a large portion of the theoretical MIMO capacity,namely V-BLAST (Vertical Bell Labs Layered Space-Time) and D-BLAST (Diagonal BLAST),and then describe briefly the conventional V-BLAST receivers and a receiver that attainsnear optimal performance while keeping the complexity low. The combination of OrthogonalFrequency Division Multiplexing (OFDM) and MIMO is introduced as a simple method to applyMIMO communication in a delay spread environment. Taking the example of Wireless LocalArea Network (WLAN) standard IEEE 802.11n , we see how the research developments havebeen incorporated in a practical system.
the research developments are reflected in upcomingstandards, for example, IEEE 802.11n [5].
The remainder of the paper is organized as follows.Section 2 brings out the huge potential of the MIMOsystem. We attempt to convey how fading channels,considered as unfavourable channels, can yield veryhigh data rates with multiple transmit and receiveantennae. This section is based on the excellenttreatment provided in [7]. In section 3, we discuss thearchitectures that are devised to exploit the promisedcapacity of MIMO. A popular architecture known asV-BLAST is discussed in section 4. In this section,we also describe a low complexity technique forVBLAST decoding. In section 5, we see how all thetechniques have been incorporated into the WLANdraft standard IEEE 802.11n [5]. Finally, the paper isconcluded in section 6.
In this paper, we use C interchangeably for bothspectral efficiency and capacity with correspondingunits bits/s/Hz and bits/s, respectively. Perfectknowledge of CSI is assumed at the receiver. Whenthe transmitter also has CSI information, we mentionit explicitly. Bold upper/lower case letters are usedfor matrices/vectors.
1. INTRODUCTION
SINCE Shannon laid down the fundamental capacity limits for single transmit - single receive system in
1948, communications, both wireline and wireless, havecome a long way. Although advanced modulation andcoding techniques have realized the capacity limits,our hunger for higher data rates has hardly got satiated.In [1], the authors describe in great detail how themaximum achievable data rates are severely limitedfor a SISO system. This limitation with SISO systemtriggered a search for alternatives within the constraintsof power and bandwidth. Seminal papers by Telatar[2] and Foschini [3] have activated intense researchon MIMO systems (see [4] and [1]). These papersreveal the massive potential of MIMO system due toexploitation of the spatial domain. Within a shortduration, it has matured from a research topic intoupcoming wireless communication standards [5, 6].
In this paper, we will focus on spatial multiplexingaspects of MIMO assuming CSI (Channel StateInformation) at the receiver. We will also discuss how
INVITED PAPER
204 IETE TECHNICAL REVIEW, Vol 24, No 4, July-August 2007
2. CAPACITY OF WIRELESS CHANNELS
In this section, starting from AWGN capacity, weinvestigate the capacity for MIMO channel to fullyreveal its immense potential. The treatment of thissection is heavily based on [7].
The capacity of Additive White Gaussian Noise(AWGN) channel is well known and is given by
æ P öCawgn = W log ç1 + ¾ ¾ ÷bits /s (1)
è N0W ø
where W is the channel bandwidth, P is the transmitsignal power and N0 is the one-sided noise powerspectral density. Here, log refers to logarithm to thebase 2. Replacing ¾ ¾ with SNR (Signal to Noise
Ratio), (1) can be expressed as
Cawgn = W log (1 + SNR) bits/s. (2)
Note from (1) that the two resources that control thecapacity are power and bandwidth. For fixed bandwidthW, as power increases
Cawgn¾ ¾ » log SNR bits/s/ Hz, (3)
W
which shows that for an increase in spectralefficiency by 1 bit/s/Hz, the power needs to be increasedby 3 dB. Thus, increasing spectral efficiency by addingmore bits per dimension (i.e., by choosing a higherconstellation size) is a power costly option. On the
Pother hand, as W ® ¥, Cawgn » ¾¾ log2 e, i.e.,
N0capacity is bounded even with infinite bandwidth. Thisis due to the fact that as power is finite, the signalpower spectral density becomes vanishingly small asW ® ¥. Note, however, that the capacity does increaselinearly with W if the SNR is held constant which callsfor an increase in P commensurate with W. This againis not practical beyond a limit as bandwidth is a scarceresource and also the power is limited. This explainsour helplessness and limitations in the pursuit of higherspectral efficiency and higher data rates with SISOcommunications. For a more detailed account of theseconstraints, see [1].
As a step towards investigating fading channels,we first examine deterministic channels. Consider firstthe Single Input Multiple Output (SIMO) case (SISOis a special case of this). With Mr receive antennas,the capacity is [7]
æ P öC = W log ç1 + || h ||2 ¾ ¾ ÷
è N0W ø
= W log (1+ || h ||2 S N R) bits/s, (4)
where h = [h1, h2, ..., hMr]T with hi denoting the fixed
channel gain from the transmit antenna to ith receivingantenna and the superscript T denoting transpose of avector. At high SNR, the spectral efficiency is nowgiven by
C¾ ¾ » log (|| h ||2 SNR) bits/s/Hz. (5)
W
Thus, we obtain a boost in the received SNR due tomultiple receive antennas. Though there is a SNRimprovement, increasing spectral efficiency is still adaunting task. Let us now examine what happens ifwe have multiple transmitters and single receiver whichcorresponds to Multiple Input Single Output (MISO)case.
Consider a MISO system with Mt transmitantennas and a single receiving antenna. If we constrainthe total transmitted power to P as before and allot atransmit power of P/Mt to each antenna, the capacityof MISO system, extending the SISO AWGN result,will be
æ || h||2 P öC = W log ç 1 + ¾ ¾ ¾ ¾ ÷ bits /s, (6)
è Mt N0W ø
where h = [h1, h2, ... , hMt]T with hi denoting the fixed
channel gain from ith transmit antenna to the receivingantenna. Now suppose, we have the knowledge ofCSI at the transmitter. Then, we can direct thetransmission to the receiving antenna using transmitbeamforming which will increase the received powerby Mt times, yielding the capacity of MISO system as
æ P öC = W log ç1 + || h ||2 ¾ ¾ ÷bits /s (7)
è N0W ø
Thus, the capacity of a MISO system with knowledgeof CSI at the transmitter is similar to that of a SIMOsystem.
In practical wireless channels, the received signalstrength fluctuates randomly (which is called fading).Consider a SIMO channel. Assume that channel variesslowly so that during each transmission, we have onlyone realization of the channel. Such a channel is calleda slow fading channel. The maximum data rate oftransmission for each realization is
æ P öC = W log ç1 + || h ||2 ¾ ¾ ÷bits /s (8)
è N0W ø
Clearly, for a target transmission rate R, one cannotguarantee that each realization of channel will giveC > R. Thus, strictly speaking, C = 0. To overcome thispredicament, we introduce the notions of outage and e– outage capacity. For a target transmission rate R,the system is said to be in outage with outage probability
PPout(R) = P [W log (1 + || h ||2 ¾ ¾ ) < R], and the
N0We –outage capacity is the maximum rate oftransmission R such that Pout(R) is less than e (see [7]for more details). For i.i.d Rayleigh frequency flatfading channels, the outage probability at high SNR isgiven by
1Pout(R) µ ¾ ¾ ¾ ¾ . (9)
SNRMr
In fading channels, at high SNR, errors occurmostly when the channel is in outage, and hence, the
1error probability also varies as ¾ ¾ ¾ ¾ . When theSNRMr
1error probability falls as ¾ ¾ ¾ ¾ , d is said to be theSNRd
diversity order of the system. Clearly, higher thediversity, smaller the error rate. Note that in the SIMOcase, the diversity obtained is Mr. This is because,there are Mr independent fading paths from transmitterto receiver and outage occurs only if all Mr paths arein fade. In general, if the data arrives through dindependent fade paths, the outage probability at high
1SNR will be proportional to ¾ ¾ ¾ . Thus, in slowSNRd
fading, diversity can be used to counter the ill effectsof fading.
Let us now assume that the transmission extendsover multiple, say L, independent fade realizations.Under this scenario, with receive CSI only, the channelcapacity is the average of the maximum rates that canbe obtained over the individual fade realizations
1 L æ P ö C = W ¾ S log ç1 + || hi ||2¾ ¾ ÷ bits /s. (10)
L i=1 è N0W ø
where hi denotes the channel vector in ith faderealization. In arriving at the above capacity, the samepower allocation over each fade interval is assumed.When the transmission extends over large number offade realizations, we consider it as a fast fadingscenario, and the diversity is obtained from the multipleindependent fade realizations.
Note that for finite L, the quantity given by the RHSof (10) is random, and with non-zero probability it willdrop below any target rate. However, as L ® ¥, theabove expression approaches a finite value given by
æ æ P ö ö C = WE ç log ç 1 + || hi ||
2 ¾ ¾÷ ÷ bits / s, (11)è è N0W ø ø
where the expectation E(.) is taken over the channelrealizations. This is called the ergodic capacity of thefast fading SIMO channel.
In the presence of only receive CSI, both slowand fast fading capacities are less than that of AWGNcapacity [7]. Thus, fading is clearly disadvantageousin SISO, SIMO and MISO cases.
We now consider a scenario with multiple transmitand receive antennas, and a deterministic channel H.The received signal for an Mt Mr MIMO system isgiven as
r = Hs + n, (12)
where H is the channel matrix of size Mr Mt with Mtand Mr denoting the number of transmit and receiveantennas, respectively. The element Hij correspondsto the channel tap between ith receive antenna and jthtransmit antenna. r is the received vector of sizeMr ´ 1, s is the transmitted data vector of size Mt 1and n is an i.i.d circularly symmetric complex Gaussiannoise vector of size Mr 1. The capacity of thisMIMO channel is given by [2]
æ 1 öC = log det ç IMr + ¾ ¾ HKsH† ÷ bits / s/ Hz, (13)
è N0W ø
where Ks = E (ss†) with the superscript† denotingHermitian transpose. With no channel knowledge atthe transmitter, it is reasonable to transmit equal powerfrom all transmitters which gives Ks = ¾ IMt.Substituting this for Ks in the above expression andafter some manipulations, we get
nmin æ SNR öC = S log ç1 +¾ ¾ li
2÷ bits /s / Hz, (14)i=1 è Mt ø
where nmin = min (Mt, Mr) li2 is the ith eigenvalue
Pof HH† and we substituted SNR for ¾ ¾ . Equation
N0W(14) conveys that the overall capacity of a deterministicMIMO channel can be viewed as the sum of individualcapacities of nmin parallel channels. This capacity ismaximized when all the eigenvalues are equal. Noting
KRISHNAN & REDDY : MIMO COMMUNICATIONS 205
206 IETE TECHNICAL REVIEW, Vol 24, No 4, July-August 2007
that singular values of H are the square roots of theeigenvalues of HH† and condition number of a matrixwith equal singular values is unity, the result (14)states that a MIMO channel with lower conditionnumber will yield larger capacity.
The deterministic case can be extended to thefading case in a straight forward manner assumingonly receiver CSI. We will also assume that the channeltap variances are such that the average receivedpower at each receiving antenna is same as the totaltransmit power P. The ergodic capacity of thefrequency flat fading MIMO channel (i.e., the channelbetween each transmit-receive antenna pair has nodelay spread) is given by [2]
é æ 1 öùC = max E êlog det ç IMr + ¾ ¾ ¾ HKsH† ÷ú
Ks:tr{Ks}<P ë è N0W øû
bits/s/Hz, (15)
where tr {Ks} gives total transmit power from allantennas. It was shown by Telatar [2] and Foschini[3] that under Rayleigh fading, the capacity of MIMOchannels (ergodic capacity or outage capacity) scaleslinearly with minimum of transmit/receive antennas.Thus, at high SNR, a 3 dB increase in power (andhence SNR) translates to nmin bits/s/Hz increase inspectral efficiency. To see this, consider a practicalscenario with Mr >> Mt and assume equal power fromall transmit antennas subject to the total power constraint.For the Rayleigh flat fading case, for each realizationof H, the columns of H tend to be orthogonal and forsuch case all the eigenvalues of HH† are equal to Mr.Then, (15) reduces to
æ SNR öC = nmin log ç1 + ¾ ¾ Mr ÷bits /s / Hz, (16)
è Mt ø
which shows that capacity scales with nmin. Thus,MIMO offers spatial multiplexing.
To emphasize the significance of fading channelsin the MIMO communications, let us look at thecapacity of an AWGN channel. In this case, for eachrealization, all the channel taps will be equal and Hbecomes a unit rank matrix, implying that there is onlyone non-zero eigenvalue. Hence, from (14),
æ SNR ö C = log ç1 + ¾ ¾ ¾ l1
2 ÷bits /s / Hz, (17)è Mt ø
where l12 is the only non-zero eigenvalue. That is, in
AWGN scenario, the capacity does not scale linearlywith nmin. Thus, in the MIMO case, the presence of
fading, far from being disadvantageous, is essential tomake high data rate communication possible.
3. MIMO CAPACITY ACHIEVINGARCHITECTURES
We now discuss briefly the transmit/receivearchitectures that can achieve the capacity promisedby MIMO system. We assume only receiver CSI asthis is the more practical scenario. Recall that a MIMOchannel decomposes into nmin parallel channels (see(14)). This means that the total capacity is the sumcapacity of the individual parallel channels, and outageoccurs for a slow fading channel only when
é æ nmin æ SNR öö ùPout (R) = P ê ç S log ç1+ ¾ ¾ li
2÷÷ < R úë è i=1 è Mt øø û
(18)
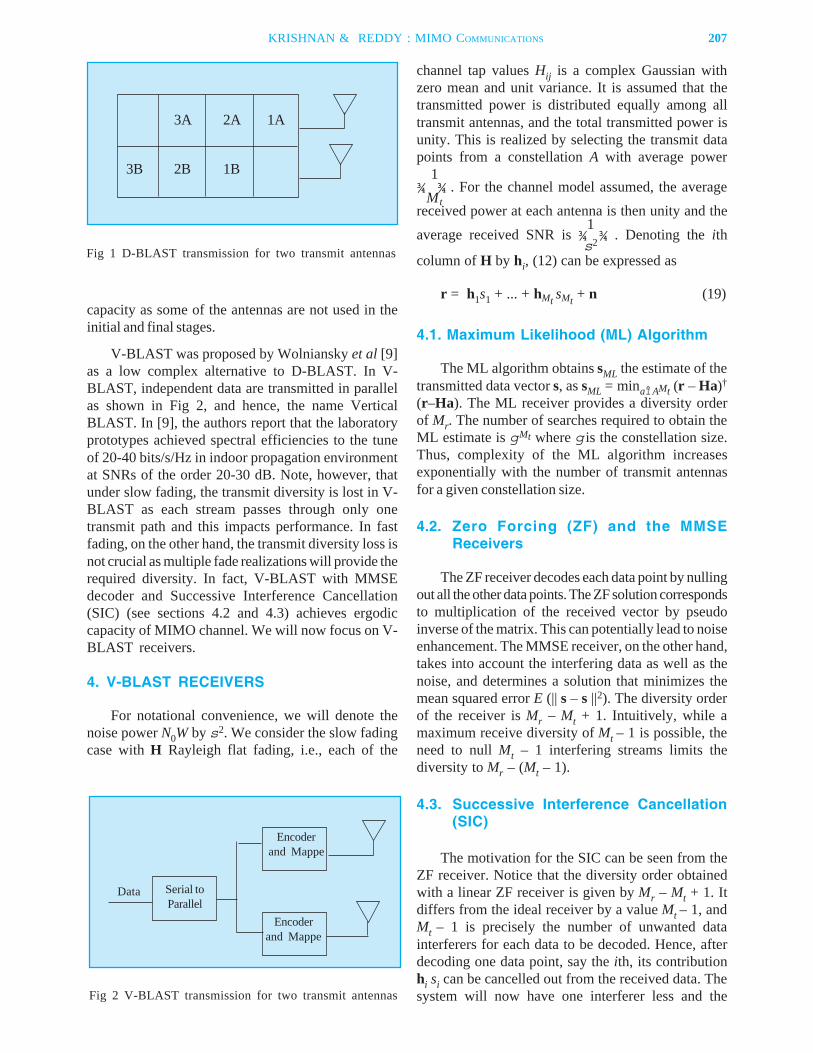
Thus, the outage depends not on the capacity of asingle parallel channel but on the combined capacity ofall the parallel channels. In the slow fading scenario,the capacity depends on individual realizations andsome of these channel paths between transmitter andreceiver could be in fade. Then, the performance willbe dictated by these channels unless the data is codedover other channel paths also. It is with this perspectivethat Foschini [8] proposed the D-BLAST algorithmwhere each data stream passes through all transmitantennas so that the data passes through all channelpaths thereby ensuring full diversity. This is explainedbelow for two transmit antennas case.
Each segment of data stream is coded into twoblocks, A and B, and transmitted as shown in Fig 1. Inthe first time interval, only 1A is transmitted from thefirst antenna. Soft decoding is performed directly asno transmission is present on the other antenna. In thenext time interval, 1B is transmitted from secondantenna and 2A is transmitted from first antenna (seeFig 1). This diagonal alignment of code words givesrise to the name D-BLAST (Diagonal BLAST). Atthe receiver, 1B is soft decoded by treating 2A as aninterference to be suppressed. Finally, 1A and 1B softoutputs are used to decode segment-1. Once thisdecoding is done, 1B is cancelled out from the datareceived during second time interval. The situation forsegment-2 is similar to that when segment-1 started.The process is repeated. An MMSE (Minimum MeanSquare Error) based D-BLAST achieves outagecapacity for any value of outage probability. However,D-BLAST suffers from error propagation and requiresstrong codes to prevent it. Also, for small number ofdata segments to be transmitted, there is a wastage of
capacity as some of the antennas are not used in theinitial and final stages.
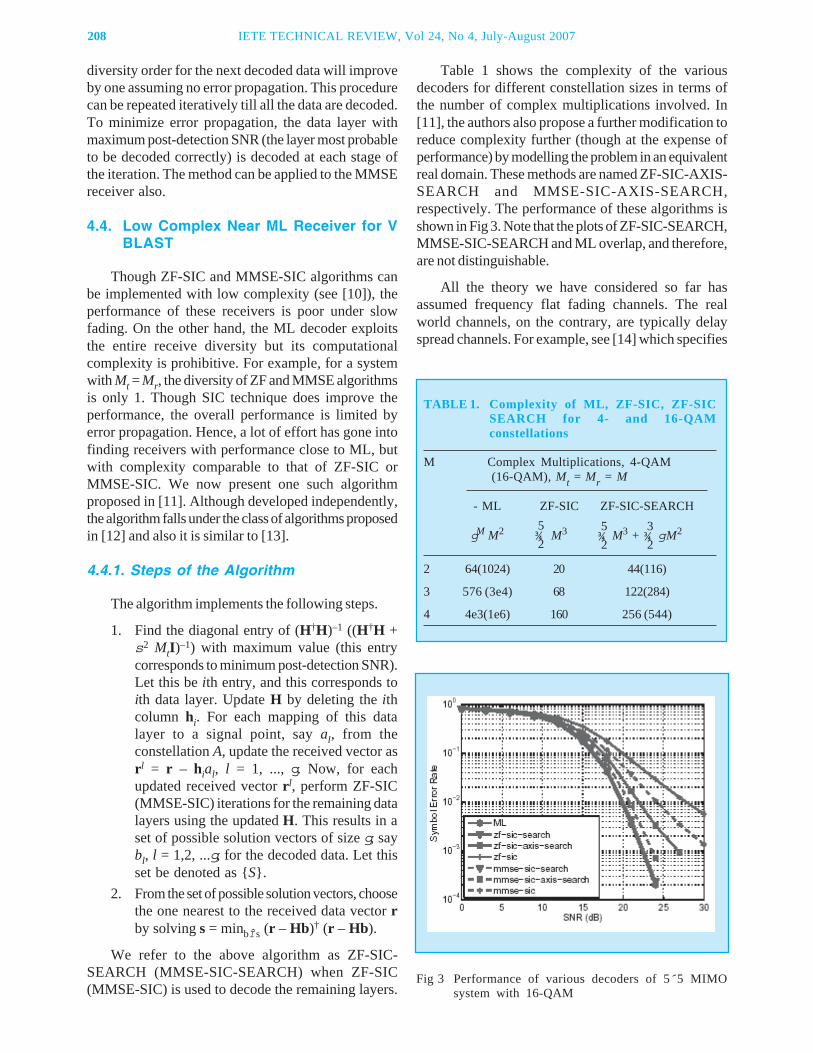
V-BLAST was proposed by Wolniansky et al [9]as a low complex alternative to D-BLAST. In V-BLAST, independent data are transmitted in parallelas shown in Fig 2, and hence, the name VerticalBLAST. In [9], the authors report that the laboratoryprototypes achieved spectral efficiencies to the tuneof 20-40 bits/s/Hz in indoor propagation environmentat SNRs of the order 20-30 dB. Note, however, thatunder slow fading, the transmit diversity is lost in V-BLAST as each stream passes through only onetransmit path and this impacts performance. In fastfading, on the other hand, the transmit diversity loss isnot crucial as multiple fade realizations will provide therequired diversity. In fact, V-BLAST with MMSEdecoder and Successive Interference Cancellation(SIC) (see sections 4.2 and 4.3) achieves ergodiccapacity of MIMO channel. We will now focus on V-BLAST receivers.
4. V-BLAST RECEIVERS
For notational convenience, we will denote thenoise power N0W by s2. We consider the slow fadingcase with H Rayleigh flat fading, i.e., each of the
channel tap values Hij is a complex Gaussian withzero mean and unit variance. It is assumed that thetransmitted power is distributed equally among alltransmit antennas, and the total transmitted power isunity. This is realized by selecting the transmit datapoints from a constellation A with average power
1¾ ¾ . For the channel model assumed, the average
Mtreceived power at each antenna is then unity and the
1average received SNR is ¾ ¾ . Denoting the ith
s2
column of H by hi, (12) can be expressed as
r = h1s1 + ... + hMt sMt + n (19)
4.1. Maximum Likelihood (ML) Algorithm
The ML algorithm obtains sML the estimate of thetransmitted data vector s, as sML = minaÎAMt (r – Ha)†
(r–Ha). The ML receiver provides a diversity orderof Mr. The number of searches required to obtain theML estimate is gMt where g is the constellation size.Thus, complexity of the ML algorithm increasesexponentially with the number of transmit antennasfor a given constellation size.
4.2. Zero Forcing (ZF) and the MMSEReceivers
The ZF receiver decodes each data point by nullingout all the other data points. The ZF solution correspondsto multiplication of the received vector by pseudoinverse of the matrix. This can potentially lead to noiseenhancement. The MMSE receiver, on the other hand,takes into account the interfering data as well as thenoise, and determines a solution that minimizes themean squared error E (|| s – s ||2). The diversity orderof the receiver is Mr – Mt + 1. Intuitively, while amaximum receive diversity of Mt – 1 is possible, theneed to null Mt – 1 interfering streams limits thediversity to Mr – (Mt – 1).
4.3. Successive Interference Cancellation(SIC)
The motivation for the SIC can be seen from theZF receiver. Notice that the diversity order obtainedwith a linear ZF receiver is given by Mr – Mt + 1. Itdiffers from the ideal receiver by a value Mt – 1, andMt – 1 is precisely the number of unwanted datainterferers for each data to be decoded. Hence, afterdecoding one data point, say the ith, its contributionhi si can be cancelled out from the received data. Thesystem will now have one interferer less and the
Fig 1 D-BLAST transmission for two transmit antennas
3A 2A 1A
3B 2B 1B
Fig 2 V-BLAST transmission for two transmit antennas
Data Serial toParallel
Encoderand Mappe
Encoderand Mappe
KRISHNAN & REDDY : MIMO COMMUNICATIONS 207
208 IETE TECHNICAL REVIEW, Vol 24, No 4, July-August 2007
diversity order for the next decoded data will improveby one assuming no error propagation. This procedurecan be repeated iteratively till all the data are decoded.To minimize error propagation, the data layer withmaximum post-detection SNR (the layer most probableto be decoded correctly) is decoded at each stage ofthe iteration. The method can be applied to the MMSEreceiver also.
4.4. Low Complex Near ML Receiver for VBLAST
Though ZF-SIC and MMSE-SIC algorithms canbe implemented with low complexity (see [10]), theperformance of these receivers is poor under slowfading. On the other hand, the ML decoder exploitsthe entire receive diversity but its computationalcomplexity is prohibitive. For example, for a systemwith Mt = Mr, the diversity of ZF and MMSE algorithmsis only 1. Though SIC technique does improve theperformance, the overall performance is limited byerror propagation. Hence, a lot of effort has gone intofinding receivers with performance close to ML, butwith complexity comparable to that of ZF-SIC orMMSE-SIC. We now present one such algorithmproposed in [11]. Although developed independently,the algorithm falls under the class of algorithms proposedin [12] and also it is similar to [13].
4.4.1. Steps of the Algorithm
The algorithm implements the following steps.
1. Find the diagonal entry of (H†H)–1 ((H†H +s2 MtI)–1) with maximum value (this entrycorresponds to minimum post-detection SNR).Let this be ith entry, and this corresponds toith data layer. Update H by deleting the ithcolumn hi. For each mapping of this datalayer to a signal point, say al, from theconstellation A, update the received vector asrl = r – hial, l = 1, ..., g. Now, for eachupdated received vector rl, perform ZF-SIC(MMSE-SIC) iterations for the remaining datalayers using the updated H. This results in aset of possible solution vectors of size g, saybl, l = 1,2, ...g, for the decoded data. Let thisset be denoted as {S}.
2. From the set of possible solution vectors, choosethe one nearest to the received data vector rby solving s = minbÎ s (r – Hb)† (r – Hb).
We refer to the above algorithm as ZF-SIC-SEARCH (MMSE-SIC-SEARCH) when ZF-SIC(MMSE-SIC) is used to decode the remaining layers.
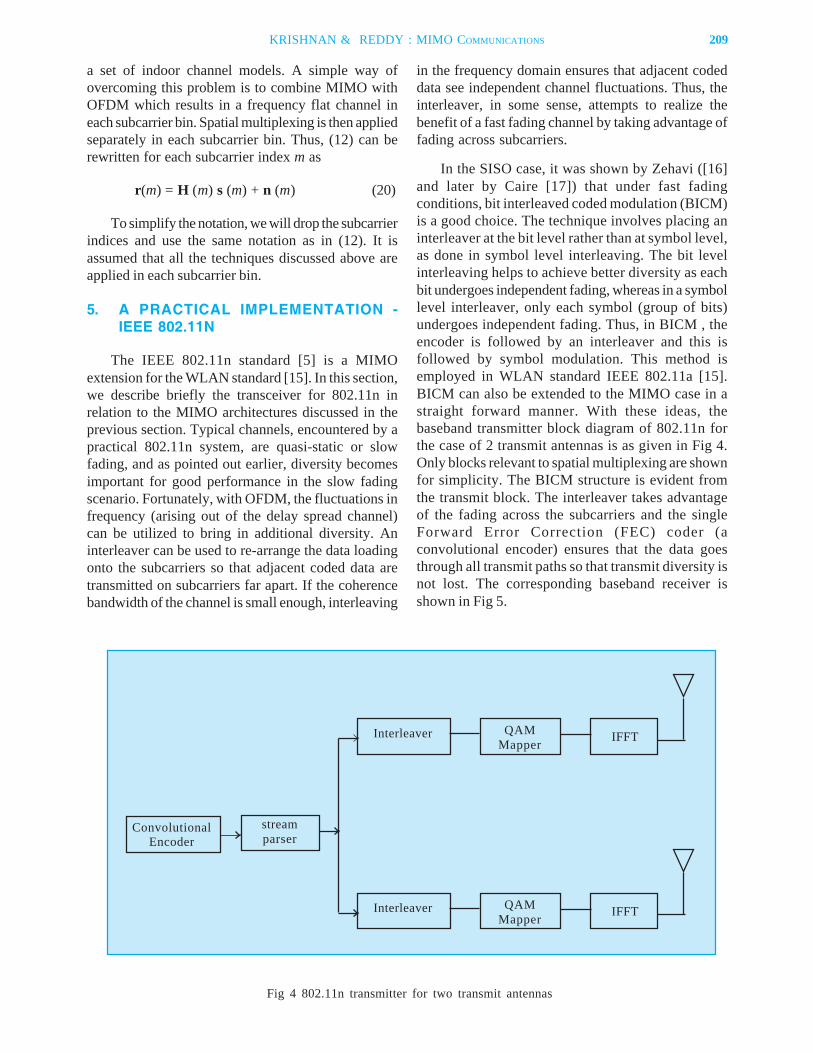
Table 1 shows the complexity of the variousdecoders for different constellation sizes in terms ofthe number of complex multiplications involved. In[11], the authors also propose a further modification toreduce complexity further (though at the expense ofperformance) by modelling the problem in an equivalentreal domain. These methods are named ZF-SIC-AXIS-SEARCH and MMSE-SIC-AXIS-SEARCH,respectively. The performance of these algorithms isshown in Fig 3. Note that the plots of ZF-SIC-SEARCH,MMSE-SIC-SEARCH and ML overlap, and therefore,are not distinguishable.
All the theory we have considered so far hasassumed frequency flat fading channels. The realworld channels, on the contrary, are typically delayspread channels. For example, see [14] which specifies
TABLE 1. Complexity of ML, ZF-SIC, ZF-SICSEARCH for 4- and 16-QAMconstellations
M Complex Multiplications, 4-QAM(16-QAM), Mt = Mr = M
- ML ZF-SIC ZF-SIC-SEARCH
gM M2 M3 M3 + gM2
2 64(1024) 20 44(116)
3 576 (3e4) 68 122(284)
4 4e3(1e6) 160 256 (544)
5¾2
5¾2
Fig 3 Performance of various decoders of 5´5 MIMOsystem with 16-QAM
3¾2
a set of indoor channel models. A simple way ofovercoming this problem is to combine MIMO withOFDM which results in a frequency flat channel ineach subcarrier bin. Spatial multiplexing is then appliedseparately in each subcarrier bin. Thus, (12) can berewritten for each subcarrier index m as
r(m) = H (m) s (m) + n (m) (20)
To simplify the notation, we will drop the subcarrierindices and use the same notation as in (12). It isassumed that all the techniques discussed above areapplied in each subcarrier bin.
5. A PRACTICAL IMPLEMENTATION -IEEE 802.11N
The IEEE 802.11n standard [5] is a MIMOextension for the WLAN standard [15]. In this section,we describe briefly the transceiver for 802.11n inrelation to the MIMO architectures discussed in theprevious section. Typical channels, encountered by apractical 802.11n system, are quasi-static or slowfading, and as pointed out earlier, diversity becomesimportant for good performance in the slow fadingscenario. Fortunately, with OFDM, the fluctuations infrequency (arising out of the delay spread channel)can be utilized to bring in additional diversity. Aninterleaver can be used to re-arrange the data loadingonto the subcarriers so that adjacent coded data aretransmitted on subcarriers far apart. If the coherencebandwidth of the channel is small enough, interleaving
in the frequency domain ensures that adjacent codeddata see independent channel fluctuations. Thus, theinterleaver, in some sense, attempts to realize thebenefit of a fast fading channel by taking advantage offading across subcarriers.
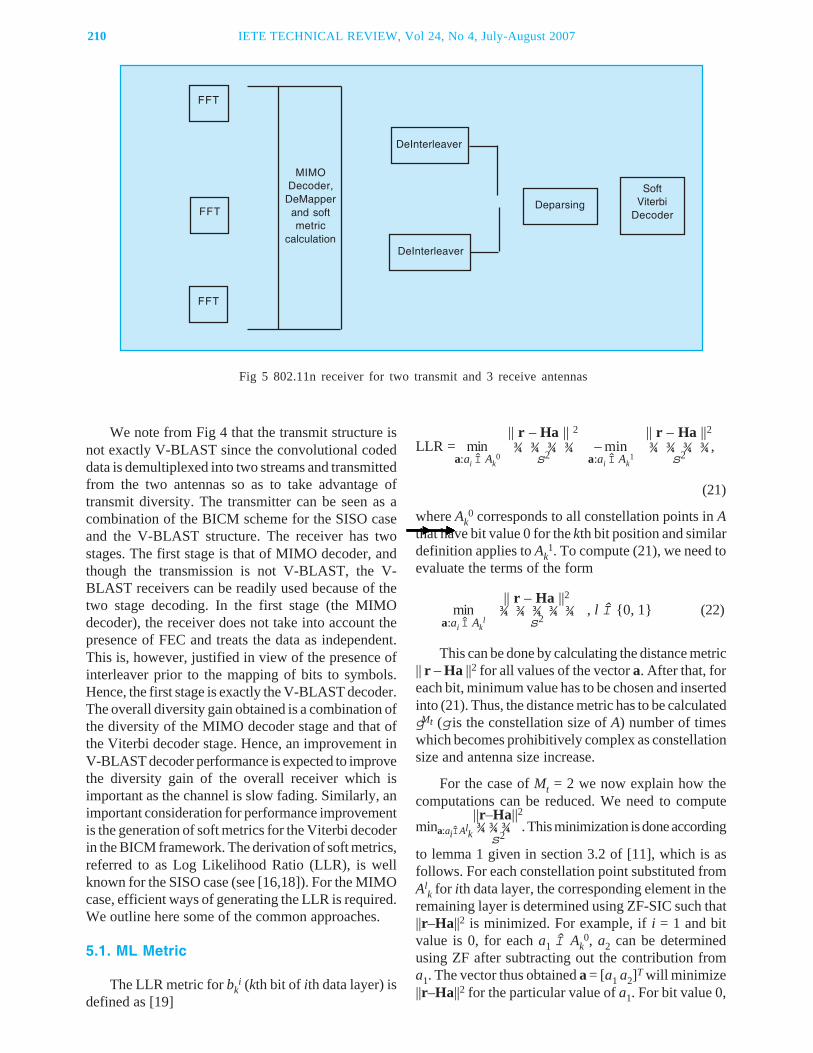
In the SISO case, it was shown by Zehavi ([16]and later by Caire [17]) that under fast fadingconditions, bit interleaved coded modulation (BICM)is a good choice. The technique involves placing aninterleaver at the bit level rather than at symbol level,as done in symbol level interleaving. The bit levelinterleaving helps to achieve better diversity as eachbit undergoes independent fading, whereas in a symbollevel interleaver, only each symbol (group of bits)undergoes independent fading. Thus, in BICM , theencoder is followed by an interleaver and this isfollowed by symbol modulation. This method isemployed in WLAN standard IEEE 802.11a [15].BICM can also be extended to the MIMO case in astraight forward manner. With these ideas, thebaseband transmitter block diagram of 802.11n forthe case of 2 transmit antennas is as given in Fig 4.Only blocks relevant to spatial multiplexing are shownfor simplicity. The BICM structure is evident fromthe transmit block. The interleaver takes advantageof the fading across the subcarriers and the singleForward Error Correction (FEC) coder (aconvolutional encoder) ensures that the data goesthrough all transmit paths so that transmit diversity isnot lost. The corresponding baseband receiver isshown in Fig 5.
Fig 4 802.11n transmitter for two transmit antennas
ConvolutionalEncoder
streamparser
Interleaver QAMMapper IFFT
Interleaver QAMMapper IFFT
KRISHNAN & REDDY : MIMO COMMUNICATIONS 209
210 IETE TECHNICAL REVIEW, Vol 24, No 4, July-August 2007
We note from Fig 4 that the transmit structure isnot exactly V-BLAST since the convolutional codeddata is demultiplexed into two streams and transmittedfrom the two antennas so as to take advantage oftransmit diversity. The transmitter can be seen as acombination of the BICM scheme for the SISO caseand the V-BLAST structure. The receiver has twostages. The first stage is that of MIMO decoder, andthough the transmission is not V-BLAST, the V-BLAST receivers can be readily used because of thetwo stage decoding. In the first stage (the MIMOdecoder), the receiver does not take into account thepresence of FEC and treats the data as independent.This is, however, justified in view of the presence ofinterleaver prior to the mapping of bits to symbols.Hence, the first stage is exactly the V-BLAST decoder.The overall diversity gain obtained is a combination ofthe diversity of the MIMO decoder stage and that ofthe Viterbi decoder stage. Hence, an improvement inV-BLAST decoder performance is expected to improvethe diversity gain of the overall receiver which isimportant as the channel is slow fading. Similarly, animportant consideration for performance improvementis the generation of soft metrics for the Viterbi decoderin the BICM framework. The derivation of soft metrics,referred to as Log Likelihood Ratio (LLR), is wellknown for the SISO case (see [16,18]). For the MIMOcase, efficient ways of generating the LLR is required.We outline here some of the common approaches.
5.1. ML Metric
The LLR metric for bki (kth bit of ith data layer) is
defined as [19]
|| r – Ha || 2 || r – Ha ||2LLR = min ¾ ¾ ¾ ¾ – min ¾ ¾ ¾ ¾ ,
a:ai Î Ak0 s2 a:ai Î Ak
1 s2
(21)
where Ak0 corresponds to all constellation points in A
that have bit value 0 for the kth bit position and similardefinition applies to Ak
1. To compute (21), we need toevaluate the terms of the form
|| r – Ha ||2min ¾ ¾ ¾ ¾ ¾ , l Î {0, 1} (22)
a:ai Î Akl s2
This can be done by calculating the distance metric|| r – Ha ||2 for all values of the vector a. After that, foreach bit, minimum value has to be chosen and insertedinto (21). Thus, the distance metric has to be calculatedgMt (g is the constellation size of A) number of timeswhich becomes prohibitively complex as constellationsize and antenna size increase.
For the case of Mt = 2 we now explain how thecomputations can be reduced. We need to compute
||r–Ha||2mina:aiÎAlk ¾ ¾ ¾ . This minimization is done according
s2
to lemma 1 given in section 3.2 of [11], which is asfollows. For each constellation point substituted fromAl
k for ith data layer, the corresponding element in theremaining layer is determined using ZF-SIC such that||r–Ha||2 is minimized. For example, if i = 1 and bitvalue is 0, for each a1 Î Ak
0, a2 can be determinedusing ZF after subtracting out the contribution froma1. The vector thus obtained a = [a1 a2]T will minimize||r–Ha||2 for the particular value of a1. For bit value 0,
Fig 5 802.11n receiver for two transmit and 3 receive antennas
FFT
FFT
FFT
MIMODecoder,
DeMapperand softmetric
calculation
DeInterleaver
DeInterleaver
Deparsing
SoftViterbi
Decoder
¾ such pairs will be identified and the computation of|| r – Ha ||2 will be performed only for these pairs. Ascomputations are done for bit values {0,1} and for i Î{1,2}, the total number of distance metric calculationswill be 2g, thus significantly reducing the complexitycompared to the direct approach which would involveg2 distance metric computations.
5.2. LLR metric for ZF MIMO Decoder
A simple but effective method was proposed in[19] to obtain LLR metrics for ZF criterion. Themotivation is as follows. With the ZF criterion, (12)gets transformed to
(H†H)–1 H†r = s + (H†H)–1 H†n
r = s + ñ. (23)
This can now be treated as a set of independentequations (ignoring the correlation between the noiseelements). Thus, the scenario becomes similar to theSISO case except that the noise variances should beaccounted carefully. The covariance matrix of thenoise is E(ññ†) = s2 (H†H)–1. The LLR metric for thekth bit of the ith layer is given by [19]
| ri – si|2LLR = min ¾ ¾ ¾ ¾ ¾ (24)ai:ai Î Al
k s2[(H†H)–1]ii
where ri corresponds to the ith element of r. Thesecalculations are exactly similar to SISO case, andhence, the low complexity approximations in [18] arealso valid for this case. A similar formulation forMMSE case is given in [20]. As the LLR metric iscomputed on individual streams, unlike in the ML case(section 5.1) where it is computed using all streamsjointly, the complexity is much lower.
For the ZF-SIC and MMSE-SIC, though superiorin performance to ZF and MMSE, it is notstraightforward to obtain good soft metrics due to thepossibility of error propagation among the decodeddata.
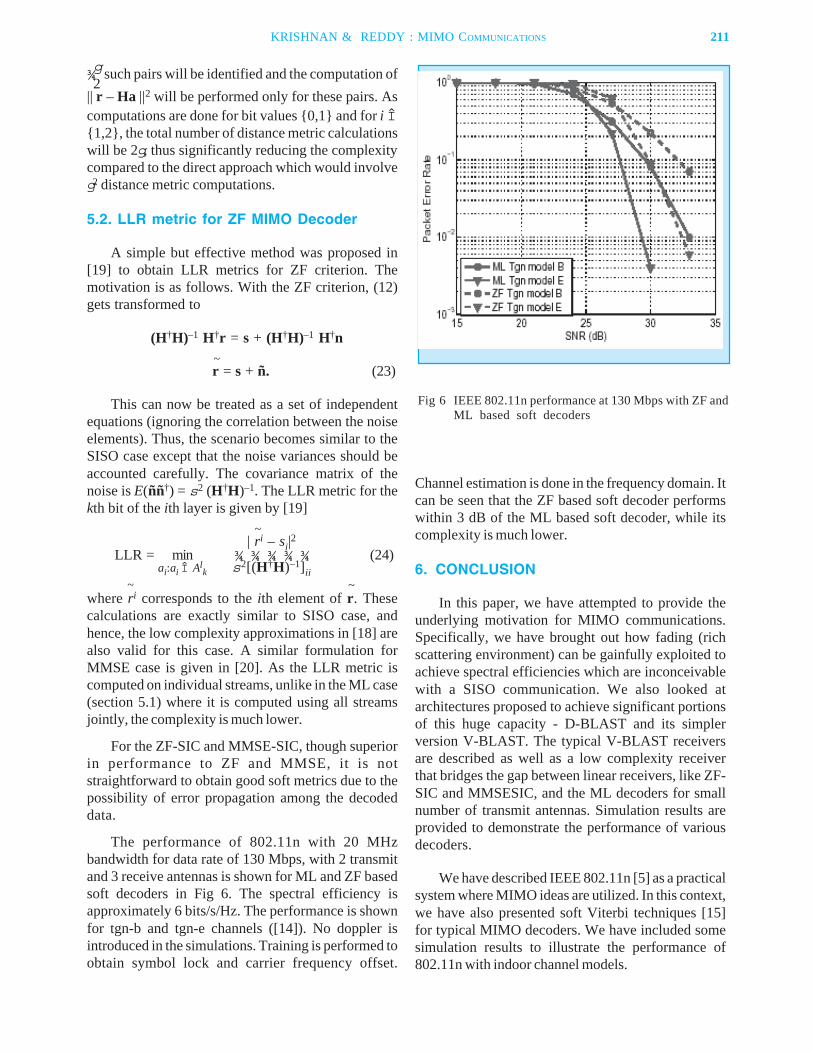
The performance of 802.11n with 20 MHzbandwidth for data rate of 130 Mbps, with 2 transmitand 3 receive antennas is shown for ML and ZF basedsoft decoders in Fig 6. The spectral efficiency isapproximately 6 bits/s/Hz. The performance is shownfor tgn-b and tgn-e channels ([14]). No doppler isintroduced in the simulations. Training is performed toobtain symbol lock and carrier frequency offset.
Fig 6 IEEE 802.11n performance at 130 Mbps with ZF andML based soft decoders
g2
~
~
~ ~
Channel estimation is done in the frequency domain. Itcan be seen that the ZF based soft decoder performswithin 3 dB of the ML based soft decoder, while itscomplexity is much lower.
6. CONCLUSION
In this paper, we have attempted to provide theunderlying motivation for MIMO communications.Specifically, we have brought out how fading (richscattering environment) can be gainfully exploited toachieve spectral efficiencies which are inconceivablewith a SISO communication. We also looked atarchitectures proposed to achieve significant portionsof this huge capacity - D-BLAST and its simplerversion V-BLAST. The typical V-BLAST receiversare described as well as a low complexity receiverthat bridges the gap between linear receivers, like ZF-SIC and MMSESIC, and the ML decoders for smallnumber of transmit antennas. Simulation results areprovided to demonstrate the performance of variousdecoders.
We have described IEEE 802.11n [5] as a practicalsystem where MIMO ideas are utilized. In this context,we have also presented soft Viterbi techniques [15]for typical MIMO decoders. We have included somesimulation results to illustrate the performance of802.11n with indoor channel models.
KRISHNAN & REDDY : MIMO COMMUNICATIONS 211
212 IETE TECHNICAL REVIEW, Vol 24, No 4, July-August 2007
7. REFERENCES
1. A J Paulraj, D A Gore, R U Nabar & H Bolcskei, Anoverview of MIMO Communications - a key togigabit wireless, in Proc IEEE, Feb 2004, vol 92(2),pp 198-218.
2. E Telatar, Capacity of multi-antenna gaussianchannels, European Transactions on Telecommuni-cations, vol 10, pp 585-595, Nov-Dec 1999.
3. G J Foschini & M J Gans, On limits of wirelesscommunications in a fading environment whenusingmultiple antennas, Wireless PersonalCommunications, vol 6, pp 311-335, March 1998.
4. S N Diggavi, N Al-dhahir, A Stamoulis & A RCalderbank, Great expectations: the value of spatialdiversity in wireless networks, in Proc IEEE, Feb2004, vol 92(2), pp 219-270.
5. Wireless LAN medium access control (MAC) andphysical layer (PHY) specification: Enhancementsfor higher throughput, IEEE Draft Standard802.11nD2, 2007.
6. Air interface for fixed and mobile broadband wirelessaccess systems: Physical and medium access controllayers for combined fixed and mobile operation inlicensed bands, IEEE 802.16e-2005, 2005.
7. D Tse & P Viswanath, Fundamentals of WirelessCommunication, Cambridge University Press, 2005.
8. G J Foschini, Layered space-time architecture forwireless communication in a fading environmentwhen using multiple antennas, in Bell LabsTechnical Journal, 1996, vol 1(2), pp 41-59.
9. P W Wolniansky, G J Foschini, G D Golden & R AValenzuela, V-BLAST: An architecture for realizingvery high data rates over the rich scattering wirelesschannel, in Proc ISSSE, Pisa, Italy, 1998.
10. B Hassibi, An efficient square-root algorithm forBLAST, in Proc ICASSP, Istanbul, Turkey, June2000, pp 737-740.
11. G K Krishnan & V U Reddy, High performance lowcomplexity receiever for V-BLAST, in Proc IEEESPAWC ’07, Helsinki, June 2007.
12. D W Waters & J R Barry, The chase family ofdetection algorithms for multiple-input multiple-output channels, in Proc IEEE Globecom ’04, Nov.-Dec 2004, vol 4, pp 2635-2639.
13. Y Li & Z Q Luo, Parallel detection for V-BLASTsystem, in Proc ICC ’02, 2002, vol 1, pp 340-344.
14. Vinko Erceg et al., Tgn channel models, IEEE802.11-03/940r4, May 2004.
15. Wireless LAN medium access control (MAC) andphysical layer (PHY) specifications high speedphysical layer in 5 GHz band, IEEE 802.11a, 1999.
16. E Zehavi, 8-psk trellis codes for a rayleigh channels,IEEE Trans on Comm., vol 40, pp 873-884, May1992.
17. G Caire, G Taricco & E Biglieri, Bit-interleaved codedmodulation, IEEE Trans on Information Theory, vol44, pp 927-946, May 1998.
18. F Tosato & P Bisaglia, Simplified soft-outputdemapper for binary interleaved COFDM withapplication to HIPERLAN/2, in Proc of IEEE ICC’02, 2002, vol 2, pp 664-668.
19. M R G Butler & I B Collings, A zero-forcingapproximate log-likelihood receiver for MIMObitinterleaved coded modulation, IEEE CommLetters, vol 8, pp 105-107, Feb 2004.
20. D Seethaler, G Matz, & F Hlawatsch, An efficientMMSE-based demodulator for MIMO bit-interleaved coded modulation, in Proc of the IEEEGlobecom ’04, Dallas, TX, USA, November 2004, pp2455-2459.
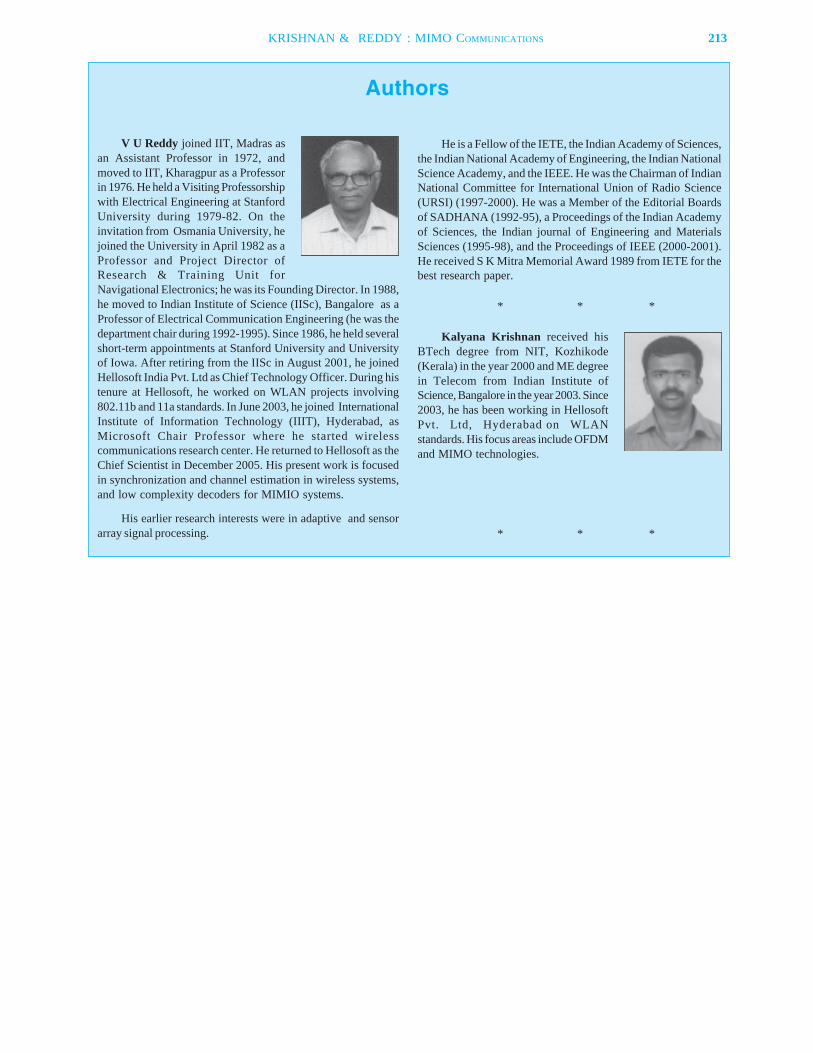
KRISHNAN & REDDY : MIMO COMMUNICATIONS 213
V U Reddy joined IIT, Madras asan Assistant Professor in 1972, andmoved to IIT, Kharagpur as a Professorin 1976. He held a Visiting Professorshipwith Electrical Engineering at StanfordUniversity during 1979-82. On theinvitation from Osmania University, hejoined the University in April 1982 as aProfessor and Project Director ofResearch & Training Unit forNavigational Electronics; he was its Founding Director. In 1988,he moved to Indian Institute of Science (IISc), Bangalore as aProfessor of Electrical Communication Engineering (he was thedepartment chair during 1992-1995). Since 1986, he held severalshort-term appointments at Stanford University and Universityof Iowa. After retiring from the IISc in August 2001, he joinedHellosoft India Pvt. Ltd as Chief Technology Officer. During histenure at Hellosoft, he worked on WLAN projects involving802.11b and 11a standards. In June 2003, he joined InternationalInstitute of Information Technology (IIIT), Hyderabad, asMicrosoft Chair Professor where he started wirelesscommunications research center. He returned to Hellosoft as theChief Scientist in December 2005. His present work is focusedin synchronization and channel estimation in wireless systems,and low complexity decoders for MIMIO systems.
His earlier research interests were in adaptive and sensorarray signal processing.
Authors
He is a Fellow of the IETE, the Indian Academy of Sciences,the Indian National Academy of Engineering, the Indian NationalScience Academy, and the IEEE. He was the Chairman of IndianNational Committee for International Union of Radio Science(URSI) (1997-2000). He was a Member of the Editorial Boardsof SADHANA (1992-95), a Proceedings of the Indian Academyof Sciences, the Indian journal of Engineering and MaterialsSciences (1995-98), and the Proceedings of IEEE (2000-2001).He received S K Mitra Memorial Award 1989 from IETE for thebest research paper.
* * *
Kalyana Krishnan received hisBTech degree from NIT, Kozhikode(Kerala) in the year 2000 and ME degreein Telecom from Indian Institute ofScience, Bangalore in the year 2003. Since2003, he has been working in HellosoftPvt. Ltd, Hyderabad on WLANstandards. His focus areas include OFDMand MIMO technologies.
* * *
215Paper No 125-B; Copyright © 2007 by the IETE.
IETE Technical ReviewVol 24, No 4, July-August 2007, pp 215-224
Role of Satellite Communication and RemoteSensing in Rural Development
A S MANJUNATH, D S JAIN, S RAJENDRA KUMAR, AND R V G ANJANEYULU
National Remote Sensing Agency, Balanagar, Hyderabad 500 037, India.email : [email protected]; [email protected]
The advances in Satellite Communication and Remote sensing has led to thedevelopment of solutions for various national development programs like National NaturalResource Management (NNRMS), disaster management, tele-education and e-Health careusing telemedicine. The advances in sensor technologies and image processing haveresulted in sensors with increased spatial, spectral and radiometric resolutions and provideimages with rich details for remote sensing applications.
India is a vast country with 29 states and 6 union territories with more than 1 billionpopulation, which is predominantly rural and distributed at distant geographical locationsapart from the high-density urban areas. Ensuring basic minimum health care to massesliving in remote rural areas is a top priority for any government. Tele-medicine using thesatellite communication as well as Fiber Optic communications is playing an important roleto address health care requirements of people living in remote areas, rural areas, soldiers inbattlefields etc. The Image processing techniques and advances in Database management ofimages and text made it possible to create 3D virtual images of human organs by usingimaging techniques from MRI, CT & Ultrasound.
The universalisation of education has become the top priority, especially for thedeveloping countries. But the extension of quality education to remote and rural regionsbecomes a Herculean task for a large country like India with multi-lingual and multi-culturalpopulation separated by vast geographical distances, and, in many instances, inaccessibleterrain. Satellites can establish the connectivity between urban educational institutions withadequate infrastructure imparting quality education and the large number of rural and semi-urban educational institutions that lack the necessary infrastructure.
This paper describes utilization of Satellite Communication and Remote sensing withadvanced techniques in providing solutions to areas of primary importance in ruraldevelopment such as harnessing of natural resources, education and healthcare.
soil and land degradation, mineral exploration,groundwater targeting, geomorphological mapping,coastal and ocean resources monitoring, environment,ecology and forest mapping, land use and land covermapping, urban studies, utility mapping, etc. Theinformation from these analyses can be archived in acentral database with suitable storage and retrievalmechanisms. Mobile information technology, which iscurrently dominated by cellular phones, personal digitalassistants (PDAs) and laptops can be used todisseminate this information with enhanced featuresleading to an information technology culture of‘anywhere’, ‘anytime’ to deliver a wide range of dataand services.
1.1. Role of Remote Sensing in Naturalresources utilisation
Any country’s development depends on its abilityto harness the natural resources like land, water,
INTRODUCTION
SPACE technology comprising of satellite basedcommunication and Remote sensing which acts as
an eye in the space, have been very powerful tools forvarious development plans of a nation. The applicationsof the space technology are only limited by the humanability to put them into use. Emerging trends in the roleof space technology in the areas of Rural Developmentlike natural resource utilization, education and healthcare are presented in the sections that follow.
1. SPACE TECHNOLOGY FOR RURALDEVELOPMENT
Natural resources can be estimated and monitoredusing Remote Sensing Satellite data and this has beenuseful in areas such as water resources, agriculture,
INVITED PAPER
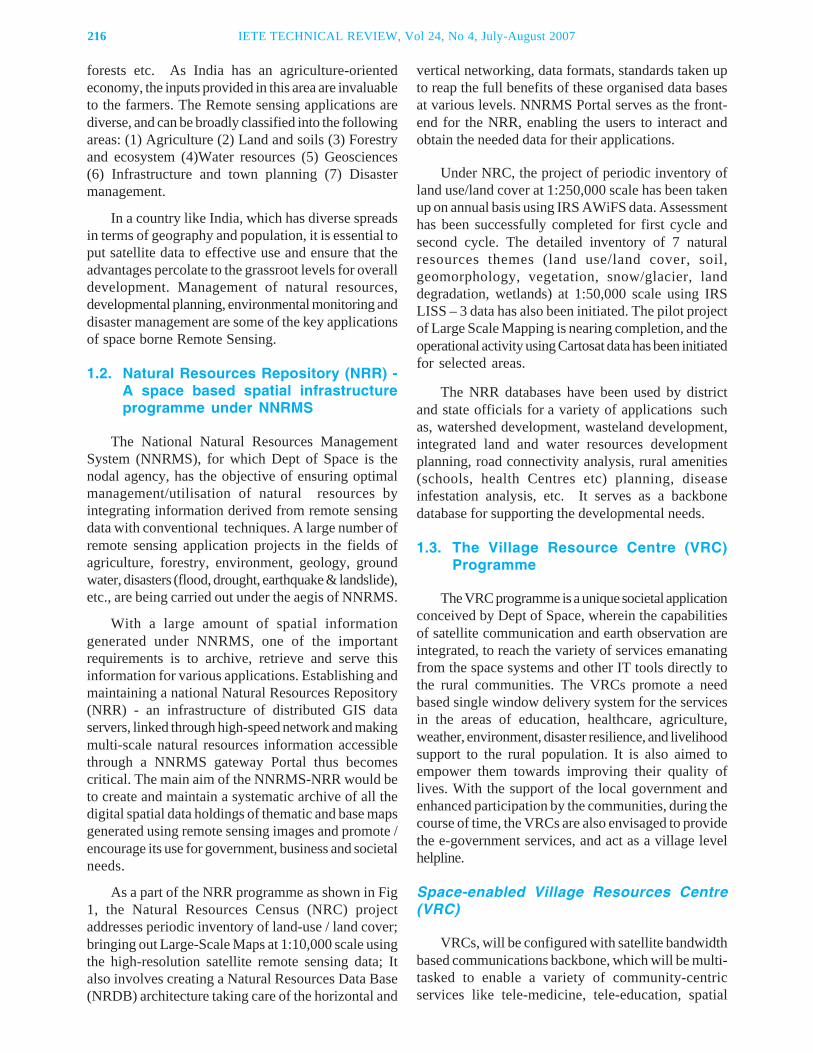
216 IETE TECHNICAL REVIEW, Vol 24, No 4, July-August 2007
forests etc. As India has an agriculture-orientedeconomy, the inputs provided in this area are invaluableto the farmers. The Remote sensing applications arediverse, and can be broadly classified into the followingareas: (1) Agriculture (2) Land and soils (3) Forestryand ecosystem (4)Water resources (5) Geosciences(6) Infrastructure and town planning (7) Disastermanagement.
In a country like India, which has diverse spreadsin terms of geography and population, it is essential toput satellite data to effective use and ensure that theadvantages percolate to the grassroot levels for overalldevelopment. Management of natural resources,developmental planning, environmental monitoring anddisaster management are some of the key applicationsof space borne Remote Sensing.
1.2. Natural Resources Repository (NRR) -A space based spatial infrastructureprogramme under NNRMS
The National Natural Resources ManagementSystem (NNRMS), for which Dept of Space is thenodal agency, has the objective of ensuring optimalmanagement/utilisation of natural resources byintegrating information derived from remote sensingdata with conventional techniques. A large number ofremote sensing application projects in the fields ofagriculture, forestry, environment, geology, groundwater, disasters (flood, drought, earthquake & landslide),etc., are being carried out under the aegis of NNRMS.
With a large amount of spatial informationgenerated under NNRMS, one of the importantrequirements is to archive, retrieve and serve thisinformation for various applications. Establishing andmaintaining a national Natural Resources Repository(NRR) - an infrastructure of distributed GIS dataservers, linked through high-speed network and makingmulti-scale natural resources information accessiblethrough a NNRMS gateway Portal thus becomescritical. The main aim of the NNRMS-NRR would beto create and maintain a systematic archive of all thedigital spatial data holdings of thematic and base mapsgenerated using remote sensing images and promote /encourage its use for government, business and societalneeds.
As a part of the NRR programme as shown in Fig1, the Natural Resources Census (NRC) projectaddresses periodic inventory of land-use / land cover;bringing out Large-Scale Maps at 1:10,000 scale usingthe high-resolution satellite remote sensing data; Italso involves creating a Natural Resources Data Base(NRDB) architecture taking care of the horizontal and
vertical networking, data formats, standards taken upto reap the full benefits of these organised data basesat various levels. NNRMS Portal serves as the front-end for the NRR, enabling the users to interact andobtain the needed data for their applications.
Under NRC, the project of periodic inventory ofland use/land cover at 1:250,000 scale has been takenup on annual basis using IRS AWiFS data. Assessmenthas been successfully completed for first cycle andsecond cycle. The detailed inventory of 7 naturalresources themes (land use/land cover, soil,geomorphology, vegetation, snow/glacier, landdegradation, wetlands) at 1:50,000 scale using IRSLISS – 3 data has also been initiated. The pilot projectof Large Scale Mapping is nearing completion, and theoperational activity using Cartosat data has been initiatedfor selected areas.
The NRR databases have been used by districtand state officials for a variety of applications suchas, watershed development, wasteland development,integrated land and water resources developmentplanning, road connectivity analysis, rural amenities(schools, health Centres etc) planning, diseaseinfestation analysis, etc. It serves as a backbonedatabase for supporting the developmental needs.
1.3. The Village Resource Centre (VRC)Programme
The VRC programme is a unique societal applicationconceived by Dept of Space, wherein the capabilitiesof satellite communication and earth observation areintegrated, to reach the variety of services emanatingfrom the space systems and other IT tools directly tothe rural communities. The VRCs promote a needbased single window delivery system for the servicesin the areas of education, healthcare, agriculture,weather, environment, disaster resilience, and livelihoodsupport to the rural population. It is also aimed toempower them towards improving their quality oflives. With the support of the local government andenhanced participation by the communities, during thecourse of time, the VRCs are also envisaged to providethe e-government services, and act as a village levelhelpline.
Space-enabled Village Resources Centre(VRC)
VRCs, will be configured with satellite bandwidthbased communications backbone, which will be multi-tasked to enable a variety of community-centricservices like tele-medicine, tele-education, spatial
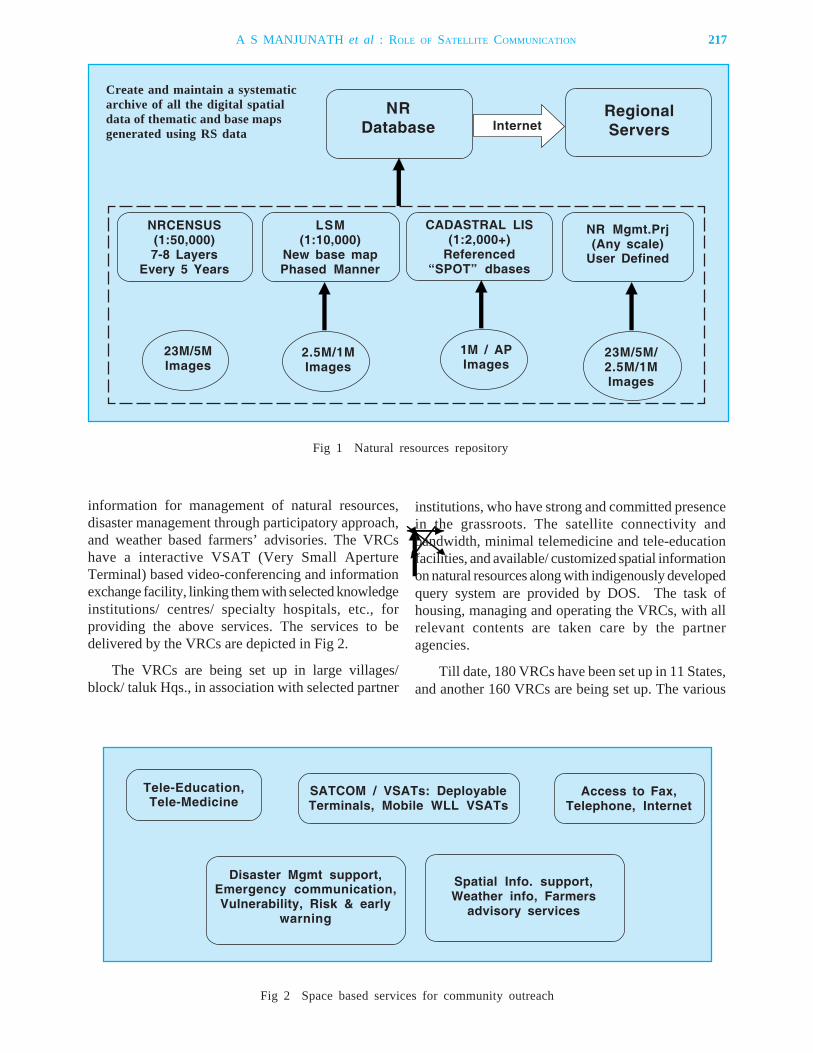
information for management of natural resources,disaster management through participatory approach,and weather based farmers’ advisories. The VRCshave a interactive VSAT (Very Small ApertureTerminal) based video-conferencing and informationexchange facility, linking them with selected knowledgeinstitutions/ centres/ specialty hospitals, etc., forproviding the above services. The services to bedelivered by the VRCs are depicted in Fig 2.
The VRCs are being set up in large villages/block/ taluk Hqs., in association with selected partner
Create and maintain a systematicarchive of all the digital spatialdata of thematic and base mapsgenerated using RS data
NRDatabase
RegionalServers
NRCENSUS(1:50,000)7-8 Layers
Every 5 Years
LSM(1:10,000)
New base mapPhased Manner
CADASTRAL LIS(1:2,000+)
Referenced“SPOT” dbases
NR Mgmt.Prj(Any scale)
User Defined
23M/5MImages
2.5M/1MImages
1M / APImages
23M/5M/2.5M/1MImages
Internet
Fig 1 Natural resources repository
Tele-Education,Tele-Medicine
SATCOM / VSATs: DeployableTerminals, Mobile WLL VSATs
Access to Fax,Telephone, Internet
Disaster Mgmt support,Emergency communication,Vulnerability, Risk & early
warning
Spatial Info. support,Weather info, Farmers
advisory services
Fig 2 Space based services for community outreach
institutions, who have strong and committed presencein the grassroots. The satellite connectivity andbandwidth, minimal telemedicine and tele-educationfacilities, and available/ customized spatial informationon natural resources along with indigenously developedquery system are provided by DOS. The task ofhousing, managing and operating the VRCs, with allrelevant contents are taken care by the partneragencies.
Till date, 180 VRCs have been set up in 11 States,and another 160 VRCs are being set up. The various
A S MANJUNATH et al : ROLE OF SATELLITE COMMUNICATION 217
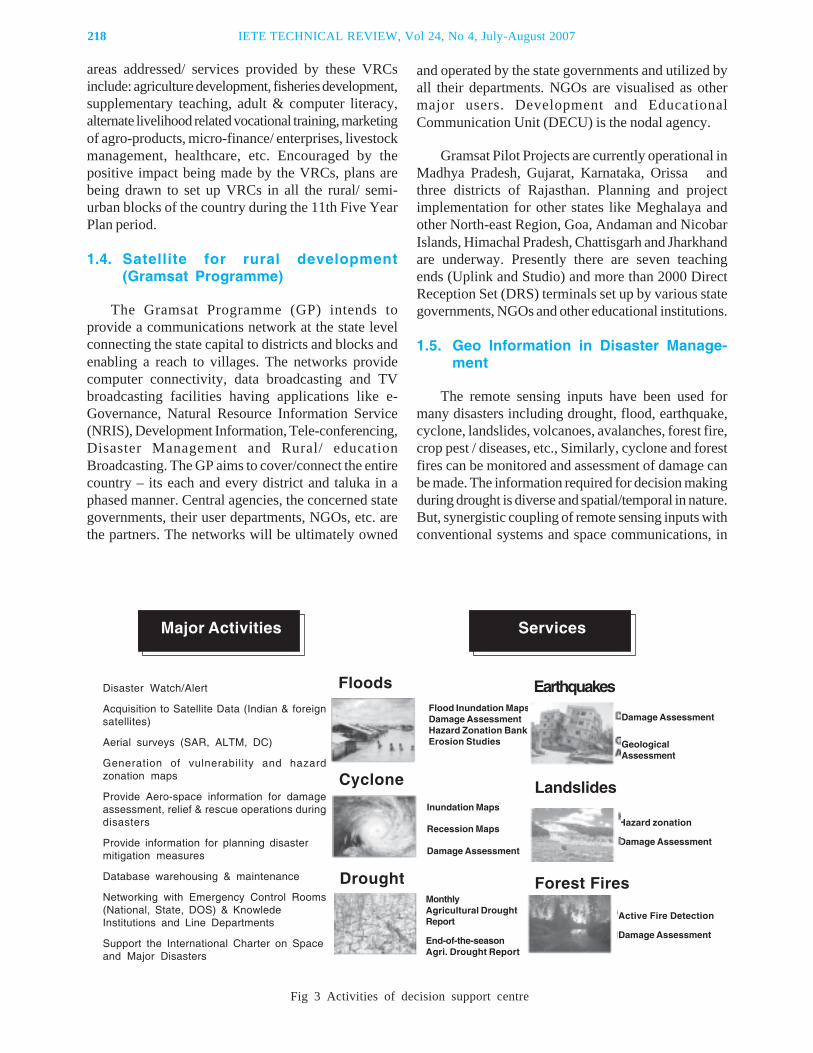
218 IETE TECHNICAL REVIEW, Vol 24, No 4, July-August 2007
areas addressed/ services provided by these VRCsinclude: agriculture development, fisheries development,supplementary teaching, adult & computer literacy,alternate livelihood related vocational training, marketingof agro-products, micro-finance/ enterprises, livestockmanagement, healthcare, etc. Encouraged by thepositive impact being made by the VRCs, plans arebeing drawn to set up VRCs in all the rural/ semi-urban blocks of the country during the 11th Five YearPlan period.
1.4. Satellite for rural development(Gramsat Programme)
The Gramsat Programme (GP) intends toprovide a communications network at the state levelconnecting the state capital to districts and blocks andenabling a reach to villages. The networks providecomputer connectivity, data broadcasting and TVbroadcasting facilities having applications like e-Governance, Natural Resource Information Service(NRIS), Development Information, Tele-conferencing,Disaster Management and Rural/ educationBroadcasting. The GP aims to cover/connect the entirecountry – its each and every district and taluka in aphased manner. Central agencies, the concerned stategovernments, their user departments, NGOs, etc. arethe partners. The networks will be ultimately owned
and operated by the state governments and utilized byall their departments. NGOs are visualised as othermajor users. Development and EducationalCommunication Unit (DECU) is the nodal agency.
Gramsat Pilot Projects are currently operational inMadhya Pradesh, Gujarat, Karnataka, Orissa andthree districts of Rajasthan. Planning and projectimplementation for other states like Meghalaya andother North-east Region, Goa, Andaman and NicobarIslands, Himachal Pradesh, Chattisgarh and Jharkhandare underway. Presently there are seven teachingends (Uplink and Studio) and more than 2000 DirectReception Set (DRS) terminals set up by various stategovernments, NGOs and other educational institutions.
1.5. Geo Information in Disaster Manage-ment
The remote sensing inputs have been used formany disasters including drought, flood, earthquake,cyclone, landslides, volcanoes, avalanches, forest fire,crop pest / diseases, etc., Similarly, cyclone and forestfires can be monitored and assessment of damage canbe made. The information required for decision makingduring drought is diverse and spatial/temporal in nature.But, synergistic coupling of remote sensing inputs withconventional systems and space communications, in
Fig 3 Activities of decision support centre
Disaster Watch/Alert
Acquisition to Satellite Data (Indian & foreignsatellites)
Aerial surveys (SAR, ALTM, DC)
Generation of vulnerability and hazardzonation maps
Provide Aero-space information for damageassessment, relief & rescue operations duringdisasters
Provide information for planning disastermitigation measures
Database warehousing & maintenance
Networking with Emergency Control Rooms(National, State, DOS) & KnowledeInstitutions and Line Departments
Support the International Charter on Spaceand Major Disasters
Major Activities Services
Floods
Cyclone
Drought
Earthquakes
Landslides
Forest Fires
Flood Inundation MapsDamage AssessmentHazard Zonation BankErosion Studies
Inundation Maps
Recession Maps
Damage Assessment
MonthlyAgricultural DroughtReport
End-of-the-seasonAgri. Drought Report
Damage Assessment
GeologicalAssessment
Hazard zonation
Damage Assessment
Active Fire Detection
Damage Assessment
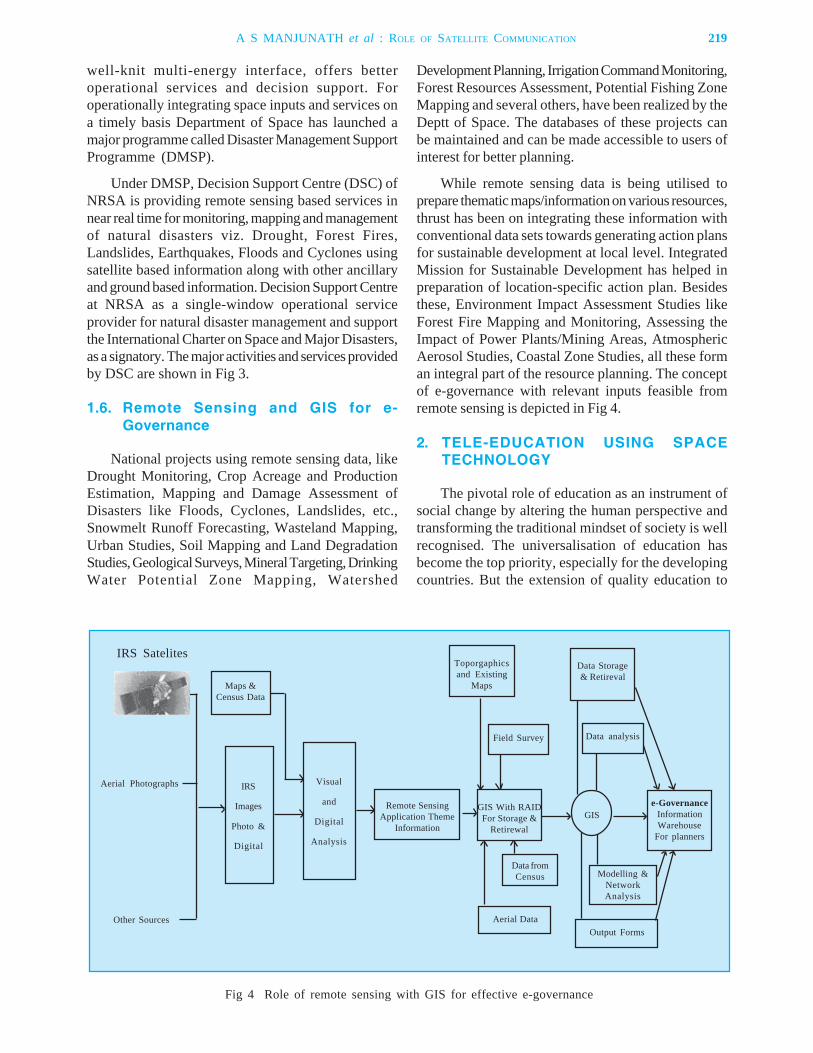
well-knit multi-energy interface, offers betteroperational services and decision support. Foroperationally integrating space inputs and services ona timely basis Department of Space has launched amajor programme called Disaster Management SupportProgramme (DMSP).
Under DMSP, Decision Support Centre (DSC) ofNRSA is providing remote sensing based services innear real time for monitoring, mapping and managementof natural disasters viz. Drought, Forest Fires,Landslides, Earthquakes, Floods and Cyclones usingsatellite based information along with other ancillaryand ground based information. Decision Support Centreat NRSA as a single-window operational serviceprovider for natural disaster management and supportthe International Charter on Space and Major Disasters,as a signatory. The major activities and services providedby DSC are shown in Fig 3.
1.6. Remote Sensing and GIS for e-Governance
National projects using remote sensing data, likeDrought Monitoring, Crop Acreage and ProductionEstimation, Mapping and Damage Assessment ofDisasters like Floods, Cyclones, Landslides, etc.,Snowmelt Runoff Forecasting, Wasteland Mapping,Urban Studies, Soil Mapping and Land DegradationStudies, Geological Surveys, Mineral Targeting, DrinkingWater Potential Zone Mapping, Watershed
Development Planning, Irrigation Command Monitoring,Forest Resources Assessment, Potential Fishing ZoneMapping and several others, have been realized by theDeptt of Space. The databases of these projects canbe maintained and can be made accessible to users ofinterest for better planning.
While remote sensing data is being utilised toprepare thematic maps/information on various resources,thrust has been on integrating these information withconventional data sets towards generating action plansfor sustainable development at local level. IntegratedMission for Sustainable Development has helped inpreparation of location-specific action plan. Besidesthese, Environment Impact Assessment Studies likeForest Fire Mapping and Monitoring, Assessing theImpact of Power Plants/Mining Areas, AtmosphericAerosol Studies, Coastal Zone Studies, all these forman integral part of the resource planning. The conceptof e-governance with relevant inputs feasible fromremote sensing is depicted in Fig 4.
2. TELE-EDUCATION USING SPACETECHNOLOGY
The pivotal role of education as an instrument ofsocial change by altering the human perspective andtransforming the traditional mindset of society is wellrecognised. The universalisation of education hasbecome the top priority, especially for the developingcountries. But the extension of quality education to
Fig 4 Role of remote sensing with GIS for effective e-governance
IRS Satelites
Maps &Census Data
IRS
Images
Photo &
Digital
Visual
and
Digital
Analysis
Remote SensingApplication Theme
Information
GIS With RAIDFor Storage &
Retirewal
e-GovernanceInformationWarehouse
For planners
Toporgaphicsand Existing
Maps
Field Survey
Data Storage& Retireval
Data analysis
Data fromCensus
Aerial Data
Modelling &NetworkAnalysis
Output Forms
GIS
Aerial Photographs
Other Sources
A S MANJUNATH et al : ROLE OF SATELLITE COMMUNICATION 219
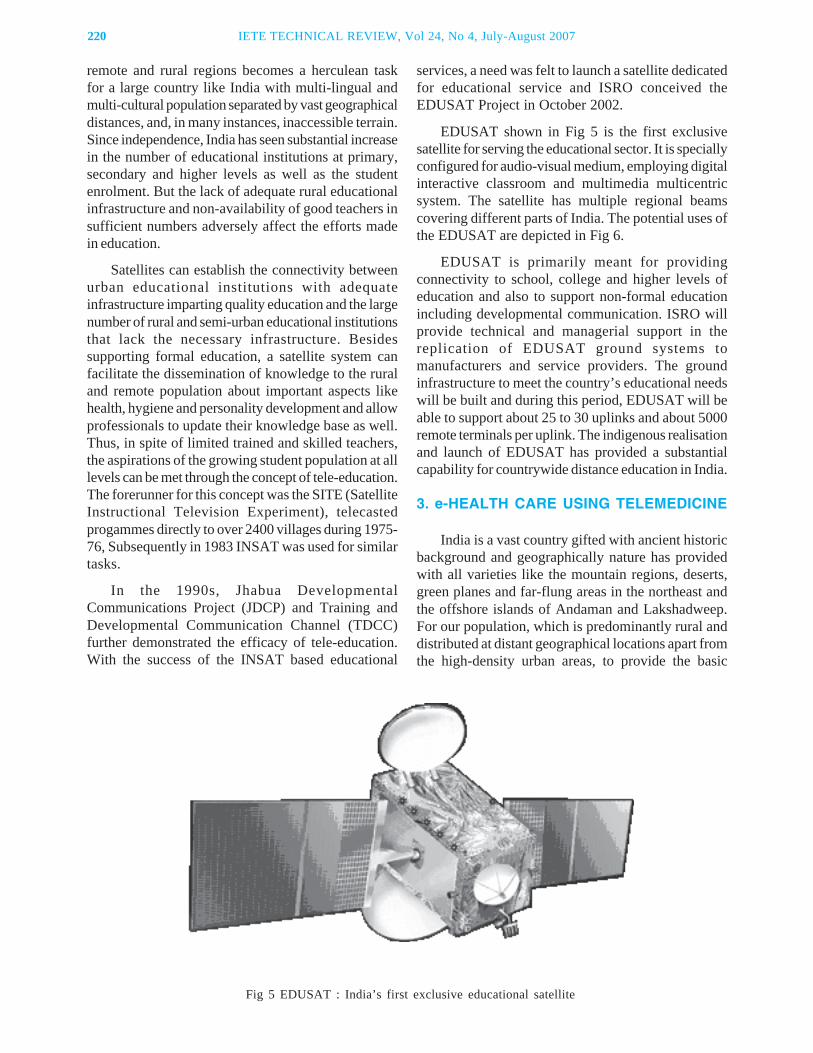
220 IETE TECHNICAL REVIEW, Vol 24, No 4, July-August 2007
remote and rural regions becomes a herculean taskfor a large country like India with multi-lingual andmulti-cultural population separated by vast geographicaldistances, and, in many instances, inaccessible terrain.Since independence, India has seen substantial increasein the number of educational institutions at primary,secondary and higher levels as well as the studentenrolment. But the lack of adequate rural educationalinfrastructure and non-availability of good teachers insufficient numbers adversely affect the efforts madein education.
Satellites can establish the connectivity betweenurban educational institutions with adequateinfrastructure imparting quality education and the largenumber of rural and semi-urban educational institutionsthat lack the necessary infrastructure. Besidessupporting formal education, a satellite system canfacilitate the dissemination of knowledge to the ruraland remote population about important aspects likehealth, hygiene and personality development and allowprofessionals to update their knowledge base as well.Thus, in spite of limited trained and skilled teachers,the aspirations of the growing student population at alllevels can be met through the concept of tele-education.The forerunner for this concept was the SITE (SatelliteInstructional Television Experiment), telecastedprogammes directly to over 2400 villages during 1975-76, Subsequently in 1983 INSAT was used for similartasks.
In the 1990s, Jhabua DevelopmentalCommunications Project (JDCP) and Training andDevelopmental Communication Channel (TDCC)further demonstrated the efficacy of tele-education.With the success of the INSAT based educational
services, a need was felt to launch a satellite dedicatedfor educational service and ISRO conceived theEDUSAT Project in October 2002.
EDUSAT shown in Fig 5 is the first exclusivesatellite for serving the educational sector. It is speciallyconfigured for audio-visual medium, employing digitalinteractive classroom and multimedia multicentricsystem. The satellite has multiple regional beamscovering different parts of India. The potential uses ofthe EDUSAT are depicted in Fig 6.
EDUSAT is primarily meant for providingconnectivity to school, college and higher levels ofeducation and also to support non-formal educationincluding developmental communication. ISRO willprovide technical and managerial support in thereplication of EDUSAT ground systems tomanufacturers and service providers. The groundinfrastructure to meet the country’s educational needswill be built and during this period, EDUSAT will beable to support about 25 to 30 uplinks and about 5000remote terminals per uplink. The indigenous realisationand launch of EDUSAT has provided a substantialcapability for countrywide distance education in India.
3. e-HEALTH CARE USING TELEMEDICINE
India is a vast country gifted with ancient historicbackground and geographically nature has providedwith all varieties like the mountain regions, deserts,green planes and far-flung areas in the northeast andthe offshore islands of Andaman and Lakshadweep.For our population, which is predominantly rural anddistributed at distant geographical locations apart fromthe high-density urban areas, to provide the basic
Fig 5 EDUSAT : India’s first exclusive educational satellite
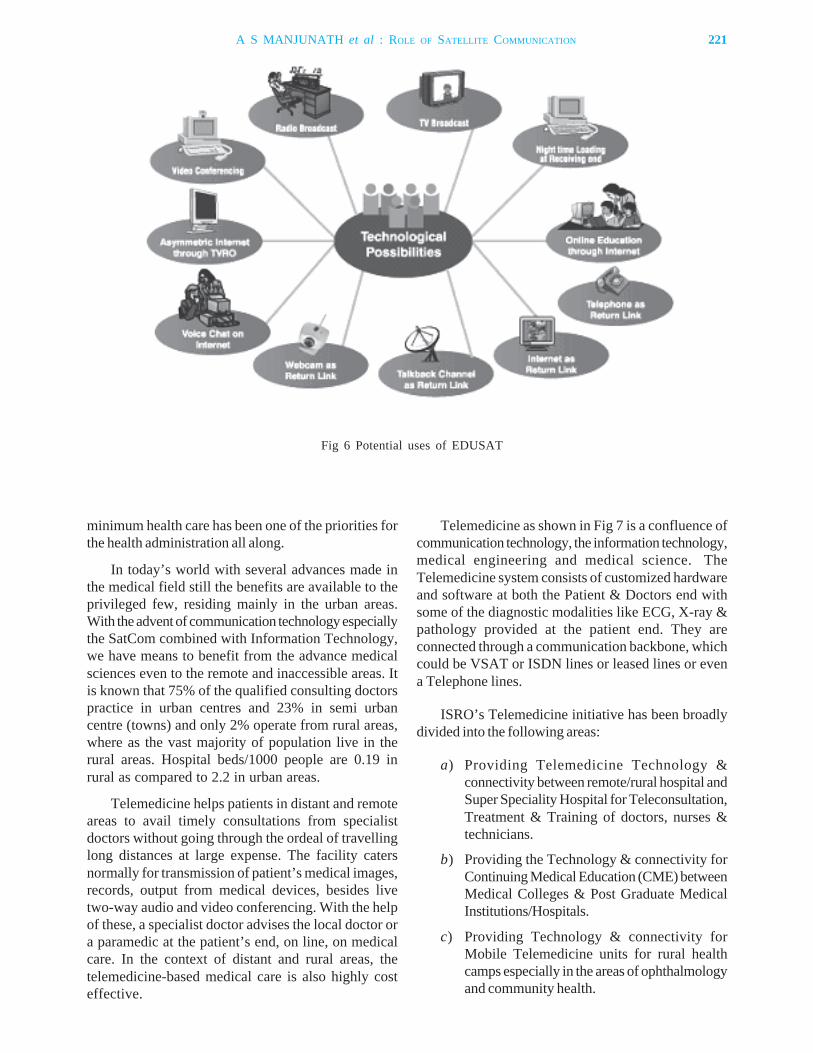
minimum health care has been one of the priorities forthe health administration all along.
In today’s world with several advances made inthe medical field still the benefits are available to theprivileged few, residing mainly in the urban areas.With the advent of communication technology especiallythe SatCom combined with Information Technology,we have means to benefit from the advance medicalsciences even to the remote and inaccessible areas. Itis known that 75% of the qualified consulting doctorspractice in urban centres and 23% in semi urbancentre (towns) and only 2% operate from rural areas,where as the vast majority of population live in therural areas. Hospital beds/1000 people are 0.19 inrural as compared to 2.2 in urban areas.
Telemedicine helps patients in distant and remoteareas to avail timely consultations from specialistdoctors without going through the ordeal of travellinglong distances at large expense. The facility catersnormally for transmission of patient’s medical images,records, output from medical devices, besides livetwo-way audio and video conferencing. With the helpof these, a specialist doctor advises the local doctor ora paramedic at the patient’s end, on line, on medicalcare. In the context of distant and rural areas, thetelemedicine-based medical care is also highly costeffective.
Telemedicine as shown in Fig 7 is a confluence ofcommunication technology, the information technology,medical engineering and medical science. TheTelemedicine system consists of customized hardwareand software at both the Patient & Doctors end withsome of the diagnostic modalities like ECG, X-ray &pathology provided at the patient end. They areconnected through a communication backbone, whichcould be VSAT or ISDN lines or leased lines or evena Telephone lines.
ISRO’s Telemedicine initiative has been broadlydivided into the following areas:
a) Providing Telemedicine Technology &connectivity between remote/rural hospital andSuper Speciality Hospital for Teleconsultation,Treatment & Training of doctors, nurses &technicians.
b) Providing the Technology & connectivity forContinuing Medical Education (CME) betweenMedical Colleges & Post Graduate MedicalInstitutions/Hospitals.
c) Providing Technology & connectivity forMobile Telemedicine units for rural healthcamps especially in the areas of ophthalmologyand community health.
Fig 6 Potential uses of EDUSAT
A S MANJUNATH et al : ROLE OF SATELLITE COMMUNICATION 221
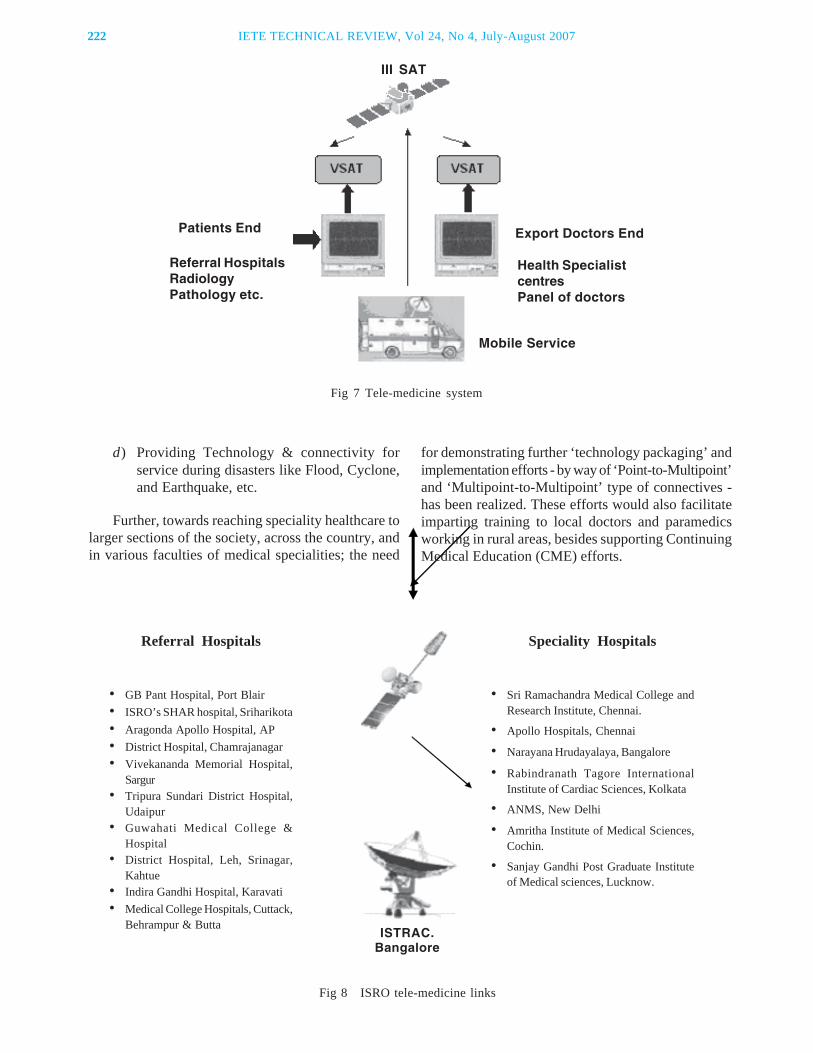
222 IETE TECHNICAL REVIEW, Vol 24, No 4, July-August 2007
d) Providing Technology & connectivity forservice during disasters like Flood, Cyclone,and Earthquake, etc.
Further, towards reaching speciality healthcare tolarger sections of the society, across the country, andin various faculties of medical specialities; the need
Fig 7 Tele-medicine system
Referral Hospitals
• GB Pant Hospital, Port Blair• ISRO’s SHAR hospital, Sriharikota• Aragonda Apollo Hospital, AP• District Hospital, Chamrajanagar• Vivekananda Memorial Hospital,
Sargur• Tripura Sundari District Hospital,
Udaipur• Guwahati Medical College &
Hospital• District Hospital, Leh, Srinagar,
Kahtue• Indira Gandhi Hospital, Karavati• Medical College Hospitals, Cuttack,
Behrampur & Butta
Speciality Hospitals
• Sri Ramachandra Medical College andResearch Institute, Chennai.
• Apollo Hospitals, Chennai
• Narayana Hrudayalaya, Bangalore
• Rabindranath Tagore InternationalInstitute of Cardiac Sciences, Kolkata
• ANMS, New Delhi
• Amritha Institute of Medical Sciences,Cochin.
• Sanjay Gandhi Post Graduate Instituteof Medical sciences, Lucknow.
Fig 8 ISRO tele-medicine links
ISTRAC.Bangalore
Referral HospitalsRadiologyPathology etc.
Patients End
Health SpecialistcentresPanel of doctors
Export Doctors End
Mobile Service
III SAT
for demonstrating further ‘technology packaging’ andimplementation efforts - by way of ‘Point-to-Multipoint’and ‘Multipoint-to-Multipoint’ type of connectives -has been realized. These efforts would also facilitateimparting training to local doctors and paramedicsworking in rural areas, besides supporting ContinuingMedical Education (CME) efforts.
ISRO has identified “Health CommunicationSupport Network” as an important activity. In thisconnection, the types of services which are planned tobe initiated are Tele-medical-education, Tele-consultation, Tele-referral and Tele-health. ISRO hasplans to integrate telemedicine with tele-educationwherever applicable and the Village information Kiosks/Community Centres to reach out to more rural areasof the country. The various tele-medicine linksestablished by ISRO are shown in Fig 8.
3.1. Image processing in e-Healthcare
Applications of telemedicine are found in everyarea of specialisation. Teleradiology is the most commonapplication followed by cardiology, dermatology,psychiatry, emergency medicine, home health care,pathology, and oncology, etc. The technological basisand the practical issues are highly variable from oneclinical application to another. The image processingmethods like contrast enhancement, segmentation,registration, clustering, mosaic, 3D constructions,rendering, etc., are applied for various medical images.Other image processing techniques such as Imageacquisition, digitization and image compression areused effectively for image transmission.
3.2. Remote sensing and GIS for vectorborne Diseases
Vector-borne diseases have been the mostimportant health problems worldwide for many yearsand still represent a constant and serious risk to a largepart of the world’s population. Satellite Remote Sensingtechniques are used to monitor factors affecting diseasetransmission. Both spatial and temporal changes inenvironmental conditions are important determinantsof vector-borne disease transmission. The satelliteimages are used for identifying these changes, andable to define and predict areas and periods of highspreading. Satellite images, digitized land use mapsand Geographic Information Systems (GIS) are usedfor predicting changes in habitats of disease vectors,and high resolution satellite data is used to characterizeimmature habitats of vector borne diseases like cholera,
malaria etc., Remote Sensing provides useful indicatorsfor identifying the presence or impact of the vectors,which can be analysed to provide an effective solution.
CONCLUSION
The paper on “Role of Satellite Communicatgion& Remote Sensing in Rural Development” describesthe efforts by the dept of Space in harnessing SpaceTechnology and Image processing and GIS in areasthat influence rural development viz, natural resourcesutilisation, education and health care etc. As the currenttrend is integration of technologies for enhanced utility,the space technology can be made integral part invarious phases of rural development for the country’soverall development.
ACKNOWLEDGEMENTS
We are grateful to Dr K Radhakrishnan, Director,NRSA for his encouragement in bringing out thispublication.
REFERENCES
1. http://www.isro.org
2. http://www.nnrms.gov.in
3. Dr. Rao, K M M, et al, Emerging Technologies andRemote Sensing with GIS for effective e-Governance, Proceedings of National Conferenceon e-Governance, 10th -12th September, 2004, IETE,Hyderabad-7.
4. Adam William Darkins, Margaret Ann CaryTelemedicine and Telehealth – principles, policies,performance and pitfalls, Springer publishingcompany, 2002.
5. Marlene Maheu, Pamela Whitten, Ace Allen, E-Health, Telehealth, and Telemedicine, Wileypublishers, 2001.
6. David L Verbyla, Satellite Remote Sensing of NaturalResources, CRC Publishers,1990
7. ISPRS proceedings – Istambul 2004, Volume XXXV,Parts B1-B6.
8. Proceedings of the National Workshop on FloodDisaster Management – space Inputs, Organised byNRSA, ITC Netherlands, 2004.
A S MANJUNATH et al : ROLE OF SATELLITE COMMUNICATION 223
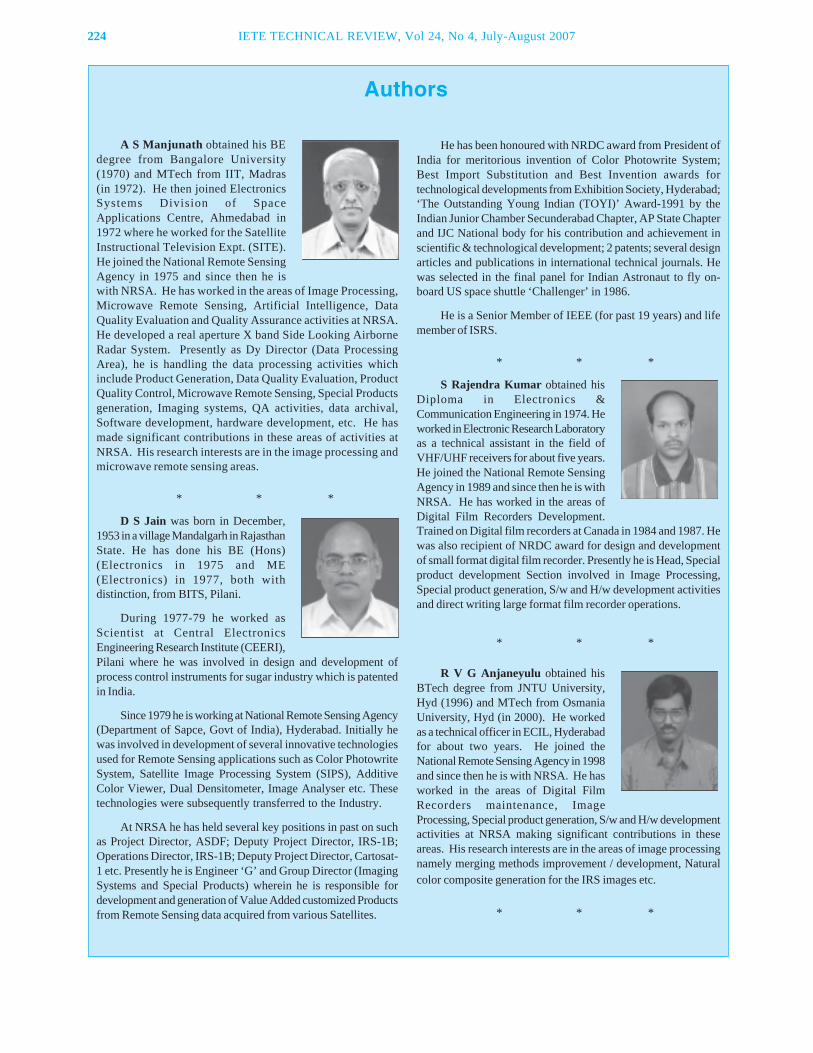
224 IETE TECHNICAL REVIEW, Vol 24, No 4, July-August 2007
A S Manjunath obtained his BEdegree from Bangalore University(1970) and MTech from IIT, Madras(in 1972). He then joined ElectronicsSystems Division of SpaceApplications Centre, Ahmedabad in1972 where he worked for the SatelliteInstructional Television Expt. (SITE).He joined the National Remote SensingAgency in 1975 and since then he iswith NRSA. He has worked in the areas of Image Processing,Microwave Remote Sensing, Artificial Intelligence, DataQuality Evaluation and Quality Assurance activities at NRSA.He developed a real aperture X band Side Looking AirborneRadar System. Presently as Dy Director (Data ProcessingArea), he is handling the data processing activities whichinclude Product Generation, Data Quality Evaluation, ProductQuality Control, Microwave Remote Sensing, Special Productsgeneration, Imaging systems, QA activities, data archival,Software development, hardware development, etc. He hasmade significant contributions in these areas of activities atNRSA. His research interests are in the image processing andmicrowave remote sensing areas.
* * *
D S Jain was born in December,1953 in a village Mandalgarh in RajasthanState. He has done his BE (Hons)(Electronics in 1975 and ME(Electronics) in 1977, both withdistinction, from BITS, Pilani.
During 1977-79 he worked asScientist at Central ElectronicsEngineering Research Institute (CEERI),Pilani where he was involved in design and development ofprocess control instruments for sugar industry which is patentedin India.
Since 1979 he is working at National Remote Sensing Agency(Department of Sapce, Govt of India), Hyderabad. Initially hewas involved in development of several innovative technologiesused for Remote Sensing applications such as Color PhotowriteSystem, Satellite Image Processing System (SIPS), AdditiveColor Viewer, Dual Densitometer, Image Analyser etc. Thesetechnologies were subsequently transferred to the Industry.
At NRSA he has held several key positions in past on suchas Project Director, ASDF; Deputy Project Director, IRS-1B;Operations Director, IRS-1B; Deputy Project Director, Cartosat-1 etc. Presently he is Engineer ‘G’ and Group Director (ImagingSystems and Special Products) wherein he is responsible fordevelopment and generation of Value Added customized Productsfrom Remote Sensing data acquired from various Satellites.
Authors
He has been honoured with NRDC award from President ofIndia for meritorious invention of Color Photowrite System;Best Import Substitution and Best Invention awards fortechnological developments from Exhibition Society, Hyderabad;‘The Outstanding Young Indian (TOYI)’ Award-1991 by theIndian Junior Chamber Secunderabad Chapter, AP State Chapterand IJC National body for his contribution and achievement inscientific & technological development; 2 patents; several designarticles and publications in international technical journals. Hewas selected in the final panel for Indian Astronaut to fly on-board US space shuttle ‘Challenger’ in 1986.
He is a Senior Member of IEEE (for past 19 years) and lifemember of ISRS.
* * *
S Rajendra Kumar obtained hisDiploma in Electronics &Communication Engineering in 1974. Heworked in Electronic Research Laboratoryas a technical assistant in the field ofVHF/UHF receivers for about five years.He joined the National Remote SensingAgency in 1989 and since then he is withNRSA. He has worked in the areas ofDigital Film Recorders Development.Trained on Digital film recorders at Canada in 1984 and 1987. Hewas also recipient of NRDC award for design and developmentof small format digital film recorder. Presently he is Head, Specialproduct development Section involved in Image Processing,Special product generation, S/w and H/w development activitiesand direct writing large format film recorder operations.
* * *
R V G Anjaneyulu obtained hisBTech degree from JNTU University,Hyd (1996) and MTech from OsmaniaUniversity, Hyd (in 2000). He workedas a technical officer in ECIL, Hyderabadfor about two years. He joined theNational Remote Sensing Agency in 1998and since then he is with NRSA. He hasworked in the areas of Digital FilmRecorders maintenance, ImageProcessing, Special product generation, S/w and H/w developmentactivities at NRSA making significant contributions in theseareas. His research interests are in the areas of image processingnamely merging methods improvement / development, Naturalcolor composite generation for the IRS images etc.
* * *
225
Paper No 124-E; Copyright © 2007 by the IETE.* This work was performed while the author was at ECEDeptt, IISc, Bangalore.
IETE Technical ReviewVol 24, No 4, July-August 2007, pp 225-242
Design of a TDD Multisector TDM MAC forthe WiFiRe Proposal for Rural
Broadband AccessANITHA VARGHESE*
General Motors India Science Lab, Creator Building, ITPL, Bangalore 560 066, India.email: [email protected]
AND
ANURAG KUMAR
Department of Electrical Communication Engineering,Indian Institute of Science, Bangalore, 560 012, India.
email: [email protected]
• In order to leverage the price advantage ofusing existing mass produced integratedcircuits, the physical layer has been taken tobe the same as that of IEEE 802.11, thepopular standard for wireless local areanetworks (WLANs).
• One access point (AP) (or base stationcontroller (BSC)), using a single IEEE 802.11channel, will serve a “cell” with about 80-120villages spread over a 15 km to 20 km radius.
• The cell will be sectored (typically 60o), witheach sector containing a directional basestation (BS) antenna. There will be one fixedsubscriber terminal (ST) in each village, whichcould be connected to voice and data terminalsin the village by a local area network. The STantennas will also be directional, thuspermitting reliable communication betweenthe BS antenna in a sector and all STs in thatsector. However, because of antenna side-lobes, transmitters in each sector will interferewith receivers in other sectors. Dependingon the attenuation levels, a scheduledtransmission in one sector may exclude thesimultaneous scheduling of certain transmitter-receiver pairs in other sectors. Further,simultaneous transmissions will interfere,necessitating a limit on the number ofsimultaneous transmissions possible. A typicalconfiguration of a WiFiRE system is shownin Fig 1.
• There will be one MAC controller for all thesectors in a cell. The multiple accessmechanism will be time division duplexed
1. INTRODUCTION
The WiFiRe (WiFi Rural Extension) proposal forrural broadband access is being developed under theaegis of CEWIT. The system leverages the widelyavailable, and highly cost-reduced, WiFi chipsets.However, only the physical layer from these chipsetsis retained. A single base station carries several WiFitransceivers, each serving one sector of the cell, andall operating on the same WiFi channel in a timedivision duplex (TDD) manner. We replace thecontention based WiFi MAC with a single-channelTDD multisector TDM MAC similar to the WiMaxMAC. In this paper we discuss in detail the issues indesigning such a MAC for the purpose of carryingpacket voice telephony and for Internet access. Theproblem of determining the optimal spatial reuse isformulated and the optimal spatial reuse and thecorresponding cell size is derived. Then the voice anddata scheduler is designed. It is shown how throughputfairness can be implemented in the data scheduler. Acapacity assessment of the system is also provided.
1. INTRODUCTION
The WiFiRe standard for rural Internet access(see [1], and [2]) is being developed under the aegis ofCEWIT, IIT Madras, as a technology for providingwireless broadband voice and data access for ruralareas. The following are the key features of thecurrent version of this standard.
INVITED PAPER
226 IETE TECHNICAL REVIEW, Vol 24, No 4, July-August 2007
multisector TDM (TDD-MSTDM) schedulingof slots. Time is divided into frames, whichcontain traffic slots. The set of slots in aframe is partitioned into contiguous uplink anddownlink segments. During the downlinksegment, in each slot, one or zero transmissionscan take place in each sector; and similarly inthe uplink segment. Because of site andinstallation dependent path loss patterns, andbecause of time varying traffic requirements,the schedule will need to be computed on-line.
The objective of this work is to abstract out thebasic scheduling problem, to develop a mathematicalformulation for the problem, to provide some schedulingalgorithms, and to provide a capacity assessment ofthe MAC architecture.
A. Related Literature
Bhagwat et al [3] have discussed issues relatedto using 802.11 family of wireless technologies forlong distance transmission in rural environment, suchas the quality of 802.11 PHY performance outdoors,range extension, spectral vs. cost efficiency. Theauthors provide details of the 802.11-based meshnetwork deployed in the Digital Gangetic Plains Projectproviding voice and data services to villages. Ramanand Chebrolu [4] discuss the issues in using CSMA/CA in networks including long distance links. CSMA/CA is designed to resolve contention in the indoorenvironment, but is inefficient in long distance point topoint links. The authors provide a new MAC for meshnetworks synTX/synRX, which in the context of ourproblem translates to saying that the antennas at the
base station should either all be in transmit mode or allin receive mode and the transmissions should satisfysome power relations. These ideas have been madeuse in the spatial reuse model that we discuss.
Shetiya [5] considers the joint routing andscheduling problem in WiMax mesh networks. Adynamic programming problem is formulated tomaximize the throughput, and is found to becomputationally complex to solve. Heuristics are usedto attain a near optimal solution by considering therouting and scheduling problems separately.
B. Preview of Contributions
We begin by developing a model for antennacoverage and spatial reuse in a single channel multi-sector operation. It is seen that in multi-sector operation,depending on the path loss, receive sensitivity and theantenna directivity, the number of simultaneoustransmissions can be 3 or 4. We then set up anabstraction for the TDD, single channel multi-sectorscheduling problem.We begin by developing capacitybounds for fair rate allocation, sum rate and sum of lograte.This analysis also shows how the sectors shouldbe angularly oriented.We then develop a schedulingmethodology for voice and data traffic.
C. Overview of the Paper
Section 2 sets up the notations used through therest of the report and also explains the voice and TCPtraffic models used. Section 3 explains the model usedto characterize the interference in the network bydisallowing transmission in some regions and by limiting
Fig 1 WiFiRe network configuration. The figure on the left shows a deployment with three sectors, and the figure tothe right shows a tall tower carrying several BSs, with sector antennas, and several STs in a sector, with lowerheight directional antennas
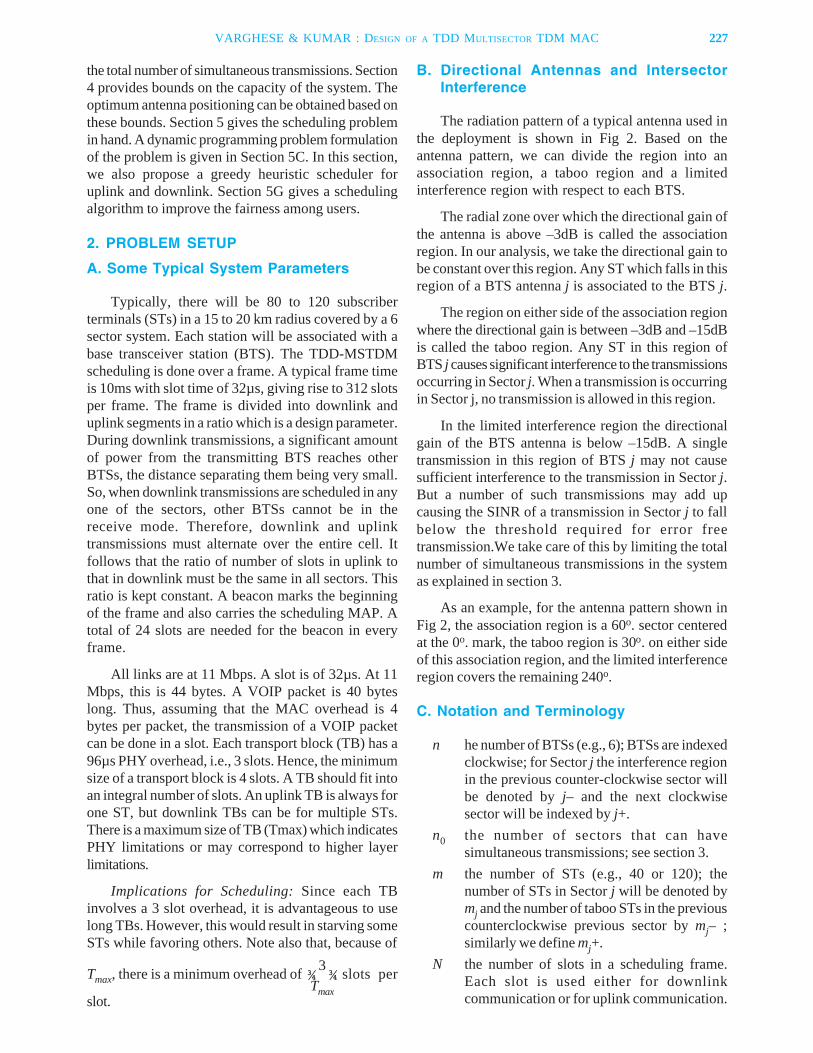
the total number of simultaneous transmissions. Section4 provides bounds on the capacity of the system. Theoptimum antenna positioning can be obtained based onthese bounds. Section 5 gives the scheduling problemin hand. A dynamic programming problem formulationof the problem is given in Section 5C. In this section,we also propose a greedy heuristic scheduler foruplink and downlink. Section 5G gives a schedulingalgorithm to improve the fairness among users.
2. PROBLEM SETUP
A. Some Typical System Parameters
Typically, there will be 80 to 120 subscriberterminals (STs) in a 15 to 20 km radius covered by a 6sector system. Each station will be associated with abase transceiver station (BTS). The TDD-MSTDMscheduling is done over a frame. A typical frame timeis 10ms with slot time of 32µs, giving rise to 312 slotsper frame. The frame is divided into downlink anduplink segments in a ratio which is a design parameter.During downlink transmissions, a significant amountof power from the transmitting BTS reaches otherBTSs, the distance separating them being very small.So, when downlink transmissions are scheduled in anyone of the sectors, other BTSs cannot be in thereceive mode. Therefore, downlink and uplinktransmissions must alternate over the entire cell. Itfollows that the ratio of number of slots in uplink tothat in downlink must be the same in all sectors. Thisratio is kept constant. A beacon marks the beginningof the frame and also carries the scheduling MAP. Atotal of 24 slots are needed for the beacon in everyframe.
All links are at 11 Mbps. A slot is of 32µs. At 11Mbps, this is 44 bytes. A VOIP packet is 40 byteslong. Thus, assuming that the MAC overhead is 4bytes per packet, the transmission of a VOIP packetcan be done in a slot. Each transport block (TB) has a96µs PHY overhead, i.e., 3 slots. Hence, the minimumsize of a transport block is 4 slots. A TB should fit intoan integral number of slots. An uplink TB is always forone ST, but downlink TBs can be for multiple STs.There is a maximum size of TB (Tmax) which indicatesPHY limitations or may correspond to higher layerlimitations.
Implications for Scheduling: Since each TBinvolves a 3 slot overhead, it is advantageous to uselong TBs. However, this would result in starving someSTs while favoring others. Note also that, because of
3Tmax, there is a minimum overhead of ¾ ¾ slots perTmax
slot.
B. Directional Antennas and IntersectorInterference
The radiation pattern of a typical antenna used inthe deployment is shown in Fig 2. Based on theantenna pattern, we can divide the region into anassociation region, a taboo region and a limitedinterference region with respect to each BTS.
The radial zone over which the directional gain ofthe antenna is above –3dB is called the associationregion. In our analysis, we take the directional gain tobe constant over this region. Any ST which falls in thisregion of a BTS antenna j is associated to the BTS j.
The region on either side of the association regionwhere the directional gain is between –3dB and –15dBis called the taboo region. Any ST in this region ofBTS j causes significant interference to the transmissionsoccurring in Sector j. When a transmission is occurringin Sector j, no transmission is allowed in this region.
In the limited interference region the directionalgain of the BTS antenna is below –15dB. A singletransmission in this region of BTS j may not causesufficient interference to the transmission in Sector j.But a number of such transmissions may add upcausing the SINR of a transmission in Sector j to fallbelow the threshold required for error freetransmission.We take care of this by limiting the totalnumber of simultaneous transmissions in the systemas explained in section 3.
As an example, for the antenna pattern shown inFig 2, the association region is a 60o. sector centeredat the 0o. mark, the taboo region is 30o. on either sideof this association region, and the limited interferenceregion covers the remaining 240o.
C. Notation and Terminology
n he number of BTSs (e.g., 6); BTSs are indexedclockwise; for Sector j the interference regionin the previous counter-clockwise sector willbe denoted by j– and the next clockwisesector will be indexed by j+.
n0 the number of sectors that can havesimultaneous transmissions; see section 3.
m the number of STs (e.g., 40 or 120); thenumber of STs in Sector j will be denoted bymj and the number of taboo STs in the previouscounterclockwise previous sector by mj– ;similarly we define mj+.
N the number of slots in a scheduling frame.Each slot is used either for downlinkcommunication or for uplink communication.
VARGHESE & KUMAR : DESIGN OF A TDD MULTISECTOR TDM MAC 227
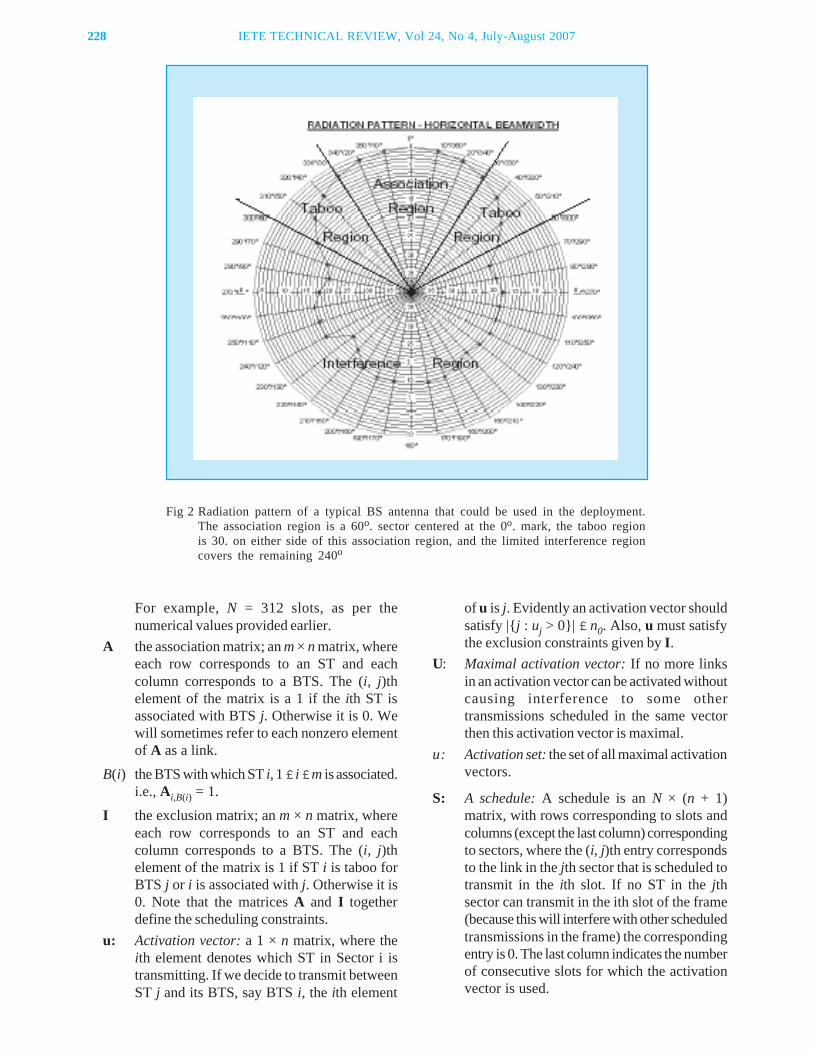
228 IETE TECHNICAL REVIEW, Vol 24, No 4, July-August 2007
For example, N = 312 slots, as per thenumerical values provided earlier.
A the association matrix; an m × n matrix, whereeach row corresponds to an ST and eachcolumn corresponds to a BTS. The (i, j)thelement of the matrix is a 1 if the ith ST isassociated with BTS j. Otherwise it is 0. Wewill sometimes refer to each nonzero elementof A as a link.
B(i) the BTS with which ST i, 1 £ i £ m is associated.i.e., Ai,B(i) = 1.
I the exclusion matrix; an m × n matrix, whereeach row corresponds to an ST and eachcolumn corresponds to a BTS. The (i, j)thelement of the matrix is 1 if ST i is taboo forBTS j or i is associated with j. Otherwise it is0. Note that the matrices A and I togetherdefine the scheduling constraints.
u: Activation vector: a 1 × n matrix, where theith element denotes which ST in Sector i istransmitting. If we decide to transmit betweenST j and its BTS, say BTS i, the ith element
of u is j. Evidently an activation vector shouldsatisfy |{j : uj > 0}| £ n0. Also, u must satisfythe exclusion constraints given by I.
U: Maximal activation vector: If no more linksin an activation vector can be activated withoutcausing interference to some othertransmissions scheduled in the same vectorthen this activation vector is maximal.
u: Activation set: the set of all maximal activationvectors.
S: A schedule: A schedule is an N × (n + 1)matrix, with rows corresponding to slots andcolumns (except the last column) correspondingto sectors, where the (i, j)th entry correspondsto the link in the jth sector that is scheduled totransmit in the ith slot. If no ST in the jthsector can transmit in the ith slot of the frame(because this will interfere with other scheduledtransmissions in the frame) the correspondingentry is 0. The last column indicates the numberof consecutive slots for which the activationvector is used.
Fig 2 Radiation pattern of a typical BS antenna that could be used in the deployment.The association region is a 60o. sector centered at the 0o. mark, the taboo regionis 30. on either side of this association region, and the limited interference regioncovers the remaining 240o
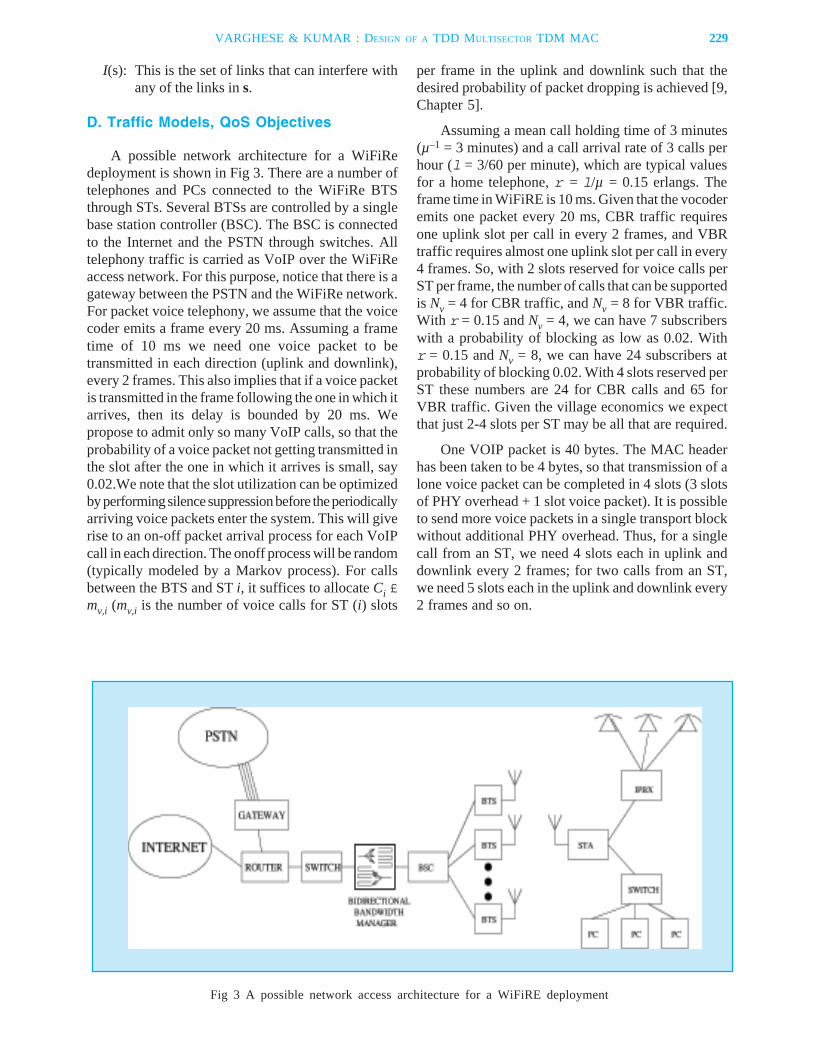
I(s): This is the set of links that can interfere withany of the links in s.
D. Traffic Models, QoS Objectives
A possible network architecture for a WiFiRedeployment is shown in Fig 3. There are a number oftelephones and PCs connected to the WiFiRe BTSthrough STs. Several BTSs are controlled by a singlebase station controller (BSC). The BSC is connectedto the Internet and the PSTN through switches. Alltelephony traffic is carried as VoIP over the WiFiReaccess network. For this purpose, notice that there is agateway between the PSTN and the WiFiRe network.For packet voice telephony, we assume that the voicecoder emits a frame every 20 ms. Assuming a frametime of 10 ms we need one voice packet to betransmitted in each direction (uplink and downlink),every 2 frames. This also implies that if a voice packetis transmitted in the frame following the one in which itarrives, then its delay is bounded by 20 ms. Wepropose to admit only so many VoIP calls, so that theprobability of a voice packet not getting transmitted inthe slot after the one in which it arrives is small, say0.02.We note that the slot utilization can be optimizedby performing silence suppression before the periodicallyarriving voice packets enter the system. This will giverise to an on-off packet arrival process for each VoIPcall in each direction. The onoff process will be random(typically modeled by a Markov process). For callsbetween the BTS and ST i, it suffices to allocate Ci £mv,i (mv,i is the number of voice calls for ST (i) slots
per frame in the uplink and downlink such that thedesired probability of packet dropping is achieved [9,Chapter 5].
Assuming a mean call holding time of 3 minutes(µ–1 = 3 minutes) and a call arrival rate of 3 calls perhour (l = 3/60 per minute), which are typical valuesfor a home telephone, r = l/µ = 0.15 erlangs. Theframe time in WiFiRE is 10 ms. Given that the vocoderemits one packet every 20 ms, CBR traffic requiresone uplink slot per call in every 2 frames, and VBRtraffic requires almost one uplink slot per call in every4 frames. So, with 2 slots reserved for voice calls perST per frame, the number of calls that can be supportedis Nv = 4 for CBR traffic, and Nv = 8 for VBR traffic.With r = 0.15 and Nv = 4, we can have 7 subscriberswith a probability of blocking as low as 0.02. Withr = 0.15 and Nv = 8, we can have 24 subscribers atprobability of blocking 0.02. With 4 slots reserved perST these numbers are 24 for CBR calls and 65 forVBR traffic. Given the village economics we expectthat just 2-4 slots per ST may be all that are required.
One VOIP packet is 40 bytes. The MAC headerhas been taken to be 4 bytes, so that transmission of alone voice packet can be completed in 4 slots (3 slotsof PHY overhead + 1 slot voice packet). It is possibleto send more voice packets in a single transport blockwithout additional PHY overhead. Thus, for a singlecall from an ST, we need 4 slots each in uplink anddownlink every 2 frames; for two calls from an ST,we need 5 slots each in the uplink and downlink every2 frames and so on.
Fig 3 A possible network access architecture for a WiFiRE deployment
VARGHESE & KUMAR : DESIGN OF A TDD MULTISECTOR TDM MAC 229
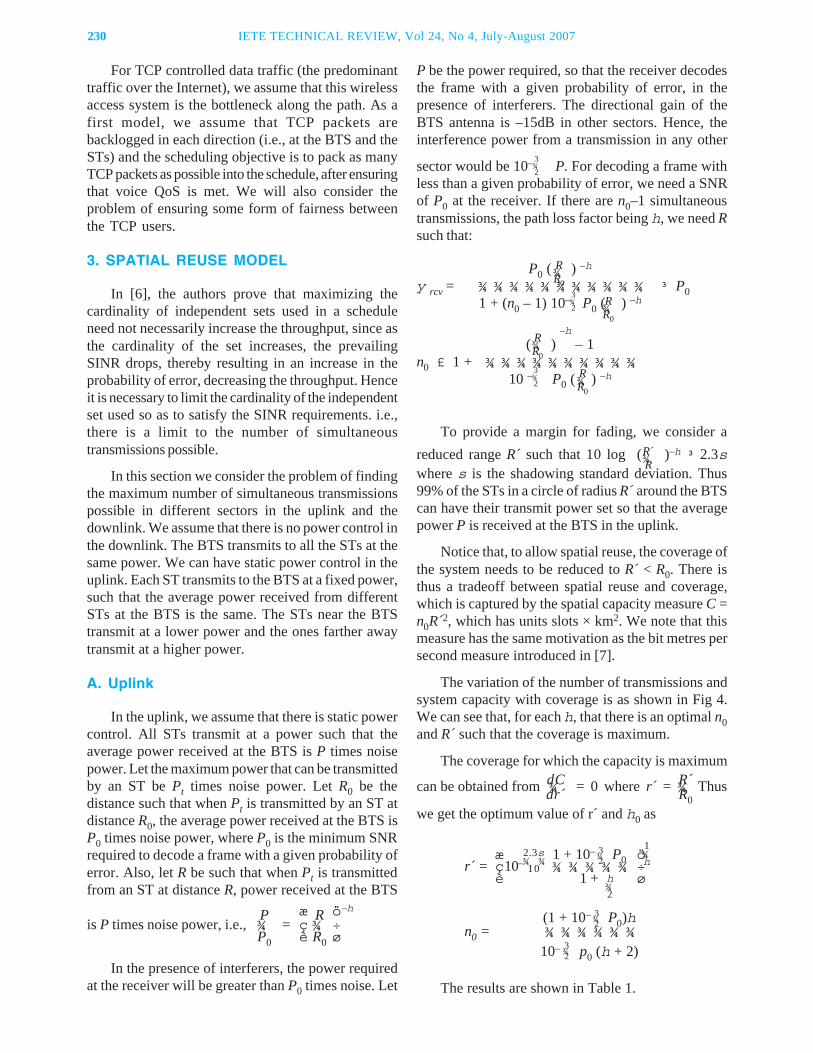
230 IETE TECHNICAL REVIEW, Vol 24, No 4, July-August 2007
For TCP controlled data traffic (the predominanttraffic over the Internet), we assume that this wirelessaccess system is the bottleneck along the path. As afirst model, we assume that TCP packets arebacklogged in each direction (i.e., at the BTS and theSTs) and the scheduling objective is to pack as manyTCP packets as possible into the schedule, after ensuringthat voice QoS is met. We will also consider theproblem of ensuring some form of fairness betweenthe TCP users.
3. SPATIAL REUSE MODEL
In [6], the authors prove that maximizing thecardinality of independent sets used in a scheduleneed not necessarily increase the throughput, since asthe cardinality of the set increases, the prevailingSINR drops, thereby resulting in an increase in theprobability of error, decreasing the throughput. Henceit is necessary to limit the cardinality of the independentset used so as to satisfy the SINR requirements. i.e.,there is a limit to the number of simultaneoustransmissions possible.
In this section we consider the problem of findingthe maximum number of simultaneous transmissionspossible in different sectors in the uplink and thedownlink. We assume that there is no power control inthe downlink. The BTS transmits to all the STs at thesame power. We can have static power control in theuplink. Each ST transmits to the BTS at a fixed power,such that the average power received from differentSTs at the BTS is the same. The STs near the BTStransmit at a lower power and the ones farther awaytransmit at a higher power.
A. Uplink
In the uplink, we assume that there is static powercontrol. All STs transmit at a power such that theaverage power received at the BTS is P times noisepower. Let the maximum power that can be transmittedby an ST be Pt times noise power. Let R0 be thedistance such that when Pt is transmitted by an ST atdistance R0, the average power received at the BTS isP0 times noise power, where P0 is the minimum SNRrequired to decode a frame with a given probability oferror. Also, let R be such that when Pt is transmittedfrom an ST at distance R, power received at the BTS
P æ R ö–h
is P times noise power, i.e., ¾ = ç ¾ ÷P0 è R0 ø
In the presence of interferers, the power requiredat the receiver will be greater than P0 times noise. Let
P be the power required, so that the receiver decodesthe frame with a given probability of error, in thepresence of interferers. The directional gain of theBTS antenna is –15dB in other sectors. Hence, theinterference power from a transmission in any other
sector would be 10– P. For decoding a frame withless than a given probability of error, we need a SNRof P0 at the receiver. If there are n0–1 simultaneoustransmissions, the path loss factor being h, we need Rsuch that:
P0 ( ) –hy rcv = ¾ ¾ ¾ ¾ ¾ ¾ ¾ ¾ ¾ ¾ ¾ ³ P0
1 + (n0 – 1) 10– P0 ( ) –h
( ) –h – 1
n0 £ 1 + ¾ ¾ ¾ ¾ ¾ ¾ ¾ ¾ ¾ ¾10 – P0 ( ) –h
To provide a margin for fading, we consider areduced range R´ such that 10 log ( )–h ³ 2.3swhere s is the shadowing standard deviation. Thus99% of the STs in a circle of radius R´ around the BTScan have their transmit power set so that the averagepower P is received at the BTS in the uplink.
Notice that, to allow spatial reuse, the coverage ofthe system needs to be reduced to R´ < R0. There isthus a tradeoff between spatial reuse and coverage,which is captured by the spatial capacity measure C =n0R´2, which has units slots × km2. We note that thismeasure has the same motivation as the bit metres persecond measure introduced in [7].
The variation of the number of transmissions andsystem capacity with coverage is as shown in Fig 4.We can see that, for each h, that there is an optimal n0and R´ such that the coverage is maximum.
The coverage for which the capacity is maximumdC R´can be obtained from ¾ = 0 where r´ = ¾ Thusdr´ R0
we get the optimum value of r´ and h0 as
æ 1 + 10– P0 ör´ = ç10– ¾ ¾ ¾ ¾ ¾ ÷
è 1 + ø
(1 + 10– P0)hn0 = ¾ ¾ ¾ ¾ ¾ ¾
10– p0 (h + 2)
The results are shown in Table 1.
R¾R0
R¾R0
3¾2
R¾R0
R¾R0
3¾2
R´¾R
3¾2
2.3s¾ ¾10
3¾2
1¾h
h¾2
3¾2
3¾2
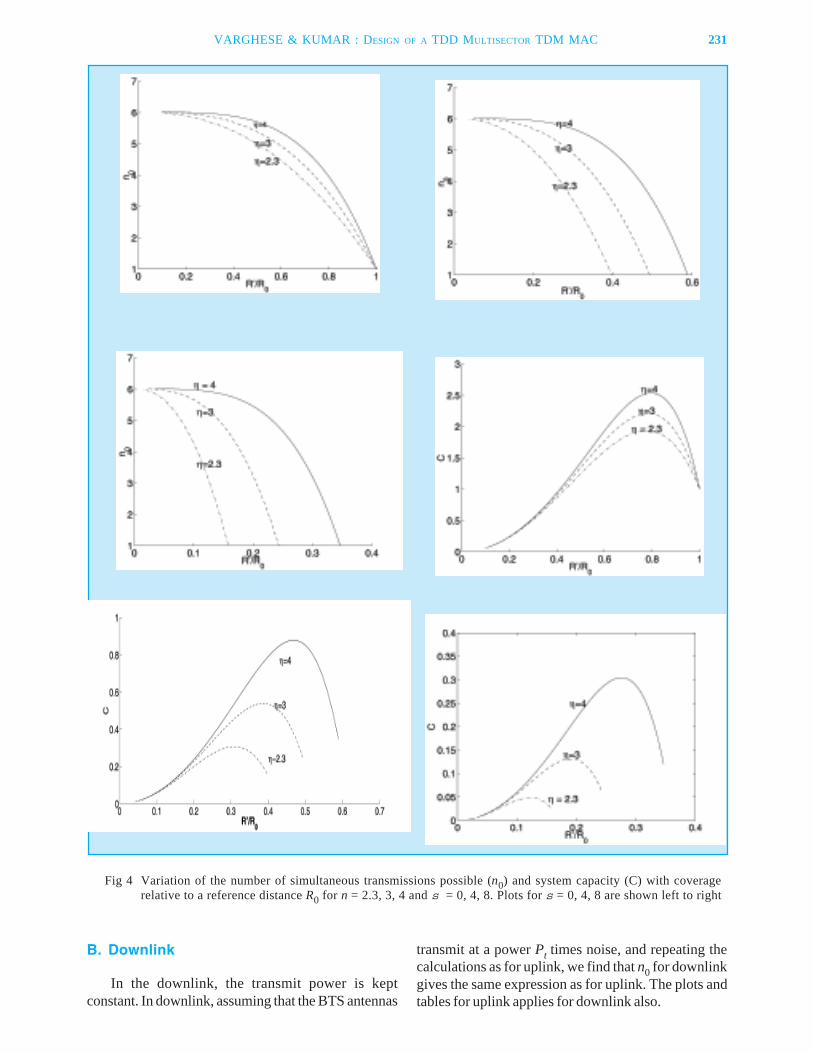
Fig 4 Variation of the number of simultaneous transmissions possible (n0) and system capacity (C) with coveragerelative to a reference distance R0 for n = 2.3, 3, 4 and s = 0, 4, 8. Plots for s = 0, 4, 8 are shown left to right
B. Downlink
In the downlink, the transmit power is keptconstant. In downlink, assuming that the BTS antennas
transmit at a power Pt times noise, and repeating thecalculations as for uplink, we find that n0 for downlinkgives the same expression as for uplink. The plots andtables for uplink applies for downlink also.
VARGHESE & KUMAR : DESIGN OF A TDD MULTISECTOR TDM MAC 231
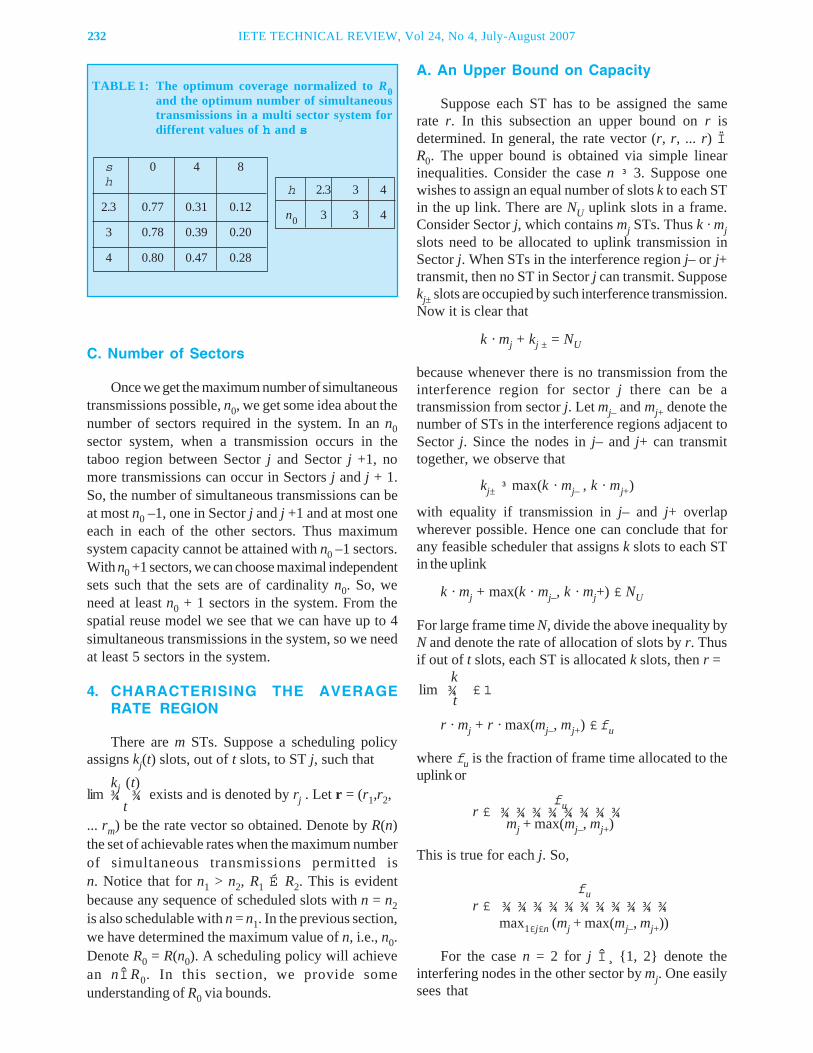
232 IETE TECHNICAL REVIEW, Vol 24, No 4, July-August 2007
C. Number of Sectors
Once we get the maximum number of simultaneoustransmissions possible, n0, we get some idea about thenumber of sectors required in the system. In an n0sector system, when a transmission occurs in thetaboo region between Sector j and Sector j +1, nomore transmissions can occur in Sectors j and j + 1.So, the number of simultaneous transmissions can beat most n0 –1, one in Sector j and j +1 and at most oneeach in each of the other sectors. Thus maximumsystem capacity cannot be attained with n0 –1 sectors.With n0 +1 sectors, we can choose maximal independentsets such that the sets are of cardinality n0. So, weneed at least n0 + 1 sectors in the system. From thespatial reuse model we see that we can have up to 4simultaneous transmissions in the system, so we needat least 5 sectors in the system.
4. CHARACTERISING THE AVERAGERATE REGION
There are m STs. Suppose a scheduling policyassigns kj(t) slots, out of t slots, to ST j, such that
kj (t)lim ¾ ¾ exists and is denoted by rj . Let r = (r1,r2,t... rm) be the rate vector so obtained. Denote by R(n)the set of achievable rates when the maximum numberof simultaneous transmissions permitted isn. Notice that for n1 > n2, R1 É R2. This is evidentbecause any sequence of scheduled slots with n = n2is also schedulable with n = n1. In the previous section,we have determined the maximum value of n, i.e., n0.Denote R0 = R(n0). A scheduling policy will achievean nÎR0. In this section, we provide someunderstanding of R0 via bounds.
A. An Upper Bound on Capacity
Suppose each ST has to be assigned the samerate r. In this subsection an upper bound on r isdetermined. In general, the rate vector (r, r, ... r) ÏR0. The upper bound is obtained via simple linearinequalities. Consider the case n ³ 3. Suppose onewishes to assign an equal number of slots k to each STin the up link. There are NU uplink slots in a frame.Consider Sector j, which contains mj STs. Thus k · mjslots need to be allocated to uplink transmission inSector j. When STs in the interference region j– or j+transmit, then no ST in Sector j can transmit. Supposekj± slots are occupied by such interference transmission.Now it is clear that
k · mj + kj ± = NU
because whenever there is no transmission from theinterference region for sector j there can be atransmission from sector j. Let mj– and mj+ denote thenumber of STs in the interference regions adjacent toSector j. Since the nodes in j– and j+ can transmittogether, we observe that
kj± ³ max(k · mj– , k · mj+)
with equality if transmission in j– and j+ overlapwherever possible. Hence one can conclude that forany feasible scheduler that assigns k slots to each STin the uplink
k · mj + max(k · mj–, k · mj+) £ NU
For large frame time N, divide the above inequality byN and denote the rate of allocation of slots by r. Thusif out of t slots, each ST is allocated k slots, then r =
k lim ¾ £ 1
tr · mj + r · max(mj–, mj+) £ fu
where fu is the fraction of frame time allocated to theuplink or
fu r £ ¾ ¾ ¾ ¾ ¾ ¾ ¾ ¾mj + max(mj–, mj+)
This is true for each j. So,
fu r £ ¾ ¾ ¾ ¾ ¾ ¾ ¾ ¾ ¾ ¾ ¾
max1£j£n (mj + max(mj–, mj+))
For the case n = 2 for j Î ¸ {1, 2} denote theinterfering nodes in the other sector by mj. One easilysees that
TABLE 1: The optimum coverage normalized to R0and the optimum number of simultaneoustransmissions in a multi sector system fordifferent values of hhhhh and sssss
s 0 4 8h
2.3 0.77 0.31 0.12
3 0.78 0.39 0.20
4 0.80 0.47 0.28
h 2.3 3 4
n0 3 3 4
fur £ ¾ ¾ ¾ ¾ ¾ ¾ ¾ ¾ ¾ ¾ ¾max(m1 + m1´, m2 + m2´)
B. An Inner Bound for the Rate Region
In this section a rate set RL is obtained such thatRL Ì R0. i.e., RL is an inner bound to the achievablerate set.
Reuse constraint graph: The vertices of thisgraph represent the links in the WiFiRe cell. In anyslot we consider only uplinks or only downlinks. Twovertices in the graph are connected if a transmission inone link can cause interference to a transmission inthe other link. The reuse constraint graph is representedas (V, e), where V is the set of vertices and e is the setof edges.
Clique: A fully connected subgraph of the reuseconstraint graph. A transmission occurring from anST in a clique can interfere with all other STs in theclique. At most one transmission can occur in a cliqueat a time.
Maximal clique: A maximal clique is a cliquewhich is not a proper subgraph of another clique.
Clique incidence matrix: Let k be the number ofmaximal cliques in (V, e). Consider the k × m matrix Qwith
ì 1 if link j is in clique iQi,j = í
î 0 o.w.
By the definition of r and Q, a necessary conditionfor r to be feasible is (denoting by 1, the column vectorof all 1s.)
Q · r £ 1
since at most one link from a clique can be activated.In general, Q· r £ 1 is not sufficient to guarantee thefeasibility of r. This condition is sufficient if the graphis linear. A linear graph is one in which the nodes canbe indexed in such a way that if nodes i, j, i < j, are inthe clique then each node k with i £ k £ j is also in theclique; i.e., the nodes of each maximal clique arecontiguous in the indexing. Such a graph will have aclique incidence matrix of the form
é 1 1 1 1 ... ... 0 0 0 ùê úê 0 0 1 1 1 1 ... 0 0 úê ú
Q = ê 0 0 0 0 1 1 1 1 ... úê úê : : úê . . úë 0 0 0 0 0 ... 1 1 1 û
The reuse constraint graph in the multisectorscheduling problem being considered has a ringstructure. In any case, the set of rate vectors satisfyingQ · r £ 1 provides an outer bound to the rate set. Alinear subgraph can be extracted from the reuseconstraint graph by deleting one sector, or equivalentlysetting all rates in one sector to 0. Let us index the STsin such a way that we can write a rate vector r as:
r = (r1, r2, · · · , rm)
where, for 1 £ k £ m, rk is the rate vector for the STsin Sector k. Since deleting one sector yields a lineargraph, if r is such that rk = 0, and Q · r £ 1 then r is afeasible rate vector (which assigns 0 rates to all STs inSector k). Linear combinations of feasible rate vectorsare also feasible (since time sharing can be done overthe schedules that achieve these vectors). Define
R := {r : Q · r £ 1, for some k, 1 £ k £ m, rk = 0}
Further, let RL be the convex hull of R. By theabove discussion, it follows that RL Ì R0. Thus wehave an inner rate region. We will use this inner boundin the next section.
C. Optimum Angular Positioning of theAntennas
As can be seen from the previous section, thefeasible rates set, R0, of the system depends on thespatial distribution of the STs around the BTS. Thusthe R0 varies as the sector orientation is changed. Asystem where the antennas are oriented in such a waythat most STs fall in the association region of theBTSs rather than in the taboo region will have morecapacity than one in which more STs are in the tabooregions.
One sector boundary is viewed as a reference.Let R0(q) denote the feasible rate set, when thisboundary is at an angle q with respect to a reference
360odirection. Then, for each 0 £ q £ ¾ ¾ , we have anrate region R0(q), where n is the number of sectors.Since R0(q) is not known, the inner bound RL(q)(obtained earlier) is used in the following analysis. Ifeach vector r is assigned a utility function U(r), thenone could seek to solve the problem
max max U(r)0 £ q £ ¾¾ rÎR0(q).
and then orient the sectors corresponding to the optimumvalue of q.
VARGHESE & KUMAR : DESIGN OF A TDD MULTISECTOR TDM MAC 233

234 IETE TECHNICAL REVIEW, Vol 24, No 4, July-August 2007
We can examine various forms for the utilityfunction. The optimization can be done so as tomaximize the average rate allocated to each ST, withthe constraint that each ST gets the same averagerate. This is called max-min fairness. Trying to optimizethe rates such that the rate to each ST is maximizedwill adversely affect the sum capacity of the system.So, take U(r) = Sm
j=1 (rj ). This maximises the sumcapacity of the system, giving preference to STs thatare in a favourable position, causing less interferenceto other STs. This has an impact on the fairness of thesystem. To improve the fairness, we can take the logutility function, U(r) = Sm
i=1 log(r(i)); this is known tolead to what is called proportional fairness.
Evaluating the upper and lower bounds derivedabove, we find that the bounds are close to each other.So, we only report the results from the lower bound.Hence, we have computed maxrÎRL(q) U(r) for variousvalues of . For each we obtain a vector r of average
rates. We evaluate the fairness of this vector by using
the the fairness index is given by .
If the rates to different STs are equal, then fairnessindex is 1, and the index decreases if there is ratevariability between the STs.
In Fig 5 we plot, as a function of q, the total rate(left panel) over all the STs for each of the three utilityfunctions, and also the fairness index (right panel) (thelower bounds are plotted here). It can be seen that
maximizing the sum rate gives high overall capacity,but poor fairness. On the other hand, maximizing theaverage rate to each ST gives good fairness, but lowsum capacity. Maximizing Sm log ri gives a good tradeoff between maximizing the system capacity andproviding fairness. It is interesting to note that inmaximum Sm log ri case, the sum capacity is higherwhen fairness is lower and vice versa. For example, atq = 10, we can see that the sum rate is close to 4. Thefairness index is also close to 1. So, we may choosethis orientation to operate the network.
Note that the above computation can be done off-line once the ST locations are known. Then the sectororientations can be obtained from this analysis.
5. SCHEDULING: PROBLEM FORMULA-TION AND SCHEDULER DESIGN
Based on the discussion up to this point, thescheduling problem we are faced with is the following.
First partition the frame of size N slots into acontiguous part with ND downlink slots and an uplinkpart with NU uplink slots, such that ND + NU = N – NB,where NB is the number of slots required for theperiodic beacon. Typically we will have ND » NU. Thisis because data transfer traffic is highly asymmetric,as users download a lot more than they upload. Duringdownloads, long TCP packets (up to 1500 bytes) arereceived in the downlink and one 40 byte TCP ACK issent in the uplink for every alternate TCP data packetreceived.
Fig 5 Variation of sum rate and fairness index with antenna orientation for different utility functions
Now, when mv,i, 1 £ i £ m, VoIP calls are admittedfor ST i, we need to determine the number of slots Cito be reserved in the uplink and downlink subframesfor ST i, such that the QoS targets are met for all thevoice calls. For doing this, evidently the set of vectorsC = (C1, ...,Cm) that are feasible (i.e., can be scheduled)needs to be known. For each A and I, there will be anoptimal set of such vectors Copt(A, I), and for anypractical scheduler, there will be an achievable set ofadmissible vectors C Î ¸ Copt(A, I).
Once the required vector of voice payload slotshas been scheduled, we need to schedule as manyadditional payload slots, so as to maximize the trafficcarrying capacity for TCP while ensuring some fairnessbetween the flows.
A. Obtaining the Activation Set
Consider a graph with the STs and BTSs as nodesand the communication links between the STs andBTSs as edges. An activation vector is a matching onthis graph. [8] proposes randomized algorithms thatcan be used for finding nearmaximal matchings, withcomplexity O(Number of nodes). But, the inherentgraph in the problem we consider being bipartite innature, and the scheduling being centralized, the maximalmatchings can be found without randomized algorithms.
The algorithm for enumerating a maximal activationvector is as follows.
Algorithm 5.1
1) Choose a link to be included in the activationvector. This might be based on criteria such as(i) the link with the longest queue length, (ii) orthe link that received the lowest average rateover previous window of frames.
2) Eliminate all the links that can cause interferenceto transmission on the set of links chosen untilthis point.
3) Choose the best link (according to the abovecriterion) from the remaining set of links.
4) Repeat Steps 2 and 3 until there are no morelinks that can be activated, or the set contains n0links (the maximum that can be activated at atime).
Remarks 5.1:
Suppose that we consider only TCP traffic. If wetry to maximize the number of useful slots without anyregard to fairness, then the schedule will be to use thevector U with maximum cardinality (U Î u) for all
slots. Then, a bound on the total number of slotsavailable for transmission would be
æ Tmax – 3 ö|U| ç¾ ¾ ¾ ¾ ÷N
è Tmax ø
if the frame size N is an integral multiple of Tmax. Notethat the maximal activation vector depends on theantenna used, the distribution of STs, etc. If there areseveral activation vectors with with the maximumcardinality, we can achieve some fairness by cyclingbetween these vectors every Tmax slots. Still, thisthroughput maximising approach may result in someSTs getting starved.
B. The Optimal Scheduling Problem forUplink
As an illustration, we focus here on the uplinkscheduling problem. The uplink scheduling problemavoids the slight complexity in the downlink problem,that, in the downlink, we can combine transmissionsfrom a BTS to multiple STs in the same TB.
An instance of a scheduling problem is defined byan association matrix A, an interference matrix I, anda vector C Î Copt(A, I) of required uplink voicecapacities for the STs. We formulate the uplinkscheduling problem as a constrained dynamic programover a finite horizon NU, i.e., over the indices k Î {1, 2,..., NU}, where NU is the number of uplink slots in aframe. The state of the system at the beginning of slotk is denoted by (xk, qk), where
xk: a 1 × m vector with xki denoting the number ofconsecutive slots for which ST i has beentransmitting; clearly, x0 = (0, 0, ..., 0)
qk: a 1 × m vector, with qki being the number ofrequired voice slots yet to be scheduled; clearlyq0 = C = [C1,C2, ..., Cm]
At the beginning of slot k, k Î ¸ {0, 1, ..., NU–1} anactivation vector uk Î ¸ u is selected. Then in the slot,all links appearing in u are allowed to transmit, withthe voice queues being depleted first. The state evolvesas follows.
xk+1,i = f1(xki, uki)
ì (xk,i + 1)I{uk,B(i)= i} xk,i + I{uk,B(i)=i} < Tmax= íî 0 xk,i + I{uk,B(i)=i} = Tmax
i.e., if ST i is scheduled in slot k, (uk,B(i) = 1) and themaximum TB length has not been reached, then we
VARGHESE & KUMAR : DESIGN OF A TDD MULTISECTOR TDM MAC 235
236 IETE TECHNICAL REVIEW, Vol 24, No 4, July-August 2007
increment the burst length from ST i by 1, else theburst length is reset to 0. Further, qk, k ³ 0, evolves asfollows.
qk+1,i = f2(qki, xki, uki) = (qk,i – I{uk,B(i)=1} I{xk,i>3})+
i.e., the number of required voice slots reduces by 1provided the overhead part of the current TB haselapsed. Note that x+ = max(0, x).
We now define the reward structure. We wish tosatisfy the need for voice slots and having done that,we wish to maximize the number of slots remainingfor TCP data. Define the reward in slot k, 0 £ k £ N –1 by
mgk(xk, uk) = S I{uk,B(i)=i} I{xki>3}
i=1
i.e., this is the total number of payload slots scheduledin slot k. Clearly, gk(xk, uk) £ n, since there can be atmost n transmissions at a time.
Then, we set a terminal cost
ì 0 qN = 0gN = í
î –¥ if qNi > 0 for some i
i.e., we incur an infinite cost if we are unable toschedule all the required voice slots.
A scheduling policy maps the state at slot k to avector u Î ¸ u. Let p denote a generic policy. Thenthere is a sequence of functions pk : (x, q) ® u thatdefine the policy. Define
N–1JN
p (0, C) = S gkp (Xk, uk) + gN
p
k=0
where Xk evolves as explained as above under thepolicy p We wish to solve
max Jnp (0, C)
p
and obtain the optimal policy. Let JN* (0, C) denote the
optimal value and p* be an optimal policy. Since thenumber of policies are finite for each C Î Copt(A, I),JN
* (0, C) is finite and there exists a p*.
C. On Solving the DP formulation
In the dynamic programming formulation of thescheduling problem, the state of the system can be
æ xk öwritten as, Xk = ç ÷ . The system evolves asè qk ø
æ f1(xk, uk) öXk+1 = f(Xk, uk) = ç ÷
è f2(qk, xk, uk) ø
The single stage reward in using the control uk,when the system is in state Xk is given by
mg(Xk, uk) = S I{uk,B(i)=i}, I {xki>3}
i=1
Terminal cost is
ì 0 qN = 0JN(XN) = í
î – ¥ o.w.
The control uk, i.e., the activation vector to beused in slot k, is the one that attains the maximum inthe recursion
Jk(XK) = max {g(Xk, uk) + Jk+1 (f(Xk, uk), uk)}
We can do a backward recursion, with all possibleXN , and proceed to find the controls that maximize thereward at each stage. The set of controls, {u0, u1,...,uN–1} that maximizes J0(0, q0) as obtained by theabove recursion is the optimal schedule.
But, this approach is feasible [10, Chapter 1] onlywhen the number of stations is small. The size ofspace occupied by xk is almost (¾ ¾ ¾) n, since onestation could be transmitting in each sector, and xkimay be any integer between 0 to Tmax. So also, thenumber of controls that can be applied increases asO(Nm), since we can choose one station from eachsector, such that it obey the constraints. The exponentialincrease in the size of state space and control spacewith the number of stations make this approachinfeasible.
D. A Greedy Heuristic Scheduler forVoice in Uplink
At each slot k, we heuristically build an activationvector uk Î u starting from an ST in {i : qk,i =maxj qk,j}. Then we follow the approach in Algorithm5.2 each time we choose an ST with max residual qk,j
Algorithm 5.2:
1) Modify the voice queue lengths to include theoverhead slots required. i.e., if an ST has a voicequeue of 2 packets, add 3 slots of PHY overheadto make the queue length 5.

2) Initially, slot index k = 0. Let ST i be such that
qki = max {qkl}l=1...m
i.e., The ST with longest voice queue at thebeginning of slot k is i. Form activation vector uwith link i activated. i.e., u = {i}
3) Let ST j be such that
qkj = max {qkl : l Ï I(u)}l
j is such that it is the noninterfering ST withmaximum queue length. Augment u with link j.Now, find I(u) corresponding to the new u.
4) Repeat Step 3 until the activation vector that weget is a maximal activation vector.
5) Letn = {qkl : min (qkl, l Î u)}
l=1,...,m
i.e., n is the minimum number of slots requiredfor the first ST in u to complete its transmission.Use u in the schedule from kth to (k + n)th slot.
ì qk,i – n for i Îu´qk+n,i = í
î qk,i for i Ïu´
and k = k + n i.e., slot index advances by n, andthe queue length for the STs at the beginning ofk + nth slot is n less
6) At the end of the k + nth slot,
u = u – {l : qkl = min(qkl, l Î u)}
i.e., remove from the activation vector, thoseSTs that have completed their voice slotrequirement.
7) Go back to Step 3 and form maximal activationvector including u. Continue the above procedureuntil q = 0 or n = NU In this step, we form a newactivation vector with the remaining STs in theactivation vector (which need more slots tocomplete their requirement).
8) Once the voice packets are transmitted, we servethe TCP packets in the same way, except that ifin forming a maximal activation set, it is foundthat the only schedulable ST has only TCP packetsto send, then TCP packets are scheduled.
If q > 0 when n = NU, the allocation is infeasible.
Fig 6 A typical deployment of a system with 3 sectors and 15 STs
VARGHESE & KUMAR : DESIGN OF A TDD MULTISECTOR TDM MAC 237
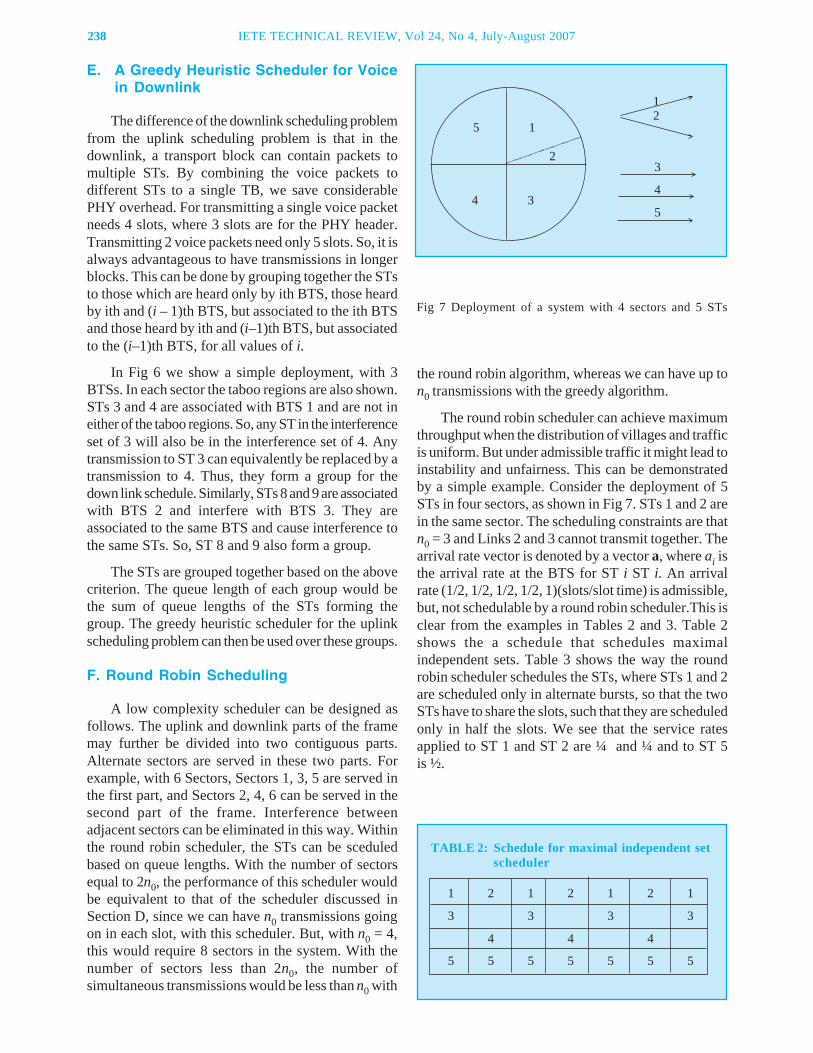
238 IETE TECHNICAL REVIEW, Vol 24, No 4, July-August 2007
E. A Greedy Heuristic Scheduler for Voicein Downlink
The difference of the downlink scheduling problemfrom the uplink scheduling problem is that in thedownlink, a transport block can contain packets tomultiple STs. By combining the voice packets todifferent STs to a single TB, we save considerablePHY overhead. For transmitting a single voice packetneeds 4 slots, where 3 slots are for the PHY header.Transmitting 2 voice packets need only 5 slots. So, it isalways advantageous to have transmissions in longerblocks. This can be done by grouping together the STsto those which are heard only by ith BTS, those heardby ith and (i – 1)th BTS, but associated to the ith BTSand those heard by ith and (i–1)th BTS, but associatedto the (i–1)th BTS, for all values of i.
In Fig 6 we show a simple deployment, with 3BTSs. In each sector the taboo regions are also shown.STs 3 and 4 are associated with BTS 1 and are not ineither of the taboo regions. So, any ST in the interferenceset of 3 will also be in the interference set of 4. Anytransmission to ST 3 can equivalently be replaced by atransmission to 4. Thus, they form a group for thedown link schedule. Similarly, STs 8 and 9 are associatedwith BTS 2 and interfere with BTS 3. They areassociated to the same BTS and cause interference tothe same STs. So, ST 8 and 9 also form a group.
The STs are grouped together based on the abovecriterion. The queue length of each group would bethe sum of queue lengths of the STs forming thegroup. The greedy heuristic scheduler for the uplinkscheduling problem can then be used over these groups.
F. Round Robin Scheduling
A low complexity scheduler can be designed asfollows. The uplink and downlink parts of the framemay further be divided into two contiguous parts.Alternate sectors are served in these two parts. Forexample, with 6 Sectors, Sectors 1, 3, 5 are served inthe first part, and Sectors 2, 4, 6 can be served in thesecond part of the frame. Interference betweenadjacent sectors can be eliminated in this way. Withinthe round robin scheduler, the STs can be sceduledbased on queue lengths. With the number of sectorsequal to 2n0, the performance of this scheduler wouldbe equivalent to that of the scheduler discussed inSection D, since we can have n0 transmissions goingon in each slot, with this scheduler. But, with n0 = 4,this would require 8 sectors in the system. With thenumber of sectors less than 2n0, the number ofsimultaneous transmissions would be less than n0 with
the round robin algorithm, whereas we can have up ton0 transmissions with the greedy algorithm.
The round robin scheduler can achieve maximumthroughput when the distribution of villages and trafficis uniform. But under admissible traffic it might lead toinstability and unfairness. This can be demonstratedby a simple example. Consider the deployment of 5STs in four sectors, as shown in Fig 7. STs 1 and 2 arein the same sector. The scheduling constraints are thatn0 = 3 and Links 2 and 3 cannot transmit together. Thearrival rate vector is denoted by a vector a, where ai isthe arrival rate at the BTS for ST i ST i. An arrivalrate (1/2, 1/2, 1/2, 1/2, 1)(slots/slot time) is admissible,but, not schedulable by a round robin scheduler.This isclear from the examples in Tables 2 and 3. Table 2shows the a schedule that schedules maximalindependent sets. Table 3 shows the way the roundrobin scheduler schedules the STs, where STs 1 and 2are scheduled only in alternate bursts, so that the twoSTs have to share the slots, such that they are scheduledonly in half the slots. We see that the service ratesapplied to ST 1 and ST 2 are ¼ and ¼ and to ST 5is ½.
TABLE 2: Schedule for maximal independent setscheduler
1 2 1 2 1 2 1
3 3 3 3
4 4 4
5 5 5 5 5 5 5
Fig 7 Deployment of a system with 4 sectors and 5 STs
5 1
4 3
2
12
3
4
5
TABLE 3: Schedule for round robin scheduler
1 2 1
3 3 3
4 4 4 4
5 5 5
Fig 8 Variation of total rate and fairness index with averaging interval for differentvalues of a. The upper set of plots are of the total rate, and bottom set are forthe fairness index
Another observation is that with the increase invariability of the distribution of STs in sectors, theround robin scheduler tends to become unfair.
G. Fair Scheduling for Data
To provide fairness to users, we keep track of theaverage rates allocated to STs over time. The STswith low average rate are given the chance to transmitfirst. Maximal independent sets are formed startingfrom the ST with the lowest average rate. Once theslots for voice transmission are scheduled, we attemptto include TCP transmissions in blocks of size Tmax,so that the PHY overhead per slot is minimized.
Let Rk be the vector of average rates allocated toSTs until the kth slot and rk be the vector of ratesallocated to the STs in the kth slot.
Rk+1 = aRk + (1 – a)rk
1) Given a rate vector R, obtain a maximalindependent set as follows
a) u1 = {i1}i1 = argmin1£j£n RjI(u1) is the set of links interfering with thelinks in u1. In this step, we select the ST withthe smallest average rate Rk for transmission.
b) Choose i2 Î ¸ arg min1£j£n,i2 Ï I¸(u1) Rju1 = {i1, i2}. In this step, we select one of thenon interfering STs with minimum averagerate for transmission.
c) Repeat the above until a maximal independentset is obtained. Now, we have a set with STswhich have received low average rates in theprevious slots. So, once all STs transmit theirvoice packets, we schedule these STs fordata packets.
2) Let l1 denote the number of nodes in u1 at theend of step 1. Repeat the above for the remaining
VARGHESE & KUMAR : DESIGN OF A TDD MULTISECTOR TDM MAC 239
240 IETE TECHNICAL REVIEW, Vol 24, No 4, July-August 2007
n–l1 nodes. Now we have a maximalindependent set from the remaining Nu – l1 nodes.If any one of the l1 nodes can be activated alongwith the maximal independent set formed fromthe Nu–l1 nodes, add that till one get a maximalindependent set. This yields u1, u2 ... uk such thateach node is included at least once. Each node isincluded at least once since a given number ofslots is to be reserved for each ST in everyframe.
3) Now, we need to schedule u1 for t1, u2 for t2, etc.To maximize throughput, we take tj = Tmax ornumber of voice slots required. The vectors inthe initial part of the schedule had low averagerate over frames. So, they get priority to senddata packets. So, starting from j=1, i.e., from thefirst activation vector, if the sum of number ofslots allocated to STs in the frame is less thanNu, tj = Tmax. Else, tj = number of voice slotsrequired.Therefore transmission takes place in
blocks of length equal to Tmax as long as it ispossible.
4) Update the rate vector as
Rk+1 = a Rk + (1 – a)rk
We simulated the algorithm and obtained thefairness index of the rates allocated, and the total rateachieved for various values of a. These are plottedvs. the rate averaging interval in Fig 8. The averaginginterval on the x axis is the number of frames overwhich the average throughput or fairness index iscalculated. The fairness index is found to be close toone unless the averaging interval is very small. Thisoccurs partly because of the small number of STs
TABLE 4: Simulation results for downlink datarates with 80 STs in 6 sectors, averagedover 30 random deployments. The datathrougputs are given in kilo bits persecond
n0q Number of voice callsper station
1 2 3
3, 10o min d/l rate 164 148 134max d/l rate 178 182 167sum d/l rate 13749 12852 11690
3, 10o min d/l rate 163 151 136max d/l rate 179 173 177sum d/l rate 13545 12798 11799
3, 10o min d/l rate 167 153 137max d/l rate 180 173 161sum d/l rate 13883 13000 11750
3, 10o min d/l rate 224 204 190max d/l rate 294 278 258sum d/l rate 19807 18377 17007
3, 10o min d/l rate 204 194 177max d/l rate 283 255 274sum d/l rate 19312 17919 16430
3, 10o min d/l rate 172 165 140max d/l rate 212 208 190sum d/l rate 15573 14078 12499
TABLE 5: Simulation results for uplink data ratesand packet drop with 80 STs in 6 sectors, averagedover 30 random deployments. The data througputsare given in kilo bits per second
n0q Number of voice callsper station
1 2 3
3, 10o min u/l rate 17.1 8.1 0max u/l rate 85 59 34sum u/l rate 3570 2286 1229
packet drop u/l 0 0.0029 0.0229
3, 20o min u/l rate 13 5 0max u/l rate 88 57 31sum u/l rate 3510 2285 1110
packet drop u/l 0 0.0033 0.0312
3, 30o min u/l rate 16 5 0max u/l rate 83 62 43sum u/l rate 3463 2114 1176
packet drop u/l 0 0.0042 0.0346
4, 10o min u/l rate 38 18 0max u/l rate 106 92 78sum u/l rate 5161 3776 2906
packet drop u/l 0 0.0029 0.0283
4, 20o min u/l rate 25 9 0max u/l rate 157 168 160sum u/l rate 4833 3699 2771
packet drop u/l 0 0.0025 0.0304
4, 30o min u/l rate 15 7 0max u/l rate 92 70 53sum u/l rate 3468 2400 1359
packet drop u/l 0 0.0029 0.0354
considered. A larger a in the rate averaging algorithmyields a smaller average throughput.
6. VOICE AND DATA CAPACITY:SIMULATION RESULTS
The scheduling algorithm discussed in Section 5Dwas implemented in a MATLAB simulation. The PHYrate is 11 Mbps. We consider a random distribution of80 STs in 6 sectors. The spatial reuse n0 of 3 or 4 hasbeen considered, and the taboo regions in each sector,on either side of the sector, are q = 10o, 20o, 30o.Simulation is done with all STs having the same numberof ongoing voice calls: 1, 2 or 3. One VoIP callrequires one slot every alternate frame. A voice packetthat arrives in the system is scheduled within the nexttwo frames. If the scheduling constraints do not allowthe voice packet to be transmitted within two frametimes of arrival, the packet is dropped. In the simulation,we have assumed synchronous arrival of voice packets,i.e., if two voice calls are going on from an ST,packets for both calls arrive synchronously, in thesame frame. The data traffic model is that all the STshave packets to be transmitted throughout.
The results are shown in Table 4 and Table 5.Here, min d/l rate is the average of the minimum rateover STs in the downlink, averaged over 30 randomdeployments; max d/l rate is the average of themaximum rate over STs in the downlink, and sum d/lrate is the average of the sum of downlink rates to theSTs. The same measures are also given for the uplink.The packet drop u/l is the fraction of voice packetsdropped in the uplink, this being the bottleneck direction.All the rates indicated are in terms of the MACpayload. The PHY overhead has already beenaccounted for in the calculations.
Each voice call requires a payload of 44 Bytesevery 20 ms, and hence 1.41 Mbps are utilised pervoice call, in the uplink and downlink, for 80 STs. Witha PHY rate of 11 Mbps, with n0 = 3 we have anaggregate nominal rate of 22 Mbps in the downlinkand 11 Mbps in the uplink (assuming that 2/3 of theframe time is allocated to the downlink). From thetable, it can be seen that with 80 STs in 6 sectors, and1 voice call, with a taboo region of 10o on either side ofeach sector, and n0 = 3, each ST gets an averageminimum data throughput of 164 kbps, and the averagetotal rate is 13.749 Mbps. Adding to this 1.41 Mbps,we obtain about 15.16 Mbps, for a nominal downlinkbandwidth of 22 Mbps. The difference is because ofPHY overheads, and the inability to fill up all slots in aframe. We notice that a second simultaneous call ateach ST reduces the data throughput by less than 1
Mbps; this is because the packing can become moreefficient. For this same case, with one voice call, theaverage minimum uplink data throughput is 17 kbps,and the average total downlink data throughput is 3.57Mbps. Adding to this 1.41 Mbps for voice, we obtain atotal uplink utilisation of 5.18 Mbps over a nominalbandwidth of 11 Mbps allocated to the uplink. Becauseof being smaller, the uplink frame is more inefficientlypacked.
If n0 = 3 and a taboo region of width q = 10o, thefraction of voice packets dropped is 0.29% when wesupport 2 calls per ST and 2.29% when we support 3calls per ST. With 3 voice calls per station, we can seethat the packet drop is high, and the uplink capacitiesto some STs are 0. With n0 = 3, the width of the tabooregion does not have an effect on the system capacity,since we are always able to schedule in 3 sectors.With n0 = 4, the system capacity reduces as qincreases. With q = 30., we can usually scheduletransmissions in just 3 sectors in a slot, even thoughthe SINR constraints allows 4 transmissions in a slot.
7. CONCLUSION
We consider the problem of finding the amount ofspatial reuse possible with a single channel multi sectorWIFiRE system with 802.11 MAC. It has been foundthat there is an optimum value for the number ofsimultaneous transmissions possible, so as to maximizethe total system capacity. The number of simultaneoustransmissions is found to depend on the path lossfactor and the radiation pattern of the antenna. For theantenna pattern considered, and for path loss factor2.3, as is applicable for rural environments, the numberof simultaneous transmissions possible is found to be3. This can be improved by the user of antennas withlesser back lobe radiation.
Also, for a given deployment, we find bounds tothe system capacity, assuming full channel reuse.Based on this we can find the optimum positioning ofthe antenna, such that the log utility function of ratesobtained by different STs is maximized. The boundsobtained here are weak since we do not consider theconstraint imposed by the maximum number ofsimultaneous transmissions.
A constrained dynamic programming problem isfound to give the optimum schedule for the system.But, the problem is intractable due to the explosion ofstate and action space. We employ a maximal weightalgorithm were the weights are the queue lengths ofthe voice queue, such that each ST transmits incontiguous slots, so as to minimize the PHY overhead.
VARGHESE & KUMAR : DESIGN OF A TDD MULTISECTOR TDM MAC 241
242 IETE TECHNICAL REVIEW, Vol 24, No 4, July-August 2007
For scheduling data in the system, we follow themaximal weight algorithm, where the weights arereciprocal of the average rate obtained by each ST inprevious slots. The average considered is an exponentialweighted average of rates. A simple round robinscheduler have also been considered. Schedulingexamples are given for the greedy heuristic scheduler.
The different schedulers considered wereimplemented in MATLAB and the data throughput ineach case is obtained as the average data throughputover deployments, in terms of payload slots.Deployments with different number of sectors andSTs, width of taboo region have been considered fordifferent voice loads, and the data throughput hasbeen obtained in each case.
REFERENCES
1. Wi-Fi Rural Extension (Wi-FiRE), Technical report,w w w . c e w i t . o r g . i n / d o c m s / c e w i t 0 7 / r e v i e w -comments-draft.pdf.
2. Krishna Paul, Anitha Varghese, Sridhar Iyer,Bhaskar Ramamurthi & Anurag Kumar, WiFiRe:Rural area broadband access using the WiFi PHYand a multisector TDD MAC, IEEE Communica-tions Magazine, 2007.
3. Pravin Bhagwat, Bhaskar Raman & Dheeraj Sanghi,Turning 802.11 Inside-Out, ACM SIGCOMMComputer Communication Review, 34(1):33–38, Jan2004.
4. Bhaskar Raman & Kameswari Chebrolu, RevisitingMAC Design for an 802.11-based Mesh Network,Third Workshop on Hot Topics in Networks, SanDiego, Nov 2004.
5. Harish V Shetiya, Efficient Routing and Schedulingfor IEEE 802.16 Mesh network, Master’s thesis,Electrical Communication Enigineering, IISc, 2005.
6. Arash Behzad & Izhak Rubin, On the Performance ofGraph Based Scheduling Algorithms for PacketRadio Networks, GLOBECOM, 2003.
7. Piyush Gupta & P R Kumar, The Capacity ofWireless Networks, IEEE Transactions onInformation Theory, IT46(2), pp 388-404, March2000.
8. Devavrat Shah, Paolo Giaccone & Balaji Prabhakar,An efficient randomized algorithm for input-queuedswitch scheduling, IEEE Micro, 22(1), pp 19-25,January-February 2002.
9. Anurag Kumar, D Manjunath & Joy Kuri,Communication networking, an analyticalapproach, Norgan, Kaufman Networking Services,Elsevier 2004.
10. Dimtri P Bertsekas, Dynamic Programming andOptimal Control, vol 1, Athena Scientific, 2001.
Anurag Kumar received BTechfrom IIT Kanpur and PhD from CornellUniversity, both in electricalengineering. He was with BellLaboratories, Holmdel, New Jersey, forover six years. He is now a professor ofthe Electrical CommunicationsEngineering Department at the IndianInstitute of Sciences, Bangalore. His areaof research is Communicationnetworking, and he has recently focused primarily on wirelessnetworking. He is a fellow of the IEEE, the Indian NationalScience Academy (INSA), and of the Indian National Academyof Engineering (INAE). He is an associate editor of IEEETransactions on Networking and IEEE CommunicationsSurveys and Tutorials. He is a co-author of the textbookCommunication Networking: An Analytical Approach by
Authors
Kumar, Manjunath, and Kuri (Morgan-Kaufman/Elsevier).
* * *
Anitha Varghese obtained BTechdegree from the College of Engineering,Thiruvananthapuram, Kerala, in 2004and ME from the ElectricalCommunications EngineeringDepartment, Indian Institute of Science,Bangalore. She is presently working inthe Vehicular Communications andInformation Management group inGeneral Motors , ISL, Bangalore.
* * *
243
Paper No 124-C; Copyright © 2007 by the IETE.
IETE Technical ReviewVol 24, No 4, July-August 2007, pp 243-248
Trends in VLSI Technology –Rural Applications Perspective
K LAL KISHORE
Professor in ECE and Registrar, JNT University, Kakatpally, Hyderabad 500 085, India.email: [email protected]
VLSI Technology has advanced rapidly since late 90s. Low cost, high performanceChips designed and fabricated made strong impact in systems development and resulted inapplications to diversified fields like computers, communications, entertainment electronics,medicine, and rural necessities. Spreading of Internet globally, making this world as a ‘globalvillage” and rapid strides in mobile communications have a direct bearing on the progressmade in VLSI technology. Research work is being done to further develop the technology innew dimensions like Silicon Photonics, Organic semi-conductors, Flexible displays etc. Thesedevelopments take the technology further close to rural applications and can result insignificant improvement in the quality of life in villages. Fibre optic connectivity, hosting ofportals with useful information to rural folk, e-governance, energy conservation, wirelesssensor networks, Telephone-TV can improve the standard of living in rural areas significantly.VLSI technology directly or indirectly is playing a vital role in this direction.
This paper reviews various developments taking place in the technology, researchwork being done in this area, new devices and systems being developed and theirapplications. The application of the technology and systems developed for rural areas is alsodiscussed. The projects implemented and possible developments to improve quality of life inrural areas is discussed.
With the rapid strides being made in silicon device technology, efficient, low costdevices with high performance are being manufactured. The chip design methods, makinguse of the software tools are producing hardware for various applications like computers,communications, defence, household appliances, commercial toys etc. These developmentsare also making inroads into rural areas and changing the technological applications scenariothere. Hosting of websites / portals with information useful to rural areas is proving to be aboon, for which the VLSI technology is contributing significantly.
double its present value requiring more elaborate heatsinks. Some of the extra power consumption willcome from gate-to-substrate and source-to-draincurrent leakage that will grow larger as channel lengthsscale down to a few tens of nanometers. Approximately9 billion transistors on a chip may sound like a dream,but it is already being made a reality. The packingdensity of cells in human brain is 107 cells / cm3.
As the channel length (the distance between theSource and Drain) decreases, the transistor dimensionsalso continue to shrink. A short channel means fastertransistor switching, because the charge carriers havea shorter distance to travel. The voltage on the drainbegins to lower the energy barrier in the channelreducing the threshold voltage and freeing the carriersto flow even when there is no voltage on the gate. Thisis what in essence called “Short Channel effect” [1].
1. TECHNOLOGY DEVELOPMENT
THE International Technology Road Map for semi-conductors, which is published periodically by the
semi-conductor Industry Association (SIA, San JoseCaliff) gave projections for 2003 Technology node to90 nm and to 6 nm by 2019. Technology node refersto the set of processes needed to print the smallestfeature. According to this road map, high performanceICs will contain more than 8.8 billion transistors in anarea of 280 mm2 by 2016. This is more than 25 timesthe packing density of chips built with 130 nm featuresize. Typical feature size, which is also referred to asline widths, will shrink to 11 nm by 2014. Powerdissipation on high performance micro-processors will
INVITED PAPER
244 IETE TECHNICAL REVIEW, Vol 24, No 4, July-August 2007
To avoid short channel effect, transistorperformance is to be sacrificed to some extent, andtolerate some increase in power consumption. Reducingthe thickness of the depletion region under the gate byincreasing the doping in the channel, maintains gatecontrol, but it also reduces carrier mobility. If thethickness of Silicon dioxide gate insulation above thechannel is reduced to give gate, better control over thechannel, the thinner oxide lets more current leakagebetween the gate and substrate, driving up powerconsumption. This is tackled by having complex dopingprofiles but the device engineers are running out ofsteam.
The gate length of a MOSFET, which is an indicatorto gauge, the size of CMOS transistor, was 50 nm in2002, and is projected to be 9 nm by 2015. To improvethe performance, silicon is to be mixed with a semi-conductor like Germanium to produce strainedcrystalline structure to allow electric charge carriers’move faster. To reduce leakage current which pushesup power consumption, gate oxide is to be made ofmaterials with more than eight times the dielectricconstant (k) of SiO2.
Some of the materials are: Nitrided Oxides, Al2O3,CeO, SrTiO3, Ta2O5, ZrO2 MgAl2O4 .
For better control of transistors’s switching states,the gate of the MOSFET can be of metal instead ofPolysilicon. If more than one gate is employed, powerconsumption will be reduced and there will be bettercontrol over ON-OFF action of the transistor.
In a pure silicon crystal, the distance between asilicon atom and its nearest neighbours is the same inall three directions. But in the strained silicon layer, theatomic separations in the wafer plane are differentfrom those in the perpendicular direction. This changein the crystal symmetry changes the energy bandstructure in the conduction and valence bands. Thischange is to reduce electron – hole collisions withphonons (vibrations of atoms in crystal), the so calledscattering that slows the carriers down.
Silicon-on-Insulator (SOI) Wafers are being widelyused in semi-conductor manufacturing for the pastseveral years. SOI Wafers have a layer of Silicondioxide insulator buried under the device layer, toreduce junction capacitance and so speedup transistorswitching. SOI gets rid of lot of junction area toreduce junction capacitance. To reduce leakage andpower consumption, the present gate insulation ofSiO2 is to be replaced with a material having a largerdielectric constant (k), ‘A materials’ dielectric constant“k” value is a measure of the extent to which itconcentrates electric field lines. It is found that when
hafnium dioxide gate insulation is combined with astrained – silicon substrate, the mobility is found to be60% higher. A high dielectric material replacement toSiO2 in the MOSFET structure reduces gate leakagewhile strained silicon increases the performance of atransistor by material innovation. If these twoadvantages could be combined together withoutinferring, it is advantageous.
The use of high – k dielectrics plus metal gatesplus strained silicon plus increasingly complex dopingprofiles will extend life of the planar CMOS transistorfor atleast another decade. The researchers are lookingat double gate MOSFETS. In double-gate devices, thegate is on both sides of the channel giving much tightercontrol of the transistor’s ON and OFF states. FinFET structure is becoming popular and the advantageis, channel is undoped. So the channel length shrinks.Another advantage is Fin can be made extremely thin.Power consumption is lower, because there is noleakage path for charge carriers to flow along, betweenSource and Drain, when the device is OFF. Withnarrow line width, and small source and drain junctions,the resistance in series with the transistor’s channelwill increase, increasing power consumption anddegrading the performance. Engineers have to solvethese problems in future. When the dimensions ofCMOS transistor can’t be scaled down further, newdevices like nanotubes, single electron transistors, superconducting transistors and molecular transistors willhave to emerge [2].
2. MODERN FABS
The 32 bit / 64 bit Microprocessors are premiermarkers of technological developments. A postagestamp size chip will be having a billion transistors.Hundreds of such chips are manufactured on a siliconWafer of a dinner plate size. In a single day, state-of-the-art fab can make nearly 100 trillion transistors,roughly 250 times the number of stars in the MilkyWay Galaxy. The device engineering is to beappreciated for this technology marvel of the 20thcentury. The fabs have a material handling systemthat uses software – controlled robots and monorailsto transport Wafers, etching chambers, Wafer polishers,photolithographic steppers etc. Manufacturing softwaretools are used that track Wafers to the right tools, atthe right time and process control systems to managethe chip making recipes the mix of gases, chemicals,metals and semi-conductors that constitute chip. TheAutomated Manufacturing Technology or AMT,monitors, and controls the hundreds of steps, Wafersmust pass through, on their way to become Pentium,Itanium and core 2 Duo processors etc. The Wafer
used for manufacturing chips is a mirror – polisheddisk of 99.9999999 percent pure silicon, 300 nmdiameter and less than 1 mm thick.
The AMT suite of programmes have been improvedtremendously over the last couple of decades. Softwarecalled ‘THE GRID’ developed by Intel’s LogicTechnology Development Unit allows various machinesin the fab and number of applications that make up theAMT suite to communicate with each other to fullyautomate fab operations. The GRID is basically agiant electronic bulletin board, where machines andWafers inside the fab announce their respective statesand locations. AMT programs are written in a varietyof programming languages including C, C++ etc andthe common language is called extensible MarkupLanguage or XML. Each program posts messagesencoded in XML on the grid for other programs to seeand, if necessary act upon.
Software has automated all routine tasks neededto run a fab. Software being used in fabs has freed ourengineers to investigate ways to work with siliconthrough the 22-nm generation of chips. In the nearfuture, Carbon nanotubes function as transistors andlight – emitting semi-conductors for optical outerconnects [3].
The Semi-conductor Industry became a globalindustry in the 1990s. Chip manufacturing units andassembly facilities were established in different partsof the world. So International Technology Road mapfor semi-conductors (ITRS) is created in the late 90s.The Semi-conductor Industry Association (SIA)extended invitation to Europe, Japan, Korea and Taiwanto co-operate on ITRS. This was done at the worldsemi-conductor Council in April 1998. Full revisions ofITRS were produced in 1999, 2001, 2003 and 2005.ITRS updates were produced in even-numbered years,2000, 2002, 2004 and 2006.
The boundary between Silicon based and III - Vsemi-conductors continues to move to higherfrequencies with time. Parameters such as noise figure,output power, power-added efficiency; linearity andultimately cost will become more important. For CMOS,long term prediction of device RF and noiseperformance becomes more uncertain with theintroduction of metal gate electrodes, high permittivity(high - k) gate dielectrics and new device structuressuch as fully depleted or double gated Silicon - on -Insulator (SOI).
For millimeter wave applications, InP- based RFtransistors have demonstrated very high frequenciesand GaN transistors have demonstrated record power
densities at 40 GHzs of 10W / mm with 40 V drainbias.
Future wireless challenges include signal isolationand software defined radio (SDR) SDR presents manyissues such as analog-to-digital (ADC) performance;transmitter solutions and cost. Implementation of high- k (dielectric constant) gate stack materials in lowstandby power applications should be achievable. Butimplementation of these materials in high performance(HP) Logic and Low Operating applications is stillconsidered a difficult challenge. Introduction of 450nm wafers in 2012 is still considered a difficult challengefacing numerous issues [4].
3. SILICON PHOTONICS
With the emerging Nano Technology in chips, thetransit time of electrons between transistors in chipswill get reduced but, the speed between chips in asystem is not that fast. This bottleneck is being tackledby Luxtera Inc. researchers. They have sculpted alaser waveguide and modulator into a tightly coupledsilicon package that can be hooked up easily. Theyclaim that their chips handle 10 gigabits per secondand even higher speeds are in the offing. Thenbroadband can become cheap and a feature film canbe downloaded in minutes [5].
4. PHOTONS INSIDE THE COMPUTER
The movement of data in a computer is in thecongested core of the microprocessor, the bits ‘fly’ ata very high speed. But the copper that links oneprocessor to another and one circuit board to the nextslows down the movement. In a Pentium 4 processoroperating at 2-4 GHz, the data travels on a bus operatingonly at 400 MHzs. Many researchers say that soon,many of the copper connections in computers willyield to high-speed optical inter connects, in whichphotons rather than electrons will pass signals fromboard to board or chip to chip or even from one part ofa chip to another. An electrical signal from the processorwould modulate a miniature laser beam which wouldshine through the air or a wave guide to a photoconductor, which would in turn pass the signal on tothe electronics. Though at the moment it is expensiveto communicate with light than with electric current, inthe near future only optical technologies will be able tokeep up with the elements of even more powerfulmicroprocessors. Compact optical I/O devices will beused within the computer. At high frequencies, thewire, series inductance becomes more important thanits resistance as an impeding factor, which also puts alimit on the rate at which the trace can transmit pulses.
K LAL KISHORE : TRENDS IN VLSI TECHNOLOGY 245
246 IETE TECHNICAL REVIEW, Vol 24, No 4, July-August 2007
These parasitic factors depend heavily on the geometryof the wire, its length and cross sectional area (c.s.a).So a wires’ ultimate bit rate turns out to be proportionalto its cross section, but falls with the square of itslength. So a thinner and longer wire means - a lowerbit rate. Transition time limitations can be fought bydriving the line harder, but it is not a good solution. Itadds noise, increases power requirements andaggravates already serious thermal managementproblems. If the wires are made thicker, they occupymore space. Photons don’t suffer from these limitations.The exact point which economics of moving datadictate optical inter connects is debatable. WhenMicroprocessors reach speeds of 10 GHzs, their inabilityto communicate quickly with computer memory orwith other chips in a multiprocessor system will startto stifle their usefulness [6].
5. ORGANIC SEMI-CONDUCTORS –FLEXIBLE DISPLAYS
Organic electronic materials can help in thedevelopment of ICs with plastics. These use semi-conducting and sometimes conducting materials thatare made of molecules containing carbon, mostly incombination with hydrogen and oxygen. Such devicesare slower than silicon devices, but much cheaper.The technology is developed to produce circuits withhundreds of transistors printed on plastics, sensors,memories and displays that can be bent like paper.The present R&D work is aiming at cheap, flexible,flat panel displays. The conventional LCD displaysare made of glass and are heavy. If the organic semi-conductors technology is fully developed, it is capableof creating arbitrarily large displays on light weightflexible plastic substrates, the use of flat panel displayscould be revolutionized. Researchers are aiming atdisplays printed onto rolls of plastic which could beunfurled, processed, and cut up into devices of anysize. Such devices will have more adaptability for ruralapplications and electronics and information technologycan penetrate faster into rural areas. Two types ofdevices are under development:
1) Organic Field effect transistors (OFETs)2) Organic Light Emitting Diodes (OLEDs)
Because polymers can be solution printed like ink,researchers are looking to the printing industry fortechnology. This research work requires a differentset of lab skills from silicon or III - V compounds. Tocarryout the research works expertise in organicchemical synthesis novel manufacturing techniquesand device physics is needed. Bell labs have produceduseful n-type organic semiconductors, complementarycircuits, and plastic backed active-matrix organic display
back planes. Plastic is a better substrate materialbecause it is light, bendable and rugged. Fortunately,many organic semiconductors are like amorphoussilicon.
Micro contact printing, laser and inkjet printingtechniques are being used for organic semi-conductingmaterials. Thermal printing technology of Dupont isalso being adapted to organic electronics manufacture.First a large plastic sheet is coated with an organiccompound sensitive to light from a laser used in theprinting process. Then a layer of conductive polymerthat will form the circuit’s gate electrodes and interconnects is made. The coated plastic sheet is thenprocessed to a second piece of plastic that will act asthe circuit substrate, and the two are run through anapparatus that acts like an industrial laser printer.Wherever the laser strikes, the sensitive compoundevaporates pushing the conductive polymers onto thecircuit substrate, where it strikes. OLE D displayshave light weight, superior image quality and consumelow power. Still quite a lot of fundamental researchremains to be done, including work on organicsemiconductors, having greater charge carrier mobilitiesand operating lifetimes. The mobility of charge carriershelps define a transistor switching speed. But it is farlower in organic semiconductors than in the crystallinesilicon used in ICs. Researchers could overcome theproblems and limitations invocated with amorphoussilicon devices. The same is also expected to be trueof organic transistor [7].
6. RURAL PERSPECTIVE
Fibre optic connectivity to rural areas can bringthe impact of ‘e-revolution’ to villages. Websites canbe created keeping in mind the needs of rural people inthe areas of Agriculture, Health, e-governance, primaryeducation, Rural Energy etc.
The farming community must be kept informedabout the changes and new developments in theagricultural sector. A website with a platform forfarmers, co-operatives, form a machinery vendors,fertilizer and chemical companies’ agronomists andfarm advisors will be useful to the rural people. Thus aknowledge society in agriculture can be created.
Medical facilities in rural areas are very poor.Child mortality rate is high. A website which givesinformation on different stages in the life of a childbeginning with pregnancy to adolescence, nutritionfood to be taken, vaccinations to be given, informationabout public Health Centers, schemes related to ruralhealth and sanitation, will be useful in improving thequality of life of rural people.
A website on e-governance providing link toGovernments’ schemes and services for the peoplecan help villagers with easy access to the government.
A portal on providing information products onchildren going to schools, girl child education, IT literacywill also be very much useful. On Line discussions inregional languages on current topics and educationwill help the rural children in a big way.
Energy conservation is universally important. Theimportance of this is to be explained to the rural peoplein their own language to educate them, to bringawareness, and to make them participate in energyconservation. A portal to motivate villagers to take upclean energy production through bio-gas, usage ofsolar energy for home and village lighting, pump watertechnologies can help rural people. This can helpfamilies in a remote village find ways to improveaccess and use energy for livelihood improvement intheir place of living [8].
6.1. Wireless Sensor Networks
Wireless networks are large number of smallsensing self-powered nodes which gather informationor detect special events and communicate in a wirelessfashion. The processed data is handed over to a basestation. Sensing of data, processing of data andcommunicating the data or information, the combinationof all is done in a timing device. This gives scope formany applications. Recent Advances in LOW POWERVLSI, embedded systems, computing, communicationhardware and in general the convergence of computingand communications are making this technology areality.
Applications
Sensor networks can be applied to:
1. Agriculture2. Environmental Monitoring3. Micro-Surgery, Medicine4. Child education5. Surveillance6. Warfare.
VLSI Chips play an important role in the hardwareto be provided for the networks. The nodes send thedata to a base station. If habitat monitoring is to bedone in a forest area, as they are sensitive to humanpresence, using sensor network provides a non-invasiveapproach. Similarly data pertaining to air, temperature,
light, wind, relative humidity, and rainfall can be collectedby a network of weather sensors, embedded incommunication units for Environmental Monitoring. InPrinceton’s’ Zebra net Project, a dynamic (B9) sensornetwork has been created by attaching special collarsequipped with a low power GPS system to the necksof Zebras to monitor their moves and their behaviour.More or less on similar lines, cattle health, and veterinarymedical operations can be carried out. Usage of waterfor agricultural purposes, humidity level in the soil,usage of pesticides, information about weatherconditions, agricultural product – all such applicationsfor rural areas can be implemented through suchnetworks, in which VLSI chips and embedded systemsplay vital role. Wireless – Networked, sensor –enhanced toys and other class room objects supervisethe learning process of children and allow un-obstructivemonitoring by the teacher [9].
In rural areas where medical facilities are notavailable, sensors can be used to capture vital signsfrom patients in real-time and relay data to hand heldcomputers carried by medical personnel and wearablesensor nodes can store patients’ data. Such aninfrastructure designed to support wireless medicalsensors, PDAs, PCs and other devices that may beused to monitor and treat patients in various medicalsituations (B 13). Smart houses can also be establishedwherein wireless sensor and activator networksintegrated within buildings could allow distributedmonitoring and control, improving living conditions andreducing the energy consumption, by controllingtemperature, air flow etc. Fire accidents and loss dueto such mishaps can be minimized, where facilities areminimum in rural areas.
Earth Sensing satellites are used to predict weather,cyclones and hurricanes. Loss of lives, property andother calamities can be minimized. The degree andprecision of weather prediction increases with VLSIchip, of efficient and power computing capabilities.
6.2. Broad Band Over Power Lines
The idea is simple and the consumer gets accessto a new broadband vendor and has the house wiredfor data with no additional effort. For rural applications,this technology is particularly suitable and economical.The cost of infrastructure required will be very muchreduced and high technology can be taken to ruralareas quickly. Police departments, amateur radiooperators are opposing this idea saying that this willbroadcast into their own bands. Google, Intel, Ciscoare some giants working in this area.
K LAL KISHORE : TRENDS IN VLSI TECHNOLOGY 247
248 IETE TECHNICAL REVIEW, Vol 24, No 4, July-August 2007
6.3. Telephone TV
Watching TV over cellphone is useful technologyfor watching news, sports, information, and also lightentertainment to suit the requirements of villagepopulation. Using new third generation (3 G) mobilebroad band networks, many cellphone operators arestreaming mobile TV services [10].
6.4. Wiring Villages – Chinese Model
The fibre optic connectivity for Internet is changingthe way the citizens of a coal-choked central China’sHenam province live. Almost 40% of the population ofmiddle class standard go on-line. Even outlying mud-wall villages have 8 megabit-per-second connection.Liu Zhaingno a peasant launched website for hisPigform and was selling a third of his production atpremium prices via the Net to buyers in neighbouringprovinces. Not only Liu, farmers in a neighbouringvillage, the poorest in the region consult a newlyinstalled internet run by the agricultural ministry todecide, what to plant and where to sell.
Since mid-2004, all interrogations in the stateinspection Bureau which investigates corrupt officialsare now carried out and recorded in a state-of-the-artfacility with six hidden video cameras manipulatedfrom a control room. A social science researcher ofChina says he is convinced that the internet is helpingto make China a more open society. Tens of thousandsof Internet Cafes are used in which people who can’tafford a computer and Internet subscription payaffordable price per hour to go on-line. CorruptGovernment servants take illiterate villagers for a ridein the implementation of welfare schemes of theGovernment. With the Internet and mobile technologysuch corrupt employees are scared about beingexposed.
Thus the development in VLSI technology to makecheaper, high performance, miniature devices andprocessors is helping in taking new technology andsystems to rural areas to provide better quality of ruralliving and ‘Knowledge Society’ in villages [10].
CONCLUSIONS
Rapid strides in VLSI technology have helped inthe development of low cost, high performance devicesand systems. This is resulting in applications to newareas and realizing the concept of ‘Global Village’.Internet Connectivity and Computer Communicationsare bringing significant changes in the standard of life.The same technology can also be taken and mouldedfor rural applications. Wiring villages, wireless sensornetworks, websites on-e-governance, literacy, energyconservation, medical facilities, and agriculture canhelp the rural population and will result in improvementin the quality of life, in rural areas also.
REFERENCES
1. IEEE /Spectrum, 2002.
2. IEEE Spectrum, October, 2002.
3. IEEE Spectrum, March, 2007
4. ITRS Updates, 2006.
5. IEEE Spectrum, January, 2006
6. IEEE Spectrum, August, 2002
7. IEEE Spectrum, 2002
8. C-DAC News letter, no 1, April, 2007
9. IEEE Circuits and Systems, vol 5, no 3, p. 19-27,2005.
10. IEEE Spectrum, June, 2005.
Lal Kishore obtained MTech, andPhD, degrees from Indian Institute ofScience Bangalore. He has more than 30years of teaching experience, and hasmore than 60 publications to his credit.He is guiding number of ResearchScholars in the area of VLSI Design,Technology and Micro Electronics. Hehad won the First Bapu SeetharamMemorial Award for Research work fromInstitution of Electronics and Telecommunication Engineers(IETE), New Delhi in the year 1986. He had also received BestTeacher Award from the Government of Andhra Pradesh in theyear 2004. He wrote 2 text books on Electronics Devices &
Author
Circuits and Electronic Circuit Analysis. Two more text bookson I C Applications and Electronic Measurements are in print.He is a Fellow of IETE, Member IEEE, ISTE and ISHM. He hasconducted refresher course on VLSI at the UGC Academic StaffCollege, Hyderabad 8 times. He has implemented number ofResearch Laboratory Development Projects of DST, MHRDand AICTE. He is closely associated with various activities ofIETE, Hyderabad Centre. He held number of administrativeposts in Jawaharlal Nehru Technological University, Hyderabad,including Principal of University Engineering College, andpresently Registrar of the University.
* * *
249
Paper No 124-D; Copyright © 2007 by the IETE.
IETE Technical ReviewVol 24, No 4, July-August 2007, pp 249-256
Temporally Adaptive, Partially UnsupervisedClassifiers for Remote Sensing Images
SHILPA INAMDAR AND SUBHASIS CHAUDHURI
Department of Electrical Engineering, Indian Institute ofTechnology Bombay, Powai, Mumbai 400 076, India.
email: {shilpa,sc}@ee.iitb.ac.in
Remote sensing is being increasingly used over the last few decades as a powerful toolfor monitoring, study and analysis of the surface of the earth as well as the atmosphere. Inthis paper we shall consider temporally adaptive pattern recognition techniques for land-cover classification in multitemporal and multispectral remote sensing images. The techniquecomprises of pre-processing using global and classwise probability density function (PDF)matching for temporally adapting the statistics before classification. We focus on the utilityof these techniques in generating improved partially unsupervised land-cover classifiers andtheir comparative study.
histogram or probability density function (PDF)matching. Section 4 presents some experimental results.Section 5 discusses the conclusions derived from thiswork.
2. REVIEW OF PARTIALLY UNSUPER-VISED CLASSIFICATION
There are two main approaches to any classificationproblem; the supervised approach which requires theavailability of ground-truth to design a suitable trainingset, and the unsupervised approach which does notrequire any such information. The ground truth is inthe form of labeled pixels and the training set isderived from this. However, collecting this data isvery expensive in terms of time and money. Also, theprocess needs the services of a domain expert for theregion under consideration who can classify the pixelsfrom the captured image. Therefore, it may not bepossible to have the ground truth for images acquiredat every instant of time. Hence, supervised classificationcannot always be used for images at different timeinstants due to logistic problems. On the other hand,the limitation of unsupervised techniques is the lowaccuracy of classification and nonavailability of labels.The accuracy of classification may be a critical factorsince incorrect identification of classes or confusionamong them may lead to wrong interpretations andpossibly severely affecting in applications like naturaldisaster management or environmental studies, etc.The above mentioned reasons have led to thedevelopment of partially unsupervised classificationmethods, which emerge as a golden mean between
1. INTRODUCTION
SATELLITE remote sensing technologies provide large amount of data which is acquired from
various sensors at a periodical or regular basis. Imagesthat are acquired on the same geographical area atdifferent instants of time are termed as multi-temporalimages. Multiple sensors (fitted on the satellite) whichoperate on different spectral bands are employed tocapture images. This results in multi-spectral images.These images are a primary source of informationabout the temporal behavior of land-cover in the areaof interest. Land-cover classification is associatedwith change detection process too which helps instudying the changes or trends in land-cover over aperiod of time, say due to urban expansion, deforestation,floods, disasters, etc. This kind of study is particularlyuseful to environmentalists, civil engineers, urban andtransportation planners, etc to define policies and alsoto reduce risks of natural disasters [1]. Since the datais generated by the satellites periodically, there is aneed to develop methods which are temporally adaptive.The work presented is an attempt towards the designof classifiers with improved accuracies formultitemporal remote sensing images.
The paper is organized into five sections. Section2 describes an overview of the partially unsupervisedclassification schemes with respect to temporallyadaptive analysis of remote sensing images. Section 3highlights the need and then explains the concept of
INVITED PAPER
250 IETE TECHNICAL REVIEW, Vol 24, No 4, July-August 2007
the supervised and unsupervised approaches [1].
With reference to multi-temporal analysis, partiallyunsupervised classification schemes carry a lot ofimportance. The term “partially unsupervised” is usedto indicate that although no ground truth is availablefor the specific image to be classified, some trainingdata that exists for another image of the samegeographical area (but captured at some differentinstant of time) and this is utilized for generating theclassifier. In this case, classifiers are first trained onthe existing training set, whose parameters are thenupdated using an assumed distribution of the secondimage [1]. The popular technique used is updating theparameters of the previously trained classifier usingthe distribution of the test image by Expectation-Maximization (EM) algorithm [2]. It shows promisingimprovement in classification accuracies after retrainingbut faces the limitation that it suits mostly to imagedata following Gaussian distributions. Another methodto improve classification accuracies in partiallyunsupervised classifiers is the use of Markov RandomField based approach which also considers thecontextual information [3]. In general, these methodsaim at adapting the parameters of an existing classifierto the statistics of the image to be classified. Theconcept of matching of the statistics is elaborated inthe subsequent section.
3. MATCHING OF STATISTICS
The main issue in case of multi-temporal images isthat the images (even of same geographical area)acquired at different times are characterized bydifferences in statistics owing to the change inatmospheric or ground conditions or differences insensor calibration at the acquisition time [1]. Theseissues become even more prominent in case of imagescaptured during different seasons. For this reason, theclassifiers developed for the image of the samegeographical area tend to exhibit unacceptableclassification accuracies if applied directly to the imageof interest. Hence is the need for matching of statisticsamong the training and test images as an additionalpre-processing step.
A. Histogram matching technique
One way to adapt the statistics is the use of imageprocessing techniques for matching of statisticalproperties of the multi-temporal images at a pre-processing stage. The simplest technique that can beemployed to match the probability density function ineach spectral band of the two images is explainedhere. This method uses histogram matching (or
histogram specification) which performs a matchingof shapes of the histograms by means of the use oftheir cumulative histograms [4]. This method is appliedto multispectral images band-by-band.
Let X1 and X2 denote two multispectral imageswith N channels and captured at time instants and t1and t2 respectively. One of these images is consideredas the source and the other as the target in terms oftheir histograms. Each image can be represented as acollection of pixels each being represented by a vectorwith N components corresponding to the intensitylevels in N spectral bands. Hence, for each image, wecan get N marginal distributions p1 (Xb) and p2 (Xb),one for every spectral band (b = 1, 2, ... N). For asingle dimension or band, the problem can berepresented as finding a monotone mapping functionT(Xb) [4,5] such that:
T(Xb) = C2–1 [C1 (Xb)] (1)
where C1 and C2 are the cumulative PDFs of thesource and target images, respectively. This is thestandard band-by-band histogram matching (or PDFmatching) problem which can be solved using discretelookup tables. Note that the terms PDF matching,histogram matching, PDF transfer are usedinterchangeably in this paper. The above procedurecan be applied N times independently for N bands.This results in bringing the individual distributions ofthe bands as closer as possible to each other.
B. Classwise PDF matching
It is worth noting that till this point we are discussingabout the histograms in one band of the entire image.But the entire image comprises of some “M” differentland-cover classes. Depending on soil and vegetationcondition, these classes exhibit different spectralproperties, i.e., they respond with different reflectancefor different part of the spectrum. It is precisely thisproperty that is exploited in distinguishing one classfrom the other and hence in classification. Thus, theproblem of classification demands an analysis of boththe spectral and the statistical properties of variousclasses. This issue can be handled more effectively ifwe consider the histogram in each band as comprisingof “M” individual histograms, each corresponding to aclass, i.e., modeling the distribution in each band as amixture density. In practice, it is assumed in manyapplications that every class follows a Gaussiandistribution. This assumption of model has beenobserved to suit well to satellite image data. Movingbeyond this assumption, in the presented approach ofpartially unsupervised classifier, there is no need of
any assumption on the nature of the distributions at thePDF matching stage, though assumed so in the laterstages of Maximum-Likelihood classification. Thehistogram matching method in single dimension willmatch the shape of any source histogram to any othershape of the target. In multi-temporal images, thedifference in the shapes of the source and the targethistograms totally depends on the temporal changesthat occur in the spatial distribution, vegetation,atmospheric conditions, air and soil moisture content.One point that should be again noted here is that everyclass may react differently to the temporal changes.Hence, it may be more advantageous if we can derivethe PDF matching transfer function in eqn (1) differentlyfor each class rather than a global or single transferfunction for the entire image in a particular band.
In the framework of the presented classificationproblem, the aforementioned discussion can be neatlyrepresented as two experiments, viz. the globalbandwise histogram matching (GB) and the classwisebandwise PDF matching (CB) as preprocessingtechniques. The subsequent section will provide anelaborate discussion on the related issues andimplementation of these two methods.
4. EXPERIMENTATION
This section describes the data set used, the variousexperiments carried out, the measures used for assessingthe performance of the method presented and theresults obtained.
A. Description of the data set
Experiments were carried out on a datasetcomprising of three sets of multi-spectral images.These images have been acquired by the Wide FieldSensor (WiFS) mounted on Indian Remote Sensing(IRS-1C) satellite. The images (550´900 pixels) coverthe geographical area that includes the town of Varanasiin the state of Uttar Pradesh, India and the agriculturalarea around it. The images have been captured inNovember 1999 (T1), January 2000 (T2) and March2000 (T3). These three time instants partly fall indifferent periods of the year and hence somewhatdifferent seasons. The images are perfectly co-registered and hence the same co-ordinates in thethree sets of images correspond to the same area onearth’s surface. Each data set comprises of imagescaptured by sensors in two spectral bands, one visible(red) (620-680 nm) and the other near-infrared (770-860 nm). The spatial resolution of the sensor is 188 m
188 m. Band 2 of the images at timeT1, T2 and T3 areshown in Fig 1.
The ground truth has been made available to usfor all the three images. But for a given experiment ofpartially unsupervised classification, we assume thatthe training data are available only for one image, to beused as training image. The test data set correspondingto the other two dates is just used for validation ofclassification results.
The accompanying ground truth information wasused to derive training and the test sets. The areaunder consideration is characterized by five land-coverclasses viz wheat field, urban area, water body, ricefield and forest. Please note that the dark backgroundin Fig 1 is not a part of the image to be considered forclassification purposes. The corpus of training and testdata is as shown in Table 1.
B. Design of experiments
The experiments in classification were carried outby training the classifier using the training setcorresponding to the time T1 and then tested on theimages acquired at time T2 and T3. The ability of theclassifier to handle bi-directional data was confirmedby training the classifier using the training setcorresponding to the time T3 and then tested on theimages acquired at time T2 and T1. The next subsectionpresents the experimental details of the PDF matchingphase, following which the design of the classifier,without and with three variations of the pre-processingtechnique, is presented in order to study the comparativeperformances of classifiers. It must be noted here thatthough there is no assumption on the distribution ofclasses at the preprocessing or histogram matchingstage, the Gaussian distribution for classes is assumed
TABLE 1: Training and test sets corresponding toimages acquired at T1, T2 and T3
Land-cover No. of samplesClass
Training Test SetSet
1. Wheat Crop 979 1664
2. Urban area 159 281
3. Water body 40 72
4. Rice crop 221 652
5. Forest area 422 437
Total 1821 3106
INAMDAR & CHAUDHURI : REMOTE SENSING IMAGES 251
252 IETE TECHNICAL REVIEW, Vol 24, No 4, July-August 2007
at the classification stage. This assumption has beenfound to be reasonable. The final classification is doneusing maximum likelihood (ML) rule in which everyclass is modeled by Gaussian parameters.
C. Histogram matching
In the first set of experiments, the image at timeT1 was considered as the source (and the trainingimage) and the test image, either T2 or T3, wasconsidered as the target. Similarly, in the next set ofexperiments the image at time T3 was chosen assource and the test image, either T2 or T1, wasconsidered as the target. The aim was matching thestatistics of the source image to that of the target.Initially bandwise histogram matching was performedglobally (GB method) using the histogram of the entireimage in a particular spectral band. Probability densityfunctions or the histograms were constructed fromband 1 and 2 of the source and targets and thecumulative distribution functions were found out. Then,for every pair of source and target image, two histogrammatching problems were solved corresponding to eachspectral band according to eqn (1). Let the modifiedsource image be represented by X1
GB.
As discussed in the previous section, the bandwisehistogram matching was also performed locally or inother words on each class separately, i.e. classwisebandwise matching (CB method). The critical issuehere was defining source and target clusters or classes.In case of the source image, which is also the trainingimage, forming clusters is trivial. The pixels labeled asbelonging to the same class were grouped together toform a cluster. But the target clusters were needed tobe formed from the test images which have noinformation available for them. This problem was solvedas follows:
1) Choose source (training) and target (test)images.
2) Form the source clusters by grouping togetherthe pixels labeled as belonging to the sameclass in the training set.
3) Train the ML classifier using training datafrom X1 .
4) Perform classification on the test set fromtarget image.
5) Group all the pixels from the test set classifiedinto same class and form “M” target clusters.
Now, we have “M” source and “M” target classeswith the correspondence known between them. Theproblem of bandwise histogram matching now becomesthat of “M” independent problems. Bandwise histogram
matching is performed individually on each pair ofsource and target classes. Let the modified sourceimage in this case be represented as X1
CB-ML. It isexpected that the CB method should bring thedistribution of each class closer to each other than theGB method. However, the performance of MLclassifier is expected to be poor without retraining andthe method is not expected to yield accurate results. Inthe next variation for CB method, instead of formingthe target classes using the direct ML classificationresult, they were formed using the results of MLclassification after GB method of pre-processing. Thesteps are as follows:
1) Choose source (training) and target (test)images.
2) Form the source clusters by grouping togetherthe pixels labeled as belonging to the sameclass in the training set.
3) Perform global bandwise histogram matchingand get modified source X1
GB .4) Train the ML classifier using training data on
X1GB.
5) Perform classification on the test set fromtarget image.
6) Group all the pixels from the test set classifiedinto same class and form “M” target clusters.
As before, we have “M” source and “M” targetclasses with the correspondence known between them.Bandwise histogram matching is performed individuallyon each pair of source and target classes similar to theprevious case. Let the modified source image in thiscase be represented as X1
CB-GB.
In order to evaluate the effectiveness of thisbandwise matching technique in bringing close thedistributions of source and target clusters, we calculatedthe Bhattacharya distances between the source andthe target clusters before and after the modificationusing the presented technique. The Bhattacharyadistance between the distributions of any class w i fromthe source and the target (say, p1 (X | w i) and p2( X | w i)) is calculated as follows:
Bi = – ln ò p1 (X | w i) p2 (X | w i) dX (2)x
As already mentioned, it is reasonable to assumea Gaussian distribution for the classes at theclassification stage. Hence, the distance calculationcan be simplified as
1 æSi,1 + Si,2 ö–1
Bi = ¾ (µi,1 – µi,2)t ç¾ ¾ ¾ ¾ ÷ (µi,1 – µi,2) +8 è 2 ø
1 éê Si,1 + Si,2 ê ù¾ log êê¾ ¾ ¾ ¾ ¾ ê êSi,1 êêSi,2 êú (3)2 ëê 2 ê û
where µi,1 , µi,2 and Si,1, Si,2 are the mean vectorsand the covariance matrices for the distributions of w iat t1 and t2 respectively. The corresponding resultsobtained are shown in Table 2 and Table 3 respectively.From both the tables, we can observe that the estimatedclasses at other time instants have fairly largeBhattacharya distances with the correspondingsupervisory data over which the classes were trained.This is due to the temporal change in the statistics ofindividual classes. If one performs classwise histogrammatching, the corresponding Bhattacharya distancesreduce drastically, making the statistics of variousland-cover classes invariant to temporal changes. Whenone performs a single global histogram matching, thereduction in the distance measure is not that significant.This indicates that each land-cover class undergoes adifferent type of change in statistics and this cannot becaptured by defining a single PDF transfer for all theclasses.
D. Classification results
For every combination of training and test set, inall four types of classifiers can be trained. They differin the image used for training the classifier. Thoughthere is no assumption of any distribution model in thepre-processing stage, for classification we assume aparametric (Gaussian) model for the distribution ofland-cover classes. The most basic type of classifier isthe direct maximum-likelihood (ML) classifier withoutany kind of pre-processing. It is designed using thetraining set from X1 and applied to the test images.The second type of classifier was trained onX1
CB-ML. The third type of classifier was trained onX1
GB and the fourth one was trained on X1CB-GB. It is
observed that the performance of the second and thefourth classifier improves over the first and thirdclassifier, respectively, in all cases. Also, in generalthe CB-GB classifier performs better than the CB-ML classifier. This can be attributed to the fact thatthe target classes used in CB-GB method are moreaccurate than those used in CB-ML method, as theyare derived from the result of GB classifier which is
Fig 1 Band 2 of the multitemporal image data set used for experiments
(a) November 1999 (T1) (c) March 2000 (T3)(b) January 2000 (T2)
TABLE 2: Bhattacharya distances for various classifiers trained on November 1999 dataset (T1)
Test Data Classifier Land-cover class
Wheat crop Urban area Water Body Rice crop Forest
T2 Direct ML 0.1392 0.2235 1.2538 1.3226 0.2433CB-ML 0.0325 0.1010 0.1552 0.3211 0.0647GB 0.1982 0.1435 0.4973 0.4009 0.2250CB-GB 0.0257 0.1181 0.2804 0.0595 0.0605
T3 Direct ML 0.2808 0.2735 1.1237 1.5053 0.3136CB-ML 0.0422 0.0691 0.4997 0.9906 0.0256GB 0.1536 0.2056 0.5463 0.2206 0.2004CB-GB 0.0138 0.0897 0.1753 0.0751 0.0332
INAMDAR & CHAUDHURI : REMOTE SENSING IMAGES 253
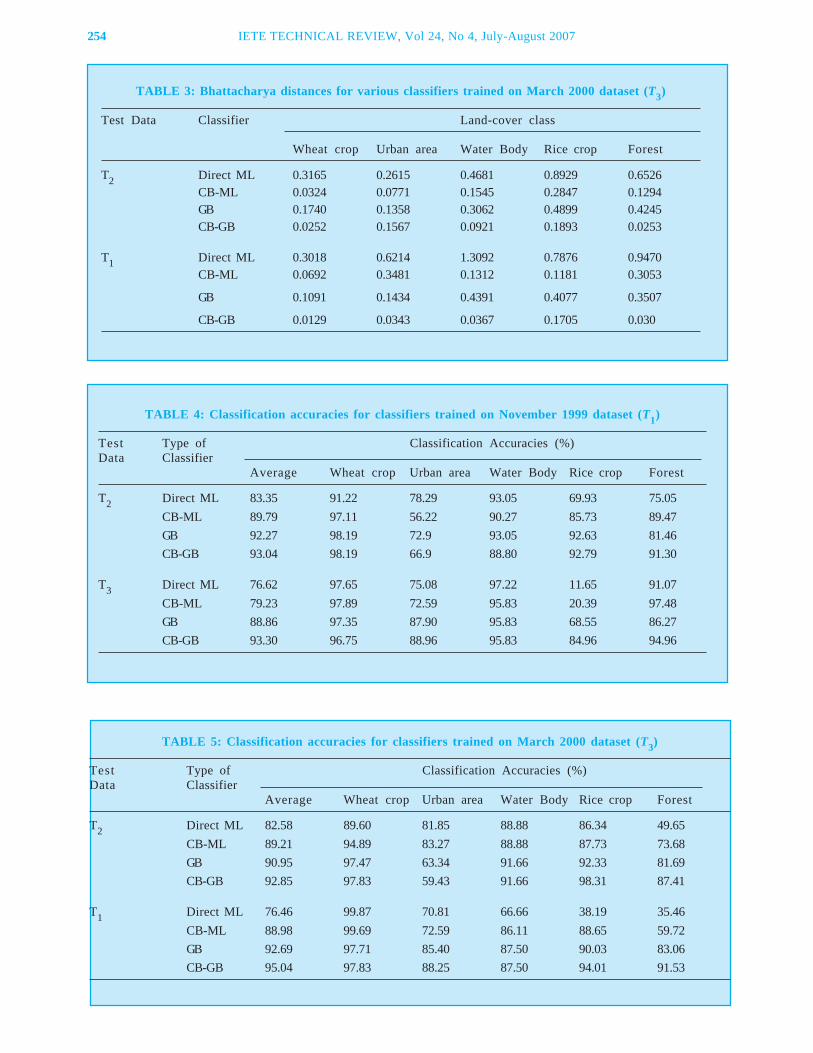
254 IETE TECHNICAL REVIEW, Vol 24, No 4, July-August 2007
TABLE 3: Bhattacharya distances for various classifiers trained on March 2000 dataset (T3)
Test Data Classifier Land-cover class
Wheat crop Urban area Water Body Rice crop Forest
T2 Direct ML 0.3165 0.2615 0.4681 0.8929 0.6526CB-ML 0.0324 0.0771 0.1545 0.2847 0.1294GB 0.1740 0.1358 0.3062 0.4899 0.4245CB-GB 0.0252 0.1567 0.0921 0.1893 0.0253
T1 Direct ML 0.3018 0.6214 1.3092 0.7876 0.9470CB-ML 0.0692 0.3481 0.1312 0.1181 0.3053
GB 0.1091 0.1434 0.4391 0.4077 0.3507
CB-GB 0.0129 0.0343 0.0367 0.1705 0.030
TABLE 4: Classification accuracies for classifiers trained on November 1999 dataset (T1)
Test Type of Classification Accuracies (%)Data Classifier
Average Wheat crop Urban area Water Body Rice crop Forest
T2 Direct ML 83.35 91.22 78.29 93.05 69.93 75.05CB-ML 89.79 97.11 56.22 90.27 85.73 89.47GB 92.27 98.19 72.9 93.05 92.63 81.46CB-GB 93.04 98.19 66.9 88.80 92.79 91.30
T3 Direct ML 76.62 97.65 75.08 97.22 11.65 91.07CB-ML 79.23 97.89 72.59 95.83 20.39 97.48GB 88.86 97.35 87.90 95.83 68.55 86.27CB-GB 93.30 96.75 88.96 95.83 84.96 94.96
TABLE 5: Classification accuracies for classifiers trained on March 2000 dataset (T3)
Test Type of Classification Accuracies (%)Data Classifier
Average Wheat crop Urban area Water Body Rice crop Forest
T2 Direct ML 82.58 89.60 81.85 88.88 86.34 49.65CB-ML 89.21 94.89 83.27 88.88 87.73 73.68GB 90.95 97.47 63.34 91.66 92.33 81.69CB-GB 92.85 97.83 59.43 91.66 98.31 87.41
T1 Direct ML 76.46 99.87 70.81 66.66 38.19 35.46CB-ML 88.98 99.69 72.59 86.11 88.65 59.72GB 92.69 97.71 85.40 87.50 90.03 83.06CB-GB 95.04 97.83 88.25 87.50 94.01 91.53
more accurate than the ML classifier used in CB-MLmethod. Overall results indicate that the modified trainingimages which are closer in statistics to the targetimages to be classified result in improved classifierswhich are “adapted” to the test images from thetemporal series. In other words, the methods used are“temporally adaptive”.
The results of classification are shown in Table 4and Table 5. The average accuracy of classificationand the classwise accuracies are presented. It isworth noting that the classwise transfers improve theclassification accuracy of each class significantly andhence also the average accuracy of classification.Further, the use of this procedure on multitemporalimages yields results of classification which are at anacceptable level of accuracy and hence can eliminatethe need for retraining using a procedure like the EMalgorithm which can be computationally exhaustive.For sake of verification, the January 2000 dataset wasalso used as training set and the above mentioned fourclassifiers were tested on November 1999 and March2000 datasets. Results obtained were similar withclassifiers designed with classwise transfersoutperforming those designed with global transfer.
5. CONCLUSIONS
In this work, the suitability of global and classwisePDF matching techniques has been described withtheir application to partially unsupervised classification.In multitemporal framework, these techniques havebeen used to generate modified training images whichare closer in statistics to the images to be classified. Ingeneral, for every test image to be classified, a modifiedtraining image can be generated which matches thestatistics of the test image. Thus, the training of theclassifier is adaptive to the test image. Experimentalresults confirm the effectiveness of the methods. The
classwise PDF matching more closely matches thestatistics of the classes in the source and target imagesthan the global PDF matching. Hence it also turns outto be more effective for generating modified trainingimages which help generate more accurate classifiers.The advantages of this method include elimination ofthe need of retraining, and the low computationalcomplexity. The main drawback of this method is thatit considers each spectral band separately, neglectingthe correlation among them. Our current work focuseson it.
ACKNOWLEDGEMENTS
The authors are thankful to ISRO, India and Dr B KMohan, IIT Bombay for making available the image dataset with ground truth used for this experiment. Fundingsupport from ISRO Cell is gratefully acknowledged.
REFERENCES
1. L R Bruzzone & D F Prieto, Unsupervised retrainingof a maximum likelihood classifier for the analysis ofmultitemporal remote-sensing images, IEEE Trans.Geosci. Remote Sensing, vol 39, no 2, pp 456-460,Feb 2001.
2. T K Moon, The Expectation-MaximizationAlgorithm, IEEE Signal Processing Magazine, Nov1996.
3. R Cossu, S Chaudhuri & L Bruzzone, A context-sensitive Bayesian technique for the partiallysupervised classification of multitemporal images”,IEEE Geosci. Remote Sensing Letters,vol 2, issue 3,pp 352-356, July 2005
4. R Gonzalez & R Woods, Digital image processing,2nd edition, Prentice Hall, 2002.
5. F Pitie, A Kokaram & R Dahyot, N-Dimensionalprobability density function transfer and itsapplication to color transfer, Proc IEEE ICCV,Beijing 2006.
INAMDAR & CHAUDHURI : REMOTE SENSING IMAGES 255
256 IETE TECHNICAL REVIEW, Vol 24, No 4, July-August 2007
Subhasis Chaudhuri was bornin Bahutali, India. He received his BTechdegree in Electronics and ElectricalCommunication Engineering from theIndian Institute of Technology,Kharagpur in 1985. He received MS andPhD degrees, both in ElectricalEngineering, respectively, from theUniversity of Calgary, Canada and theUniversity of California, San Diego. Hejoined the IIT, Bombay in 1990 as an assistant professor and iscurrently serving as the professor and head of the Dept.
He has also served as a visiting professor at the Universityof Erlangen-Nuremberg, Germany and the University of ParisXI. He is a fellow of the Alexander von Humboldt Foundation,Germany, the Indian National Academy of Engineering, and theIndian Academy of Sciences. He is the recipient of Dr VikramSarabhai Research Award for the year 2001 , and the Prof SVCAiya Memorial Award and the Swarnajayanti Fellowship bothin 2003. He received the S S Bhatnagar Prize in engineeringsciences for the year 2004.
He is the co-author of the books ‘Depth from defocus: areal aperture imaging approach’, and ‘motion-free super-
Authors
resolution’ both published by Springer, NY. He has also editeda book on ‘Super-resolution imaging’ published by KluwerAcademic in 2001. His research interests include image processing,computer vision and multimedia.
* * *
Shilpa Inamdar received herBachelor of Engineering degree inElectronics and Telecommunicationsfrom University of Pune in 2003 andthe Master of Technology degree inElectrical Engineering from I IT Bombayin 2007. She has served as a ResearchAssistant for the Indo-Italian project on“Advanced Techniques for RemoteSensing Image Processing” from July2004 - June 2007. Her areas of interest include pattern recognitionand remote sensing image processing.
* * *
257Paper No 124-B; Copyright © 2007 by the IETE.
IETE Technical ReviewVol 24, No 4, July-August 2007, pp 257-269
Texture Feature Matching Methods forContent based Image Retrieval
IVY MAJUMDAR, B N CHATTERJI
B P Poddar Institute of Management and Technology, 137 VIP Road, Kolkata 700 052, India.
AND
AVIJIT KAR
Jadavpur University, Kolkata 700 032, India.email: [email protected]; [email protected]; [email protected]
Texture features are widely used for matching in content based image retrieval. Sincemid nineteen nineties we find a lot of R & D activities in this area. In this paper an attempt hasbeen made to review these works. Seventy one papers were reviewed and these wereclassified into spatial domain, wavelet based and miscellaneous methods. These methodswere further sub-classified on the basis of mathematical techniques used or the algorithmapplied. A very brief description of these methods is given. Finally the paper discussesabout the need for comparison of the methods and on the future directions in this area.
Texture is one of the important features formatching in CBIR. Texture features can be the onlyfeature or it can be used along with the other featuresfor matching. According to Sklansky [2] “A region inan image has a constant texture if a set of localstatistics or other local properties of the picture areconstant, slowly varying or approximately periodic”.For the last 15 years we find that there was a tremendousinterest in the use of texture features for matching inCBIR. In this paper we have tried to provide a surveyreview of some of these methods. We can classifythese methods broadly into three categories.
(1) Spatial Domain based Methods in which theprocessing is done in the spatial domain
(2) Wavelet based Methods in which the image istransformed into the wavelet domain first andthen the processing is done.
(3) Miscellaneous Methods where we use somespecial techniques in which processing can bein spatial or wavelet domain or in both.
The various methods are given in the classificationtree given in Fig 2. A brief description of these methodswill be given in the subsequent sections.
2. SPATIAL DOMAIN BASED METHODS
A large number of texture image matching methodsuse the image in spatial domain. These methods canbe further sub classified into the following dependingon the texture modeling and the method of analysis.
1. INTRODUCTION
FOR more than one decade we find a lot of researchefforts for searching image database with
applications in areas like digital libraries, advertisement,entertainment, medical diagnosis, communication andseveral other areas. This is due to the tremendous useof Internet and the development of world wide web(www). Content based image retrieval (CBIR) methodis the most popular method used for searching imagedatabases. Kokare et al [1] have given a detailedliterature survey on CBIR. The block diagram of aCBIR system is given in Fig 1. It has a stage known asDatabase Generation where the known input imagesare digitized and features are extracted from the digitizedimages. In the database we store the features of theimage. The feature can be colour, texture, shape,image semantics or other features in other domains.These features are such that these can describe thecontents of the image. In the retrieval stage the queryimage is digitized and the features are extracted. Thenwe have a matching and indexing step where wedetermine the similarity between the features of thequery image with the features stored in the imagedatabase. The retrieved image is the one havingmaximum similarity with the query image. Retrievalresults are also given by ranking a few images on thebasis of the similarity index.
INVITED PAPER
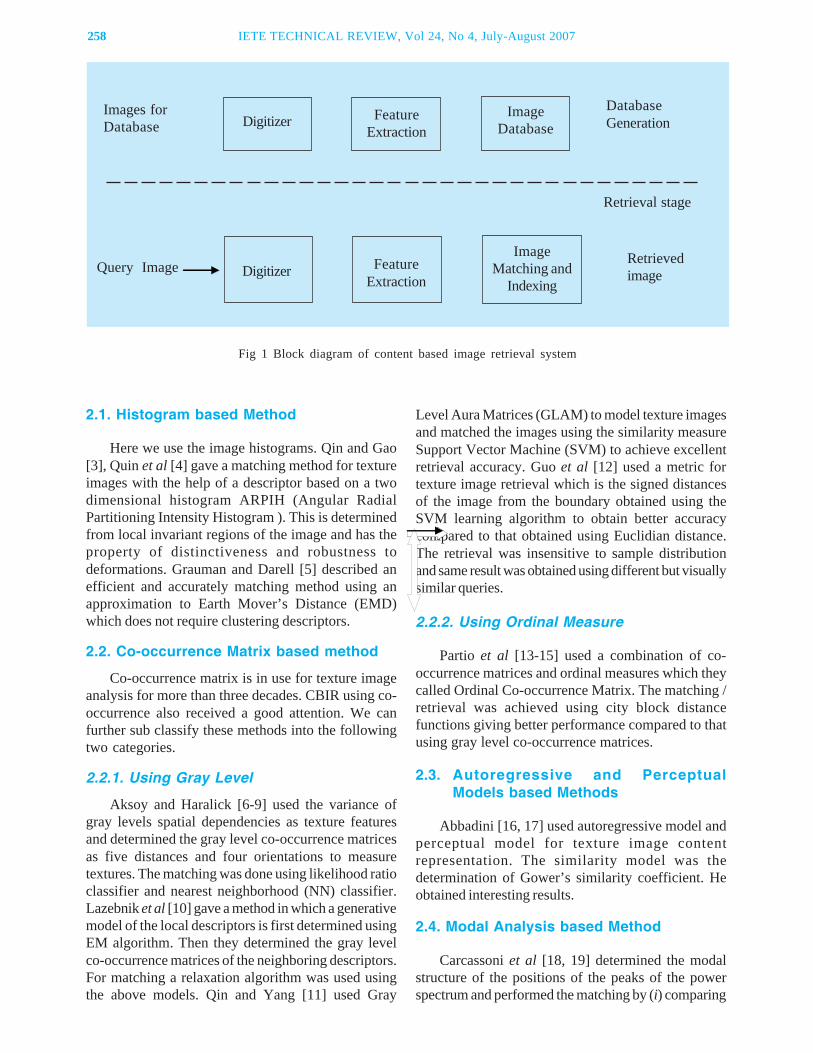
258 IETE TECHNICAL REVIEW, Vol 24, No 4, July-August 2007
2.1. Histogram based Method
Here we use the image histograms. Qin and Gao[3], Quin et al [4] gave a matching method for textureimages with the help of a descriptor based on a twodimensional histogram ARPIH (Angular RadialPartitioning Intensity Histogram ). This is determinedfrom local invariant regions of the image and has theproperty of distinctiveness and robustness todeformations. Grauman and Darell [5] described anefficient and accurately matching method using anapproximation to Earth Mover’s Distance (EMD)which does not require clustering descriptors.
2.2. Co-occurrence Matrix based method
Co-occurrence matrix is in use for texture imageanalysis for more than three decades. CBIR using co-occurrence also received a good attention. We canfurther sub classify these methods into the followingtwo categories.
2.2.1. Using Gray Level
Aksoy and Haralick [6-9] used the variance ofgray levels spatial dependencies as texture featuresand determined the gray level co-occurrence matricesas five distances and four orientations to measuretextures. The matching was done using likelihood ratioclassifier and nearest neighborhood (NN) classifier.Lazebnik et al [10] gave a method in which a generativemodel of the local descriptors is first determined usingEM algorithm. Then they determined the gray levelco-occurrence matrices of the neighboring descriptors.For matching a relaxation algorithm was used usingthe above models. Qin and Yang [11] used Gray
Level Aura Matrices (GLAM) to model texture imagesand matched the images using the similarity measureSupport Vector Machine (SVM) to achieve excellentretrieval accuracy. Guo et al [12] used a metric fortexture image retrieval which is the signed distancesof the image from the boundary obtained using theSVM learning algorithm to obtain better accuracycompared to that obtained using Euclidian distance.The retrieval was insensitive to sample distributionand same result was obtained using different but visuallysimilar queries.
2.2.2. Using Ordinal Measure
Partio et al [13-15] used a combination of co-occurrence matrices and ordinal measures which theycalled Ordinal Co-occurrence Matrix. The matching /retrieval was achieved using city block distancefunctions giving better performance compared to thatusing gray level co-occurrence matrices.
2.3. Autoregressive and PerceptualModels based Methods
Abbadini [16, 17] used autoregressive model andperceptual model for texture image contentrepresentation. The similarity model was thedetermination of Gower’s similarity coefficient. Heobtained interesting results.
2.4. Modal Analysis based Method
Carcassoni et al [18, 19] determined the modalstructure of the positions of the peaks of the powerspectrum and performed the matching by (i) comparing
Images forDatabase
Digitizer FeatureExtraction
ImageDatabase
DatabaseGeneration
Query Image Digitizer FeatureExtraction
ImageMatching and
Indexing
Retrievedimage
Retrieval stage
Fig 1 Block diagram of content based image retrieval system
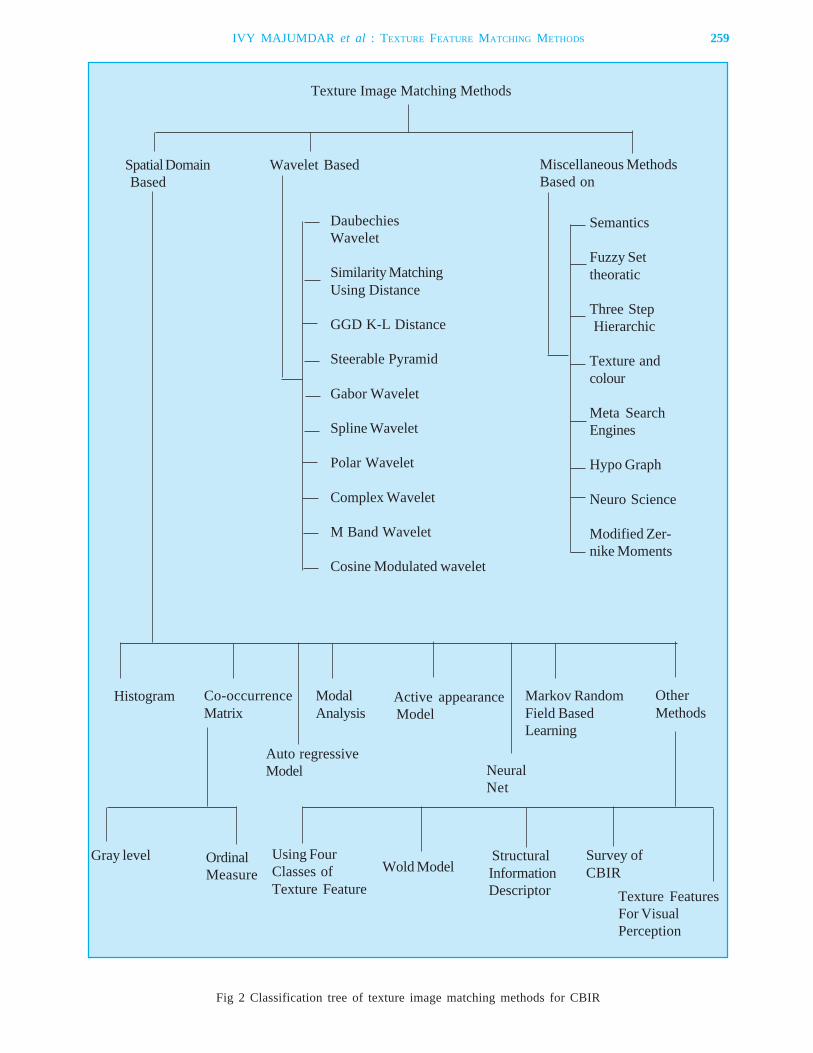
Texture Image Matching Methods
Wavelet BasedSpatial Domain Based
Miscellaneous MethodsBased on
DaubechiesWavelet
Similarity MatchingUsing Distance
GGD K-L Distance
Steerable Pyramid
Gabor Wavelet
Spline Wavelet
Polar Wavelet
Complex Wavelet
M Band Wavelet
Cosine Modulated wavelet
Semantics
Fuzzy Settheoratic
Three Step Hierarchic
Texture andcolour
Meta SearchEngines
Hypo Graph
Neuro Science
Modified Zer-nike Moments
Auto regressiveModel
Histogram Co-occurrenceMatrix
ModalAnalysis
Active appearance Model
Markov RandomField BasedLearning
OtherMethods
NeuralNet
StructuralInformationDescriptor
Using FourClasses ofTexture Feature
Gray level OrdinalMeasure Wold Model
Survey ofCBIR
Texture FeaturesFor VisualPerception
Fig 2 Classification tree of texture image matching methods for CBIR
IVY MAJUMDAR et al : TEXTURE FEATURE MATCHING METHODS 259
260 IETE TECHNICAL REVIEW, Vol 24, No 4, July-August 2007
the modal structure (ii) latent semantic indexing toobtain good results with database fabric and wrappingpaper images.
2.5. Active Appearance Model basedMethod
Cootes et al [20] described a statistical appearancemodel which is obtained by combining the models ofshape and texture variations. They obtained an iterativematching algorithm in which perturbations of the modelparameters are related with minimization of textureerror to provide improved texture match.
2.6. Neural Network based Method
Long et al [21] described a neural network basedmethod which optimizes the invariant / perceptualmappings of texture images. Gabor features of textureimage are mapped to an invariant space in the firstthree layers. Texture is mapped into the perceptualspace in the last three layers. They obtained improvedretrieval performance.
2.7. Markov Random Field based Method
Gimel’farb and Jain [22] used learning scheme fora Markov random field image model with Gibbsprobability distribution. Their distance measure is basedon the gray level histogram collected in accordancewith the structure of multiple pairwise pixel interactionsin the sub-images to be matched. The method cantolerate texture rotation and scale to a certain extent.
2.8. Other Spatial Domain Methods
In addition to the above seven types we find afew more spatial domain models which does not fallinto any of the above. Ohanian and Dubes [23] usedfour classes of texture features namely random fieldmodeling, fractal geometry, co-occurrence matricesand Gabor filtering separately and found that the co-occurrence matrices perform the best amongst these.Liu and Picard [24] used a new Wold model fortexture images and demonstrated that this modelperform better compared to (i) shift invariant principalcomponent analysis and (ii) multiresolutionsimultaneous autoregressive model. Carkacioglu andVural [25] gave a statistical analysis of structuralinformation (SASI) descriptor for texture imageretrieval and demonstrated its effectiveness. Xu andLiao [26] used clustering technique for texture imageretrieval and used this method for medical images.
Tamura et al [27] proposed several features oftexture images namely coarseness, directionality,contrast etc which are used in the IBM QBIC Systemof CBIR.
3. WAVELET BASED METHODS
A large number of works can be seen in imagematching for CBIR with texture features usingwavelets. Efforts were made to use different waveletsand the effectiveness of these for the retrievalperformance was found out. A brief description ofthese methods will be discussed in the followingsubsections.
3.1 Daubechies Wavelet based Method
Wang et al [28] used Daubechies wavelet anddetermined the wavelet coefficients as features andused a two level multiresolution matching for retrievalwhich they called image indexing and searching toobtain good results.
3.2. Method based on Similarity Matchingusing Distance
Laine and Fan [29] used the conventional discretewavelet transform to determine the features and useddistances as similarity measure for matching. Changand Kuo [30] used tree structured wavelet transformand distance functions for texture analysis. Unser [31]used wavelet frame for texture classification andsegmentation. June and Scharcanski [32] used discretedyadic wavelet transform (DDWT) to represent theimages in multiple resolutions to determine theorientation and gray level distributions. They determineda multi-resolution distance measure to match similarity.Fauzi and Lewis [33] used sub-images at variousresolutions of wavelet transform and determined thetexture features in each sub-image. In their matchingalgorithm they compared the distance between thefeatures of the query image with the features in eachsub-image thereby obtaining good accuracy. Kokareet al [34] used Daubechies orthogonal wavelet 8-tapfilter coefficients as feature and gave an excellentcomparison for retrieval performance using Euclidian,Manhattan, Chebychev, Mahalanobis, Square Chord,Squared Chi-Squared, Canberra, Bray-Curtis andweighted mean variance distance functions. Shang etal [35] also used DDWT and a novel technique todescribe the textures with their orientation and graylevel distribution using global spatial relationship ofcolour to achieve better performance in comparison tothat of [32].
3.3. Generalized Gaussian Distribution andKullback-Leibler Distance basedMethod
Tzagkarakis and Tsakalides [36] used statisticalfeature and similarity measurements for CBIR. Theyused generalized Gaussian distribution (GGD) formodeling wavelet coefficient and matched the texturesusing Kullback-Leibler (K-L) distance between alpha-stable distributions. Do and Vetterli [37, 38] also usedthe GGD for modeling marginal distribution of waveletcoefficients and a closed form K-L distance betweenGGD’s for matching thereby achieving significantimprovement in retrieval rates.
3.4. Steerable Pyramid based Method
Patrice and Konik [39] derived the texture featureson a multiresolution paradigm called steerable pyramidin wavelet based decomposition. They used severalsimilarity criteria like weighted L2 norm between twofeature sets and symmetrized version of K-L divergencefor matching. Finally they introduced a relevancefeedback for improvement in the retrieval performance.
3.5. Gabor Wavelet based Method
Wu et al [40,41] and Manjunath and Ma [42] usedGaussian function modulated by complex sinusoid calledGabor functions as features and using normalizedEuclidean distance obtained approximately 74%retrieval accuracy. Ma and Manjunath [43] used theGabor features in a hybrid neural network for learningthe similarity as feature space clustering therebyimproving the retrieval performance.
3.6. Spline Wavelet based Method
Qiao et al [44] used spline wavelets to determinefeatures like mean and standard deviation of the sub-band coefficients. Their database consisted of 1,792images. It was found that linear Battle-Lemarié splinewavelet, cubic bi-directional orthogonal spline waveletsand quadratic spline dyadic wavelet give betterperformance compared to cosine modulated and Gaborwavelets.
3.7. Polar Wavelet based Method
Pun [45] used polar wavelet for retrieval of textureimages. The feature extraction is the polar transformfollowed by an adaptive row shift invariant waveletpacket transform. During similarity matching k-nearestneighbor search is used.
3.8. Complex Wavelet based Method
Rivaz and Kingsbury [46] used complex wavelettransform for texture image retrieval. They used thecomplex wavelet transform to obtain texture featuresand using a similarity matrix they obtained accuracyapproximately same as that obtained using Gaborwavelets. Hatipoglu et al [47] used dual tree complexwavelet transform (DT-CWT) for texture imagefeatures and obtained retrieval performance betterthan that obtained using real discrete wavelet transform(DWT). Kokare et al [48-50] used (i) rotated complexwavelet filter(RCWF), (ii) dual tree complex wavelettransform (DT-CWT) and (iii) RCWF and DT-CWTas three different feature sets and obtained improvedretrieval performance compared to that obtained usingreal DWT and using Gabor wavelet. They could usethe method for both rotated and non-rotated database.The method is effective for small size rotated, mediumsize rotated and large size rotated image databases.
3.9. M-Band Wavelet based Method
Acharya and Kundu [51] used M-Band wavelettransform to give an adaptive and unsupervisedsegmentation method for texture images. Kokare et al[52] used the M-Channel wavelets for texture imageretrieval. They could achieve good retrieval accuracywith less computational effort than that using Gaborwavelets.
3.10 Cosine Modulated Wavelet basedMethod
Koilpillai and Vaidyanathan [53] gave the conceptof cosine-modulated FIR filter banks which is a specialclass of unitary filter banks. Kokare et al [54,55]used this as (i) cosine modulated wavelet based and(ii) cosine modulated wavelet packet based texturefeatures for CBIR. They obtained better performanceboth in terms of accuracy and retrieval time ascompared to that obtained using Gabor wavelets.
4. MISCELLANEOUS METHODS
In this section we will review some of the methodswhich do not fall in the category mentioned in theprevious sections. These methods either use a newconcept like fuzzy sets, neuroscience, semantics etcor use a combination of concepts described in theprevious section. These methods are given in thefollowing subsections.
IVY MAJUMDAR et al : TEXTURE FEATURE MATCHING METHODS 261
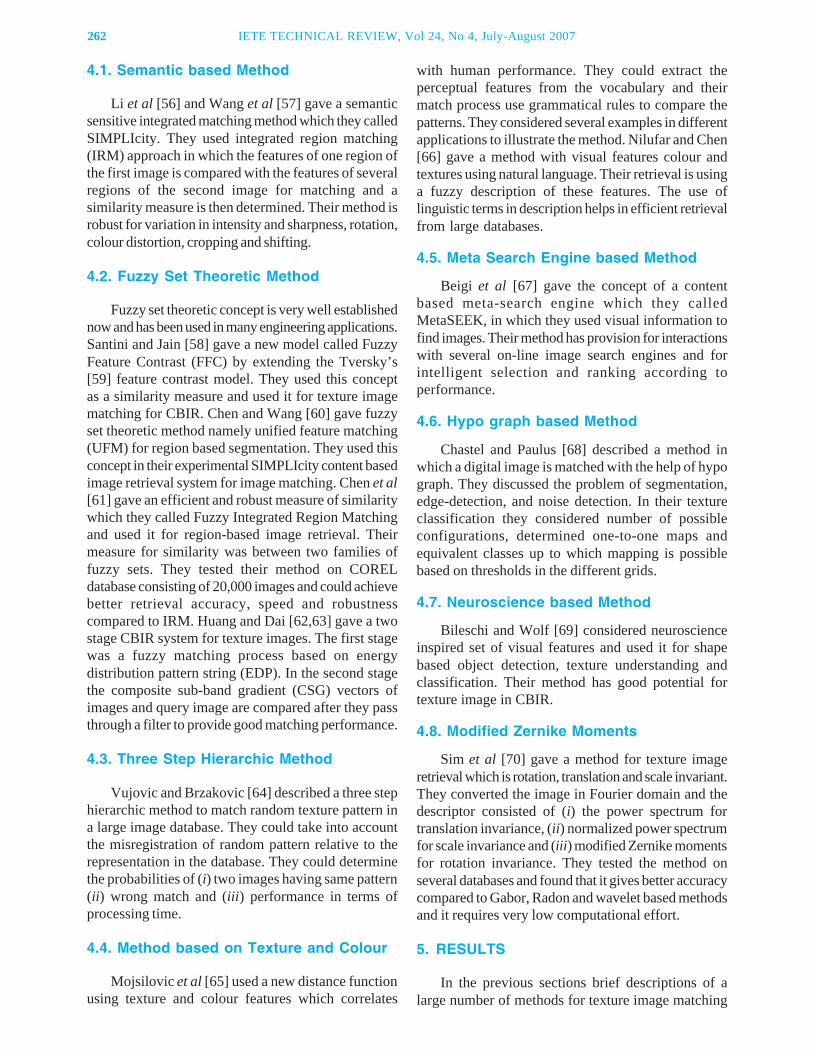
262 IETE TECHNICAL REVIEW, Vol 24, No 4, July-August 2007
4.1. Semantic based Method
Li et al [56] and Wang et al [57] gave a semanticsensitive integrated matching method which they calledSIMPLIcity. They used integrated region matching(IRM) approach in which the features of one region ofthe first image is compared with the features of severalregions of the second image for matching and asimilarity measure is then determined. Their method isrobust for variation in intensity and sharpness, rotation,colour distortion, cropping and shifting.
4.2. Fuzzy Set Theoretic Method
Fuzzy set theoretic concept is very well establishednow and has been used in many engineering applications.Santini and Jain [58] gave a new model called FuzzyFeature Contrast (FFC) by extending the Tversky’s[59] feature contrast model. They used this conceptas a similarity measure and used it for texture imagematching for CBIR. Chen and Wang [60] gave fuzzyset theoretic method namely unified feature matching(UFM) for region based segmentation. They used thisconcept in their experimental SIMPLIcity content basedimage retrieval system for image matching. Chen et al[61] gave an efficient and robust measure of similaritywhich they called Fuzzy Integrated Region Matchingand used it for region-based image retrieval. Theirmeasure for similarity was between two families offuzzy sets. They tested their method on CORELdatabase consisting of 20,000 images and could achievebetter retrieval accuracy, speed and robustnesscompared to IRM. Huang and Dai [62,63] gave a twostage CBIR system for texture images. The first stagewas a fuzzy matching process based on energydistribution pattern string (EDP). In the second stagethe composite sub-band gradient (CSG) vectors ofimages and query image are compared after they passthrough a filter to provide good matching performance.
4.3. Three Step Hierarchic Method
Vujovic and Brzakovic [64] described a three stephierarchic method to match random texture pattern ina large image database. They could take into accountthe misregistration of random pattern relative to therepresentation in the database. They could determinethe probabilities of (i) two images having same pattern(ii) wrong match and (iii) performance in terms ofprocessing time.
4.4. Method based on Texture and Colour
Mojsilovic et al [65] used a new distance functionusing texture and colour features which correlates
with human performance. They could extract theperceptual features from the vocabulary and theirmatch process use grammatical rules to compare thepatterns. They considered several examples in differentapplications to illustrate the method. Nilufar and Chen[66] gave a method with visual features colour andtextures using natural language. Their retrieval is usinga fuzzy description of these features. The use oflinguistic terms in description helps in efficient retrievalfrom large databases.
4.5. Meta Search Engine based Method
Beigi et al [67] gave the concept of a contentbased meta-search engine which they calledMetaSEEK, in which they used visual information tofind images. Their method has provision for interactionswith several on-line image search engines and forintelligent selection and ranking according toperformance.
4.6. Hypo graph based Method
Chastel and Paulus [68] described a method inwhich a digital image is matched with the help of hypograph. They discussed the problem of segmentation,edge-detection, and noise detection. In their textureclassification they considered number of possibleconfigurations, determined one-to-one maps andequivalent classes up to which mapping is possiblebased on thresholds in the different grids.
4.7. Neuroscience based Method
Bileschi and Wolf [69] considered neuroscienceinspired set of visual features and used it for shapebased object detection, texture understanding andclassification. Their method has good potential fortexture image in CBIR.
4.8. Modified Zernike Moments
Sim et al [70] gave a method for texture imageretrieval which is rotation, translation and scale invariant.They converted the image in Fourier domain and thedescriptor consisted of (i) the power spectrum fortranslation invariance, (ii) normalized power spectrumfor scale invariance and (iii) modified Zernike momentsfor rotation invariance. They tested the method onseveral databases and found that it gives better accuracycompared to Gabor, Radon and wavelet based methodsand it requires very low computational effort.
5. RESULTS
In the previous sections brief descriptions of alarge number of methods for texture image matching
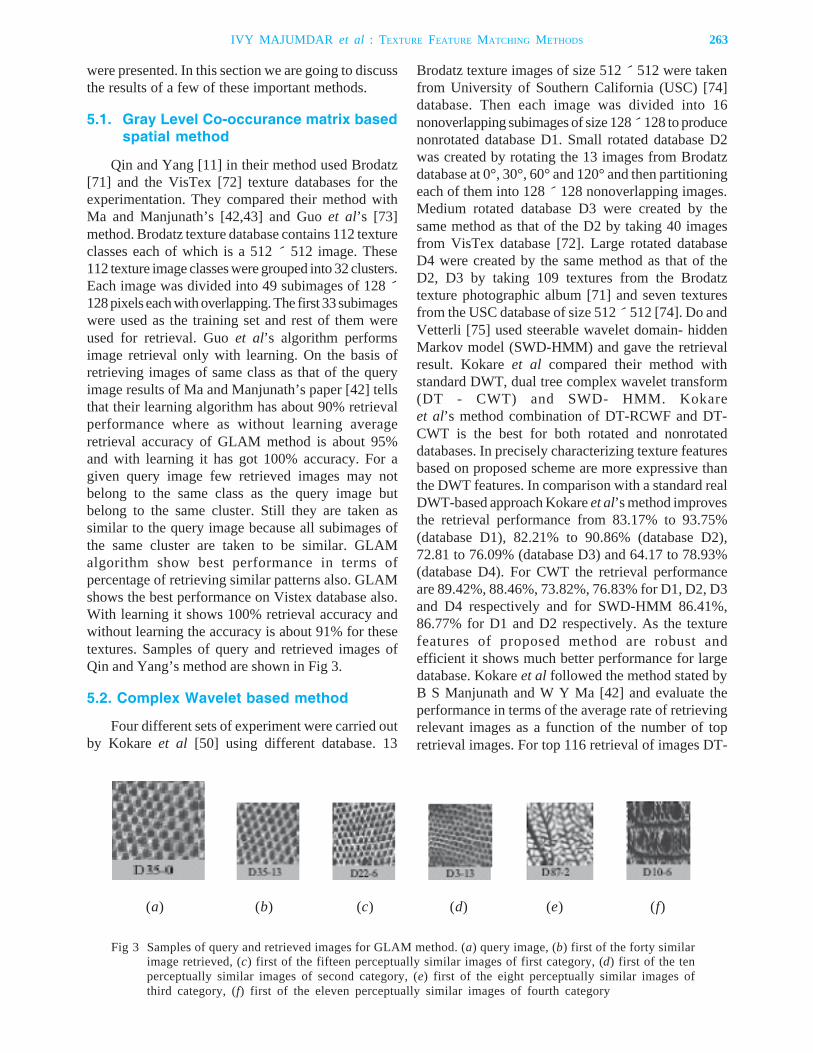
were presented. In this section we are going to discussthe results of a few of these important methods.
5.1. Gray Level Co-occurance matrix basedspatial method
Qin and Yang [11] in their method used Brodatz[71] and the VisTex [72] texture databases for theexperimentation. They compared their method withMa and Manjunath’s [42,43] and Guo et al’s [73]method. Brodatz texture database contains 112 textureclasses each of which is a 512 512 image. These112 texture image classes were grouped into 32 clusters.Each image was divided into 49 subimages of 128 ´128 pixels each with overlapping. The first 33 subimageswere used as the training set and rest of them wereused for retrieval. Guo et al’s algorithm performsimage retrieval only with learning. On the basis ofretrieving images of same class as that of the queryimage results of Ma and Manjunath’s paper [42] tellsthat their learning algorithm has about 90% retrievalperformance where as without learning averageretrieval accuracy of GLAM method is about 95%and with learning it has got 100% accuracy. For agiven query image few retrieved images may notbelong to the same class as the query image butbelong to the same cluster. Still they are taken assimilar to the query image because all subimages ofthe same cluster are taken to be similar. GLAMalgorithm show best performance in terms ofpercentage of retrieving similar patterns also. GLAMshows the best performance on Vistex database also.With learning it shows 100% retrieval accuracy andwithout learning the accuracy is about 91% for thesetextures. Samples of query and retrieved images ofQin and Yang’s method are shown in Fig 3.
5.2. Complex Wavelet based method
Four different sets of experiment were carried outby Kokare et al [50] using different database. 13
Brodatz texture images of size 512 512 were takenfrom University of Southern California (USC) [74]database. Then each image was divided into 16nonoverlapping subimages of size 128 128 to producenonrotated database D1. Small rotated database D2was created by rotating the 13 images from Brodatzdatabase at 0°, 30°, 60° and 120° and then partitioningeach of them into 128 128 nonoverlapping images.Medium rotated database D3 were created by thesame method as that of the D2 by taking 40 imagesfrom VisTex database [72]. Large rotated databaseD4 were created by the same method as that of theD2, D3 by taking 109 textures from the Brodatztexture photographic album [71] and seven texturesfrom the USC database of size 512 512 [74]. Do andVetterli [75] used steerable wavelet domain- hiddenMarkov model (SWD-HMM) and gave the retrievalresult. Kokare et al compared their method withstandard DWT, dual tree complex wavelet transform(DT - CWT) and SWD- HMM. Kokareet al’s method combination of DT-RCWF and DT-CWT is the best for both rotated and nonrotateddatabases. In precisely characterizing texture featuresbased on proposed scheme are more expressive thanthe DWT features. In comparison with a standard realDWT-based approach Kokare et al’s method improvesthe retrieval performance from 83.17% to 93.75%(database D1), 82.21% to 90.86% (database D2),72.81 to 76.09% (database D3) and 64.17 to 78.93%(database D4). For CWT the retrieval performanceare 89.42%, 88.46%, 73.82%, 76.83% for D1, D2, D3and D4 respectively and for SWD-HMM 86.41%,86.77% for D1 and D2 respectively. As the texturefeatures of proposed method are robust andefficient it shows much better performance for largedatabase. Kokare et al followed the method stated byB S Manjunath and W Y Ma [42] and evaluate theperformance in terms of the average rate of retrievingrelevant images as a function of the number of topretrieval images. For top 116 retrieval of images DT-
(a) (b) (c) (d) (e) (f)
Fig 3 Samples of query and retrieved images for GLAM method. (a) query image, (b) first of the forty similarimage retrieved, (c) first of the fifteen perceptually similar images of first category, (d) first of the tenperceptually similar images of second category, (e) first of the eight perceptually similar images ofthird category, (f) first of the eleven perceptually similar images of fourth category
IVY MAJUMDAR et al : TEXTURE FEATURE MATCHING METHODS 263
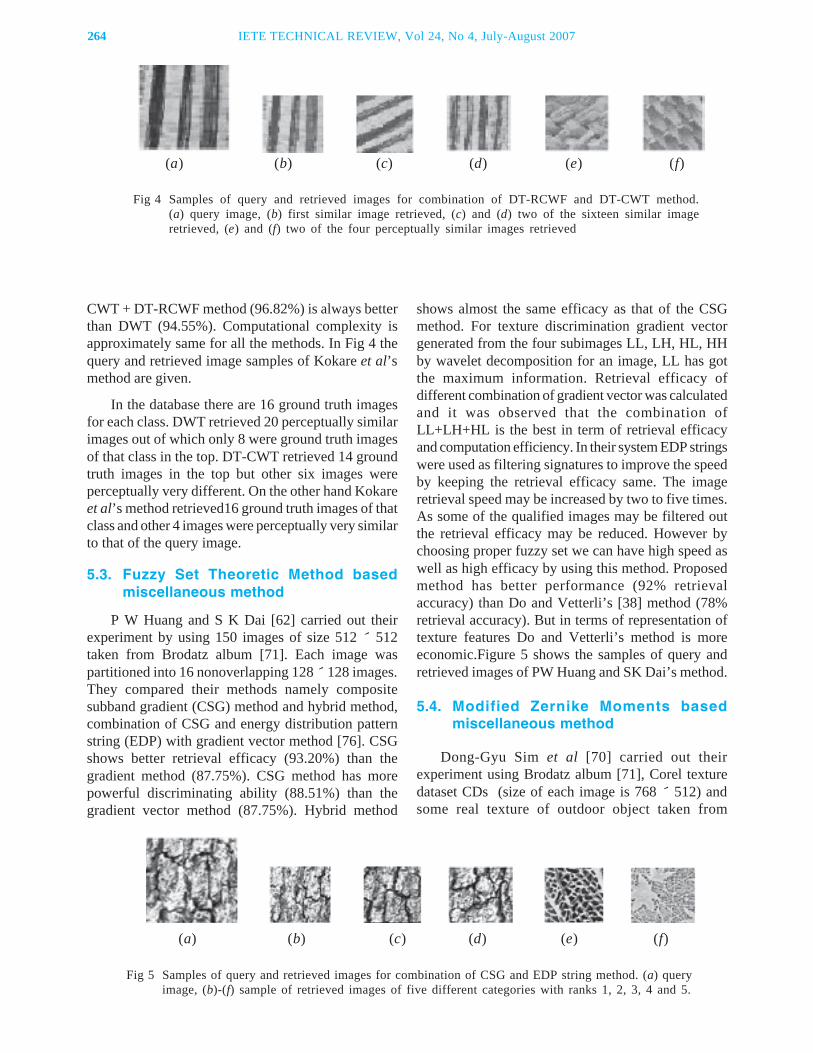
264 IETE TECHNICAL REVIEW, Vol 24, No 4, July-August 2007
CWT + DT-RCWF method (96.82%) is always betterthan DWT (94.55%). Computational complexity isapproximately same for all the methods. In Fig 4 thequery and retrieved image samples of Kokare et al’smethod are given.
In the database there are 16 ground truth imagesfor each class. DWT retrieved 20 perceptually similarimages out of which only 8 were ground truth imagesof that class in the top. DT-CWT retrieved 14 groundtruth images in the top but other six images wereperceptually very different. On the other hand Kokareet al’s method retrieved16 ground truth images of thatclass and other 4 images were perceptually very similarto that of the query image.
5.3. Fuzzy Set Theoretic Method basedmiscellaneous method
P W Huang and S K Dai [62] carried out theirexperiment by using 150 images of size 512 512taken from Brodatz album [71]. Each image waspartitioned into 16 nonoverlapping 128 128 images.They compared their methods namely compositesubband gradient (CSG) method and hybrid method,combination of CSG and energy distribution patternstring (EDP) with gradient vector method [76]. CSGshows better retrieval efficacy (93.20%) than thegradient method (87.75%). CSG method has morepowerful discriminating ability (88.51%) than thegradient vector method (87.75%). Hybrid method
shows almost the same efficacy as that of the CSGmethod. For texture discrimination gradient vectorgenerated from the four subimages LL, LH, HL, HHby wavelet decomposition for an image, LL has gotthe maximum information. Retrieval efficacy ofdifferent combination of gradient vector was calculatedand it was observed that the combination ofLL+LH+HL is the best in term of retrieval efficacyand computation efficiency. In their system EDP stringswere used as filtering signatures to improve the speedby keeping the retrieval efficacy same. The imageretrieval speed may be increased by two to five times.As some of the qualified images may be filtered outthe retrieval efficacy may be reduced. However bychoosing proper fuzzy set we can have high speed aswell as high efficacy by using this method. Proposedmethod has better performance (92% retrievalaccuracy) than Do and Vetterli’s [38] method (78%retrieval accuracy). But in terms of representation oftexture features Do and Vetterli’s method is moreeconomic.Figure 5 shows the samples of query andretrieved images of PW Huang and SK Dai’s method.
5.4. Modified Zernike Moments basedmiscellaneous method
Dong-Gyu Sim et al [70] carried out theirexperiment using Brodatz album [71], Corel texturedataset CDs (size of each image is 768 512) andsome real texture of outdoor object taken from
Fig 4 Samples of query and retrieved images for combination of DT-RCWF and DT-CWT method.(a) query image, (b) first similar image retrieved, (c) and (d) two of the sixteen similar imageretrieved, (e) and (f) two of the four perceptually similar images retrieved
(a) (b) (c) (d) (e) (f)
Fig 5 Samples of query and retrieved images for combination of CSG and EDP string method. (a) queryimage, (b)-(f) sample of retrieved images of five different categories with ranks 1, 2, 3, 4 and 5.
(a) (b) (c) (d) (e) (f)
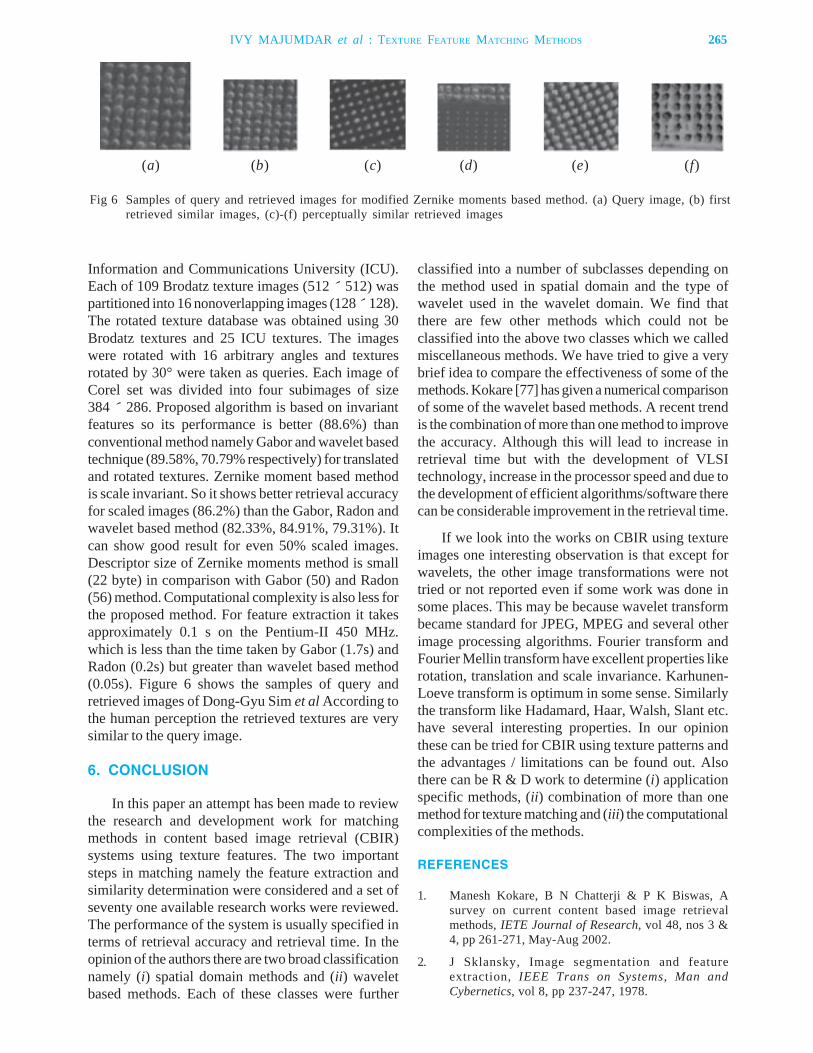
Information and Communications University (ICU).Each of 109 Brodatz texture images (512 512) waspartitioned into 16 nonoverlapping images (128 128).The rotated texture database was obtained using 30Brodatz textures and 25 ICU textures. The imageswere rotated with 16 arbitrary angles and texturesrotated by 30° were taken as queries. Each image ofCorel set was divided into four subimages of size384 286. Proposed algorithm is based on invariantfeatures so its performance is better (88.6%) thanconventional method namely Gabor and wavelet basedtechnique (89.58%, 70.79% respectively) for translatedand rotated textures. Zernike moment based methodis scale invariant. So it shows better retrieval accuracyfor scaled images (86.2%) than the Gabor, Radon andwavelet based method (82.33%, 84.91%, 79.31%). Itcan show good result for even 50% scaled images.Descriptor size of Zernike moments method is small(22 byte) in comparison with Gabor (50) and Radon(56) method. Computational complexity is also less forthe proposed method. For feature extraction it takesapproximately 0.1 s on the Pentium-II 450 MHz.which is less than the time taken by Gabor (1.7s) andRadon (0.2s) but greater than wavelet based method(0.05s). Figure 6 shows the samples of query andretrieved images of Dong-Gyu Sim et al According tothe human perception the retrieved textures are verysimilar to the query image.
6. CONCLUSION
In this paper an attempt has been made to reviewthe research and development work for matchingmethods in content based image retrieval (CBIR)systems using texture features. The two importantsteps in matching namely the feature extraction andsimilarity determination were considered and a set ofseventy one available research works were reviewed.The performance of the system is usually specified interms of retrieval accuracy and retrieval time. In theopinion of the authors there are two broad classificationnamely (i) spatial domain methods and (ii) waveletbased methods. Each of these classes were further
classified into a number of subclasses depending onthe method used in spatial domain and the type ofwavelet used in the wavelet domain. We find thatthere are few other methods which could not beclassified into the above two classes which we calledmiscellaneous methods. We have tried to give a verybrief idea to compare the effectiveness of some of themethods. Kokare [77] has given a numerical comparisonof some of the wavelet based methods. A recent trendis the combination of more than one method to improvethe accuracy. Although this will lead to increase inretrieval time but with the development of VLSItechnology, increase in the processor speed and due tothe development of efficient algorithms/software therecan be considerable improvement in the retrieval time.
If we look into the works on CBIR using textureimages one interesting observation is that except forwavelets, the other image transformations were nottried or not reported even if some work was done insome places. This may be because wavelet transformbecame standard for JPEG, MPEG and several otherimage processing algorithms. Fourier transform andFourier Mellin transform have excellent properties likerotation, translation and scale invariance. Karhunen-Loeve transform is optimum in some sense. Similarlythe transform like Hadamard, Haar, Walsh, Slant etc.have several interesting properties. In our opinionthese can be tried for CBIR using texture patterns andthe advantages / limitations can be found out. Alsothere can be R & D work to determine (i) applicationspecific methods, (ii) combination of more than onemethod for texture matching and (iii) the computationalcomplexities of the methods.
REFERENCES
1. Manesh Kokare, B N Chatterji & P K Biswas, Asurvey on current content based image retrievalmethods, IETE Journal of Research, vol 48, nos 3 &4, pp 261-271, May-Aug 2002.
2. J Sklansky, Image segmentation and featureextraction, IEEE Trans on Systems, Man andCybernetics, vol 8, pp 237-247, 1978.
Fig 6 Samples of query and retrieved images for modified Zernike moments based method. (a) Query image, (b) firstretrieved similar images, (c)-(f) perceptually similar retrieved images
(a) (b) (c) (d) (e) (f)
IVY MAJUMDAR et al : TEXTURE FEATURE MATCHING METHODS 265
266 IETE TECHNICAL REVIEW, Vol 24, No 4, July-August 2007
3. Lei Qin & Wen Gao, Image Matching Based on ALocal Invariant Descriptor, IEEE InternationalConference on Image Processing, pp 766-769, 2005.
4. Lei Qin, Wei Zeng, Wen Gao & Weiqiang Wang,Local Invariant Descriptor for Image Matching, IEEEInternational Conference on Acoustic, Speech &Signal Processing (ICASSP 2005), pp II-1025 - II-1028, 2005.
5. Kristen Grauman, Trevor Darrell, Efficient ImageMatching with Distributions of Local InvarientFeatures, IEEE International Conference onComputer Vision and Pattern Recognition, SanDiego, CA, June 2005.
6. Selim Aksoy & Robert M Haralick, Textural Featuresfor Image Database Retrieval, IEEE Workshop onContent-Based Access of Image and VideoLibraries, Santa Barbara, CA, pp 45-49, June 21,1998.
7. Selim Aksoy & Robert M Haralick, Content-basedImage Database Retrieval Using Variances of GrayLevel Spatial Dependencies, IARP InternationalWorkshop on Multimedia Information Analysis andRetrieval, Hong Kong, pp 3-19, August 13-14,1998.
8. Selim Aksoy & Robert M Haralick, Using Texture inImage Similarity & Retrieval, InternationalWorkshop on Texture Analysis in Mashin Vision,Oulu, Finland, pp 111-117, 1999.
9. Selim Aksoy & Robert M Haralick, Using Texture inImage Similarity & Retrieval, M.Pietikainen, ed.,Texture analysis in Machine Perception andArtificial Intelligence, World Scientific, pp 129-149,2000.
10. Svetlana Lazebnik, Cordelia Schmid & Jean Ponce,Affine Invariant Local Descriptors & NeighborhoodStatistics for Texture Recognition, 9th IEEEInternational Conference on Computer Vision(ICCV’03), 2003.
11. Xuejie Qin & Yee-Hong Yang, Similarity Measure &Learning with Gray Level Aura Matrices (GLAM) forTexture Image Retrieval, IEEE Computer SocietyConference on Computer Vision and PatternRecognition (CVPR’04), 2004.
12. Guodong Guo, Hong-Jiang Zhang & Stan Z Li,Distance-from-boundary as a Metric for TextureImage Retrieval, IEEE International Conference onAcoustics, Speech and Signal Processing(ICASSP’01), vol 3, 2001.
13. Mari Partio, Bogdan Cramariuc & Moncef Gobbouj,Texture Similarity Evaluation using Ordinal Co-occurrence, IEEE International Conference onImage Processing (ICIP), vol 3, pp 1537- 1540, 2004.
14. Mari Partio, Bogdan Cramariuc & Moncef Gobbouj,Texture Retrieval using Ordinal Co-occurrenceFeatures, Proceedings of the 6th Nordic SignalProcessing Symposium - NORSIG 2004, June 9-11,2004.
15. Mari Partio Bogdan Cramariuc & Moncef Gobbouj,Block Based Ordinal Co-occurrence Matrices forTexture Similarity Evaluation, IEEE International
Conference on Image Processing, vol 1, pp 517-520,2005.
16. Noureddine Abbadeni, Content Representation &Similarity Matching for Texture-based ImageRetrieval, ACM, Proceedings of MIR’03, Berkeley,pp 63-70, 2003.
17. Noureddine Abbedeni, A New Similarity MatchingMeasure Application to Texture Based ImageRetrieval, Proceedings of the 3rd InternationalWorkshop on Texture Analysis and Synthesis(TEXTURE 2003), 2003.
18. Marco Carcassoni, Eraldo Ribeiro & Edwin RHancock, Texture recognition through ModalAnalysis of Spectral Peak Patterns, IEEE,International Conference on Pattern Recognition,pp 243-246, 2002.
19. Marco Carcassoni, Eraldo Ribeiro, Edwin RHancock, Eigenvector Method for TextureRecognition, IEEE, International Conference onImage Processing, pp III-321-III-324, 2002.
20. Timothy F.Cootes, Gareth J Edwards & ChristopherJ Taylor, Active appearance models, IEEETransaction on PAMI, vol 23, no 6, pp 681-685, June2001.
21. Huizhong Long, Chee Wee Tan, Wee Kheng Leow,Invariant & Perceptually Consistent TextureMapping for Content Based Image Retrieval, IEEEInternational Conference on Image Processing, vol2, pp 117-120, 2001.
22. Georgy L Gimel’farb & Anil K Jain, On RetrievingTextured Images from an Image Database, Patternrecognition, vol 29, no 9, pp 1461-1483, 1996.
23. P.P Ohanian & R C Dubes, Performance evaluationfor four classes of textural features, PatternRecognition, 25(8), 1992.
24. F Liu & R W Picard, Periodicity, directionality &randomness: Wold features for image modeling &retrieval, IEEE Trans on Pattern Analysis andMachine Intelligence, vol 18, pp 722-733, 1996.
25. A Carkacioglu & F Y Vural SASI: a generic texturedescriptor for image retrieval, Pattern Recognition,vol 36, pp 2615-2633, 2003.
26. Hui Xu & Mengyang Liao, Cluster-Based Texturematching for Image Retrieval, IEEE InternationalConference on Image Processing, pp 766-769, 1998.
27. H Tamura, S Mori & T Yamawaki, Textural featurescorresponding to visual perception, IEEE Trans onSystem, Man, Cybernetics, 8(16), pp 460-473, 1978.
28. James Ze Wang, Gio Wiederhold, Oscar Firschein &Sha Xin Wei, Content-based image indexing &searching using Daubechies Wavelets, Inter-national Journal on Digital Libraries, pp 311-328,1997.
29. A Laine & J Fan, Texture classification by waveletpacket signature, IEEE Trans on Pattern Analysisand Machine Intelligence, vol 15, no 11, pp 1186-1191, Nov 1993.
30. T Chang & C C Kuo, Texture analysis &classification with tree structured wavelet transform,IEEE Trans on Image Processing, vol 2, no 4, pp429-441, 1993.
31. M Unser, Texture Classification & Segmentationusing Wavelet Frames, IEEE Trans ImageProcessing, vol 4, no 11, pp 1549-1560, 1995.
32. Junc C R, Scharcanski J, Stochastic Texture ImageRetrieval & Similarity Matching, IEEE, xiii braziliansymposium on computer graphics and imageprocessing, pp 178-184, 2000.
33. Mohammad F A Fauzi & Paul H Lewis, Texture-based Image Retrieval Using Multiscale Sub-imageMatching, IS and T/SPIE’s 15th Annual SymposiumElectronic Imaging : Image and VideoCommunications and Processing, Santa Clara,California, pp 407-416, 2003.
34. Manesh Kokare, B N Chatterji & P K Biswas,Comparision of Similarity Metrics for Texture ImageRetrieval, IEEE, conference on convergenttechnologies for Asia pacific region, TENCON 03,pp 571-575, 2003.
35. Zhao -Wei Shang, Gui-Zhong Liu & Ya- Tong Zhou,Texture Image Retrieval & Similarity Matching,Proceedings of the third International Conferenceon Machine Learning and Cybernetics, Shanghai,pp 4081- 4084, August 2004.
36. George Tzagkarakis & Panagiotis Tsakalides, AStatistical Approach To Texture Image Retrievalvia Alpha-stable Modeling of WaveletDecompositions, WIAMIS Lisbon, Portugal, April21-23, 2004.
37. Minh N Do & Martin Vetterli, Texture SimilarityMeasurement using Kullback-Leibler Distance onWavelet Subbands, IEEE International Conferenceon Image Processing, vol 3, pp 730-733, 2000.
38. Minh N Do & Martin Vetterli, Wavelet-Based TextureRetrieval Using Generalized Gaussian Density &KullBack-Leiblar Distance, IEEE Transaction onImage Processing, vol 11 no 2, pp 146-158, February2002.
39. Blancho Patrice, Hubert Konik, Texture SimilarityQueries & Relevance Feedback for Image Retrieval,IEEE International Conference on PatternRecognition, vol 4, pp 55-58, 2000.
40. P Wu, B S Manjunath, S D Newsam, & H D Shin, ATexture Descriptor for Image Retrieval & Browsing,IEEE International Conference on ComputerVision and Pattern Recognition, pp 3-7, June 1994.
41. P Wu, B S Manjunath, S D Newsam, & H D Shin, ATexture Descriptor for Browsing & SimilarityRetrieval, Journal of Signal Processing: ImageCommunication, vol 16, Issue 1-2, pp 33-43, Sept2000.
42. B S Manjunath & W Y Ma, Texture Features forBrowsing & Retrieval of Image Data, IEEETransaction on PAMI, vol 18, no 8, pp 837-842, Aug1996.
43. W Y Ma & B S Manjunath, Texture Features &Learning Similarity, IEEE International Conferenceon Computer Vision and Pattern Recognition, pp425-430, 1996.
44. Yu-Long Qiao, Zhe-Ming Lu, Jeng - Shyang Pan, &Sheng - He Sun, Spline Wavelets Based TextureFeatures For Image Retrieval, International Journalof Innovative Computing, Information and Control,vol 2, no 3, pp 653-658, 2006.
45. Chi Man Pun, Rotation-invariant texture feature forimage retrieval, Computer Vision and ImageUnderstanding, vol 89, pp 24 - 43, 2003.
46. P D Rivaz & N Kingsbury, Complex wavelet featuresfor fast texture image retrieval, Proceedings of IEEEInternational Conference on Image Processing(ICIP 1999), vol 1, pp 109-113, 1999.
47. S Hatipoglu, S K Mitra & N Kingsbury, Image texturedescription using complex wavelet transform,Proceedings of IEEE International Conference onImage Processing (ICIP 2000), vol II, pp 530-533,2000.
48. Manesh Kokare, P K Biswas & B N Chatterji, RotatedComplex Wavelet based Texture Features forContent Based Image Retrieval, Proceedings ofIEEE International Conference on PatternRecognition (ICPR 2004), 23rd to 26th Aug, 2004,Cambridge (UK).
49. Manesh Kokare, P K Biswas & B N Chatterji, Textureimage retrieval using new rotated complex waveletfilters, IEEE Trans on Systems, Man andCybernetics- part B, vol 35, no 6, pp 1168-1178,2005.
50. Manesh Kokare, P K Biswas & B N Chatterji,Rotation invariant texture image retrieval usingrotated complex wavelet filters, IEEE Trans onSystems, Man and Cybernetics- part B, vol 36, no 6,pp 1273-1282, 2006.
51. M Acharyya & M K Kundu, An adaptive approachto unsupervised texture segmentation using M-Bandwavelet transform, Signal Processing, vol 81, pp1337-1356, 2001.
52. Manesh Kokare & B N Chatterji & P K Biswas, M-Band Wavelet based Texture Features for ContentBased Image Retrieval, Proceedings of IndianConference on Vision, Graphics and ImageProcessing (ICVGIP 2002), pp 173-178, Dec 2002,Ahemadabad (INDIA).
53. R D Koilpillai & P P Vaidyanath, Cosine-modulatedFIR filter bank satisfying perfect reconstruction,IEEE Trans Signal Processing, pp 770-783, April1992.
54. Manesh Kokare, B N Chatterji & P K Biswas, Cosine-modulated wavelet based texture features forcontent based image retrieval, Pattern RecognitionLetter, vol 25, no 4, pp 391-398, March 2004.
55. Manesh Kokare, P K Biswas & B N Chatterji, Cosine-modulated wavelet packet based texture features forcontent based image retrieval, IETE Journal ofResearch, vol 51, no 6, pp 477-483, Nov-Dec 2005.
IVY MAJUMDAR et al : TEXTURE FEATURE MATCHING METHODS 267
268 IETE TECHNICAL REVIEW, Vol 24, No 4, July-August 2007
56. Jia Li, James Z Wang & Gio Wiederhold, IRM:Integrated Region Matching for Image Retrieval, 8th
ACM international Conference on Multimedia2000, Los Angeles, USA, Oct 30-Nov 3, pp 147-155,2000.
57. Jams Z Wang, Jia Li & Gio Wiederhold, SIMPLIcity:Semantics-Sensitive Integrated Matching for PictureLibraries, IEEE Transaction on PAMI, vol 23, no 9,pp 947-963, September 2001.
58. Simone Santini & Ramesh Jain, Similarity Measure,IEEE Transaction on PAMI, vol 21, no 9, pp 871-883, September 1999.
59. A Tversky, Features of similarity, PsychologicalReview, vol 84, no.4, pp 327-352, July 1977
60. Yixin Chen, James Z Wang, A Region Based FuzzyFeature Matching Approach to Content Based ImageRetrieval, IEEE Transaction on PAMI, vol 24, no 9,pp 1252-1267, September 2002.
61. Yixin Chen, James Z Wang, Jia Li, FIRM: FuzzilyIntegrated Region Matching for Content-basedImage Retrieval, 9th ACM international Conferenceon Multimedia 2001, Ottowa, Canada, Sept 30-Oct5, pp 543-545, 2001.
62. P W Huang & S K Dai, Image retrieval by Texturesimilarity, Pattern Recognition, vol 36, pp 665-679,2003.
63. P W Huang & S K Dai, Design of a two-stage contentbased image retrieval system using Texturesimilarity, Information Processing andManagement, vol 40, pp 81-96, 2004.
64. N.Vujovic & D.Brzakovic, Evaluation of anAlgorithm for Finding a Match of a Distorted TexturePattern in a Large Image Database, ACMTransaction on Information Systems, vol 16, no 1,pp 31- 60, January 1998.
65. Aleksandra Mojsilovic, Jelena Kovacevic, JianyingHu, Robert J.Safranek, Kicha Ganapathy, Matching& Retrieval Based on the Vocabulary & Grammar ofColor Patterns, IEEE Transaction on ImageProcessing, vol 9, no 1, pp 38-54, January 2000.
66. Sharmin Nilufar & Liang Chen, H K Kwan, A FuzzyQuery Based Image Retrieval System, Proceedingsof IEEE International Conference onCommunication, Circuits and Systems, vol 2, pp1017-1021, 2005.
67. Mandis Beigi, Ana B Benitez & Shih-Fu Chang,MetaSEEK: A Content-Based Meta-Search Enginefor Images, SPIE, January 1998.
68. S Chastel & D Paulus, Texture Identification UsingImage Neighborhood Hypergraphs, SPIE, San Jose,2004.
69. Stanley Bileschi & Lior Wolf, AUnified System ForObject Detection, Texture Recognition, & ContextAnalysis Based on the Standard Model Feature Set,Proceedings of British Vision Conference (BMVC),2006.
70. Dong Gyu Sim, Hae Kwang Kim, Rae-Hong Park,Invariant texture retrieval using modified Zernikemoments, Image and Vision Computing, vol 22, pp331-342, 2004.
71. P Brodatz, Textures: A Photographic Album forArtists & Designers, New York: Dover, 1966.
72. MIT Vision & Modeling Group, Vision Texture[Online] Available: http://vismod.www.mediamit.edu
73. Guo, G, S Z Li, & K L Chan, Learning Similarity forTexture Image Retrieval, ECCV, pp 178-190, 2000.
74. University of Southern California, Signal & ImageProcessing Institute, Rotated Textures [Online]Available: http://sipi.usc.edu/services/database/Database.html
75. M N Do & M Vetterli, Rotation invariant texturecharacterization & retrieval using steerable wavelet-domain hidden Markov models, IEEE TransMultimedia, vol 4, no 4, pp 517-527, Dec 2002.
76. S.R Fountain, T N Tan, Efficient rotation invarianttexture features for content-based image retrieval,Pattern Recognition, vol 31, pp 1725-1732, 1998.
77. Manish Kokare, Wavelet Based Features TextureImage Retrieval, PhD Thesis, IIT Kharagpur, 2004.
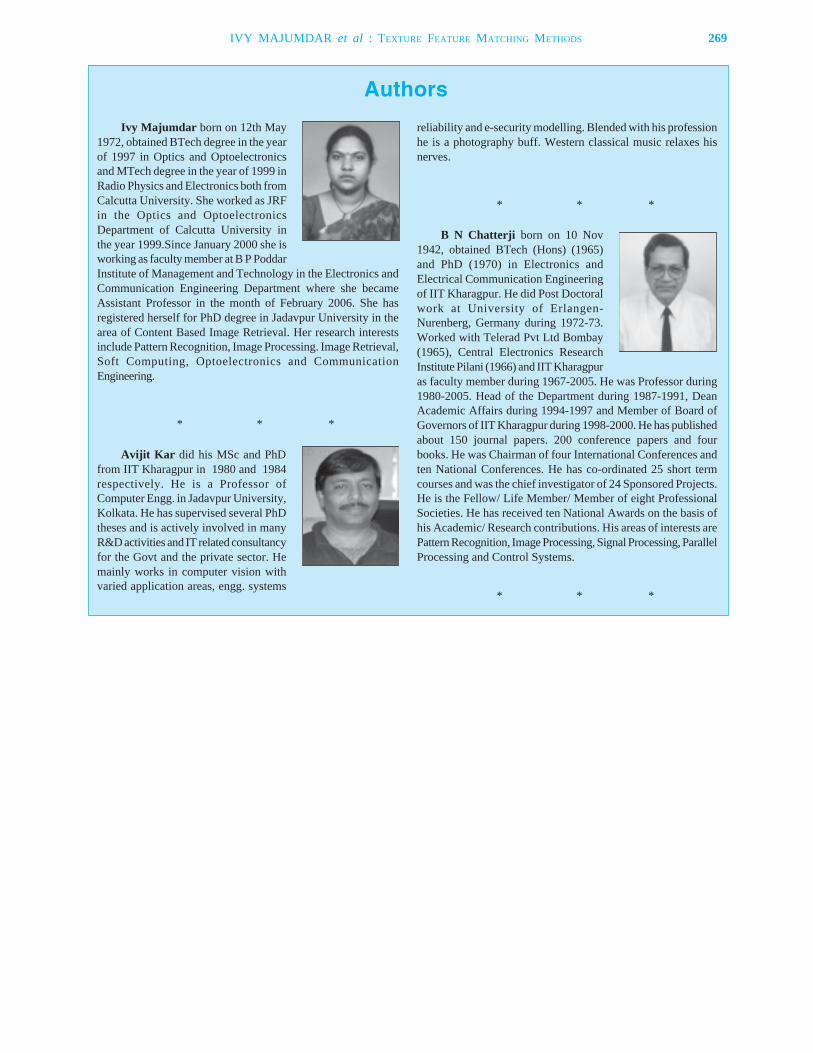
Ivy Majumdar born on 12th May1972, obtained BTech degree in the yearof 1997 in Optics and Optoelectronicsand MTech degree in the year of 1999 inRadio Physics and Electronics both fromCalcutta University. She worked as JRFin the Optics and OptoelectronicsDepartment of Calcutta University inthe year 1999.Since January 2000 she isworking as faculty member at B P PoddarInstitute of Management and Technology in the Electronics andCommunication Engineering Department where she becameAssistant Professor in the month of February 2006. She hasregistered herself for PhD degree in Jadavpur University in thearea of Content Based Image Retrieval. Her research interestsinclude Pattern Recognition, Image Processing. Image Retrieval,Soft Computing, Optoelectronics and CommunicationEngineering.
* * *
Avijit Kar did his MSc and PhDfrom IIT Kharagpur in 1980 and 1984respectively. He is a Professor ofComputer Engg. in Jadavpur University,Kolkata. He has supervised several PhDtheses and is actively involved in manyR&D activities and IT related consultancyfor the Govt and the private sector. Hemainly works in computer vision withvaried application areas, engg. systems
Authors
reliability and e-security modelling. Blended with his professionhe is a photography buff. Western classical music relaxes hisnerves.
* * *
B N Chatterji born on 10 Nov1942, obtained BTech (Hons) (1965)and PhD (1970) in Electronics andElectrical Communication Engineeringof IIT Kharagpur. He did Post Doctoralwork at University of Erlangen-Nurenberg, Germany during 1972-73.Worked with Telerad Pvt Ltd Bombay(1965), Central Electronics ResearchInstitute Pilani (1966) and IIT Kharagpuras faculty member during 1967-2005. He was Professor during1980-2005. Head of the Department during 1987-1991, DeanAcademic Affairs during 1994-1997 and Member of Board ofGovernors of IIT Kharagpur during 1998-2000. He has publishedabout 150 journal papers. 200 conference papers and fourbooks. He was Chairman of four International Conferences andten National Conferences. He has co-ordinated 25 short termcourses and was the chief investigator of 24 Sponsored Projects.He is the Fellow/ Life Member/ Member of eight ProfessionalSocieties. He has received ten National Awards on the basis ofhis Academic/ Research contributions. His areas of interests arePattern Recognition, Image Processing, Signal Processing, ParallelProcessing and Control Systems.
* * *
IVY MAJUMDAR et al : TEXTURE FEATURE MATCHING METHODS 269
271
Paper No 126-D; Copyright © 2007 by the IETE.
IETE Technical ReviewVol 24, No 4, July-August 2007, pp 271-276
Building a Strong Nation - The ECT wayR SREEHARI RAO, FIETE
Director, DLRL, Hyderabademail: [email protected]
The strength of any nation depends on the availability of resources, its industrialstrength and infrastructure base, with specific emphasis on the communicationinfrastructure. India, on one hand has abundant natural resources and excellent industrial &infrastructure base, which is mostly confined to urban and civilized society. On the otherhand, it has also a vast majority of population residing in villages, which is deprived of thebasic amenities and other growth opportunities. In this backdrop, the goal of achieving thegovernment’s vision to make India a ‘developed’ nation by the year 2020 is not a simple task.This vision of transformation to a ‘developed’ India can only be realized by empowering therural people with the Knowledge Powered PURA (Providing Urban amenities in Rural Areas).This is only possible through the creation of a Knowledge Society. This paper discusses theways and means of leveraging the ‘Electronics and Communication Technology’ towardsachieving this goal.
Integration of above three components results in‘Economic Connectivity’ that will lead to self-actuatingpeople and economy. Electronics and CommunicationTechnology plays a vital role in the last threeconnectivity mechanisms.
The realm of ‘Electronics and CommunicationTechnology’ (ECT) encompasses Telecommunication,Broadcasting and Information Technology, resultingin a unified Information Infrastructure - ‘Information& Communication Technology’ (ICT) capable ofcarrying any type of information, be it text, data, voiceor video. Thus ECT and ICT can mostly be usedinterchangeably. The Internet, with its huge quantitiesand variety of content, is an effective delivery andexchange system for information and knowledge,continuing education and learning.
ECT TOWARDS ‘GLOBAL-VILLAGE’,INDIA PERSPECTIVE
There are about 637,000 villages in India, with anaverage 250 - 300 households per village. Like in anycountry, the rural per capita income is distinctly lowerthan the national average, and this rural incomedistribution is also more skewed. A typical villagemay have only 100 households with sufficient income,while the rest struggling to earn just enough to meetthe essential needs. Two-thirds of the Indianhouseholds are dependent on agriculture for income,and even this is often seasonal and dependent onrainfall.
INTRODUCTION
DURING the last century, the world civilization has undergone a change from the manual labour
based ‘Agriculture Society’ to the technology/capital/labour based ‘Industrial Society’ and then to‘Information Society’, where connectivity and softwareproducts were the critical factors that drove theeconomy of many nations to greater heights. A newconcept of ‘Knowledge Society’ is now emergingwhere knowledge is the primary production resourceinstead of capital and labour. Effective utilisation anddissemination of knowledge can create comprehensivewealth for the nations and can improve the quality oflife - in the form of better health, education,infrastructure and other social indicators. Ability tocreate and maintain the knowledge infrastructure,develop knowledge workers and enhance theirproductivity through creation, growth and exploitationof new knowledge will be the key factors in decidingthe prosperity of this Knowledge Society.
Rural empowerment depends on the extent ofavailable connectivity, which has four components.‘Physical Connectivity’ can be improved by providingmore roads in rural areas, ‘Electronic Connectivity’ byproviding reliable communication network and‘Knowledge Connectivity’ by establishing moreprofessional institutions and vocational training centers.
INVITED PAPER
272 IETE TECHNICAL REVIEW, Vol 24, No 4, July-August 2007
In order to improve rural economy, agriculture hasto be run as an agri-business rather than for meresubsistence. This needs re-educating the farmer oncrop cultural practices for high yield with minimumexpenditure. Hence, innovative improvements are theneed of the hour. The rural economy can be boosted ifvillagers have access to the following Facilities/Services:
Capacity Building– Education– Health– Land distribution, Title and other Grievance
Redressal etc.
Income Generation– Agriculture– Entrepreneurship– Outsourcing
Enabling Services– Finance– Markets (exchanges /trading)– e-Governance– Water Management– Energy– Communications and Transportation
Since most of these services can be extendedthrough ECT, it can be effectively utilized to leveragerural income. At the basic level, CommunicationFacilities reduce the need for physical movement ofpeople, which in turn results in the saving of cost, time,effort and energy. ECT itself will not work wonders,but it will open up people, especially the young, to newideas and new worlds. Computers connected throughECT will make people learn new skills, which could beharnessed in a myriad of different areas.
For example, farmers could use ECT to getcommodity prices faster, or get information on newagricultural techniques. The youth would get details onjob opportunities across the state. The districtadministration could get details of problems in nearreal-time. The eligible could search for matrimonialmatches across adjacent villages. The voters wouldcommunicate their concerns to the politicians andbureaucrats electronically. The village officials couldshare governance best practices faster among theircounterparts elsewhere.
If access to the following facilities is made availablethrough ECT, preferably with local language interfaces,it will certainly improve the quality of life of the poorrural communities:
1. Information on Market Prices, CroppingPattern, Weather Forecast, AgricultureMarketing (getting better prices for produce),
2. e-Governance: Access to all Forms, Copiesof Land Records, Applications, Certificates,Grievance Redressal etc.
3. Collection of bills: Electricity, Telephone, andHouse-Tax etc.
4. e-Commerce: Insurance, e-Banking etc.5. Telemedicine, e-Learning.
The farmer needs a complete end-to-end solutionfrom pre-plantation consulting to post harvest storageand sales. He needs timely information on variousinputs like seeds, fertilisers, pesticides, farmmachinery and financing opportunities. He also needstimely solutions to irrigation risks like production risk(crop disease), rainfall risk and market risk (pricerisk). In addition, he also needs complete informationon market trends, harvest storage procedures andfacilities, and transportation means. ECT can beeffectively used in addressing all these aspects. Forexample, risk of crop disease can be managed by useof video conferencing to connect the farmer to anagricultural expert and obtaining the answers before itis too late.
e-Governance mechanism ensures speedy serviceto the people under one roof for all their governmentrelated service requirements. It is addressed withelectronic connectivity between the various state andcentral Government Departments and their respectivedatabases with real time updated data exchange forfully committed and transparent administration. Withthis, all forms and applications are made available foronline submission for speedier processing. Access toland records can also be made available and copiesof required records can be obtained online. In addition,any required certificates from Govt Departments canalso be obtained online. Similarly, these services canalso be extended for online bill payments in respect ofelectricity, telephone, and house-tax, insurance etc.Access to e-Commerce simplifies the bankingtransactions including loan sanctions and repayments.
With telemedicine, rural PHCs equipped with ECTfacilities may obtain timely treatment and remedialadvices for any advanced or abnormal deceases. Amoderately learned technician or a doctor can interactwith the specialist by forwarding the symptoms of thedecease and the condition of the patient to getappropriate medical advice for proper treatment. Expertadvice for moving the patient to appropriate high levelmedical centers and suggestions on the vacancy positionin various nearby hospitals may also be obtained
interactively online. This will be more helpful for timelyaction under emergency conditions such as epidemicoutbreaks or natural disasters.
With e-Learning, normal schools can be turnedinto hi-tech ones with online e-lessons, to cope up withthe prevailing low teacher/student ratio of the order of1:58 at primary level in rural regions of India. It canalso be used for imparting high-level computer educationto rural students. e-Learning ensures equal opportunityto students as it presents the same content and standardto all, irrespective of their physical location.
The brighter side of India
India is the world’s largest democracy and the10th largest industrial power, with solid and consistenteconomic growth. It has the third largest scientific andtechnical workforce with its engineers holding toppositions in computer corporations all over the world.In agriculture, India is the highest producer of sugar,groundnuts, tea & fruits and is the number two inproduction of rice, wheat, vegetables and milk.
India has also recorded tremendous growth incommunication infrastructure. It presently holds a mobilephone customer base of about 100 million and landlinecustomer base of about 40 million. The explosion ofInternet has also had its impact over India, which isevident from the whooping demand for Broadband &Dial-up Internet connections. The current Internetcustomer base of about 10 million is expected to touch20 million by the year 2010. All this advancement hasbeen possible with the right use of Electronics andCommunication Technology.
The Darker side of India
Like in many other countries, unfortunately inIndia too, ECT has been concentrated in the urbanpockets, leading to a clear digital-division between theurban and rural population. Since timely access tonews and information makes remarkable difference inpromoting trade, education, employment, health andwealth, this “digital divide” threatens to exacerbatewide gaps between the rich and the poor.
With about 70 per cent of Indian population residingin rural areas characterized by grinding poverty andsocial injustice, it is not possible to build a strong nationwithout extending the fruits of the advances intechnology, in particular the ‘Information &Communication Technology’, to the rural masses.Unfortunately, the rural populations mostly comprisingof uneducated peasants and artisans are not able tomake use of these technologies to their advantage.
The literacy rate in rural India is only about 50 per centas against 85 per cent in urban areas. India has 192million illiterate women (mainly concentrated in ruralareas) that represent nearly one-third of all illiteratewomen in the world.
With regard to child education, even though theEighty-sixth Constitution Amendment Act makes freeand compulsory education for children between theage group of 6 to 14 years as a fundamental right, theirdesperate economic conditions force the poor ruralchildren to toil often in subhuman conditions, deprivingthem of their most basic rights as children, i.e., educationand a joyful childhood. It is pitiable to note that Indiahas the largest number of child workers in the world.As per a case filed in Supreme Court last year, thereare 100 million working children in India, nearly half ofIndia’s child population.
Social impact of the ‘Digital Divide’
The following scenario illustrates how rural youthwith little or no ICT skills can be marginalized in thejob market:
There are kids in village schools who do noteven receive their textbooks on time whiletheir counterparts in urban schools have allthe necessary resources to send e-mails andsurf the Internet for supplementary informationfor school projects. Without any doubt, allthese children will be queuing up foremployment in the near future and mostprobably the ones who lack familiarity andskills in ICT will be sidelined. Childreneverywhere have the same levels of curiosity.They can learn at the same quick pace oftheir city brethren. For these children, theavailability of computer and Internet servicesmade all the difference.
This type of marginalisation from themainstream and frustration of the vernaculareducated youth due to unequal opportunitiesoften lead to violent youth insurrections andcivil wars. Thus, for the overall prosperity ofany nation, creation of equal opportunities isof prime importance.
These circumstances lend to large-scaleexploitation of rural poor even by moderately wisebusinessman. Rural illiteracy often makes them fallprey for the dominant landlords and other financiers invillages. Since village administrations (Panchayats)are normally in the hands of influential few, it is likelythat the benefits of the government sponsored programs
R SREEHARI RAO : BUILDING A STRONG NATION 273
274 IETE TECHNICAL REVIEW, Vol 24, No 4, July-August 2007
and schemes aimed at economic development andsocial justice will not reach the innocent poor. Theyremain powerless, locked in an oppressive system ofeconomic exploitation, class division, caste prejudiceand pervasive corruption. While the economy of modernIndia grows, the rural people lack access to education,nutrition and health care, sanitation, land and otherassets that could otherwise enable them to escapefrom the trap of poverty. As a result the poor remainpoor and the rich grow richer.
It is said that if a society cannot help the manywho are poor, it cannot save the few who are rich.This means, the nation as a whole cannot flourishwithout involving the larger rural population. On theother hand, the rural populations do not have thenecessary awareness, skills and facilities of ICT tocontribute to their own development. Schools withbest infrastructure, teachers who love teaching, primaryhealth centres, silos for storage of products and marketsfor promoting cottage industries and business,employment opportunities for artisans are some of theelements of PURA. Therefore, we should plan topromote rural prosperity by focusing on the informationand knowledge-led rural economy.
THE SOLUTION
One sustainable solution to this situation is toreduce poverty by bridging the digital divide throughthe process of ‘e-Learning’ among rural masses, aimedat simultaneously imparting education and information.With the current PC density of only about 4.6 per1,000 people and a telephone density of about 32 per1,000 people, India needs to do a lot (to increasepenetration of PCs and communication lines) for anye-Learning project to be successful. The high cost ofownership and higher tariff levels are preventingproliferation of this technology in rural areas. Thoughwireless connectivity could be considered as a costeffective method to bridge the “digital divide”, the factthat the bids for licenses under different telecom circlesfailed to attract investment in rural circles clearlyindicates the lack of interest of the telecom providersto cater to low volume and low paying users.
Under these circumstances, the state will have tostep in and either provide additional incentives to themarket or cater to the needs as a publicly fundedinitiative. The government may also involve corporatesector to come forward to fund such initiatives byluring them with tax concessions.
Internet kiosks and community information centersare to be planned with the involvement of NGOs thathave a strong presence in Rural India and which can
play an intermediary role with regard to empowermentand capacity building. The governments also need topromote access to education and health care throughdistance learning and telemedicine, preferably withlocal language interface. The rural ICT requires specialefforts to create appropriate models for those whocan neither afford the Internet access nor have thelanguage capacity to understand the content. Oneexample of such model is the UNESCO’s ‘KothmaleCommunity Radio and Internet programme’ running incentral Sri Lanka.
Radio Web Browsing
The Kothmale Community Radio stationbroadcasts a daily ‘Radio Browsing the Internet’programmes, and in this programme, thebroadcasters, supported by resource personnel,browse the Internet on-air together with theirlisteners and discuss and contextualise informationin local language.
The radio programme thus contributes to raiseawareness about the Internet in a participatorymanner - the listeners request the broadcastersto surf the WEB on their behalf and theprogramme transmits information in response totheir requests. This information is explained andcontextualised with the help of the studio guests,for example: a local doctor may explain data on ahealth website.
A kiosk is a multi-point service delivery channel ina village for delivering the government and otherservices to villagers through ICT. The kiosk is equippedwith equipment like a computer, a digital camera and aphoto printer. The kiosk operator provides differentkinds of services to villagers like computer education,computer lending, printing, copying, fax, telephone,digital photos, insurance and other Internet-basedservices. In addition, the kiosk also offers electronicdelivery of all government services to the people atnominal charges with convenience of local availability.
Involvement of Self Help Groups (SHGs) mayalso be considered as the answer for the transparentdelivery of a host of government schemes, educationand credit extension. In such a case the ICT basedvillage knowledge centres (internet kiosks) will beorganized and managed by the SHGs. The SHGs mayin turn identify some rural women and impart themspecial training to run the kiosks.
THE PRESENT STATUS IN INDIA
The Indian government, on its part, has taken
significant steps towards dissemination of informationthrough a number of e-Learning projects, not only forrural students but also for the community at large.
The ‘social development projects’ provide informalIT training to the rural illiterate masses. They focus ongenerating network of information centres, employmentand investment opportunities in rural areas. Examplesare akshaya, aqua choupal, gramin gyan kendra(village knowledge center), etc.
The ‘community information services projects’are aimed at the people who have the minimum requiredknowledge. They have been designed to disseminateinformation on rural farm-gate price realization, cuttransaction costs, supply of high quality farm inputsetc. Examples are: e-Choupal and PlantersNet, etc.
Finally the ‘school based curriculum projects’ impartcomputer education to rural students. Examples areSchoolNet India, Uttaranchal’s Aarohi etc.
In addition to government, a number of ICT projectsare being sponsored by corporate sector. The mostnotable among them are e-Choupal, i-Shakti, and e-sagu etc. Today, they lead a silent revolution thatempowers farmers with relevant information to maketheir lives better.
ITC’s e-Choupal web portal brings real-timeinformation on weather forecasts and customizedknowledge on better farming practices to the farmers’doorstep to improve his crop management. ITC’s e-Choupal supply chain brings good quality farm inputsat competitive prices to increase his farm yields.
HLL’s i-Shakti provides information and servicesto the farmers through a portal, which has contentspertaining to a variety of rural issues. It enables farmersto have solutions to pest problems and it also enablesrural women by providing a sustainable micro enterpriseopportunity to improve their living standards throughhealth and hygiene awareness.
e-sagu has a three-tier system consisting of farmersas end users. The agricultural scientists with knowledgesystem prepare farm advices. Coordinators asintermediaries forward crop status through digitalphotographs and text to Scientists and communicatetheir advice to the farmers.
Indian Institute of Technology (IIT)-Bombay andits partners sponsor the web site called aAqua.org toprovide farmers with relevant demand-driven farmingknowledge.
Govt of Andhra Pradesh has pioneered inintroducing e-Governance under the name ‘Rajeev
Internet Village’ by use of Information andCommunication Technology. Under this program shortnamed ‘RajIV’, it is committed to provide goodgovernance and revitalize the rural economy forintegrated and sustained growth, to empower commonman in the rural parts of the State to access allgovernment, local-body and e-commerce services inan integrated manner in order to create better meansof livelihood and improve the quality of life. Currentlymore than 150 services are provided under this scheme.
Contributions of Defence Research andDevelopment Organisation (DRDO) - inElectronics and Communications
Based on technologies from DLRL (DefenceElectronics Research Laboratory), Hyderabad, ConvoyJammers for VIP protection are being developed.Any explosive devices planted nearby the roads onwhich vehicles travel can be deactivated by theseJammer Systems. Technologies are also available withregard to Low Power and High Power Cell phoneJammers. These can be used to thwart the efforts ofterrorists who operate their destruction methodologyby using cell phones. Muting systems are developedfor Safety of Convoys of VIPs against RemotelyControlled Improvised Explosive Devices.
Antennas Developed by the laboratory can beused for different civilian communication systems. Avariant of Pulse Doppler Radar, developed can beused for monitoring over speeding vehicles.
DEAL (Defence Electronics ApplicationsLaboratory), Dehra Dun, contributes to Developmentof Satellite Communication Systems. In the last decadeby making use of Mobile S Band ‘Sat Com’ terminal,during floods in Orissa, the disaster management wassuccessfully undertaken.
MM (Millimeter wave) imaging technologydeveloped in DEAL will be useful for identification ofany armaments, if any, concealed in the clothes ofpersons.
Based on the technologies developed in CAIR(Center of Artificial Intelligence and Robotics),Bangalore, Robotics realized can be used for handlingNuclear Materials.
“Light Weight Battery Powered Radar (BFSR -Battle field surveillance Radar) can be used forsurveillance .of large industrial and other civilinstallations to detect intruders up to the low distanceof around 2 km. Even a crawling man can be detectedby utilizing this system. Targets such as a crawling
R SREEHARI RAO : BUILDING A STRONG NATION 275
276 IETE TECHNICAL REVIEW, Vol 24, No 4, July-August 2007
man, walking man, group of walking men, and movinglight vehicles can be properly distinguished by thisBFSR.
‘Radar Data Processing Technology’ utilizing thestate-of-the-art processors (similar to power PCs)and very efficient algorithm finds its applications inautomatic tracking of Multiple Targets in Air TrafficControl Scenario.
Technologies Developed by LRDE (ElectronicResearch and Development Establishment), Bangalore,resulted in “Terminal Based ATC Radars”. In thiscase, 3D Medium Surveillance Radar System can beupgraded with specific Radar Data Processing forimproved and efficient handling of larger Air Traffic.The Radar Networking Station can be utilized to interlink various ATC Radars to extend the Air Surveillancecoverage to regulate Civil Air Traffic. Transfer ofRadar Air Pictures through appropriate advancedDigital Data Link will enable melting shore based and
off-shore Radar Installations.
CONCLUSION
As we are crossing the information society andleading to knowledge society, irrespective of rural orurban area, distance will be shortened using ECT.Removal of poverty calls for improving the quality oflife in rural places to the extent of ‘Providing Urbanamenities in Rural Areas’ (PURA). Once thisproposition comes true, it may prompt for reversemigration, i.e., instead of village population coming tourban area, the urban population may come back tovillages. Such instances are becoming more commonin the developed countries, mainly due to the increasing‘work from home’ culture. It helps to reduce theurban congestion prevalent today in most of the metrocities. Such an ideal situation will lead to more uniformdistribution of people, resources, facilities andopportunities.
R Sreehari Rao took over asDirector,Defence Electronics ResearchLaboratory (DLRL), Hyderabad witheffect from 01 Nov 2005. He obtainedhis BE (Electronics and CommunicationEngineering) from College of Engineering,Kakinada in 1972, MTech (Microwave& Radar Engineering) from IIT,Kharagpur in 1974, and PhD from IIT,Madras in 1995. Dr Rao joined DLRL asSSO-II in 1974 and served the organization in various levels.
In the last three decades, Dr R Sreehari Rao has madesignificant contributions to the indigenous Design andDevelopment of Broad band Antennas, Microwave componentsand systems for all three services i.e. Navy, Army and Air force.
Author
These systems were productionized and inducted into services.In view of indigenous R&D efforts of DLRL, many productionagencies were established in the country to cater the needs ofservices. A strong indigenous technology base has been establishedin this field. He has successfully planned, steered and executed anumber of Airborne, Ship-borne and Ground based projects andprogrammes. Because of indigenous efforts DLRL is in a strongposition to meet present as well as future requirements of allthree services avoiding perpetual dependence on foreign sources.He has been honoured with many commendation and awardstowards his praiseworthy contributions in various programmes.He has authored 66 technical reports and published severalarticles in National and International Journals. He is a fellow ofIETE.
* * *
277
Paper No 124-A; Copyright © 2007 by the IETE.
IETE Technical ReviewVol 24, No 4, July-August 2007, pp 277-286
Satellite Technology Utilization forRural and Urban India
S PAL, DFIETE
Out Standing Scientist/ Program Director, SATNAV, Deputy Director,ISRO Satellite Centre, Airport Road, Bangalore-560 017, India.
email: [email protected]
AND
V S RAO, FIETE
Group Head, Communication System Group, ISRO Satellite Centre,Airport Road, Bangalore 560 017, India.
email: [email protected]
Communication capabilities in various forms provided by the modern spacecraft arebridging the gap between modernized cities and backward rural villages. The remote sensingsatellites are equally helping rural India by providing useful information to increase farmyield, fish catching and also helping to save lot of lives by disaster warning and weatherforecasting. This paper describes the utilization of the satellite technology in various formsfor Indian masses particularly rural India.
cripple very often. Satellites come to the rescue insuch events for disaster management, which requiresreal time decision making and action.
The introduction of space communication and thepresent era of information technology has changedthe current scenario and we have seen the thirdtechnological revolution (information + communication= Information Technology) in the last decade of thelast century. The present era is called the IT era. Thetechnological evolutions which have taken place inthe last century are simply beyond one’s imagination.Many technological reversals have been seen, likethe telephone which should have been on the wirednetwork has become wireless while the TV whichwas wireless, works on cable.
Many individual spheres of working have becomealmost universal, like education has come to the drawingroom from school and colleges, sectors like banking,medicines, hospitals etc which were location specificare available on net.
With the development of space technology, timeand distance have lost their conventional meaning,thereby permitting men and women all over the worldto share their experiences, frustrations and successeswith great ease. Sophisticated and expensive medicaltreatment has been made reachable to thoseunderprivileged society living in inaccessible parts of
INTRODUCTION
THE society having a better and quicker means ofcommunications is considered to be an advanced
and forward looking society. Most of our country’spopulation in the past was not served by the telephoneand television networks that so greatly influence citiesand western societies. There is a great influence ofpresent day fast evolving technologies particularly thedigital techniques on the development of the society. Itincludes present day computers and SatelliteCommunication. Present day technological tools supportand complement each other to complete the totalcommunication scenario. Satellites are perceived largelyas a means to reach isolated places. Because of thebroadcasting nature of the satellites, a signal sent up tothe satellite comes down everywhere over a widearea, thus providing connectivity to the inaccessibleparts of the country. Satellites bring the television tothe homes even in remote villages. Television is anextremely powerful medium for education, literacyrate in rural areas can be improved through tele-education services based on satellite technology. Beinga tropical country with long coast line, natural disastersoften knock at the country and the rural people areoften the victims. Terrestrial links and transport systems
INVITED PAPER

278 IETE TECHNICAL REVIEW, Vol 24, No 4, July-August 2007
India through telemedicine project conceived withsatellite technology. In a nutshell, the present dayworld has become a global village and thereby we arein a shrinking globe and expanding universe. There istremendous convergence and fusion ofcommunications, computers and associated technologyin the present era. Space communication technologytakes all this technological advancement to the ruralareas which are backbone of Indian democracy.
DESCRIPTION
As we become increasingly networked, our worldwill grow smaller and bigger simultaneously.Communication is at the root of the progress of everysociety. Society is often described as essentially peoplein communication.
The conventional communication tools are:
¨ Telegraphy using copper wire line¨ Telephony using copper wire line¨ Television¨ News papers, books, etc.¨ Means of Transport
All these have undergone tremendous changes andthe new technologies emerged are
¨ Mobile Satellite Telephone - PersonalCommunication Systems
¨ INFOSAT (information satellite)¨ A major shift from analogue to digital domain¨ An increase in the value of software as
opposed to hardware content¨ Extension of optical technology towards the
local loop coupled with increasing use of opticalswitches and optical processing
¨ Use of wireless in access technology - Newaccess & Modulation codes
¨ Ultra broad band services¨ Extensive use of spread spectrum and code
division multiple access techniques.Services planned / in existence are:
¨ Virtual Private Networks¨ PCS - Personal Communication Services¨ Call Collect Services¨ Desk top Video conferencing¨ Card Phone Services¨ Tele-shopping¨ Video Telephone¨ Tele-health
¨ Tele-education¨ Interactive Video & Video on demand¨ Multimedia transmission / reception¨ e-mail¨ e-Governance¨ e-commerce¨ Global positioning/timing system along with
SATNAV¨ Digital TV, Direct TV to Home.
Most Important - The Internet & World WideWeb
All these need either terrestrial or satellite channelsto serve the user. The present day scenario can bebest summarized by Fig 1. Here space communicationbecomes an important tool irrespective of the largegrowth in terrestrial communication networksparticularly when the technology is to be taken to ruralIndia.
Space Communication is provided by satellites invarious orbits. Satellites have been put in to all theseorbits and successful communication links have beenestablished. It will be a matter of large discussion ifone starts explaining the pros & cons of the orbits &their satellites. Satellite communication started withfixed services and expanded to greatest potentialapplications in the mobile and broad cast services.Satellites have innate advantage that make them anattractive alternative or complement to terrestrialbroadband circuits. Satellite communication providesreliable means of providing information or monitoringinaccessible areas even in the case of severe cyclonesand disasters and when the entire terrestrial networkfails. The conventional services provided by satellitesare: Telephony/TV Broadcasting/Data reception anddistribution/Direct Television broadcasting/Disasterwarning/Continuous weather monitoring/SpacecraftVehicle Tracking and Commanding/ Inter satellite links/Mail /Internet/Data mining, Position (GPS) and timedetermination / Moving motor vehicle tracking etc.
Mobile Personal Communications
Most of the time technological advancements havetaken place due to defense requirements. However inthe area of communications where more than themilitary requirements, it is the business requirementswhich have given a big flip to the overall scenario ofcommunication and ushered us from fixed copperwire communication era to the era of mobilecommunication - meaning an individual (stationary or
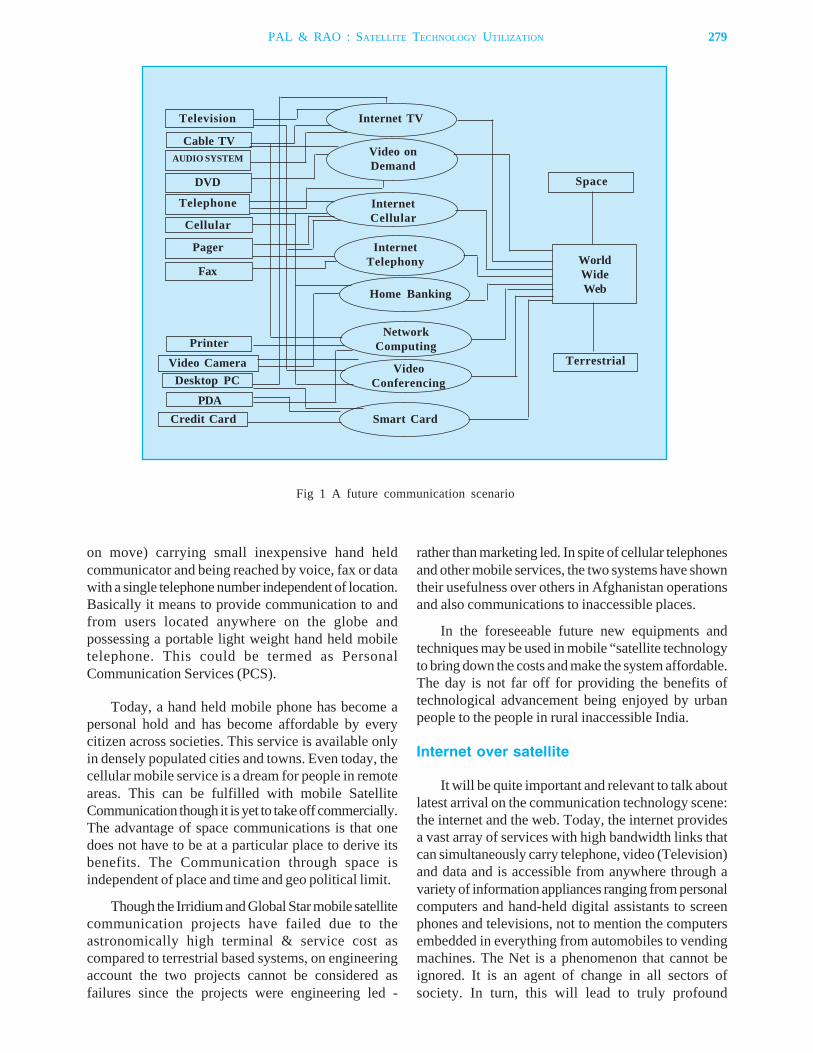
on move) carrying small inexpensive hand heldcommunicator and being reached by voice, fax or datawith a single telephone number independent of location.Basically it means to provide communication to andfrom users located anywhere on the globe andpossessing a portable light weight hand held mobiletelephone. This could be termed as PersonalCommunication Services (PCS).
Today, a hand held mobile phone has become apersonal hold and has become affordable by everycitizen across societies. This service is available onlyin densely populated cities and towns. Even today, thecellular mobile service is a dream for people in remoteareas. This can be fulfilled with mobile SatelliteCommunication though it is yet to take off commercially.The advantage of space communications is that onedoes not have to be at a particular place to derive itsbenefits. The Communication through space isindependent of place and time and geo political limit.
Though the Irridium and Global Star mobile satellitecommunication projects have failed due to theastronomically high terminal & service cost ascompared to terrestrial based systems, on engineeringaccount the two projects cannot be considered asfailures since the projects were engineering led -
rather than marketing led. In spite of cellular telephonesand other mobile services, the two systems have showntheir usefulness over others in Afghanistan operationsand also communications to inaccessible places.
In the foreseeable future new equipments andtechniques may be used in mobile “satellite technologyto bring down the costs and make the system affordable.The day is not far off for providing the benefits oftechnological advancement being enjoyed by urbanpeople to the people in rural inaccessible India.
Internet over satellite
It will be quite important and relevant to talk aboutlatest arrival on the communication technology scene:the internet and the web. Today, the internet providesa vast array of services with high bandwidth links thatcan simultaneously carry telephone, video (Television)and data and is accessible from anywhere through avariety of information appliances ranging from personalcomputers and hand-held digital assistants to screenphones and televisions, not to mention the computersembedded in everything from automobiles to vendingmachines. The Net is a phenomenon that cannot beignored. It is an agent of change in all sectors ofsociety. In turn, this will lead to truly profound
Fig 1 A future communication scenario
Television
Cable TVAUDIO SYSTEM
DVD
Telephone
Cellular
Pager
Fax
PrinterVideo Camera
Desktop PC
PDACredit Card
Space
WorldWideWeb
Terrestrial
Internet TV
Video onDemand
InternetCellular
InternetTelephony
Home Banking
NetworkComputing
VideoConferencing
Smart Card
PAL & RAO : SATELLITE TECHNOLOGY UTILIZATION 279
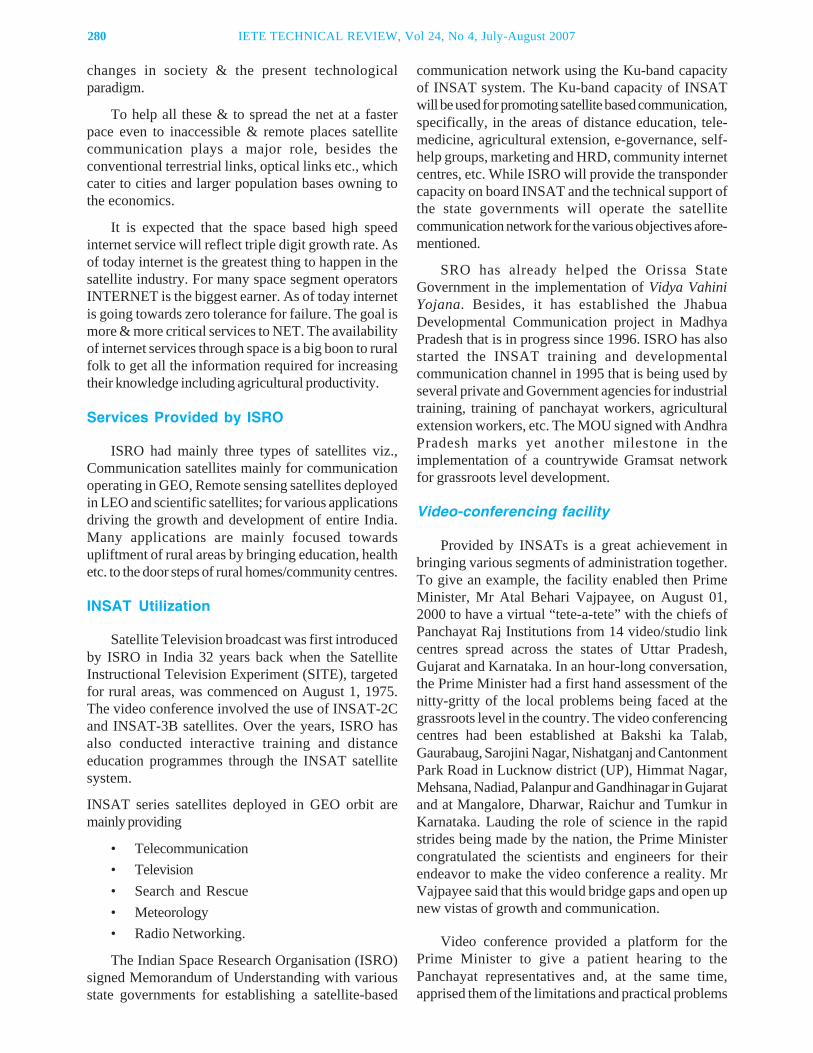
280 IETE TECHNICAL REVIEW, Vol 24, No 4, July-August 2007
changes in society & the present technologicalparadigm.
To help all these & to spread the net at a fasterpace even to inaccessible & remote places satellitecommunication plays a major role, besides theconventional terrestrial links, optical links etc., whichcater to cities and larger population bases owning tothe economics.
It is expected that the space based high speedinternet service will reflect triple digit growth rate. Asof today internet is the greatest thing to happen in thesatellite industry. For many space segment operatorsINTERNET is the biggest earner. As of today internetis going towards zero tolerance for failure. The goal ismore & more critical services to NET. The availabilityof internet services through space is a big boon to ruralfolk to get all the information required for increasingtheir knowledge including agricultural productivity.
Services Provided by ISRO
ISRO had mainly three types of satellites viz.,Communication satellites mainly for communicationoperating in GEO, Remote sensing satellites deployedin LEO and scientific satellites; for various applicationsdriving the growth and development of entire India.Many applications are mainly focused towardsupliftment of rural areas by bringing education, healthetc. to the door steps of rural homes/community centres.
INSAT Utilization
Satellite Television broadcast was first introducedby ISRO in India 32 years back when the SatelliteInstructional Television Experiment (SITE), targetedfor rural areas, was commenced on August 1, 1975.The video conference involved the use of INSAT-2Cand INSAT-3B satellites. Over the years, ISRO hasalso conducted interactive training and distanceeducation programmes through the INSAT satellitesystem.
INSAT series satellites deployed in GEO orbit aremainly providing
• Telecommunication• Television• Search and Rescue• Meteorology• Radio Networking.
The Indian Space Research Organisation (ISRO)signed Memorandum of Understanding with variousstate governments for establishing a satellite-based
communication network using the Ku-band capacityof INSAT system. The Ku-band capacity of INSATwill be used for promoting satellite based communication,specifically, in the areas of distance education, tele-medicine, agricultural extension, e-governance, self-help groups, marketing and HRD, community internetcentres, etc. While ISRO will provide the transpondercapacity on board INSAT and the technical support ofthe state governments will operate the satellitecommunication network for the various objectives afore-mentioned.
SRO has already helped the Orissa StateGovernment in the implementation of Vidya VahiniYojana. Besides, it has established the JhabuaDevelopmental Communication project in MadhyaPradesh that is in progress since 1996. ISRO has alsostarted the INSAT training and developmentalcommunication channel in 1995 that is being used byseveral private and Government agencies for industrialtraining, training of panchayat workers, agriculturalextension workers, etc. The MOU signed with AndhraPradesh marks yet another milestone in theimplementation of a countrywide Gramsat networkfor grassroots level development.
Video-conferencing facility
Provided by INSATs is a great achievement inbringing various segments of administration together.To give an example, the facility enabled then PrimeMinister, Mr Atal Behari Vajpayee, on August 01,2000 to have a virtual “tete-a-tete” with the chiefs ofPanchayat Raj Institutions from 14 video/studio linkcentres spread across the states of Uttar Pradesh,Gujarat and Karnataka. In an hour-long conversation,the Prime Minister had a first hand assessment of thenitty-gritty of the local problems being faced at thegrassroots level in the country. The video conferencingcentres had been established at Bakshi ka Talab,Gaurabaug, Sarojini Nagar, Nishatganj and CantonmentPark Road in Lucknow district (UP), Himmat Nagar,Mehsana, Nadiad, Palanpur and Gandhinagar in Gujaratand at Mangalore, Dharwar, Raichur and Tumkur inKarnataka. Lauding the role of science in the rapidstrides being made by the nation, the Prime Ministercongratulated the scientists and engineers for theirendeavor to make the video conference a reality. MrVajpayee said that this would bridge gaps and open upnew vistas of growth and communication.
Video conference provided a platform for thePrime Minister to give a patient hearing to thePanchayat representatives and, at the same time,apprised them of the limitations and practical problems
faced by the government at times and to discuss vastarray of issues viz., specific problems faced bypanchayat institutions like education, water shortage,and irrigation.
Tele-medicine
The advances and convergence of IT andtelecommunication can bring the entire health careservices to the patient’s doorstep. Tele-medicine isdelivery of health care information across distancesusing telecom technology. This includes transfer ofimages like X-rays, CT, MRI, ECG, etc from patientto expert doctors seamlessly, apart from the live videoconferencing between the patient at remote hospitalwith the specialists at the super speciality hospital fortele-consultation and treatment.
ISRO has been spearheading satellite based tele-medicine programme in the country with remote districthospitals connected to Super Specialty Hospitals inmajor cities using INSAT satellite (Fig 2).
The advantage of tele-medicine in reaching out tothe rural and remote population has been wellestablished through the experience of this presenttelemedicine network. However, there is a need to
provide a common platform to all concerned agencieslike communication systems/software and medicalequipment providers, super-specialty hospitals,healthcare administrators, various departments ofGovernment, trust and private hospitals, NGOs andcorporate hospitals dealing with healthcare both inIndia and abroad. It will also help to exchange ideas,practices and methodology to effectively implementand use the emerging telemedicine technology
In the field of tele-medicine, the first pilot projectwas started in Andhra Pradesh in 2000 connectingApollo Hospitals at Chennai and Aragonda village andISRO’s hospital at Satish Dhawan Space Centre,SHAR, Sriharikota, in Nellore District. The tele-medicine network is extended to more hospitals.
DTH-TV Broadcasting
Common entertainment today is through Television.Television broadcasted by satellites enabled everycitizen in all parts of the country to have the benefits.DTH - TV broadcasting comes under BSS(Broadcasting services) as well as under FSS (FixedSatellite Services). Under FSS services it is from pointto multipoint but whose location is known while underBSS it is always in universal broadcast mode. With
Fig 2 Telemedicine via satellite
PAL & RAO : SATELLITE TECHNOLOGY UTILIZATION 281
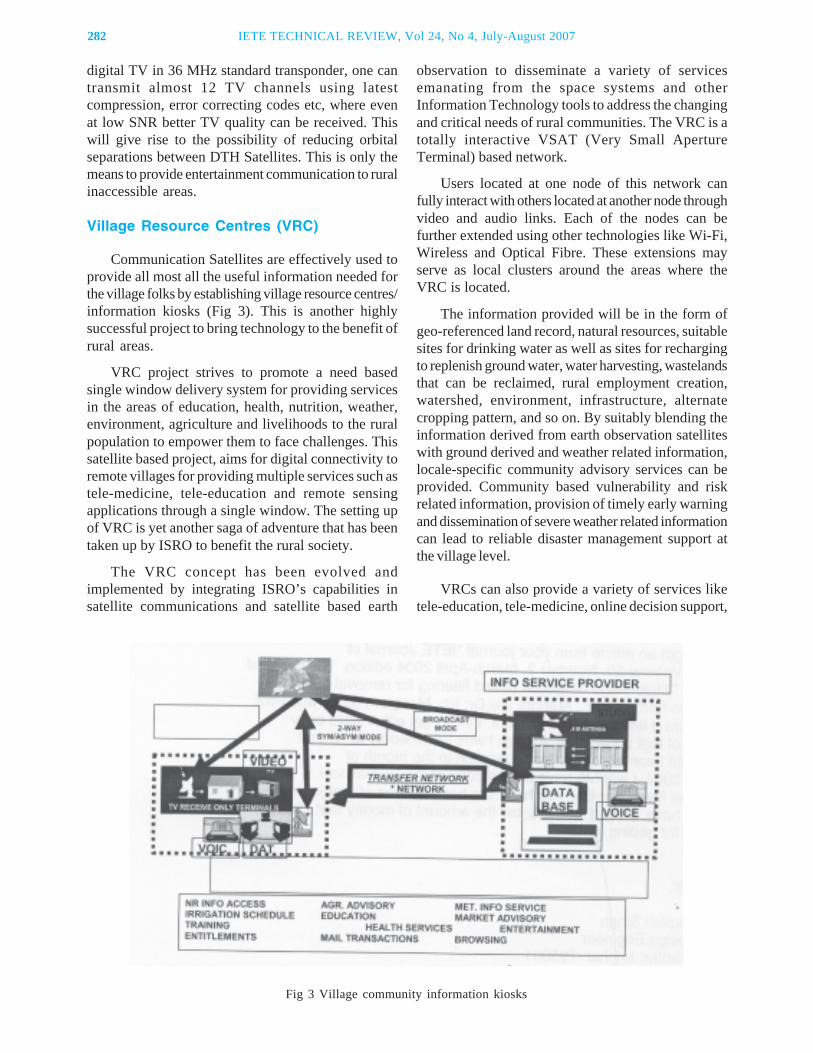
282 IETE TECHNICAL REVIEW, Vol 24, No 4, July-August 2007
digital TV in 36 MHz standard transponder, one cantransmit almost 12 TV channels using latestcompression, error correcting codes etc, where evenat low SNR better TV quality can be received. Thiswill give rise to the possibility of reducing orbitalseparations between DTH Satellites. This is only themeans to provide entertainment communication to ruralinaccessible areas.
Village Resource Centres (VRC)
Communication Satellites are effectively used toprovide all most all the useful information needed forthe village folks by establishing village resource centres/information kiosks (Fig 3). This is another highlysuccessful project to bring technology to the benefit ofrural areas.
VRC project strives to promote a need basedsingle window delivery system for providing servicesin the areas of education, health, nutrition, weather,environment, agriculture and livelihoods to the ruralpopulation to empower them to face challenges. Thissatellite based project, aims for digital connectivity toremote villages for providing multiple services such astele-medicine, tele-education and remote sensingapplications through a single window. The setting upof VRC is yet another saga of adventure that has beentaken up by ISRO to benefit the rural society.
The VRC concept has been evolved andimplemented by integrating ISRO’s capabilities insatellite communications and satellite based earth
observation to disseminate a variety of servicesemanating from the space systems and otherInformation Technology tools to address the changingand critical needs of rural communities. The VRC is atotally interactive VSAT (Very Small ApertureTerminal) based network.
Users located at one node of this network canfully interact with others located at another node throughvideo and audio links. Each of the nodes can befurther extended using other technologies like Wi-Fi,Wireless and Optical Fibre. These extensions mayserve as local clusters around the areas where theVRC is located.
The information provided will be in the form ofgeo-referenced land record, natural resources, suitablesites for drinking water as well as sites for rechargingto replenish ground water, water harvesting, wastelandsthat can be reclaimed, rural employment creation,watershed, environment, infrastructure, alternatecropping pattern, and so on. By suitably blending theinformation derived from earth observation satelliteswith ground derived and weather related information,locale-specific community advisory services can beprovided. Community based vulnerability and riskrelated information, provision of timely early warningand dissemination of severe weather related informationcan lead to reliable disaster management support atthe village level.
VRCs can also provide a variety of services liketele-education, tele-medicine, online decision support,
Fig 3 Village community information kiosks
interactive farmers’ advisory services, tele-fishery, e-governance services, weather services and watermanagement. By providing tele-education services,the VRCs act as virtual community centric learningcentres. At the same time, VRCs will provideconnectivity to speciality hospitals thus bringing theservices of expert doctors closer to the villages.
In addition, VRCs will facilitate access to spatialinformation on important subjects like land use/landcover, soil and ground water prospects which canenable the farmers to get support in taking importantdecisions based on their query. Besides, VRCs willenable online interaction between the local farmersand agricultural scientists. Fishermen can obtaininformation on sea state and wave heights. Provisionof information on many governmental schemes,location and farming system specific action plansbased on weather, community specific advice on soiland water conservation are the other services renderedby VRCs.
Search & Rescue
The search and rescue facility provided by satellitesis a breakthrough in technology in ensuring safety andproviding support in case of disasters/accidents to thetourists, fishermen etc.
Meteorology
All the first generation INSATs and INSAT-2A,2B and 2E in the second generation in the operationalINSAT system were configured for multi purposemission with transponders for telecommunication &broadcasting and Meteorological payloads. To meetthe demanding requirements of Indian MeteorologicalDepartment’s, ISRO launched a satellite with dedicatedmeteorological payloads - Very High ResolutionRadiometer (VHRR) and Data Relay Transponder(DRT), and is named as Kalpana-1 after launch in thememory of Late (Ms) Kalpana Chawla, Indian bornAmerican Astronaut.
Very High Resolution Radiometer (VHRR) is athree band VHRR capable of imaging the earth inthree spectral bands namely Visible (VIS), WaterVapor (WV) and Thermal Infra Red (TIR), to provideboth day and night coverage.
The weather data relay transponder (DRT) receives402.75 MHz signals from unattended weather datacollection platforms, translates them to 4506.05 MHzand retransmits it to a central facility - MeteorologicalData Utilization Centre, IMD, Delhi. This data is being
used along with the VHRR imageries for weatherforecasting.
Satellite derived products data are increasinglyused in conjunction with conventional meteorologicalobservations in the synoptic analysis and conventionalweather forecasts to extract information of relevanceto various sectors in India. The impact of satellite datais phenomenal in certain areas of meteorologicalapplications such as thunderstorm forecasts, TropicalCyclone monitoring, aviation forecasts etc. The majorapplication of satellite data has been the monitoring ofSynoptic weather systems ranging from thunderstorms,fog detection to cyclones and planetary scalephenomena such as monsoon.
Synoptic applications of satellite imagery are inuse at Indian Meteorological Department. Followingsatellite data products are derived from Kalpana-1and the same are also archived and displayed on IMDwebsite daily.
• Earth cloud imagery in visible, IR bands andwater vapor every hour on black & white andcolor.
• Clouds Motion vectors over Bay of Bengal,Arbian Sea and Indian Ocean at 00, 07, 12and 1 8 UTC and being disseminated overGTS.
• Outgoing long wave radiation (OLR) on daily/weekly/monthly basis at 0600UTC.
• Sea surface Temperature (SSTs) at 0600 UTCis being derived over Bay of Bengal, ArabianSea and Indian Ocean.
• Quantitative Precipitation Estimates (QPE)on daily/weekly/monthly basis.
Satellite bulletins based on 3 hourly / 1 hourlyKalpana-1 cloud imageries are prepared and transmittedto all the forecasting offices on Global Telecom Service(GTS) through RTH, New Delhi. Satellite imageriesand animations are also put on the IMD website onregular basis for the users and public. Heavy rainfalladvisory, bulletins are also transmitted regularly forIMD forecasting offices and other centres daily. Duringthe tropical cyclones in Arabian Sea and Bay ofBengal hourly special satellite bulletins with intensityand position are also issued for all the users by thesatellite Div., IMD.
During winter season, fog formation is one of themost important weather events over northern parts ofIndia which affects the aviation badly. The Kalpana-1imageries are regularly utilized for capturing suchevents.
PAL & RAO : SATELLITE TECHNOLOGY UTILIZATION 283

284 IETE TECHNICAL REVIEW, Vol 24, No 4, July-August 2007
IRS utilization
Remote Sensing satellites launched and operatedby ISRO are highly successful in providing vitalinformation regarding earth resources and also inproviding cartographic maps for town planning anddevelopment.
Data from Indian Remote Sensing Satellite is usedfor various applications of resources survey andmanagement under the National Natural ResourcesManagement System (NNRMS).
• Preharvest crop acreage and productionestimation of major crops.
• Drought monitoring and assessment based onvegetation condition.
• Flood risk zone mapping and flood damageassessment.
• Hydro-geomorphological maps for locatingunderground water resources for drilling well.
• Irrigation command area status monitoring• Snow-melt run-off estimates for planning water
use in down stream projects• Land use and land cover mapping• Urban planning• Forest survey• Wetland mapping• Environmental impact analysis• Mineral Prospecting• Coastal studies• Integrated Mission for Sustainable
Development for generating locale-specificprescriptions for integrated land and waterresources development in 174 districts.
Many state governments are utilizing the remotesensing data for various applications including townplanning. For example, Andhra Pradesh has beenextensively using ISRO satellites for societalapplications. Andhra Pradesh is one of the foremost inthe utilisation of remote sensing technology formanagement of land and water resources and disastermanagement. Remote sensing technology is used forwatershed management in drought prone districts ofAdilabad, Ananthapur, Kurnool, Mahaboobnagar,Nizamabad and Ranga Reddy. Management plans formajor irrigation projects like Srirama Sagara andNagarjuna Sagara have been planned using remotesensing data. More than 35,000 bore wells have beendrilled using remote sensing data with better than 90percent success rate.
Oceansat
The 1050 kg satellite placed in a Polarsunsynchronous orbit of 720 km height. IRS-P4 carriedon board an Ocean Colour Monitor (OCM) and aMultifrequency Scanning Microwave Radiometer(MSMR).
OCM is a solid state camera operating in eightnarrow spectral bands. The camera is used to collectdata on chlorophyll concentration, detect and monitorphytoplankton blooms and obtain data on atmosphericaerosols and suspended sediments in the water.
The Microwave Scanning Radiometer (MSMR)which operates in four microwave frequencies both invertical and horizontal polarisation with its all weathercapaility is useful for measuring sea surface temperatureand meteorological parameters like Sea SurfaceTemperature (SST), Atmospheric water vapor andSea surface winds.
The Oceansat data helped fisherman to a greatextent in locating fish concentration in the sea and inincreasing the fish produce. The satellite data alsohelped to study the ocean behaviour and to providesafety guidelines and precautions to fisherman, diversand navy to a great extent.
INFOSAT
The future Telecommunication spacecrafts willbe developed from transmission in to InformationSatellites (INFOSAT). They will be given many of theproperties of terrestrial telephone exchanges and signalprocessing equipments and it will be possible to integratethem directly into future global networks. They willthus permit immediate applications of many existingand future services. Because of their inherent built upflexibility, these satellites will be able to support andspeed up the initial experimental phase of many newservices before their trial on terrestrial networks. Thesetype of satellites will enable new services to be triedout over a large area before being put in to the marketand optimally adapted to suit the most appropriatetransmission medium.
The future INFOSATS will be of three types:National / Regional, International & Relay.
Future technologies will enable the construction ofan INFOSAT network in which the above three willbe connected to each other. The onboard processorswill ensure that the signals to be exchanged betweenthe satellite and the terrestrial subscribers are combinedusing Time Division and Space Division multiplexing
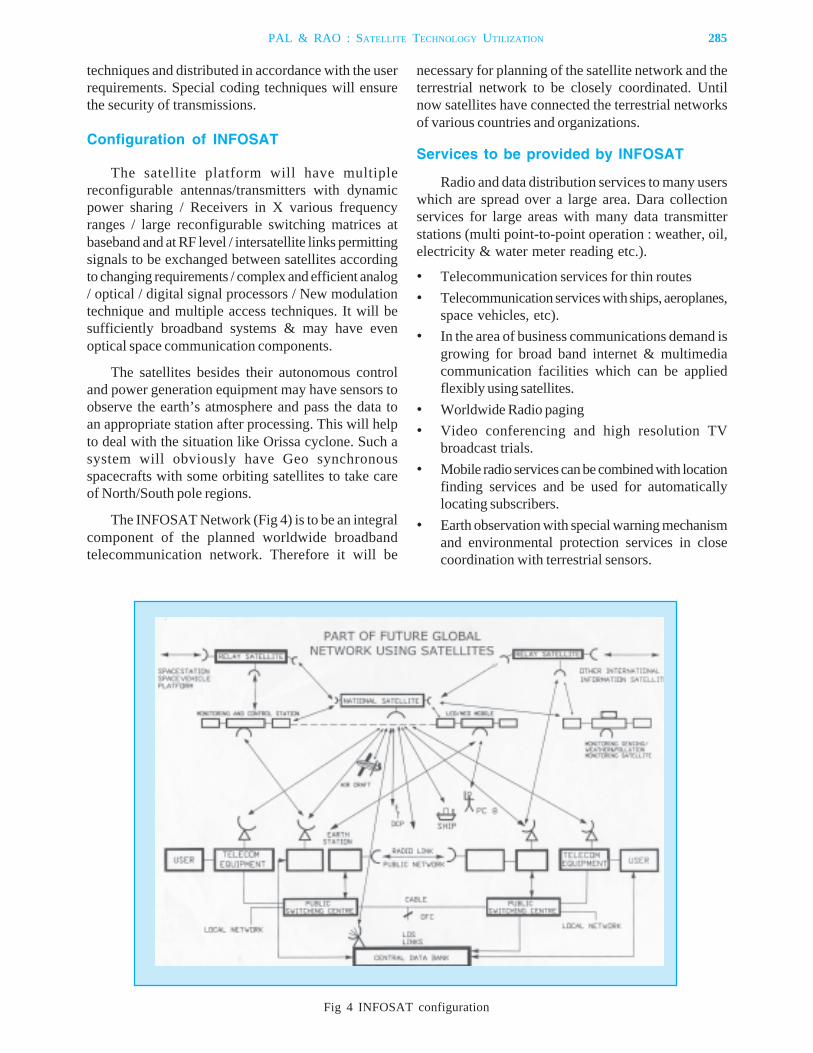
techniques and distributed in accordance with the userrequirements. Special coding techniques will ensurethe security of transmissions.
Configuration of INFOSAT
The satellite platform will have multiplereconfigurable antennas/transmitters with dynamicpower sharing / Receivers in X various frequencyranges / large reconfigurable switching matrices atbaseband and at RF level / intersatellite links permittingsignals to be exchanged between satellites accordingto changing requirements / complex and efficient analog/ optical / digital signal processors / New modulationtechnique and multiple access techniques. It will besufficiently broadband systems & may have evenoptical space communication components.
The satellites besides their autonomous controland power generation equipment may have sensors toobserve the earth’s atmosphere and pass the data toan appropriate station after processing. This will helpto deal with the situation like Orissa cyclone. Such asystem will obviously have Geo synchronousspacecrafts with some orbiting satellites to take careof North/South pole regions.
The INFOSAT Network (Fig 4) is to be an integralcomponent of the planned worldwide broadbandtelecommunication network. Therefore it will be
necessary for planning of the satellite network and theterrestrial network to be closely coordinated. Untilnow satellites have connected the terrestrial networksof various countries and organizations.
Services to be provided by INFOSAT
Radio and data distribution services to many userswhich are spread over a large area. Dara collectionservices for large areas with many data transmitterstations (multi point-to-point operation : weather, oil,electricity & water meter reading etc.).
• Telecommunication services for thin routes• Telecommunication services with ships, aeroplanes,
space vehicles, etc).• In the area of business communications demand is
growing for broad band internet & multimediacommunication facilities which can be appliedflexibly using satellites.
• Worldwide Radio paging• Video conferencing and high resolution TV
broadcast trials.• Mobile radio services can be combined with location
finding services and be used for automaticallylocating subscribers.
• Earth observation with special warning mechanismand environmental protection services in closecoordination with terrestrial sensors.
Fig 4 INFOSAT configuration
PAL & RAO : SATELLITE TECHNOLOGY UTILIZATION 285
286 IETE TECHNICAL REVIEW, Vol 24, No 4, July-August 2007
By integrating INFOSAT into terrestrial network,it will be possible to supply all the subscribers of afuture global network with all essential information.This will make the location of the user quite irrelevant.
CONCLUSION
There is a great influence of present day fastevolving technologies particularly the digital techniqueson the development of the society. Satellite technologybridges the gap between urban and rural areas inutilizing the technologies. Inspite of advancement oftechnology to a great extent, many parts of India arestill backward and inaccessible by terrestrial means.
Satellite technology connects total country irrespectiveof location. This paper briefed about the servicesprovided by satellites to bring the cutting edgetechnology and benefits to the rural and inaccessiblearea.
REFERENCES
1. Surendra Pal, Advanced Satellite CommunicationTechnology-A Perspective, Journal of SpacecraftTechnology, vol 12, no 2, July 2002.
2. Lectures by the author Surendra Pal on SatelliteCommunication and various studies carried out inthe area.
S Pal an alumnus of Birla Instituteof Technology & Science (BITS), Pilaniand Indian Institute of Science (IISc),Bangalore is presently OutstandingScientist & Deputy Director (Digital &Communication Area) and also ProgramDirector, Satellite Navigation Programat ISRO Satellite Centre, Bangalore.
He joined Indian Space ResearchOrganization (ISRO) in 1971, after a brief tenure at TIFR. DrPal is responsible for starting Antenna & Microwave activitiesin the ISRO Satellite Centre at the inception. He has beenresponsible for the development & fabrication of all spacecraftrelated telecommunication systems for India’s all satellites startingwith Aryabhata to present day IRS & INSAT series of spacecraft.He has been consultant to: (i) INMARSAT/ICO (UK) forLEOSAT definitions, responsible for the development of SatelliteHand Held Telephone Antenna System for ICO (UK)(ii) International Telecommunication Union (ITU) for definingRegional African Satellite Communication System and(iii) Nanyang Technolgical University, Singapore on X-Sat. Hewas also Chairman of Information Infrastructure Working Groupof Ministry of Information Technology. Presently he is spearheading the Indian Satellite Based Wide Area AugmentationSystem – GAGAN (GPS Aided Geo Augmented NavigationSystem) and Indian Satellite Navigation activities for civil aviationapplications.
He is also on the United Nations panel of experts on GlobalNavigation Satellite Systems (GNSS).
Dr Pal a Distinguished Fellow of IETE, Fellow of IndianNational Academy of Engineering, Indian National Academy ofSciences, Fellow, IEEE(USA), MAMTA(USA), MASI and hasreceived more than a dozen awards, including, PerformanceExcellence Award by ISRO, Distinguished Achievement Awardfor launching Aryabhatta, Hari Om Ashram-Vikram SarabhaiAward, IETE Ramlal Wadhawa & Hari Ramji Toshniwal Awards,Om Prakash Bhasin Award, four NRDC awards and IEEE Third
Authors
Millennium Medal for various developments, inventions andoverall contributions towards the growth of communication andspace technology in India. Besides these he holds Indian,European & International patents for his various inventions.
Dr Pal has published more than 170 papers in internationaland national journals of repute , one book on communications &guided PhD students. He has been on the editorial board ofvarious technical journals. He is a Distinguished Visiting Professorof Indian National Academy of Engineering. His fields of interestare Space Communications, Information Technology,Electromagnetics, Antennas and Satellite Navigation.
Dr Pal has been closely associated with IETE and servedIETE in various capacities. He was also a Council Member forseven years. He was instrumental in starting IETE researchboard activities. He has also been guest editor of many IETETechnical Review issues on Antenna and Microwaves.
* * *
V Sambasiva Rao obtained BE(Electronics and CommunicationEngineering) from College of Engineering,Kakinada, (Andhra University) in 1973.He joined ISRO Satellite Centre,Bangalore in 1974 and presently, headingCommunication Systems Group. He isresponsible for the development of highbit rate data transmitters for all IRSsatellites and various RF and microwavesystems for IRS and INSAT missions.
Shri Rao is a fellow of IETE and received DistinguishedAchievement Award for launching Aryabhatta, NRDC award1994 for the development of X-band high bit rate QPSK Modulatorand IETE-IRSI (83) award 2006. He has published more than 30technical papers in national and international journals.
* * *
287
Paper No 125-D; Copyright © 2007 by the IETE.
IETE Technical ReviewVol 24, No 4, July-August 2007, pp 287-311
A Programmable Built-in Self-Test forEmbedded Memory Cores
SHIBAJI BANERJEE, DIPANWITA ROY CHOWDHURY
Department of Computer Science and Engineering, Indian Institute of Technology,Kharagpur 721 302, India.
AND
BHARGAB B BHATTACHARYA
Advanced Computing and Microelectronics Unit, Indian Statistical Institute,203, BT Road, Kolkata 700 108, India.
email: [email protected]; [email protected]; [email protected]
A memory test algorithm for detecting neighborhood pattern sensitive faults (NPSFs),including static NPSF (SNPSF), passive NPSF (PNPSF) and active NPSF (ANPSF), is proposedin this paper. The patterns can also detect all the traditional faults present in the memoryarray such as stuck-at faults (SAFs), transition faults (TFs), coupling faults (CFs) and addressdecoder faults. Next, a programmable BIST architecture is designed. The BIST circuit allowsthe users to select a vast variety of test algorithms based on their choice. The single BISTcircuit is capable of testing different types of memory cores embedded in SOC. The proposedBIST circuit is shared among the different memory cores in an SOC. For this purpose, testwrappers for the shared BIST circuits and the memory cores are designed. Finally, a testscheduling algorithm is developed to reduce the overall test time.
issue in managing the BIST circuit, along with testactivation, response collection, and analysis. It providesat-speed and high bandwidth access to the embeddedmemory cores. It needs only a low cost ATE toinitialize the tests and to analyze final results. Most ofthe previous works on memory BIST employed theMarch-based algorithms. Traditional March algorithms[5] have been widely used in memory testing becauseof their linear time complexity, high fault coverage,and ease in BIST implementation. However, for betterfault modeling, the Neighborhood Pattern SensitiveFaults (NPSFs) are preferred. The NPSFs are nowbecoming more and more important, especially forDRAMs. However, testing based on such a faultmodeling needs a large number of patterns. In addition,a complex architecture is required to deliver the testpatterns to the memory cells and to compare thecorresponding test responses. An efficient VLSI im-plementation is therefore, extremely important. Earlierapproaches to detect NPSFs include the tiling method[5, 6] and the two-group method [7]. These methodscan detect and locate all NPSFs, but suffer fromhaving a low fault coverage of stuck-at faults (SAFs),transition faults (TFs), coupling faults (CFs), andaddress decoder faults (AFs). Similarly, Marchalgorithms can detect and locate all SAFs, CFs, AFs,but fail to cover all NPSFs.
1. INTRODUCTION
THE continuous decline in cost per gate makesembedded memory cores more and more popular
for system-on-chip (SOC) designs. Memory on SOC,is growing rapidly in terms of size and density [1].However, embedded memories are subject to complexdesign rules and they are more prone to manufacturingdefects than any other embedded core in an SOC [2].Hence, testing of embedded memory is a real challengefor SOC design and production. For an SOC, theinability to have direct access to a core is one of themajor problems in testing and diagnosis. Further, theavailable bandwidth between the primary I/O pins ofthe system chip and the embedded core is usually verylimited. Thus, application of test patterns andobservation of corresponding test responses areconstrained by the bandwidth.
Built-in-self-test (BIST) is considered to be one ofthe most cost-effective solutions for embedded memorytesting [3, 4]. In a typical SOC, the embedded memorymay be a single-port SRAM, dual-port SRAM, n-read-m-write register files, DRAM, or flash memory.Therefore, test integration has become an important
INVITED PAPER
288 IETE TECHNICAL REVIEW, Vol 24, No 4, July-August 2007
Today, an SOC may contain more than 100memory cores. In order to reduce test cost and shortentime-to-market, testing time for these cores should beminimized by adopting an appropriate test accessarchitecture. However, power dissipation is becominga key challenge for the SOC. Therefore, powerconsumption of the embedded memory cores has tobe considered during SOC testing. In SOC testscheduling, multiple cores have been tested concurrentlywhile satisfying the power constraints during test.
To lower the BIST area overhead by implementingan efficient architecture, the main challenge lies infinding a solution, which also reduces the overall testingtime. The main contributions of this paper can besummarized as follows.
• Introduction of a memory test algorithm, whichcan detect all NPSFs, SFs, TFs, and CFspresent in the memory array.
• Implementation of a new programmablememory BIST. The proposed BIST moduleallows testing of memories for various faultmodels. A simple test pattern generator forNPSFs is implemented by employing the regularstructure of Cellular Automata (CA). Hence,the proposed BIST architecture provides avery simple and cost effective memory testsolution for handling various fault models. Thearea overhead due to proposed BIST is similarto that of the existing memory BISTs.
• Design of wrapper cells for the embeddedmemories, so that they can share a commonBIST circuit. Sharing of BIST by severalmemory cores reduces area overhead.
• Power-constrained test scheduling to reducethe overall testing time.
The rest of the paper is organized as follows. Insection 2, we discuss the related work on memoryBIST, different March algorithms, and theirimplementation. Section 3 presents the fault modelused to develop the proposed test algorithm. Thememory test algorithm is proposed in section 4. Theproposed programmable BIST circuit design and theshared BIST approach are described in section 5 andsection 6 respectively. Section 7 presents theexperimental results and finally section 8 concludesthe paper.
2. RELATED WORK
Recently, several approaches have been proposedfor designing of the BIST circuits. We can classifythese approaches into two categories, the dedicated
BIST module and shared BIST module. The dedicatedBIST module does not reuse the exiting on-chipresources for testing of embedded memories. Thededicated BIST can be classified into categories: FSM-based and micro-code based. The FSM based BISTcircuit [8-12] can generate a single simple pattern orcomplex suite of patterns. These types of BISTs aremainly used to generate a single pattern by adopting asuitable March algorithm. However, a series of patternsis required to obtain a better fault coverage. Thismakes the design of FSM complex. The FSM basedapproach requires large number of flip-flops toimplement the FSM. So, modifying the test algorithmsor memory architecture requires changing of the BISTdesign. Micro-code based BIST is a programmableBIST that also does not reuse the on-chip resourcesbut, it overcomes the previous limitations. These typesof BISTs are highly flexible for different test structures.They use a storage element to store the test algorithms.The micro-based BIST architecture can be found in[10,13,14]. In [13], authors used two operations perMarch element. However, this algorithm was not ableto detect NPSFs and CFs. In [14], authors proposed adiagnosis process in a much more efficient way.However, implementations of these architecturesrequire a certain amount of storage elements, whichleads to increase in the area overhead. In summary,an FSM-based programmable BIST circuit requiresless area overhead but provides relatively less flex-ibility, while a micro-code based BIST circuit providesmore flexibility but requires high area overhead.
On the other hand, the shared BIST approachreuses the on-chip resources, which result low areaoverhead. Since, a complex SOC usually contains oneor more processors (or microprocessors), reusing theseexisting on-chip processors for testing the embeddedmemories can lead to lower area overhead. But, reusinga processor as a BIST needs much more sophisticatedwrapper cells for both the embedded memories andprocessors. In [15], an on-chip microprocessor wasreused for testing the other cores in an SOC. Iteliminated the area overhead caused by dedicatedBIST hardware. In [16], authors developed an SOCtest solution, which includes both software andhardware based approaches. They introduced a newBIST approach, called hardware/software co-testingfor embedded memories. An embedded processor-based built-in self-repair (BISR) design for embeddedmemories was proposed in [17]. In [17], authorsremoved the controller a typical BISR by reusing theembedded processors. They also developed a memorywrapper for this purpose. In [18], a processor-basedBIST design for embedded DRAMs was proposed. In[18], the authors used two separate instruction storage
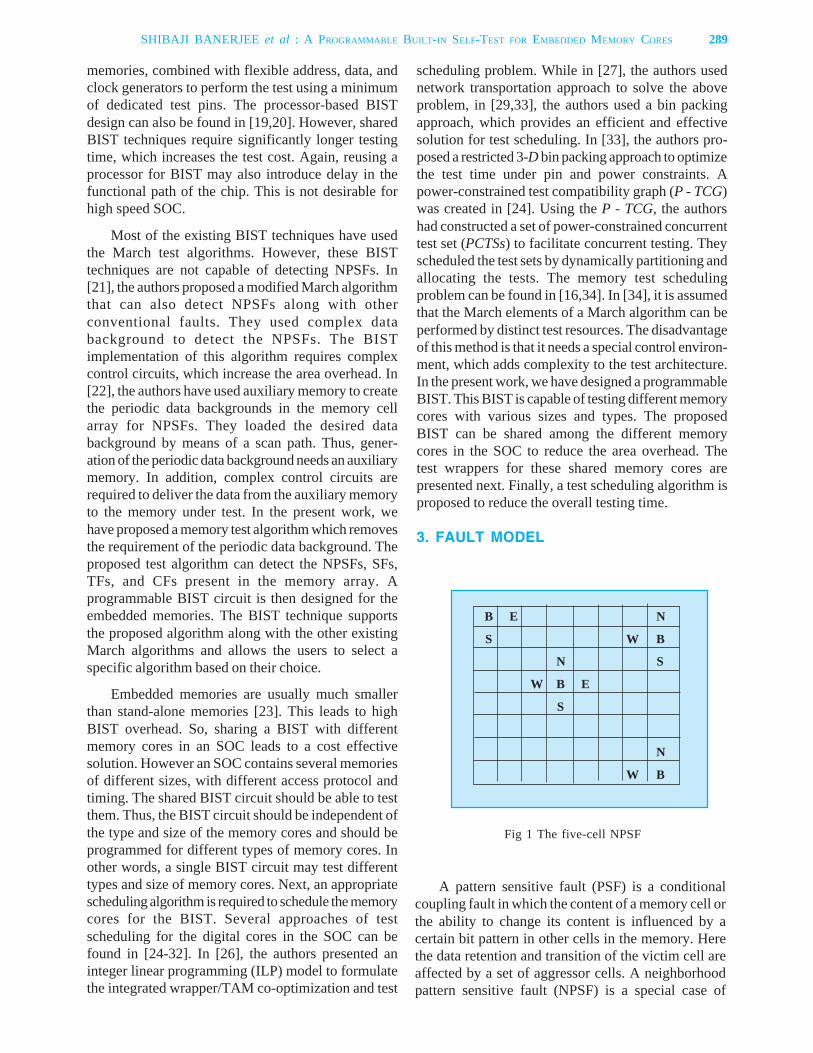
memories, combined with flexible address, data, andclock generators to perform the test using a minimumof dedicated test pins. The processor-based BISTdesign can also be found in [19,20]. However, sharedBIST techniques require significantly longer testingtime, which increases the test cost. Again, reusing aprocessor for BIST may also introduce delay in thefunctional path of the chip. This is not desirable forhigh speed SOC.
Most of the existing BIST techniques have usedthe March test algorithms. However, these BISTtechniques are not capable of detecting NPSFs. In[21], the authors proposed a modified March algorithmthat can also detect NPSFs along with otherconventional faults. They used complex databackground to detect the NPSFs. The BISTimplementation of this algorithm requires complexcontrol circuits, which increase the area overhead. In[22], the authors have used auxiliary memory to createthe periodic data backgrounds in the memory cellarray for NPSFs. They loaded the desired databackground by means of a scan path. Thus, gener-ation of the periodic data background needs an auxiliarymemory. In addition, complex control circuits arerequired to deliver the data from the auxiliary memoryto the memory under test. In the present work, wehave proposed a memory test algorithm which removesthe requirement of the periodic data background. Theproposed test algorithm can detect the NPSFs, SFs,TFs, and CFs present in the memory array. Aprogrammable BIST circuit is then designed for theembedded memories. The BIST technique supportsthe proposed algorithm along with the other existingMarch algorithms and allows the users to select aspecific algorithm based on their choice.
Embedded memories are usually much smallerthan stand-alone memories [23]. This leads to highBIST overhead. So, sharing a BIST with differentmemory cores in an SOC leads to a cost effectivesolution. However an SOC contains several memoriesof different sizes, with different access protocol andtiming. The shared BIST circuit should be able to testthem. Thus, the BIST circuit should be independent ofthe type and size of the memory cores and should beprogrammed for different types of memory cores. Inother words, a single BIST circuit may test differenttypes and size of memory cores. Next, an appropriatescheduling algorithm is required to schedule the memorycores for the BIST. Several approaches of testscheduling for the digital cores in the SOC can befound in [24-32]. In [26], the authors presented aninteger linear programming (ILP) model to formulatethe integrated wrapper/TAM co-optimization and test
scheduling problem. While in [27], the authors usednetwork transportation approach to solve the aboveproblem, in [29,33], the authors used a bin packingapproach, which provides an efficient and effectivesolution for test scheduling. In [33], the authors pro-posed a restricted 3-D bin packing approach to optimizethe test time under pin and power constraints. Apower-constrained test compatibility graph (P - TCG)was created in [24]. Using the P - TCG, the authorshad constructed a set of power-constrained concurrenttest set (PCTSs) to facilitate concurrent testing. Theyscheduled the test sets by dynamically partitioning andallocating the tests. The memory test schedulingproblem can be found in [16,34]. In [34], it is assumedthat the March elements of a March algorithm can beperformed by distinct test resources. The disadvantageof this method is that it needs a special control environ-ment, which adds complexity to the test architecture.In the present work, we have designed a programmableBIST. This BIST is capable of testing different memorycores with various sizes and types. The proposedBIST can be shared among the different memorycores in the SOC to reduce the area overhead. Thetest wrappers for these shared memory cores arepresented next. Finally, a test scheduling algorithm isproposed to reduce the overall testing time.
3. FAULT MODEL
A pattern sensitive fault (PSF) is a conditionalcoupling fault in which the content of a memory cell orthe ability to change its content is influenced by acertain bit pattern in other cells in the memory. Herethe data retention and transition of the victim cell areaffected by a set of aggressor cells. A neighborhoodpattern sensitive fault (NPSF) is a special case of
Fig 1 The five-cell NPSF
B E N
S W B
N S
W B E
S
N
W B
SHIBAJI BANERJEE et al : A PROGRAMMABLE BUILT-IN SELF-TEST FOR EMBEDDED MEMORY CORES 289
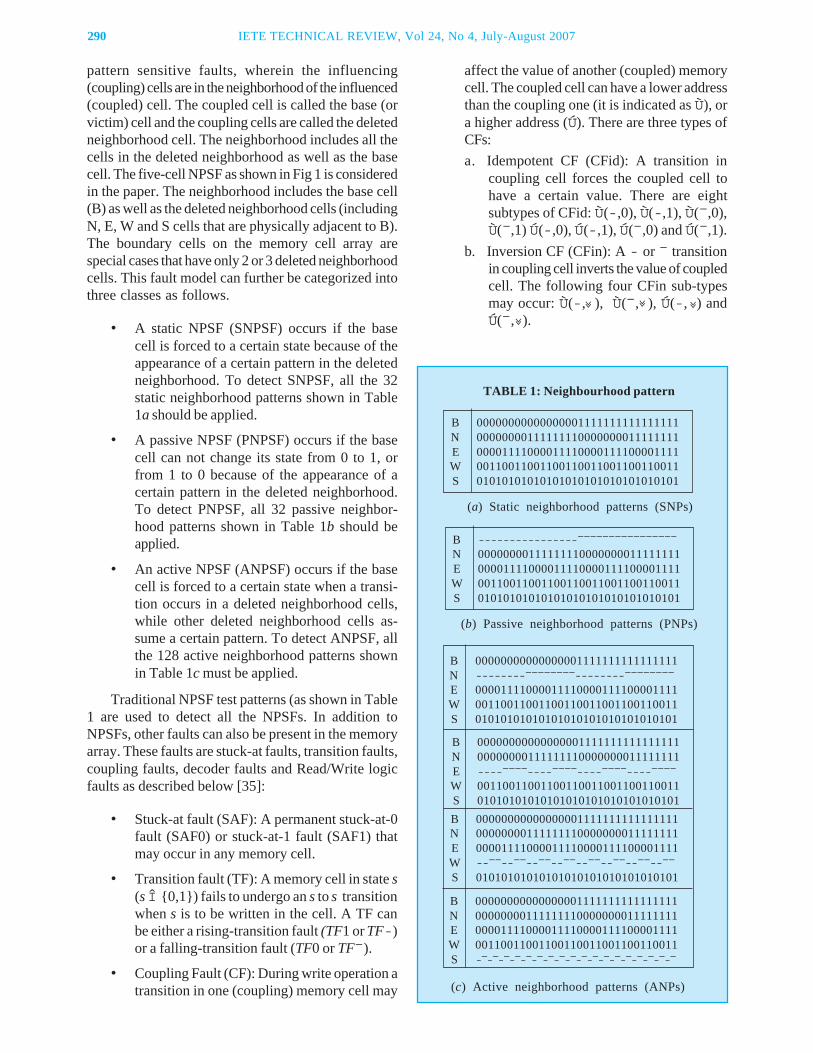
290 IETE TECHNICAL REVIEW, Vol 24, No 4, July-August 2007
pattern sensitive faults, wherein the influencing(coupling) cells are in the neighborhood of the influenced(coupled) cell. The coupled cell is called the base (orvictim) cell and the coupling cells are called the deletedneighborhood cell. The neighborhood includes all thecells in the deleted neighborhood as well as the basecell. The five-cell NPSF as shown in Fig 1 is consideredin the paper. The neighborhood includes the base cell(B) as well as the deleted neighborhood cells (includingN, E, W and S cells that are physically adjacent to B).The boundary cells on the memory cell array arespecial cases that have only 2 or 3 deleted neighborhoodcells. This fault model can further be categorized intothree classes as follows.
• A static NPSF (SNPSF) occurs if the basecell is forced to a certain state because of theappearance of a certain pattern in the deletedneighborhood. To detect SNPSF, all the 32static neighborhood patterns shown in Table1a should be applied.
• A passive NPSF (PNPSF) occurs if the basecell can not change its state from 0 to 1, orfrom 1 to 0 because of the appearance of acertain pattern in the deleted neighborhood.To detect PNPSF, all 32 passive neighbor-hood patterns shown in Table 1b should beapplied.
• An active NPSF (ANPSF) occurs if the basecell is forced to a certain state when a transi-tion occurs in a deleted neighborhood cells,while other deleted neighborhood cells as-sume a certain pattern. To detect ANPSF, allthe 128 active neighborhood patterns shownin Table 1c must be applied.
Traditional NPSF test patterns (as shown in Table1 are used to detect all the NPSFs. In addition toNPSFs, other faults can also be present in the memoryarray. These faults are stuck-at faults, transition faults,coupling faults, decoder faults and Read/Write logicfaults as described below [35]:
• Stuck-at fault (SAF): A permanent stuck-at-0fault (SAF0) or stuck-at-1 fault (SAF1) thatmay occur in any memory cell.
• Transition fault (TF): A memory cell in state s(s Î {0,1}) fails to undergo an s to s transitionwhen s is to be written in the cell. A TF canbe either a rising-transition fault (TF1 or TF-)or a falling-transition fault (TF0 or TF¯).
• Coupling Fault (CF): During write operation atransition in one (coupling) memory cell may
affect the value of another (coupled) memorycell. The coupled cell can have a lower addressthan the coupling one (it is indicated as Ù), ora higher address (Ú). There are three types ofCFs:a. Idempotent CF (CFid): A transition in
coupling cell forces the coupled cell tohave a certain value. There are eightsubtypes of CFid: Ù(-,0), Ù(-,1), Ù(¯,0),Ù(¯,1) Ú(-,0), Ú(-,1), Ú(¯,0) and Ú(¯,1).
b. Inversion CF (CFin): A - or ¯ transitionin coupling cell inverts the value of coupledcell. The following four CFin sub-typesmay occur: Ù(-, ), Ù(¯, ), Ú(-, ) andÚ(¯, ).
« « «
«
TABLE 1: Neighbourhood pattern
(b) Passive neighborhood patterns (PNPs)
(a) Static neighborhood patterns (SNPs)
(c) Active neighborhood patterns (ANPs)
B 00000000000000001111111111111111N 00000000111111110000000011111111E 00001111000011110000111100001111W 00110011001100110011001100110011S 01010101010101010101010101010101
B ----------------¯¯¯¯¯¯¯¯¯¯¯¯¯¯¯¯N 00000000111111110000000011111111E 00001111000011110000111100001111W 00110011001100110011001100110011S 01010101010101010101010101010101
B 00000000000000001111111111111111N --------¯¯¯¯¯¯¯¯--------¯¯¯¯¯¯¯¯E 00001111000011110000111100001111W 00110011001100110011001100110011S 01010101010101010101010101010101
B 00000000000000001111111111111111N 00000000111111110000000011111111E ----¯¯¯¯----¯¯¯¯----¯¯¯¯----¯¯¯¯W 00110011001100110011001100110011S 01010101010101010101010101010101B 00000000000000001111111111111111N 00000000111111110000000011111111E 00001111000011110000111100001111W --¯¯--¯¯--¯¯--¯¯--¯¯--¯¯--¯¯--¯¯S 01010101010101010101010101010101
B 00000000000000001111111111111111N 00000000111111110000000011111111E 00001111000011110000111100001111W 00110011001100110011001100110011S - - - - - - - - - - - - - - - - - -
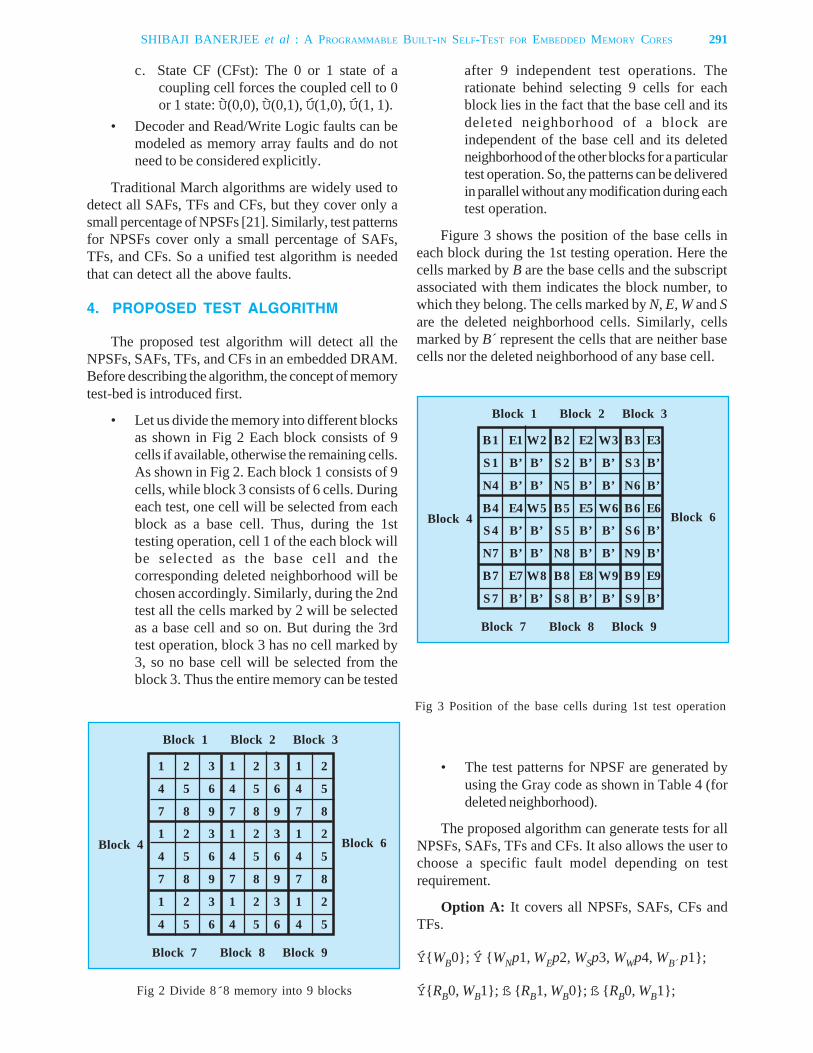
c. State CF (CFst): The 0 or 1 state of acoupling cell forces the coupled cell to 0or 1 state: Ù(0,0), Ù(0,1), Ú(1,0), Ú(1, 1).
• Decoder and Read/Write Logic faults can bemodeled as memory array faults and do notneed to be considered explicitly.
Traditional March algorithms are widely used todetect all SAFs, TFs and CFs, but they cover only asmall percentage of NPSFs [21]. Similarly, test patternsfor NPSFs cover only a small percentage of SAFs,TFs, and CFs. So a unified test algorithm is neededthat can detect all the above faults.
4. PROPOSED TEST ALGORITHM
The proposed test algorithm will detect all theNPSFs, SAFs, TFs, and CFs in an embedded DRAM.Before describing the algorithm, the concept of memorytest-bed is introduced first.
• Let us divide the memory into different blocksas shown in Fig 2 Each block consists of 9cells if available, otherwise the remaining cells.As shown in Fig 2. Each block 1 consists of 9cells, while block 3 consists of 6 cells. Duringeach test, one cell will be selected from eachblock as a base cell. Thus, during the 1sttesting operation, cell 1 of the each block willbe selected as the base cell and thecorresponding deleted neighborhood will bechosen accordingly. Similarly, during the 2ndtest all the cells marked by 2 will be selectedas a base cell and so on. But during the 3rdtest operation, block 3 has no cell marked by3, so no base cell will be selected from theblock 3. Thus the entire memory can be tested
after 9 independent test operations. Therationate behind selecting 9 cells for eachblock lies in the fact that the base cell and itsdeleted neighborhood of a block areindependent of the base cell and its deletedneighborhood of the other blocks for a particulartest operation. So, the patterns can be deliveredin parallel without any modification during eachtest operation.
Figure 3 shows the position of the base cells ineach block during the 1st testing operation. Here thecells marked by B are the base cells and the subscriptassociated with them indicates the block number, towhich they belong. The cells marked by N, E, W and Sare the deleted neighborhood cells. Similarly, cellsmarked by B´ represent the cells that are neither basecells nor the deleted neighborhood of any base cell.
• The test patterns for NPSF are generated byusing the Gray code as shown in Table 4 (fordeleted neighborhood).
The proposed algorithm can generate tests for allNPSFs, SAFs, TFs and CFs. It also allows the user tochoose a specific fault model depending on testrequirement.
Option A: It covers all NPSFs, SAFs, CFs andTFs.
Ý{WB0}; Ý {WNp1, WEp2, WSp3, WWp4, WB´ p1};
Ý{RB0, WB1}; ß {RB1, WB0}; ß {RB0, WB1};Fig 2 Divide 8´8 memory into 9 blocks
1 2 3 1 2 3 1 2
4 5 6 4 5 6 4 5
7 8 9 7 8 9 7 8
1 2 3 1 2 3 1 2
4 5 6 4 5 6 4 5
7 8 9 7 8 9 7 8
1 2 3 1 2 3 1 2
4 5 6 4 5 6 4 5
Block 1 Block 2 Block 3
Block 7 Block 8 Block 9
Block 4 Block 6
B1 E1 W2 B2 E2 W3 B3 E3
S 1 B’ B’ S 2 B’ B’ S 3 B’
N4 B’ B’ N5 B’ B’ N6 B’
B4 E4 W5 B5 E5 W6 B6 E6
S 4 B’ B’ S 5 B’ B’ S 6 B’
N7 B’ B’ N8 B’ B’ N9 B’
B7 E7 W8 B8 E8 W9 B9 E9
S 7 B’ B’ S 8 B’ B’ S 9 B’
Block 1 Block 2 Block 3
Block 7 Block 8 Block 9
Block 4 Block 6
Fig 3 Position of the base cells during 1st test operation
SHIBAJI BANERJEE et al : A PROGRAMMABLE BUILT-IN SELF-TEST FOR EMBEDDED MEMORY CORES 291
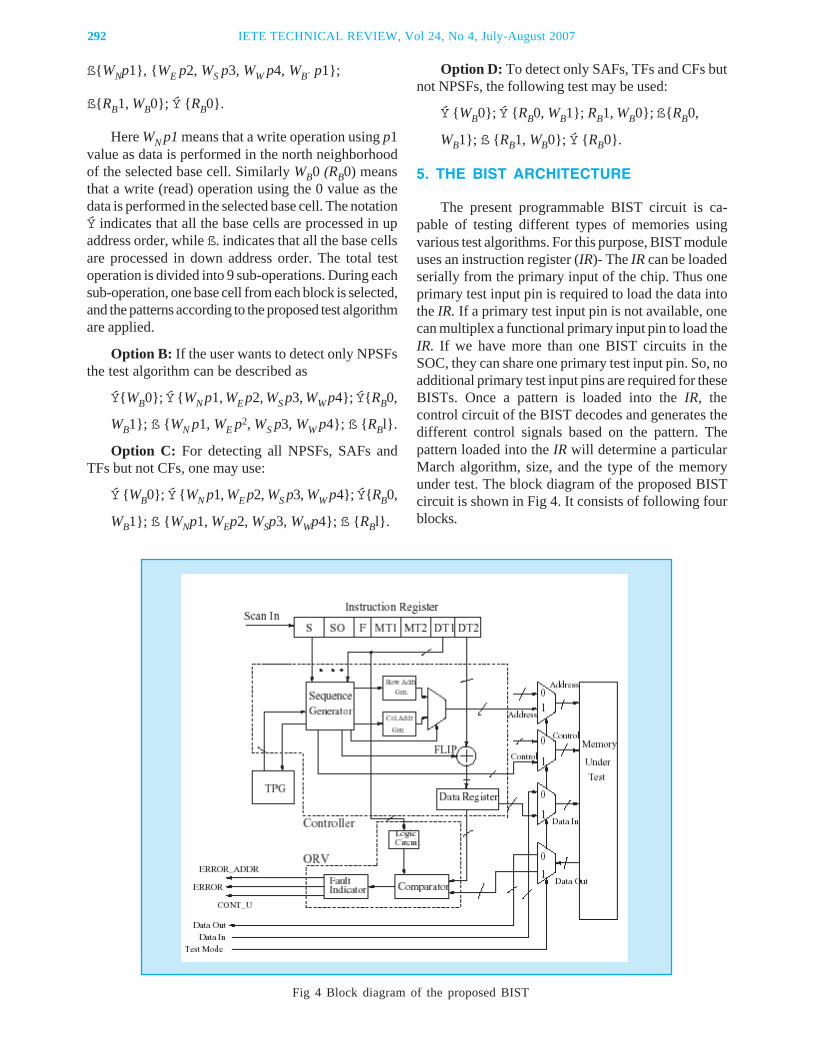
292 IETE TECHNICAL REVIEW, Vol 24, No 4, July-August 2007
ß{WNp1}, {WE p2, WS p3, WW p4, WB´ p1};
ß{RB1, WB0}; Ý {RB0}.
Here WN p1 means that a write operation using p1value as data is performed in the north neighborhoodof the selected base cell. Similarly WB0 (RB0) meansthat a write (read) operation using the 0 value as thedata is performed in the selected base cell. The notationÝ indicates that all the base cells are processed in upaddress order, while ß. indicates that all the base cellsare processed in down address order. The total testoperation is divided into 9 sub-operations. During eachsub-operation, one base cell from each block is selected,and the patterns according to the proposed test algorithmare applied.
Option B: If the user wants to detect only NPSFsthe test algorithm can be described as
Ý{WB0}; Ý {WN p1, WE p2, WS p3, WW p4}; Ý{RB0,
WB1}; ß {WN p1, WE p2, WS p3, WW p4}; ß {RBl}.
Option C: For detecting all NPSFs, SAFs andTFs but not CFs, one may use:
Ý {WB0}; Ý {WN p1, WE p2, WS p3, WW p4}; Ý{RB0,
WB1}; ß {WNp1, WEp2, WSp3, WWp4}; ß {RBl}.
Option D: To detect only SAFs, TFs and CFs butnot NPSFs, the following test may be used:
Ý {WB0}; Ý {RB0, WB1}; RB1, WB0}; ß{RB0,
WB1}; ß {RB1, WB0}; Ý {RB0}.
5. THE BIST ARCHITECTURE
The present programmable BIST circuit is ca-pable of testing different types of memories usingvarious test algorithms. For this purpose, BIST moduleuses an instruction register (IR)- The IR can be loadedserially from the primary input of the chip. Thus oneprimary test input pin is required to load the data intothe IR. If a primary test input pin is not available, onecan multiplex a functional primary input pin to load theIR. If we have more than one BIST circuits in theSOC, they can share one primary test input pin. So, noadditional primary test input pins are required for theseBISTs. Once a pattern is loaded into the IR, thecontrol circuit of the BIST decodes and generates thedifferent control signals based on the pattern. Thepattern loaded into the IR will determine a particularMarch algorithm, size, and the type of the memoryunder test. The block diagram of the proposed BISTcircuit is shown in Fig 4. It consists of following fourblocks.
Fig 4 Block diagram of the proposed BIST
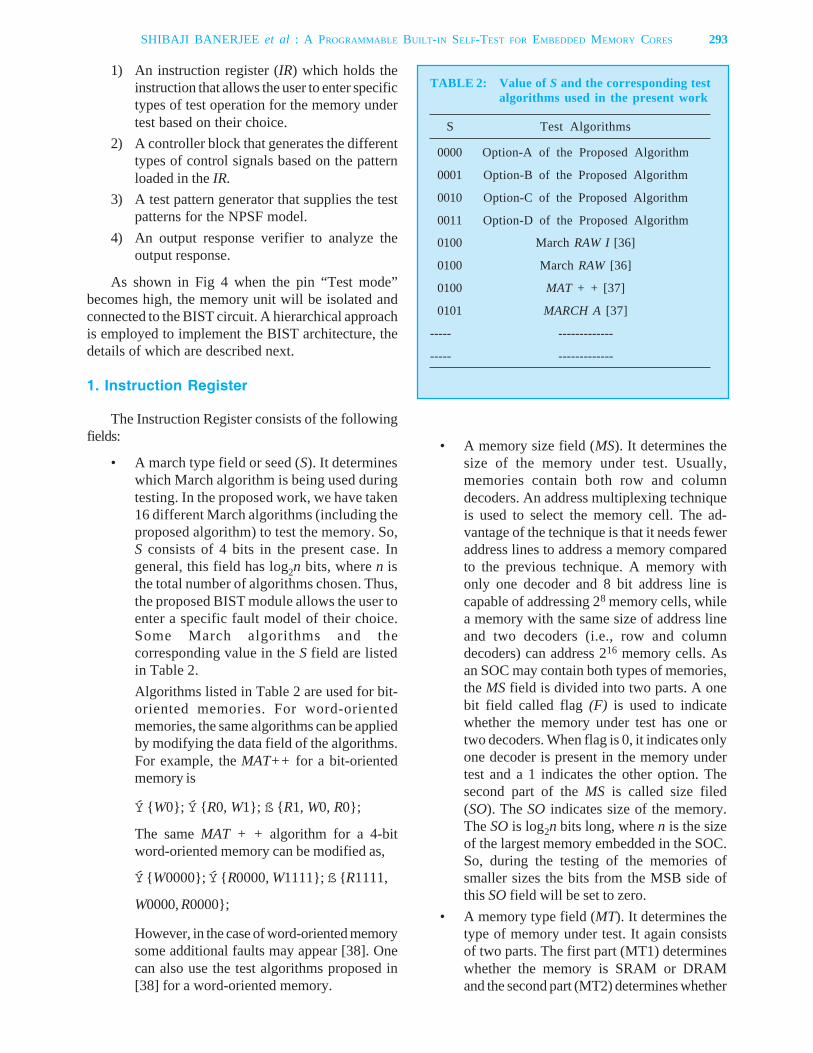
1) An instruction register (IR) which holds theinstruction that allows the user to enter specifictypes of test operation for the memory undertest based on their choice.
2) A controller block that generates the differenttypes of control signals based on the patternloaded in the IR.
3) A test pattern generator that supplies the testpatterns for the NPSF model.
4) An output response verifier to analyze theoutput response.
As shown in Fig 4 when the pin “Test mode”becomes high, the memory unit will be isolated andconnected to the BIST circuit. A hierarchical approachis employed to implement the BIST architecture, thedetails of which are described next.
1. Instruction Register
The Instruction Register consists of the followingfields:
• A march type field or seed (S). It determineswhich March algorithm is being used duringtesting. In the proposed work, we have taken16 different March algorithms (including theproposed algorithm) to test the memory. So,S consists of 4 bits in the present case. Ingeneral, this field has log2n bits, where n isthe total number of algorithms chosen. Thus,the proposed BIST module allows the user toenter a specific fault model of their choice.Some March algorithms and thecorresponding value in the S field are listedin Table 2.Algorithms listed in Table 2 are used for bit-oriented memories. For word-orientedmemories, the same algorithms can be appliedby modifying the data field of the algorithms.For example, the MAT++ for a bit-orientedmemory is
Ý {W0}; Ý {R0, W1}; ß {R1, W0, R0};
The same MAT + + algorithm for a 4-bitword-oriented memory can be modified as,
Ý {W0000}; Ý {R0000, W1111}; ß {R1111,
W0000, R0000};
However, in the case of word-oriented memorysome additional faults may appear [38]. Onecan also use the test algorithms proposed in[38] for a word-oriented memory.
• A memory size field (MS). It determines thesize of the memory under test. Usually,memories contain both row and columndecoders. An address multiplexing techniqueis used to select the memory cell. The ad-vantage of the technique is that it needs feweraddress lines to address a memory comparedto the previous technique. A memory withonly one decoder and 8 bit address line iscapable of addressing 28 memory cells, whilea memory with the same size of address lineand two decoders (i.e., row and columndecoders) can address 216 memory cells. Asan SOC may contain both types of memories,the MS field is divided into two parts. A onebit field called flag (F) is used to indicatewhether the memory under test has one ortwo decoders. When flag is 0, it indicates onlyone decoder is present in the memory undertest and a 1 indicates the other option. Thesecond part of the MS is called size filed(SO). The SO indicates size of the memory.The SO is log2n bits long, where n is the sizeof the largest memory embedded in the SOC.So, during the testing of the memories ofsmaller sizes the bits from the MSB side ofthis SO field will be set to zero.
• A memory type field (MT). It determines thetype of memory under test. It again consistsof two parts. The first part (MT1) determineswhether the memory is SRAM or DRAMand the second part (MT2) determines whether
TABLE 2: Value of S and the corresponding testalgorithms used in the present work
S Test Algorithms
0000 Option-A of the Proposed Algorithm
0001 Option-B of the Proposed Algorithm
0010 Option-C of the Proposed Algorithm
0011 Option-D of the Proposed Algorithm
0100 March RAW I [36]
0100 March RAW [36]
0100 MAT + + [37]
0101 MARCH A [37]
----- -------------
----- -------------
SHIBAJI BANERJEE et al : A PROGRAMMABLE BUILT-IN SELF-TEST FOR EMBEDDED MEMORY CORES 293
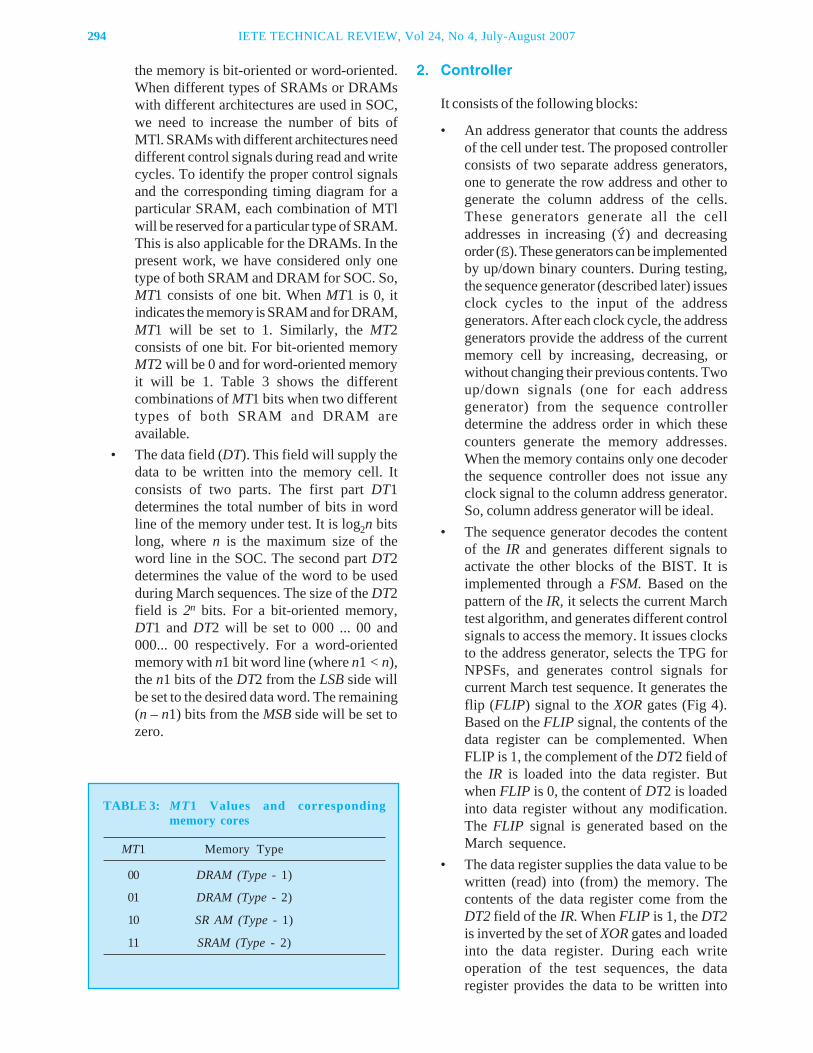
294 IETE TECHNICAL REVIEW, Vol 24, No 4, July-August 2007
the memory is bit-oriented or word-oriented.When different types of SRAMs or DRAMswith different architectures are used in SOC,we need to increase the number of bits ofMTl. SRAMs with different architectures needdifferent control signals during read and writecycles. To identify the proper control signalsand the corresponding timing diagram for aparticular SRAM, each combination of MTlwill be reserved for a particular type of SRAM.This is also applicable for the DRAMs. In thepresent work, we have considered only onetype of both SRAM and DRAM for SOC. So,MT1 consists of one bit. When MT1 is 0, itindicates the memory is SRAM and for DRAM,MT1 will be set to 1. Similarly, the MT2consists of one bit. For bit-oriented memoryMT2 will be 0 and for word-oriented memoryit will be 1. Table 3 shows the differentcombinations of MT1 bits when two differenttypes of both SRAM and DRAM areavailable.
• The data field (DT). This field will supply thedata to be written into the memory cell. Itconsists of two parts. The first part DT1determines the total number of bits in wordline of the memory under test. It is log2n bitslong, where n is the maximum size of theword line in the SOC. The second part DT2determines the value of the word to be usedduring March sequences. The size of the DT2field is 2n bits. For a bit-oriented memory,DT1 and DT2 will be set to 000 ... 00 and000... 00 respectively. For a word-orientedmemory with n1 bit word line (where n1 < n),the n1 bits of the DT2 from the LSB side willbe set to the desired data word. The remaining(n – n1) bits from the MSB side will be set tozero.
2. Controller
It consists of the following blocks:
• An address generator that counts the addressof the cell under test. The proposed controllerconsists of two separate address generators,one to generate the row address and other togenerate the column address of the cells.These generators generate all the celladdresses in increasing (Ý) and decreasingorder (ß). These generators can be implementedby up/down binary counters. During testing,the sequence generator (described later) issuesclock cycles to the input of the addressgenerators. After each clock cycle, the addressgenerators provide the address of the currentmemory cell by increasing, decreasing, orwithout changing their previous contents. Twoup/down signals (one for each addressgenerator) from the sequence controllerdetermine the address order in which thesecounters generate the memory addresses.When the memory contains only one decoderthe sequence controller does not issue anyclock signal to the column address generator.So, column address generator will be ideal.
• The sequence generator decodes the contentof the IR and generates different signals toactivate the other blocks of the BIST. It isimplemented through a FSM. Based on thepattern of the IR, it selects the current Marchtest algorithm, and generates different controlsignals to access the memory. It issues clocksto the address generator, selects the TPG forNPSFs, and generates control signals forcurrent March test sequence. It generates theflip (FLIP) signal to the XOR gates (Fig 4).Based on the FLIP signal, the contents of thedata register can be complemented. WhenFLIP is 1, the complement of the DT2 field ofthe IR is loaded into the data register. Butwhen FLIP is 0, the content of DT2 is loadedinto data register without any modification.The FLIP signal is generated based on theMarch sequence.
• The data register supplies the data value to bewritten (read) into (from) the memory. Thecontents of the data register come from theDT2 field of the IR. When FLIP is 1, the DT2is inverted by the set of XOR gates and loadedinto the data register. During each writeoperation of the test sequences, the dataregister provides the data to be written into
TABLE 3: MT1 Values and correspondingmemory cores
MT1 Memory Type
00 DRAM (Type - 1)
01 DRAM (Type - 2)
10 SR AM (Type - 1)
11 SRAM (Type - 2)
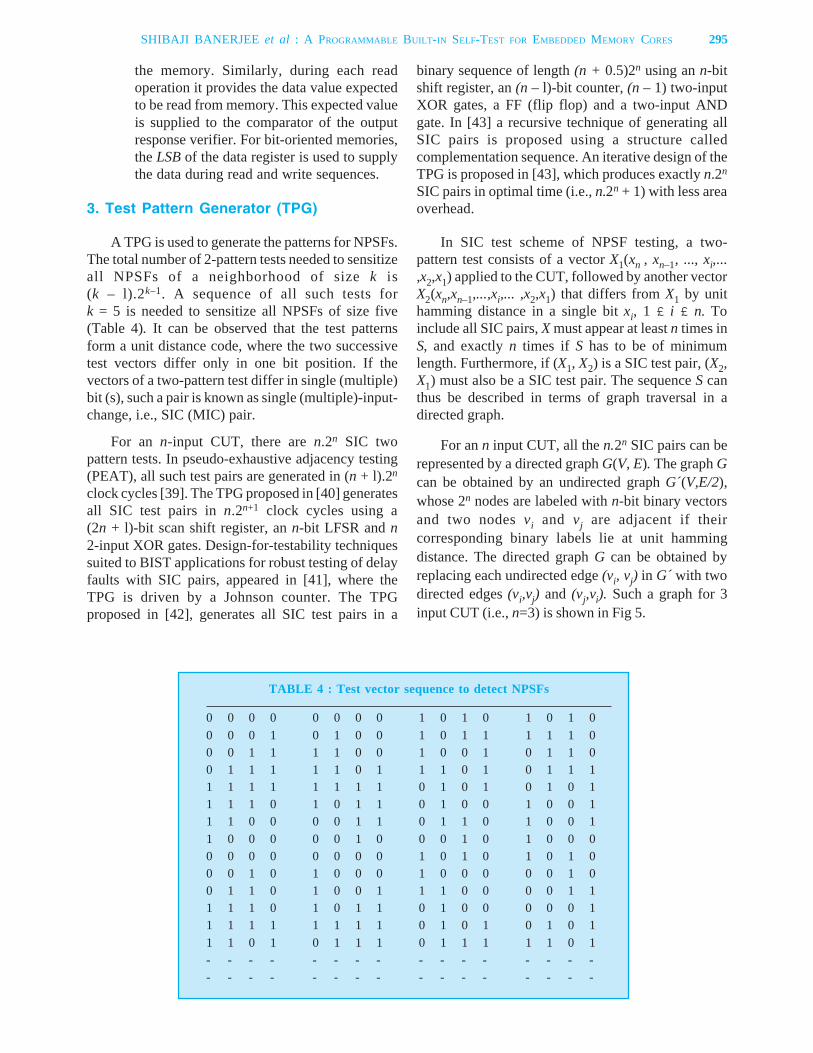
the memory. Similarly, during each readoperation it provides the data value expectedto be read from memory. This expected valueis supplied to the comparator of the outputresponse verifier. For bit-oriented memories,the LSB of the data register is used to supplythe data during read and write sequences.
3. Test Pattern Generator (TPG)
A TPG is used to generate the patterns for NPSFs.The total number of 2-pattern tests needed to sensitizeall NPSFs of a neighborhood of size k is(k – l).2k–1. A sequence of all such tests fork = 5 is needed to sensitize all NPSFs of size five(Table 4). It can be observed that the test patternsform a unit distance code, where the two successivetest vectors differ only in one bit position. If thevectors of a two-pattern test differ in single (multiple)bit (s), such a pair is known as single (multiple)-input-change, i.e., SIC (MIC) pair.
For an n-input CUT, there are n.2n SIC twopattern tests. In pseudo-exhaustive adjacency testing(PEAT), all such test pairs are generated in (n + l).2n
clock cycles [39]. The TPG proposed in [40] generatesall SIC test pairs in n.2n+1 clock cycles using a(2n + l)-bit scan shift register, an n-bit LFSR and n2-input XOR gates. Design-for-testability techniquessuited to BIST applications for robust testing of delayfaults with SIC pairs, appeared in [41], where theTPG is driven by a Johnson counter. The TPGproposed in [42], generates all SIC test pairs in a
binary sequence of length (n + 0.5)2n using an n-bitshift register, an (n – l)-bit counter, (n – 1) two-inputXOR gates, a FF (flip flop) and a two-input ANDgate. In [43] a recursive technique of generating allSIC pairs is proposed using a structure calledcomplementation sequence. An iterative design of theTPG is proposed in [43], which produces exactly n.2n
SIC pairs in optimal time (i.e., n.2n + 1) with less areaoverhead.
In SIC test scheme of NPSF testing, a two-pattern test consists of a vector X1(xn , xn–1, ..., xi,...,x2,x1) applied to the CUT, followed by another vectorX2(xn,xn–1,...,xi,... ,x2,x1) that differs from X1 by unithamming distance in a single bit xi, 1 £ i £ n. Toinclude all SIC pairs, X must appear at least n times inS, and exactly n times if S has to be of minimumlength. Furthermore, if (X1, X2) is a SIC test pair, (X2,X1) must also be a SIC test pair. The sequence S canthus be described in terms of graph traversal in adirected graph.
For an n input CUT, all the n.2n SIC pairs can berepresented by a directed graph G(V, E). The graph Gcan be obtained by an undirected graph G´(V,E/2),whose 2n nodes are labeled with n-bit binary vectorsand two nodes vi and vj are adjacent if theircorresponding binary labels lie at unit hammingdistance. The directed graph G can be obtained byreplacing each undirected edge (vi, vj) in G´ with twodirected edges (vi,vj) and (vj,vi). Such a graph for 3input CUT (i.e., n=3) is shown in Fig 5.
TABLE 4 : Test vector sequence to detect NPSFs
0 0 0 0 0 0 0 0 1 0 1 0 1 0 1 00 0 0 1 0 1 0 0 1 0 1 1 1 1 1 00 0 1 1 1 1 0 0 1 0 0 1 0 1 1 00 1 1 1 1 1 0 1 1 1 0 1 0 1 1 11 1 1 1 1 1 1 1 0 1 0 1 0 1 0 11 1 1 0 1 0 1 1 0 1 0 0 1 0 0 11 1 0 0 0 0 1 1 0 1 1 0 1 0 0 11 0 0 0 0 0 1 0 0 0 1 0 1 0 0 00 0 0 0 0 0 0 0 1 0 1 0 1 0 1 00 0 1 0 1 0 0 0 1 0 0 0 0 0 1 00 1 1 0 1 0 0 1 1 1 0 0 0 0 1 11 1 1 0 1 0 1 1 0 1 0 0 0 0 0 11 1 1 1 1 1 1 1 0 1 0 1 0 1 0 11 1 0 1 0 1 1 1 0 1 1 1 1 1 0 1- - - - - - - - - - - - - - - -- - - - - - - - - - - - - - - -
SHIBAJI BANERJEE et al : A PROGRAMMABLE BUILT-IN SELF-TEST FOR EMBEDDED MEMORY CORES 295
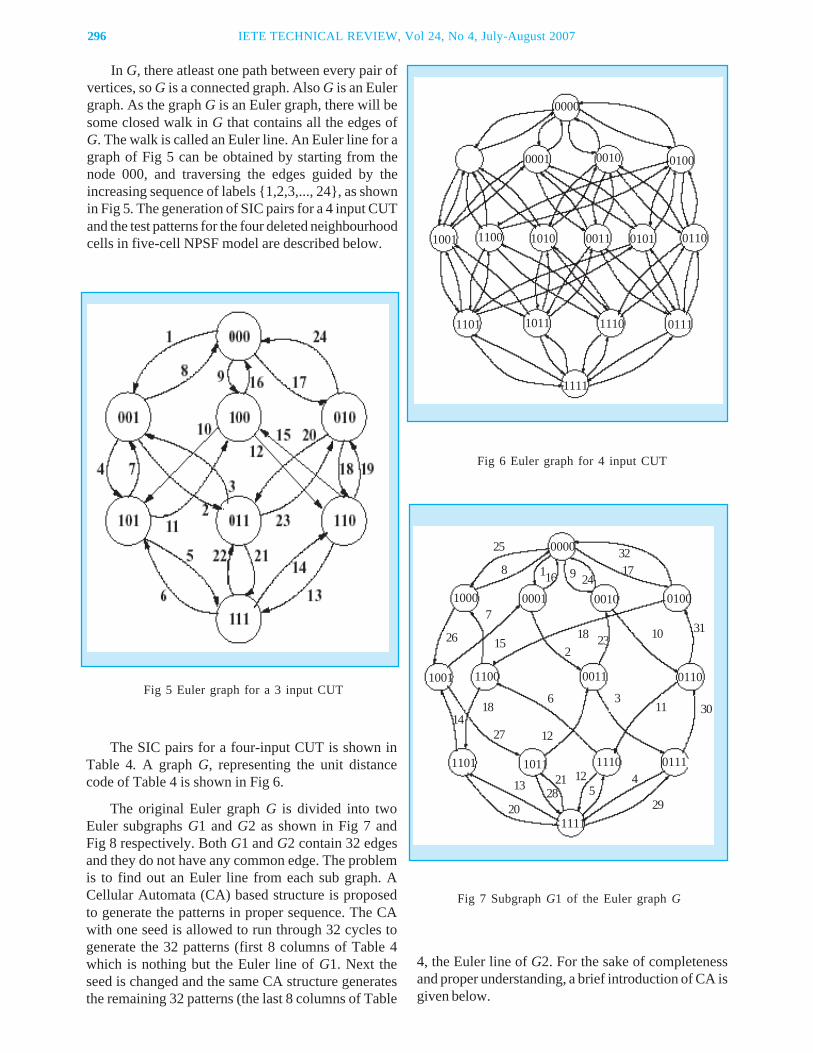
296 IETE TECHNICAL REVIEW, Vol 24, No 4, July-August 2007
In G, there atleast one path between every pair ofvertices, so G is a connected graph. Also G is an Eulergraph. As the graph G is an Euler graph, there will besome closed walk in G that contains all the edges ofG. The walk is called an Euler line. An Euler line for agraph of Fig 5 can be obtained by starting from thenode 000, and traversing the edges guided by theincreasing sequence of labels {1,2,3,..., 24}, as shownin Fig 5. The generation of SIC pairs for a 4 input CUTand the test patterns for the four deleted neighbourhoodcells in five-cell NPSF model are described below.
4, the Euler line of G2. For the sake of completenessand proper understanding, a brief introduction of CA isgiven below.
The SIC pairs for a four-input CUT is shown inTable 4. A graph G, representing the unit distancecode of Table 4 is shown in Fig 6.
The original Euler graph G is divided into twoEuler subgraphs G1 and G2 as shown in Fig 7 andFig 8 respectively. Both G1 and G2 contain 32 edgesand they do not have any common edge. The problemis to find out an Euler line from each sub graph. ACellular Automata (CA) based structure is proposedto generate the patterns in proper sequence. The CAwith one seed is allowed to run through 32 cycles togenerate the 32 patterns (first 8 columns of Table 4which is nothing but the Euler line of G1. Next theseed is changed and the same CA structure generatesthe remaining 32 patterns (the last 8 columns of Table
Fig 5 Euler graph for a 3 input CUT
Fig 6 Euler graph for 4 input CUT
Fig 7 Subgraph G1 of the Euler graph G
0000
0001 0010 0100
1001 1100 1010 0011 0101 0110
1101 1011 1110 0111
1111
0000
00011000 0010 0100
1001 1100 0011 0110
1101 1011 1110 0111
1111
25
8 116 9 2417
32
26
7
1518
223 10 31
311 3018
1427 12
6
2128
12 4
20
13 529
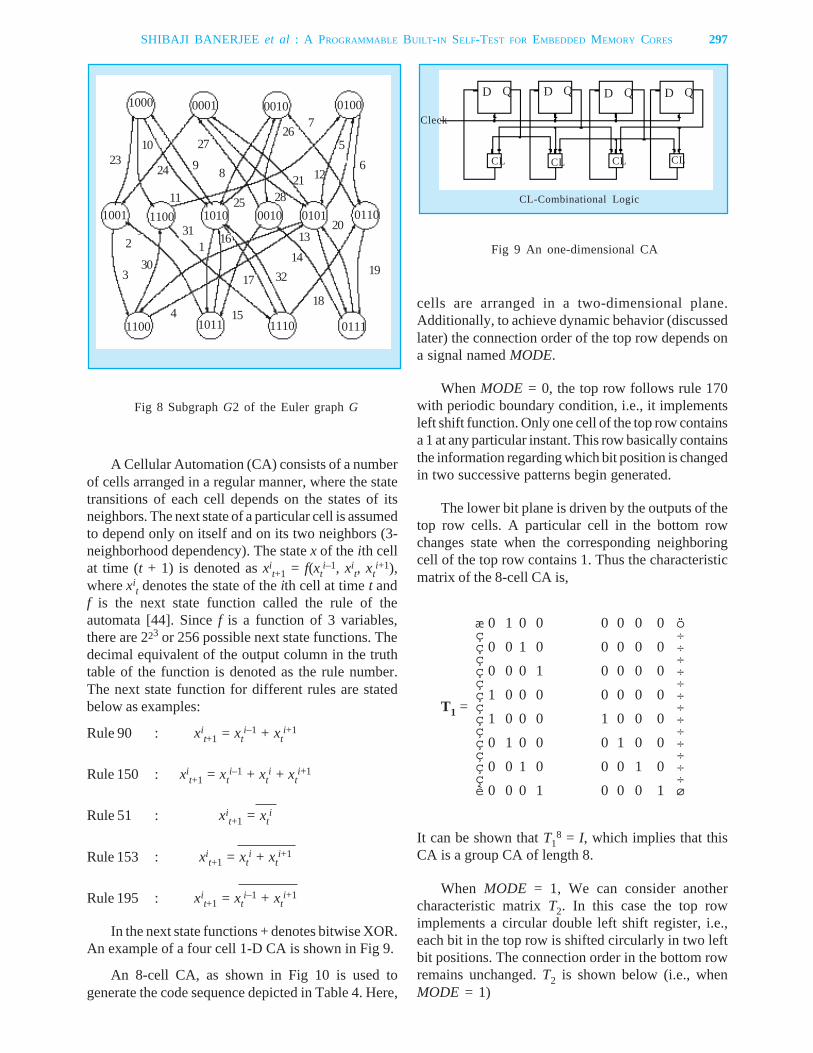
A Cellular Automation (CA) consists of a numberof cells arranged in a regular manner, where the statetransitions of each cell depends on the states of itsneighbors. The next state of a particular cell is assumedto depend only on itself and on its two neighbors (3-neighborhood dependency). The state x of the ith cellat time (t + 1) is denoted as xi
t+1 = f(xti–1, xi
t, xti+1),
where xit denotes the state of the ith cell at time t and
f is the next state function called the rule of theautomata [44]. Since f is a function of 3 variables,there are 223 or 256 possible next state functions. Thedecimal equivalent of the output column in the truthtable of the function is denoted as the rule number.The next state function for different rules are statedbelow as examples:
Rule 90 : xit+1 = xt
i–1 + xti+1
Rule 150 : xit+1 = xt
i–1 + xti + xt
i+1
Rule 51 : xit+1 = xt
i
Rule 153 : xit+1 = xt
i + xti+1
Rule 195 : xit+1 = xt
i–1 + xti+1
In the next state functions + denotes bitwise XOR.An example of a four cell 1-D CA is shown in Fig 9.
An 8-cell CA, as shown in Fig 10 is used togenerate the code sequence depicted in Table 4. Here,
cells are arranged in a two-dimensional plane.Additionally, to achieve dynamic behavior (discussedlater) the connection order of the top row depends ona signal named MODE.
When MODE = 0, the top row follows rule 170with periodic boundary condition, i.e., it implementsleft shift function. Only one cell of the top row containsa 1 at any particular instant. This row basically containsthe information regarding which bit position is changedin two successive patterns begin generated.
The lower bit plane is driven by the outputs of thetop row cells. A particular cell in the bottom rowchanges state when the corresponding neighboringcell of the top row contains 1. Thus the characteristicmatrix of the 8-cell CA is,
æ 0 1 0 0 0 0 0 0 öç ÷ç 0 0 1 0 0 0 0 0 ÷ç ÷ç 0 0 0 1 0 0 0 0 ÷ç ÷ç 1 0 0 0 0 0 0 0 ÷
T1 = ç ÷ç 1 0 0 0 1 0 0 0 ÷ç ÷ç 0 1 0 0 0 1 0 0 ÷ç ÷ç 0 0 1 0 0 0 1 0 ÷ç ÷è 0 0 0 1 0 0 0 1 ø
It can be shown that T18 = I, which implies that this
CA is a group CA of length 8.
When MODE = 1, We can consider anothercharacteristic matrix T2. In this case the top rowimplements a circular double left shift register, i.e.,each bit in the top row is shifted circularly in two leftbit positions. The connection order in the bottom rowremains unchanged. T2 is shown below (i.e., whenMODE = 1)
Fig 8 Subgraph G2 of the Euler graph G
Fig 9 An one-dimensional CA
1000 0001 0010 0100
1001 1100 1010 0010 0101 0110
1100 1011 1110 0111
2310
24
11
9
27
8
267
21 126
25
5
28
2
330
311 16
17 32
15418
19
1314
20
D Q D Q D Q D Q
CL CL CL CL
Cleck
CL-Combinational Logic
SHIBAJI BANERJEE et al : A PROGRAMMABLE BUILT-IN SELF-TEST FOR EMBEDDED MEMORY CORES 297
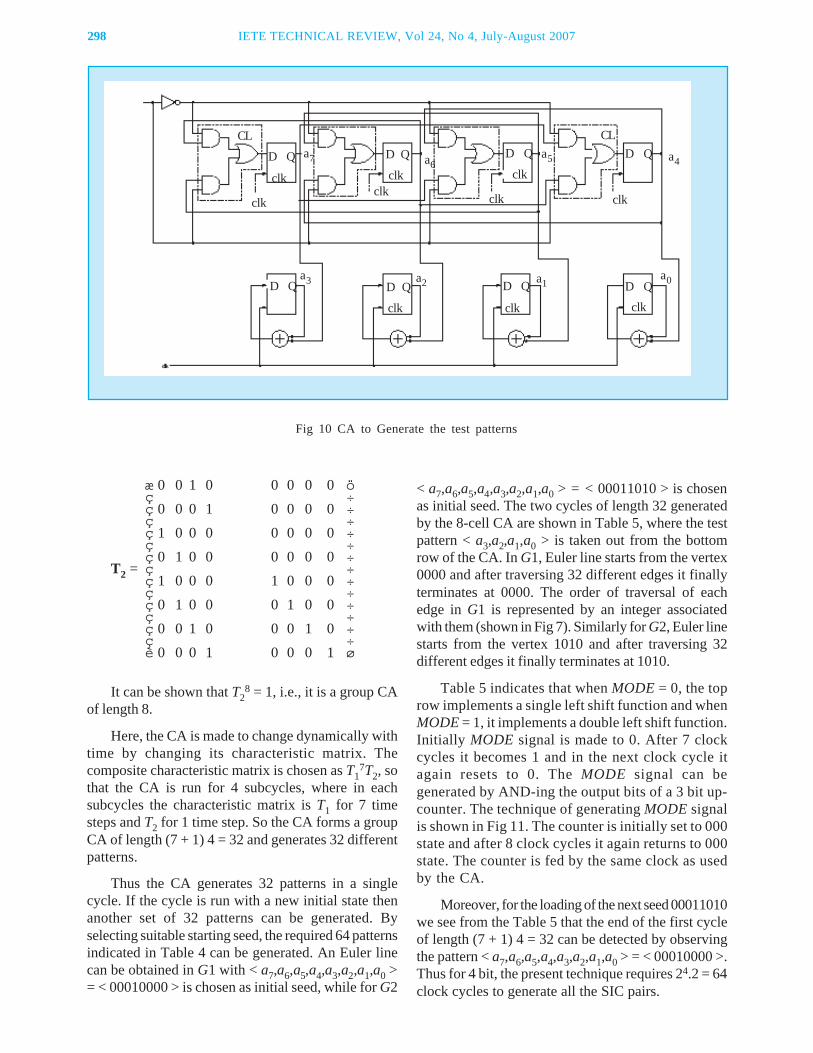
298 IETE TECHNICAL REVIEW, Vol 24, No 4, July-August 2007
æ 0 0 1 0 0 0 0 0 öç ÷ç 0 0 0 1 0 0 0 0 ÷ç ÷ç 1 0 0 0 0 0 0 0 ÷ç ÷ç 0 1 0 0 0 0 0 0 ÷
T2 = ç ÷ç 1 0 0 0 1 0 0 0 ÷ç ÷ç 0 1 0 0 0 1 0 0 ÷ç ÷ç 0 0 1 0 0 0 1 0 ÷ç ÷è 0 0 0 1 0 0 0 1 ø
It can be shown that T28 = 1, i.e., it is a group CA
of length 8.
Here, the CA is made to change dynamically withtime by changing its characteristic matrix. Thecomposite characteristic matrix is chosen as T1
7T2, sothat the CA is run for 4 subcycles, where in eachsubcycles the characteristic matrix is T1 for 7 timesteps and T2 for 1 time step. So the CA forms a groupCA of length (7 + 1) 4 = 32 and generates 32 differentpatterns.
Thus the CA generates 32 patterns in a singlecycle. If the cycle is run with a new initial state thenanother set of 32 patterns can be generated. Byselecting suitable starting seed, the required 64 patternsindicated in Table 4 can be generated. An Euler linecan be obtained in G1 with < a7,a6,a5,a4,a3,a2,a1,a0 >= < 00010000 > is chosen as initial seed, while for G2
< a7,a6,a5,a4,a3,a2,a1,a0 > = < 00011010 > is chosenas initial seed. The two cycles of length 32 generatedby the 8-cell CA are shown in Table 5, where the testpattern < a3,a2,a1,a0 > is taken out from the bottomrow of the CA. In G1, Euler line starts from the vertex0000 and after traversing 32 different edges it finallyterminates at 0000. The order of traversal of eachedge in G1 is represented by an integer associatedwith them (shown in Fig 7). Similarly for G2, Euler linestarts from the vertex 1010 and after traversing 32different edges it finally terminates at 1010.
Table 5 indicates that when MODE = 0, the toprow implements a single left shift function and whenMODE = 1, it implements a double left shift function.Initially MODE signal is made to 0. After 7 clockcycles it becomes 1 and in the next clock cycle itagain resets to 0. The MODE signal can begenerated by AND-ing the output bits of a 3 bit up-counter. The technique of generating MODE signalis shown in Fig 11. The counter is initially set to 000state and after 8 clock cycles it again returns to 000state. The counter is fed by the same clock as usedby the CA.
Moreover, for the loading of the next seed 00011010we see from the Table 5 that the end of the first cycleof length (7 + 1) 4 = 32 can be detected by observingthe pattern < a7,a6,a5,a4,a3,a2,a1,a0 > = < 00010000 >.Thus for 4 bit, the present technique requires 24.2 = 64clock cycles to generate all the SIC pairs.
Fig 10 CA to Generate the test patterns
CLD Q D Q D Q D Q
D QD QD QD Q
clkclk
clk
clk
a6clk
clk
CL
clk
a4
a0a1a2
clk clk clk
a7 a5
a3
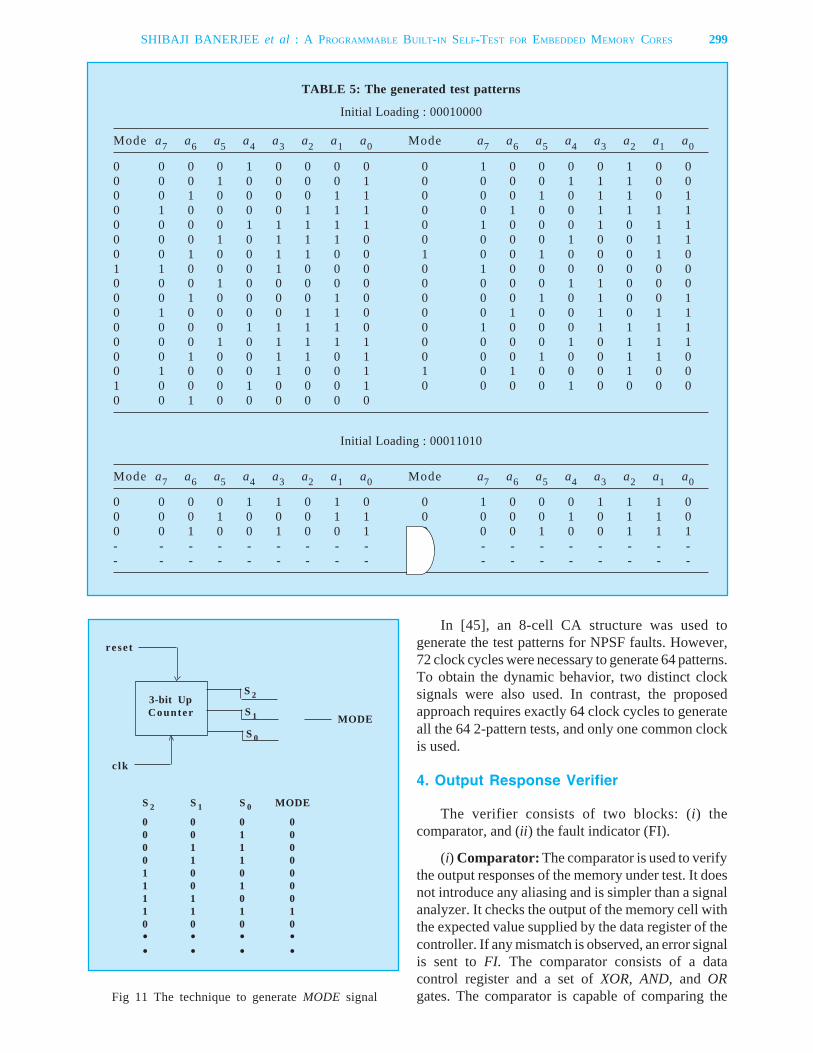
TABLE 5: The generated test patterns
Initial Loading : 00010000
Mode a7 a6 a5 a4 a3 a2 a1 a0 Mode a7 a6 a5 a4 a3 a2 a1 a0
0 0 0 0 1 0 0 0 0 0 1 0 0 0 0 1 0 00 0 0 1 0 0 0 0 1 0 0 0 0 1 1 1 0 00 0 1 0 0 0 0 1 1 0 0 0 1 0 1 1 0 10 1 0 0 0 0 1 1 1 0 0 1 0 0 1 1 1 10 0 0 0 1 1 1 1 1 0 1 0 0 0 1 0 1 10 0 0 1 0 1 1 1 0 0 0 0 0 1 0 0 1 10 0 1 0 0 1 1 0 0 1 0 0 1 0 0 0 1 01 1 0 0 0 1 0 0 0 0 1 0 0 0 0 0 0 00 0 0 1 0 0 0 0 0 0 0 0 0 1 1 0 0 00 0 1 0 0 0 0 1 0 0 0 0 1 0 1 0 0 10 1 0 0 0 0 1 1 0 0 0 1 0 0 1 0 1 10 0 0 0 1 1 1 1 0 0 1 0 0 0 1 1 1 10 0 0 1 0 1 1 1 1 0 0 0 0 1 0 1 1 10 0 1 0 0 1 1 0 1 0 0 0 1 0 0 1 1 00 1 0 0 0 1 0 0 1 1 0 1 0 0 0 1 0 01 0 0 0 1 0 0 0 1 0 0 0 0 1 0 0 0 00 0 1 0 0 0 0 0 0
Initial Loading : 00011010
Mode a7 a6 a5 a4 a3 a2 a1 a0 Mode a7 a6 a5 a4 a3 a2 a1 a0
0 0 0 0 1 1 0 1 0 0 1 0 0 0 1 1 1 00 0 0 1 0 0 0 1 1 0 0 0 0 1 0 1 1 00 0 1 0 0 1 0 0 1 0 0 0 1 0 0 1 1 1- - - - - - - - - - - - - - - - - -- - - - - - - - - - - - - - - - - -
Fig 11 The technique to generate MODE signal
3-bit UpCounter
rese t
c lk
MODE
S 2
S 1
S 0
S 2 S 1 S 0 MODE
0 0 0 00 0 1 00 1 1 00 1 1 01 0 0 01 0 1 01 1 0 01 1 1 10 0 0 0• • • •• • • •
In [45], an 8-cell CA structure was used togenerate the test patterns for NPSF faults. However,72 clock cycles were necessary to generate 64 patterns.To obtain the dynamic behavior, two distinct clocksignals were also used. In contrast, the proposedapproach requires exactly 64 clock cycles to generateall the 64 2-pattern tests, and only one common clockis used.
4. Output Response Verifier
The verifier consists of two blocks: (i) thecomparator, and (ii) the fault indicator (FI).
(i) Comparator: The comparator is used to verifythe output responses of the memory under test. It doesnot introduce any aliasing and is simpler than a signalanalyzer. It checks the output of the memory cell withthe expected value supplied by the data register of thecontroller. If any mismatch is observed, an error signalis sent to FI. The comparator consists of a datacontrol register and a set of XOR, AND, and ORgates. The comparator is capable of comparing the
SHIBAJI BANERJEE et al : A PROGRAMMABLE BUILT-IN SELF-TEST FOR EMBEDDED MEMORY CORES 299
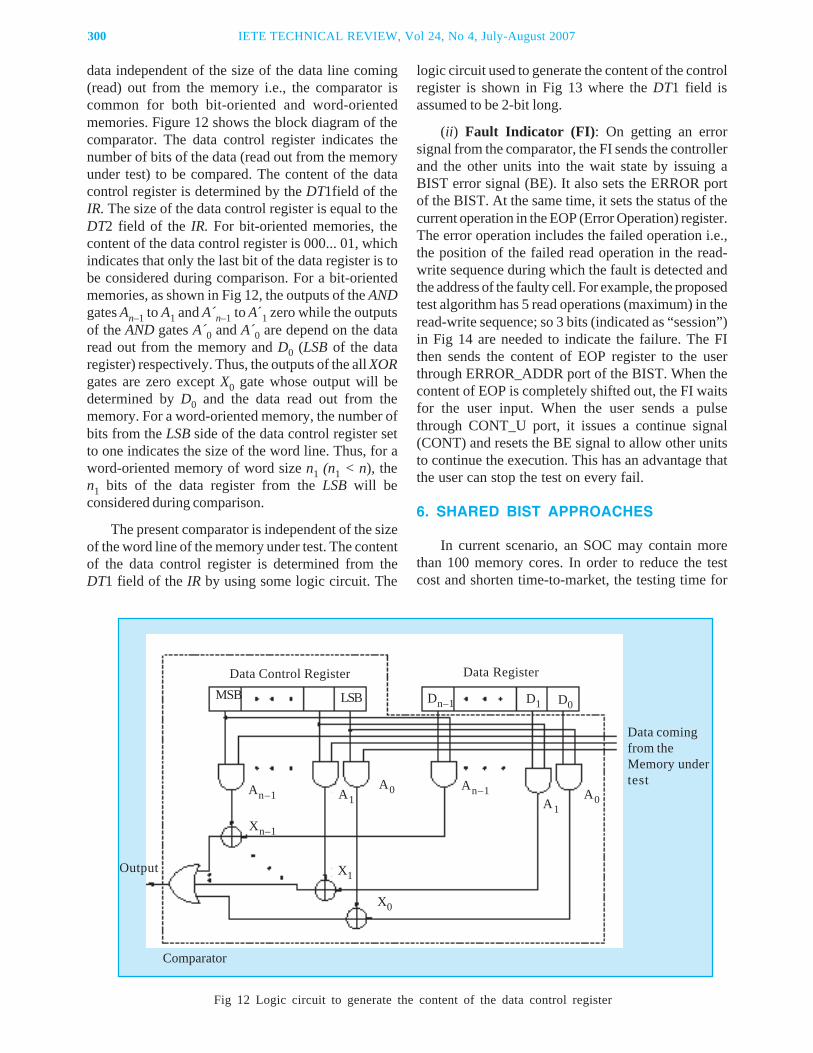
300 IETE TECHNICAL REVIEW, Vol 24, No 4, July-August 2007
data independent of the size of the data line coming(read) out from the memory i.e., the comparator iscommon for both bit-oriented and word-orientedmemories. Figure 12 shows the block diagram of thecomparator. The data control register indicates thenumber of bits of the data (read out from the memoryunder test) to be compared. The content of the datacontrol register is determined by the DT1field of theIR. The size of the data control register is equal to theDT2 field of the IR. For bit-oriented memories, thecontent of the data control register is 000... 01, whichindicates that only the last bit of the data register is tobe considered during comparison. For a bit-orientedmemories, as shown in Fig 12, the outputs of the ANDgates An–1 to A1 and A´n–1 to A´1 zero while the outputsof the AND gates A´0 and A´0 are depend on the dataread out from the memory and D0 (LSB of the dataregister) respectively. Thus, the outputs of the all XORgates are zero except X0 gate whose output will bedetermined by D0 and the data read out from thememory. For a word-oriented memory, the number ofbits from the LSB side of the data control register setto one indicates the size of the word line. Thus, for aword-oriented memory of word size n1 (n1 < n), then1 bits of the data register from the LSB will beconsidered during comparison.
The present comparator is independent of the sizeof the word line of the memory under test. The contentof the data control register is determined from theDT1 field of the IR by using some logic circuit. The
logic circuit used to generate the content of the controlregister is shown in Fig 13 where the DT1 field isassumed to be 2-bit long.
(ii) Fault Indicator (FI): On getting an errorsignal from the comparator, the FI sends the controllerand the other units into the wait state by issuing aBIST error signal (BE). It also sets the ERROR portof the BIST. At the same time, it sets the status of thecurrent operation in the EOP (Error Operation) register.The error operation includes the failed operation i.e.,the position of the failed read operation in the read-write sequence during which the fault is detected andthe address of the faulty cell. For example, the proposedtest algorithm has 5 read operations (maximum) in theread-write sequence; so 3 bits (indicated as “session”)in Fig 14 are needed to indicate the failure. The FIthen sends the content of EOP register to the userthrough ERROR_ADDR port of the BIST. When thecontent of EOP is completely shifted out, the FI waitsfor the user input. When the user sends a pulsethrough CONT_U port, it issues a continue signal(CONT) and resets the BE signal to allow other unitsto continue the execution. This has an advantage thatthe user can stop the test on every fail.
6. SHARED BIST APPROACHES
In current scenario, an SOC may contain morethan 100 memory cores. In order to reduce the testcost and shorten time-to-market, the testing time for
Fig 12 Logic circuit to generate the content of the data control register
Data Control Register Data Register
Data comingfrom theMemory undertest
Output
Comparator
MSB LSB Dn–1 D1 D0
An–1 A1A0 An–1
A1A0
Xn–1
X1
X0
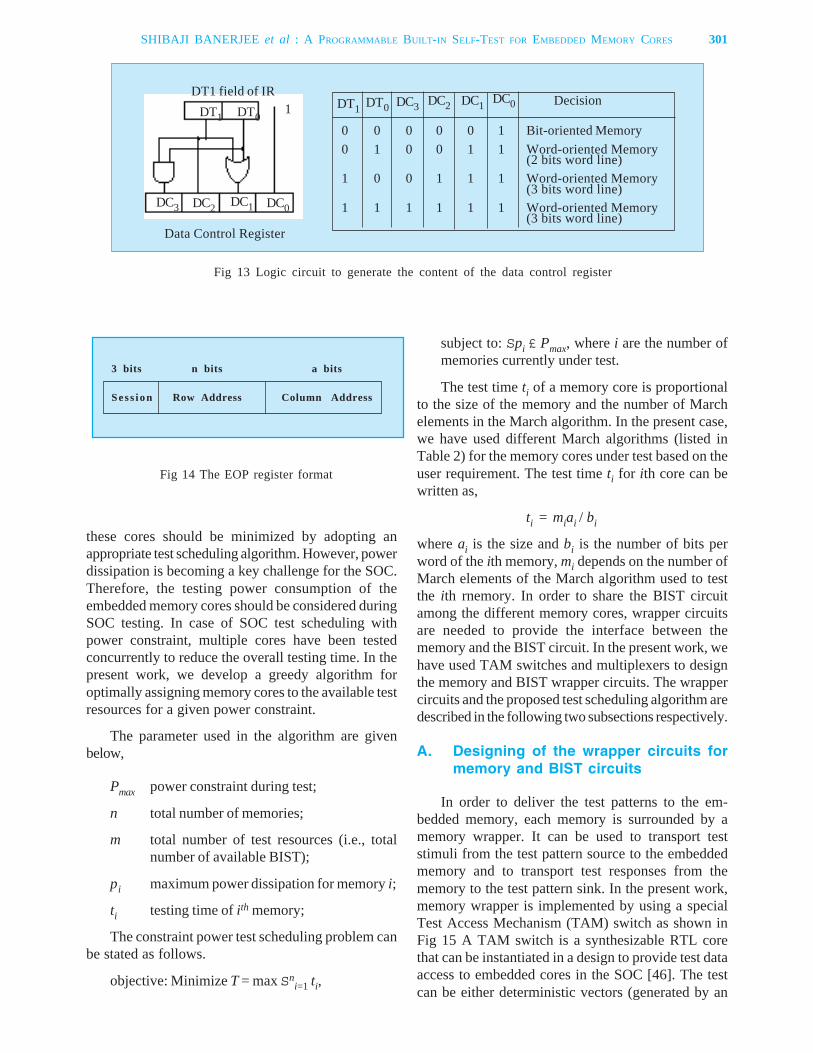
these cores should be minimized by adopting anappropriate test scheduling algorithm. However, powerdissipation is becoming a key challenge for the SOC.Therefore, the testing power consumption of theembedded memory cores should be considered duringSOC testing. In case of SOC test scheduling withpower constraint, multiple cores have been testedconcurrently to reduce the overall testing time. In thepresent work, we develop a greedy algorithm foroptimally assigning memory cores to the available testresources for a given power constraint.
The parameter used in the algorithm are givenbelow,
Pmax power constraint during test;
n total number of memories;
m total number of test resources (i.e., totalnumber of available BIST);
pi maximum power dissipation for memory i;
ti testing time of ith memory;
The constraint power test scheduling problem canbe stated as follows.
objective: Minimize T = max Sni=1 ti,
subject to: Spi £ Pmax, where i are the number ofmemories currently under test.
The test time ti of a memory core is proportionalto the size of the memory and the number of Marchelements in the March algorithm. In the present case,we have used different March algorithms (listed inTable 2) for the memory cores under test based on theuser requirement. The test time ti for ith core can bewritten as,
ti = miai / bi
where ai is the size and bi is the number of bits perword of the ith memory, mi depends on the number ofMarch elements of the March algorithm used to testthe ith rnemory. In order to share the BIST circuitamong the different memory cores, wrapper circuitsare needed to provide the interface between thememory and the BIST circuit. In the present work, wehave used TAM switches and multiplexers to designthe memory and BIST wrapper circuits. The wrappercircuits and the proposed test scheduling algorithm aredescribed in the following two subsections respectively.
A. Designing of the wrapper circuits formemory and BIST circuits
In order to deliver the test patterns to the em-bedded memory, each memory is surrounded by amemory wrapper. It can be used to transport teststimuli from the test pattern source to the embeddedmemory and to transport test responses from thememory to the test pattern sink. In the present work,memory wrapper is implemented by using a specialTest Access Mechanism (TAM) switch as shown inFig 15 A TAM switch is a synthesizable RTL corethat can be instantiated in a design to provide test dataaccess to embedded cores in the SOC [46]. The testcan be either deterministic vectors (generated by an
Fig 13 Logic circuit to generate the content of the data control register
3 bits n bits a bits
Sess ion Row Address Column Address
Fig 14 The EOP register format
Data Control Register
DT1 DT0 DC3 DC2 DC1 DC0 Decision
0 0 0 0 0 1 Bit-oriented Memory0 1 0 0 1 1 Word-oriented Memory
(2 bits word line)1 0 0 1 1 1 Word-oriented Memory
(3 bits word line)1 1 1 1 1 1 Word-oriented Memory
(3 bits word line)
SHIBAJI BANERJEE et al : A PROGRAMMABLE BUILT-IN SELF-TEST FOR EMBEDDED MEMORY CORES 301
DT1 field of IRDT1 DT0
1
DC3 DC2 DC1 DC0
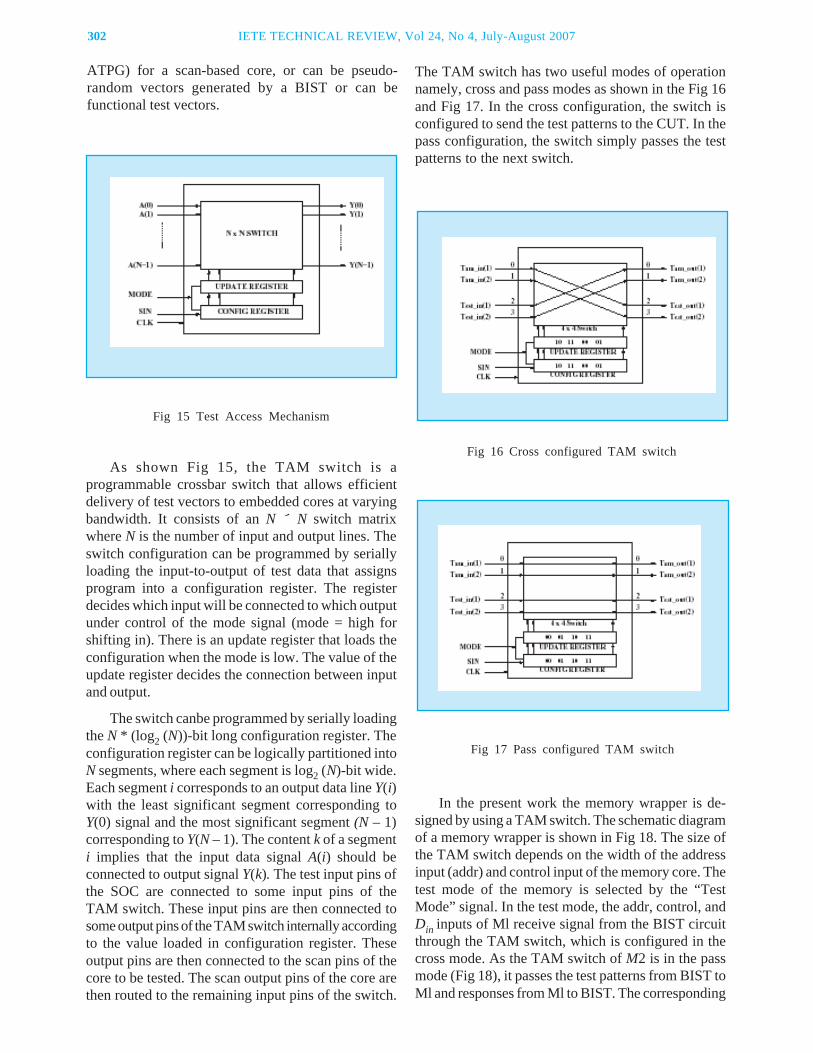
302 IETE TECHNICAL REVIEW, Vol 24, No 4, July-August 2007
ATPG) for a scan-based core, or can be pseudo-random vectors generated by a BIST or can befunctional test vectors.
The TAM switch has two useful modes of operationnamely, cross and pass modes as shown in the Fig 16and Fig 17. In the cross configuration, the switch isconfigured to send the test patterns to the CUT. In thepass configuration, the switch simply passes the testpatterns to the next switch.
As shown Fig 15, the TAM switch is aprogrammable crossbar switch that allows efficientdelivery of test vectors to embedded cores at varyingbandwidth. It consists of an N N switch matrixwhere N is the number of input and output lines. Theswitch configuration can be programmed by seriallyloading the input-to-output of test data that assignsprogram into a configuration register. The registerdecides which input will be connected to which outputunder control of the mode signal (mode = high forshifting in). There is an update register that loads theconfiguration when the mode is low. The value of theupdate register decides the connection between inputand output.
The switch canbe programmed by serially loadingthe N * (log2 (N))-bit long configuration register. Theconfiguration register can be logically partitioned intoN segments, where each segment is log2 (N)-bit wide.Each segment i corresponds to an output data line Y(i)with the least significant segment corresponding toY(0) signal and the most significant segment (N – 1)corresponding to Y(N – 1). The content k of a segmenti implies that the input data signal A(i) should beconnected to output signal Y(k). The test input pins ofthe SOC are connected to some input pins of theTAM switch. These input pins are then connected tosome output pins of the TAM switch internally accordingto the value loaded in configuration register. Theseoutput pins are then connected to the scan pins of thecore to be tested. The scan output pins of the core arethen routed to the remaining input pins of the switch.
Fig 15 Test Access Mechanism
Fig 17 Pass configured TAM switch
Fig 16 Cross configured TAM switch
In the present work the memory wrapper is de-signed by using a TAM switch. The schematic diagramof a memory wrapper is shown in Fig 18. The size ofthe TAM switch depends on the width of the addressinput (addr) and control input of the memory core. Thetest mode of the memory is selected by the “TestMode” signal. In the test mode, the addr, control, andDin inputs of Ml receive signal from the BIST circuitthrough the TAM switch, which is configured in thecross mode. As the TAM switch of M2 is in the passmode (Fig 18), it passes the test patterns from BIST toMl and responses from Ml to BIST. The corresponding
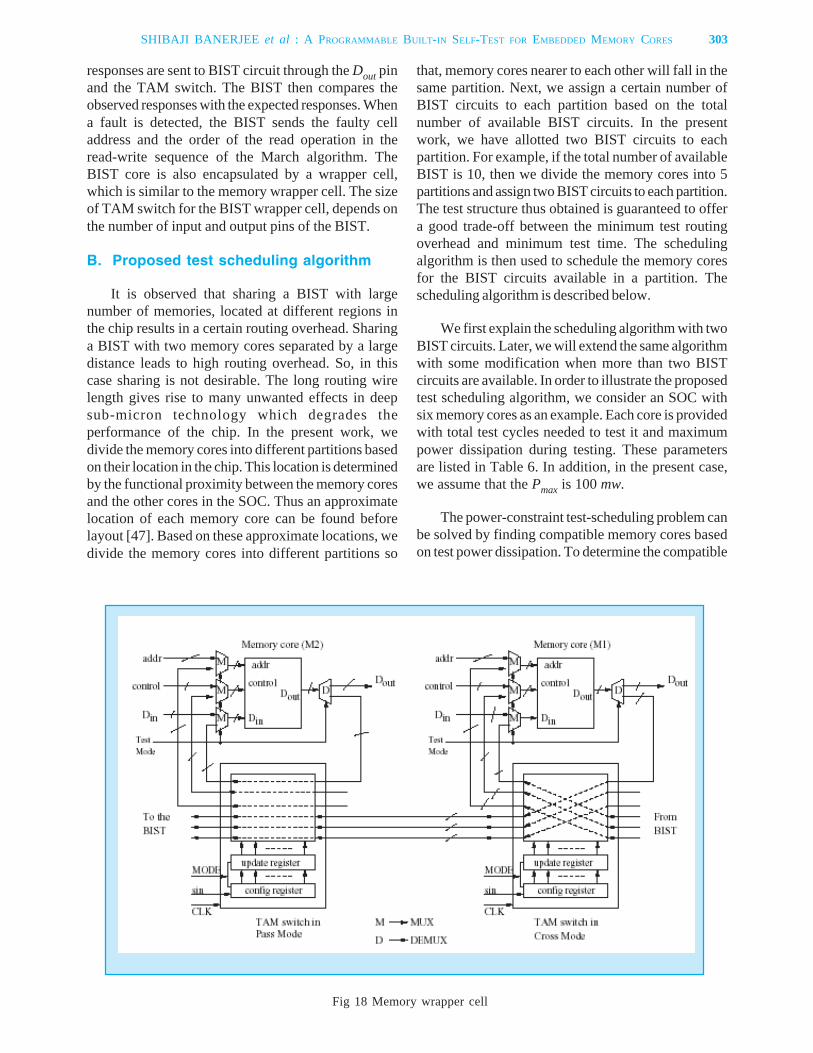
responses are sent to BIST circuit through the Dout pinand the TAM switch. The BIST then compares theobserved responses with the expected responses. Whena fault is detected, the BIST sends the faulty celladdress and the order of the read operation in theread-write sequence of the March algorithm. TheBIST core is also encapsulated by a wrapper cell,which is similar to the memory wrapper cell. The sizeof TAM switch for the BIST wrapper cell, depends onthe number of input and output pins of the BIST.
B. Proposed test scheduling algorithm
It is observed that sharing a BIST with largenumber of memories, located at different regions inthe chip results in a certain routing overhead. Sharinga BIST with two memory cores separated by a largedistance leads to high routing overhead. So, in thiscase sharing is not desirable. The long routing wirelength gives rise to many unwanted effects in deepsub-micron technology which degrades theperformance of the chip. In the present work, wedivide the memory cores into different partitions basedon their location in the chip. This location is determinedby the functional proximity between the memory coresand the other cores in the SOC. Thus an approximatelocation of each memory core can be found beforelayout [47]. Based on these approximate locations, wedivide the memory cores into different partitions so
that, memory cores nearer to each other will fall in thesame partition. Next, we assign a certain number ofBIST circuits to each partition based on the totalnumber of available BIST circuits. In the presentwork, we have allotted two BIST circuits to eachpartition. For example, if the total number of availableBIST is 10, then we divide the memory cores into 5partitions and assign two BIST circuits to each partition.The test structure thus obtained is guaranteed to offera good trade-off between the minimum test routingoverhead and minimum test time. The schedulingalgorithm is then used to schedule the memory coresfor the BIST circuits available in a partition. Thescheduling algorithm is described below.
We first explain the scheduling algorithm with twoBIST circuits. Later, we will extend the same algorithmwith some modification when more than two BISTcircuits are available. In order to illustrate the proposedtest scheduling algorithm, we consider an SOC withsix memory cores as an example. Each core is providedwith total test cycles needed to test it and maximumpower dissipation during testing. These parametersare listed in Table 6. In addition, in the present case,we assume that the Pmax is 100 mw.
The power-constraint test-scheduling problem canbe solved by finding compatible memory cores basedon test power dissipation. To determine the compatible
Fig 18 Memory wrapper cell
SHIBAJI BANERJEE et al : A PROGRAMMABLE BUILT-IN SELF-TEST FOR EMBEDDED MEMORY CORES 303
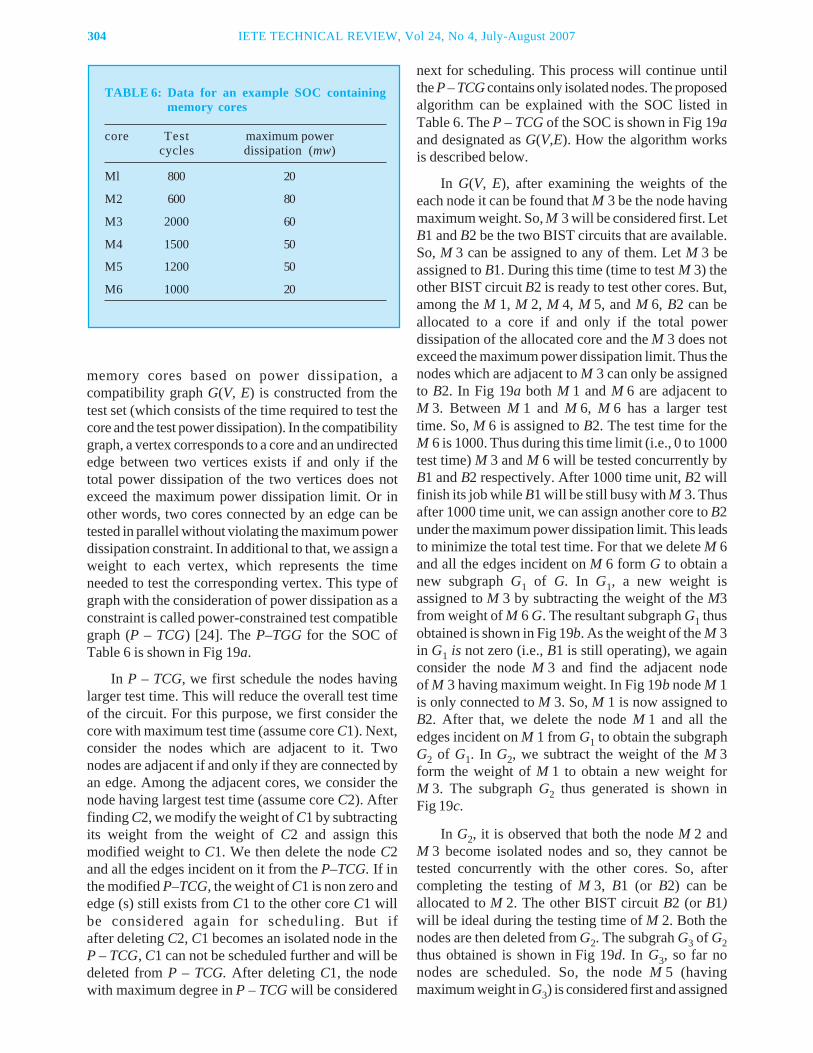
304 IETE TECHNICAL REVIEW, Vol 24, No 4, July-August 2007
memory cores based on power dissipation, acompatibility graph G(V, E) is constructed from thetest set (which consists of the time required to test thecore and the test power dissipation). In the compatibilitygraph, a vertex corresponds to a core and an undirectededge between two vertices exists if and only if thetotal power dissipation of the two vertices does notexceed the maximum power dissipation limit. Or inother words, two cores connected by an edge can betested in parallel without violating the maximum powerdissipation constraint. In additional to that, we assign aweight to each vertex, which represents the timeneeded to test the corresponding vertex. This type ofgraph with the consideration of power dissipation as aconstraint is called power-constrained test compatiblegraph (P – TCG) [24]. The P–TGG for the SOC ofTable 6 is shown in Fig 19a.
In P – TCG, we first schedule the nodes havinglarger test time. This will reduce the overall test timeof the circuit. For this purpose, we first consider thecore with maximum test time (assume core C1). Next,consider the nodes which are adjacent to it. Twonodes are adjacent if and only if they are connected byan edge. Among the adjacent cores, we consider thenode having largest test time (assume core C2). Afterfinding C2, we modify the weight of C1 by subtractingits weight from the weight of C2 and assign thismodified weight to C1. We then delete the node C2and all the edges incident on it from the P–TCG. If inthe modified P–TCG, the weight of C1 is non zero andedge (s) still exists from C1 to the other core C1 willbe considered again for scheduling. But ifafter deleting C2, C1 becomes an isolated node in theP – TCG, C1 can not be scheduled further and will bedeleted from P – TCG. After deleting C1, the nodewith maximum degree in P – TCG will be considered
next for scheduling. This process will continue untilthe P – TCG contains only isolated nodes. The proposedalgorithm can be explained with the SOC listed inTable 6. The P – TCG of the SOC is shown in Fig 19aand designated as G(V,E). How the algorithm worksis described below.
In G(V, E), after examining the weights of theeach node it can be found that M 3 be the node havingmaximum weight. So, M 3 will be considered first. LetB1 and B2 be the two BIST circuits that are available.So, M 3 can be assigned to any of them. Let M 3 beassigned to B1. During this time (time to test M 3) theother BIST circuit B2 is ready to test other cores. But,among the M 1, M 2, M 4, M 5, and M 6, B2 can beallocated to a core if and only if the total powerdissipation of the allocated core and the M 3 does notexceed the maximum power dissipation limit. Thus thenodes which are adjacent to M 3 can only be assignedto B2. In Fig 19a both M 1 and M 6 are adjacent toM 3. Between M 1 and M 6, M 6 has a larger testtime. So, M 6 is assigned to B2. The test time for theM 6 is 1000. Thus during this time limit (i.e., 0 to 1000test time) M 3 and M 6 will be tested concurrently byB1 and B2 respectively. After 1000 time unit, B2 willfinish its job while B1 will be still busy with M 3. Thusafter 1000 time unit, we can assign another core to B2under the maximum power dissipation limit. This leadsto minimize the total test time. For that we delete M 6and all the edges incident on M 6 form G to obtain anew subgraph G1 of G. In G1, a new weight isassigned to M 3 by subtracting the weight of the M3from weight of M 6 G. The resultant subgraph G1 thusobtained is shown in Fig 19b. As the weight of the M 3in G1 is not zero (i.e., B1 is still operating), we againconsider the node M 3 and find the adjacent nodeof M 3 having maximum weight. In Fig 19b node M 1is only connected to M 3. So, M 1 is now assigned toB2. After that, we delete the node M 1 and all theedges incident on M 1 from G1 to obtain the subgraphG2 of G1. In G2, we subtract the weight of the M 3form the weight of M 1 to obtain a new weight forM 3. The subgraph G2 thus generated is shown inFig 19c.
In G2, it is observed that both the node M 2 andM 3 become isolated nodes and so, they cannot betested concurrently with the other cores. So, aftercompleting the testing of M 3, B1 (or B2) can beallocated to M 2. The other BIST circuit B2 (or B1)will be ideal during the testing time of M 2. Both thenodes are then deleted from G2. The subgrah G3 of G2thus obtained is shown in Fig 19d. In G3, so far nonodes are scheduled. So, the node M 5 (havingmaximum weight in G3) is considered first and assigned
TABLE 6: Data for an example SOC containingmemory cores
core Test maximum powercycles dissipation (mw)
Ml 800 20
M2 600 80
M3 2000 60
M4 1500 50
M5 1200 50
M6 1000 20
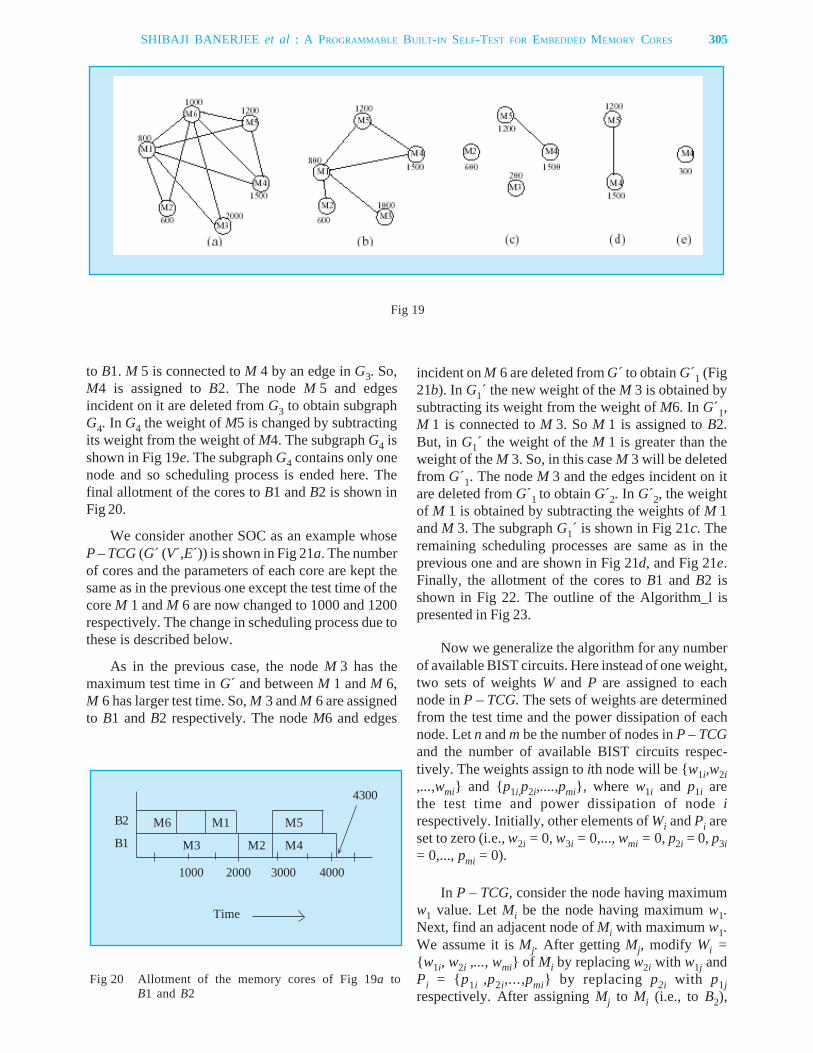
to B1. M 5 is connected to M 4 by an edge in G3. So,M4 is assigned to B2. The node M 5 and edgesincident on it are deleted from G3 to obtain subgraphG4. In G4 the weight of M5 is changed by subtractingits weight from the weight of M4. The subgraph G4 isshown in Fig 19e. The subgraph G4 contains only onenode and so scheduling process is ended here. Thefinal allotment of the cores to B1 and B2 is shown inFig 20.
We consider another SOC as an example whoseP – TCG (G´ (V´,E´)) is shown in Fig 21a. The numberof cores and the parameters of each core are kept thesame as in the previous one except the test time of thecore M 1 and M 6 are now changed to 1000 and 1200respectively. The change in scheduling process due tothese is described below.
As in the previous case, the node M 3 has themaximum test time in G´ and between M 1 and M 6,M 6 has larger test time. So, M 3 and M 6 are assignedto B1 and B2 respectively. The node M6 and edges
incident on M 6 are deleted from G´ to obtain G´1 (Fig21b). In G1´ the new weight of the M 3 is obtained bysubtracting its weight from the weight of M6. In G´1,M 1 is connected to M 3. So M 1 is assigned to B2.But, in G1´ the weight of the M 1 is greater than theweight of the M 3. So, in this case M 3 will be deletedfrom G´1. The node M 3 and the edges incident on itare deleted from G´1 to obtain G´2. In G´2, the weightof M 1 is obtained by subtracting the weights of M 1and M 3. The subgraph G1´ is shown in Fig 21c. Theremaining scheduling processes are same as in theprevious one and are shown in Fig 21d, and Fig 21e.Finally, the allotment of the cores to B1 and B2 isshown in Fig 22. The outline of the Algorithm_l ispresented in Fig 23.
Now we generalize the algorithm for any numberof available BIST circuits. Here instead of one weight,two sets of weights W and P are assigned to eachnode in P – TCG. The sets of weights are determinedfrom the test time and the power dissipation of eachnode. Let n and m be the number of nodes in P – TCGand the number of available BIST circuits respec-tively. The weights assign to ith node will be {w1i,w2i,...,wmi} and {p1i,p2i,....,pmi}, where w1i and p1i arethe test time and power dissipation of node irespectively. Initially, other elements of Wi and Pi areset to zero (i.e., w2i = 0, w3i = 0,..., wmi = 0, p2i = 0, p3i= 0,..., pmi = 0).
In P – TCG, consider the node having maximumw1 value. Let Mi be the node having maximum w1.Next, find an adjacent node of Mi with maximum w1.We assume it is Mj. After getting Mj, modify Wi ={w1i, w2i ,..., wmi} of Mi by replacing w2i with w1j andPi = {p1i ,p2i,...,pmi} by replacing p2i with p1jrespectively. After assigning Mj to Mi (i.e., to B2),
Fig 19
Fig 20 Allotment of the memory cores of Fig 19a toB1 and B2
Time
B2
B1M6 M1 M5
M3 M2 M4
4300
1000 2000 3000 4000
SHIBAJI BANERJEE et al : A PROGRAMMABLE BUILT-IN SELF-TEST FOR EMBEDDED MEMORY CORES 305
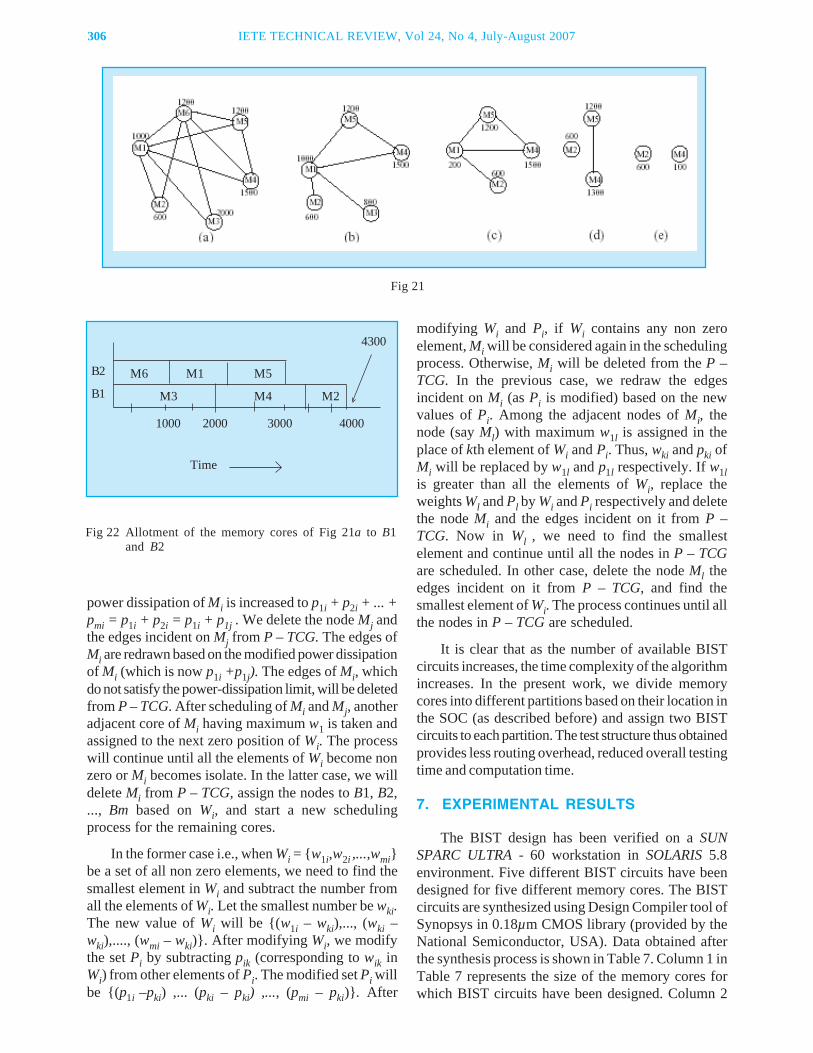
306 IETE TECHNICAL REVIEW, Vol 24, No 4, July-August 2007
power dissipation of Mi is increased to p1i + p2i + ... +pmi = p1i + p2i = p1i + p1j . We delete the node Mj andthe edges incident on Mj from P – TCG. The edges ofMi are redrawn based on the modified power dissipationof Mi (which is now p1i +p1j). The edges of Mi, whichdo not satisfy the power-dissipation limit, will be deletedfrom P – TCG. After scheduling of Mi and Mj, anotheradjacent core of Mi having maximum w1 is taken andassigned to the next zero position of Wi. The processwill continue until all the elements of Wi become nonzero or Mi becomes isolate. In the latter case, we willdelete Mi from P – TCG, assign the nodes to B1, B2,..., Bm based on Wi, and start a new schedulingprocess for the remaining cores.
In the former case i.e., when Wi = {w1i,w2i ,...,wmi}be a set of all non zero elements, we need to find thesmallest element in Wi and subtract the number fromall the elements of Wi. Let the smallest number be wki.The new value of Wi will be {(w1i – wki),..., (wki –wki),...., (wmi – wki)}. After modifying Wi, we modifythe set Pi by subtracting pik (corresponding to wik inWi) from other elements of Pi. The modified set Pi willbe {(p1i –pki) ,... (pki – pki) ,..., (pmi – pki)}. After
modifying Wi and Pi, if Wi contains any non zeroelement, Mi will be considered again in the schedulingprocess. Otherwise, Mi will be deleted from the P –TCG. In the previous case, we redraw the edgesincident on Mi (as Pi is modified) based on the newvalues of Pi. Among the adjacent nodes of Mi, thenode (say Ml) with maximum w1l is assigned in theplace of kth element of Wi and Pi. Thus, wki and pki ofMi will be replaced by w1l and p1l respectively. If w1lis greater than all the elements of Wi, replace theweights Wl and Pl by Wi and Pi respectively and deletethe node Mi and the edges incident on it from P –TCG. Now in Wl , we need to find the smallestelement and continue until all the nodes in P – TCGare scheduled. In other case, delete the node Ml theedges incident on it from P – TCG, and find thesmallest element of Wi. The process continues until allthe nodes in P – TCG are scheduled.
It is clear that as the number of available BISTcircuits increases, the time complexity of the algorithmincreases. In the present work, we divide memorycores into different partitions based on their location inthe SOC (as described before) and assign two BISTcircuits to each partition. The test structure thus obtainedprovides less routing overhead, reduced overall testingtime and computation time.
7. EXPERIMENTAL RESULTS
The BIST design has been verified on a SUNSPARC ULTRA - 60 workstation in SOLARIS 5.8environment. Five different BIST circuits have beendesigned for five different memory cores. The BISTcircuits are synthesized using Design Compiler tool ofSynopsys in 0.18µm CMOS library (provided by theNational Semiconductor, USA). Data obtained afterthe synthesis process is shown in Table 7. Column 1 inTable 7 represents the size of the memory cores forwhich BIST circuits have been designed. Column 2
Fig 21
Fig 22 Allotment of the memory cores of Fig 21a to B1and B2
Time
B2
B1M6 M1 M5
M3 M4 M2
4300
1000 2000 3000 4000
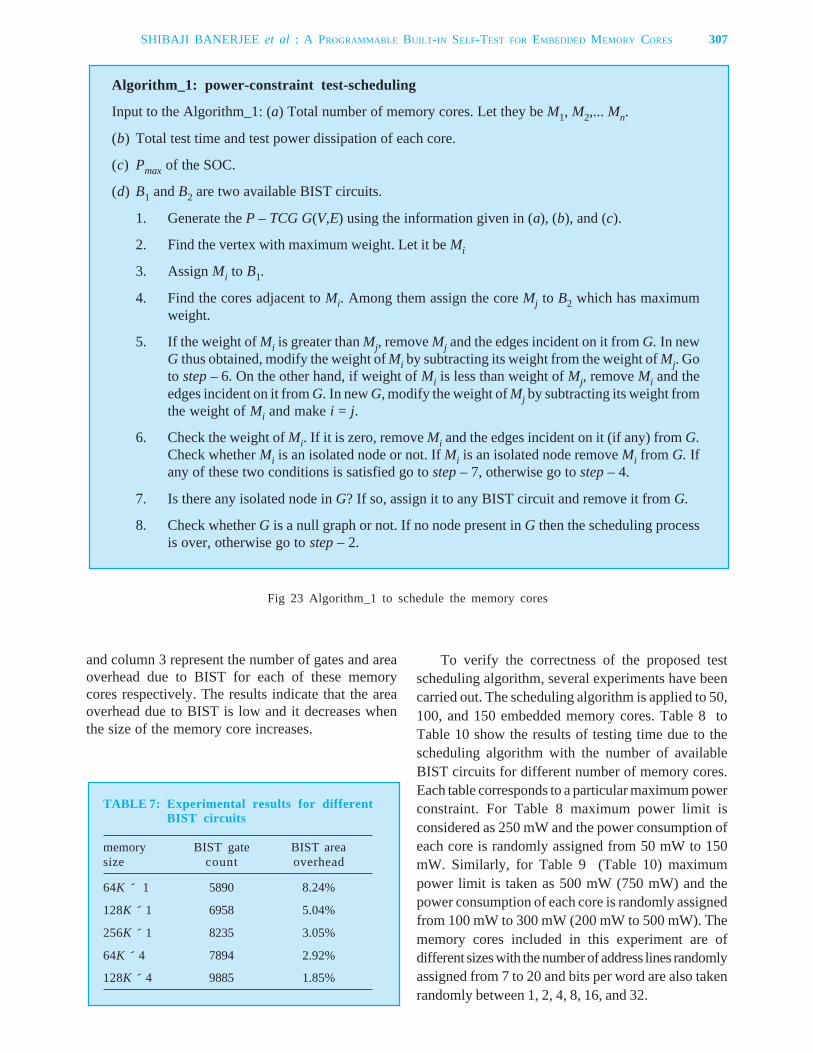
and column 3 represent the number of gates and areaoverhead due to BIST for each of these memorycores respectively. The results indicate that the areaoverhead due to BIST is low and it decreases whenthe size of the memory core increases.
To verify the correctness of the proposed testscheduling algorithm, several experiments have beencarried out. The scheduling algorithm is applied to 50,100, and 150 embedded memory cores. Table 8 toTable 10 show the results of testing time due to thescheduling algorithm with the number of availableBIST circuits for different number of memory cores.Each table corresponds to a particular maximum powerconstraint. For Table 8 maximum power limit isconsidered as 250 mW and the power consumption ofeach core is randomly assigned from 50 mW to 150mW. Similarly, for Table 9 (Table 10) maximumpower limit is taken as 500 mW (750 mW) and thepower consumption of each core is randomly assignedfrom 100 mW to 300 mW (200 mW to 500 mW). Thememory cores included in this experiment are ofdifferent sizes with the number of address lines randomlyassigned from 7 to 20 and bits per word are also takenrandomly between 1, 2, 4, 8, 16, and 32.
Algorithm_1: power-constraint test-scheduling
Input to the Algorithm_1: (a) Total number of memory cores. Let they be M1, M2,... Mn.
(b) Total test time and test power dissipation of each core.
(c) Pmax of the SOC.
(d) B1 and B2 are two available BIST circuits.
1. Generate the P – TCG G(V,E) using the information given in (a), (b), and (c).
2. Find the vertex with maximum weight. Let it be Mi
3. Assign Mi to B1.
4. Find the cores adjacent to Mi. Among them assign the core Mj to B2 which has maximumweight.
5. If the weight of Mi is greater than Mj, remove Mj and the edges incident on it from G. In newG thus obtained, modify the weight of Mi by subtracting its weight from the weight of Mj. Goto step – 6. On the other hand, if weight of Mi is less than weight of Mj, remove Mi and theedges incident on it from G. In new G, modify the weight of Mj by subtracting its weight fromthe weight of Mi and make i = j.
6. Check the weight of Mi. If it is zero, remove Mi and the edges incident on it (if any) from G.Check whether Mi is an isolated node or not. If Mi is an isolated node remove Mi from G. Ifany of these two conditions is satisfied go to step – 7, otherwise go to step – 4.
7. Is there any isolated node in G? If so, assign it to any BIST circuit and remove it from G.
8. Check whether G is a null graph or not. If no node present in G then the scheduling processis over, otherwise go to step – 2.
Fig 23 Algorithm_1 to schedule the memory cores
TABLE 7: Experimental results for differentBIST circuits
memory BIST gate BIST areasize count overhead
64K 1 5890 8.24%
128K 1 6958 5.04%
256K 1 8235 3.05%
64K 4 7894 2.92%
128K 4 9885 1.85%
SHIBAJI BANERJEE et al : A PROGRAMMABLE BUILT-IN SELF-TEST FOR EMBEDDED MEMORY CORES 307
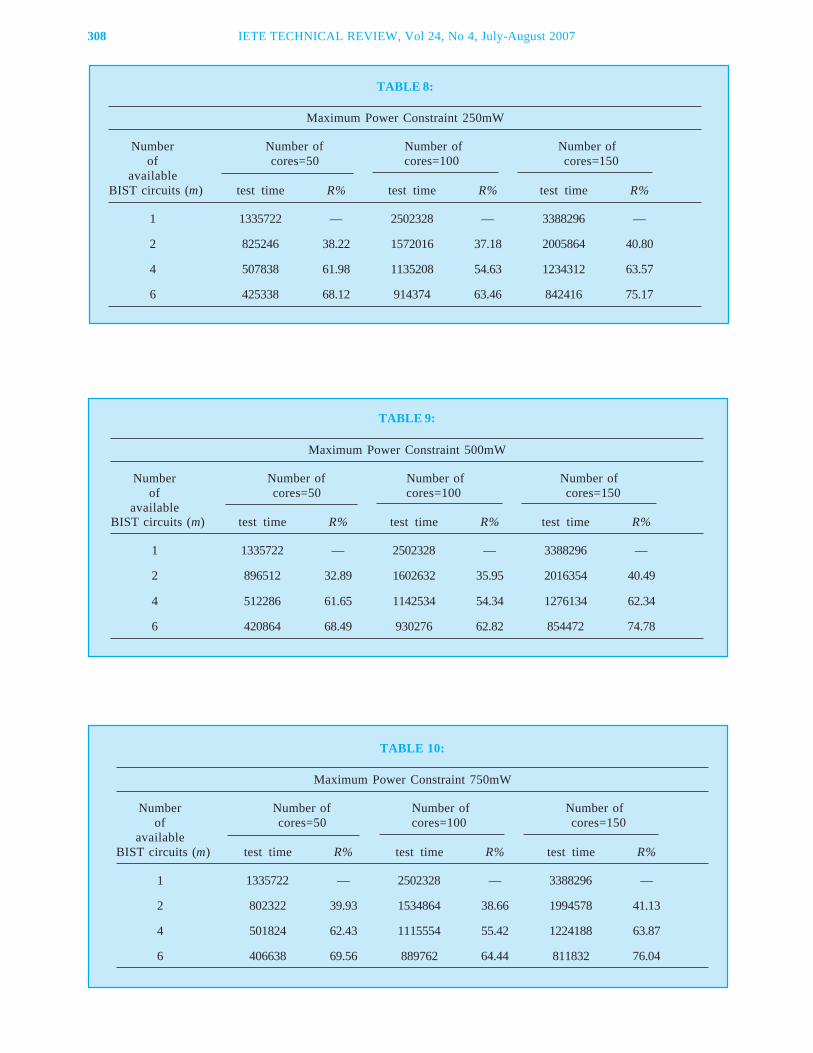
308 IETE TECHNICAL REVIEW, Vol 24, No 4, July-August 2007
TABLE 8:
Maximum Power Constraint 250mW
Number Number of Number of Number ofof cores=50 cores=100 cores=150
availableBIST circuits (m) test time R% test time R% test time R%
1 1335722 — 2502328 — 3388296 —
2 825246 38.22 1572016 37.18 2005864 40.80
4 507838 61.98 1135208 54.63 1234312 63.57
6 425338 68.12 914374 63.46 842416 75.17
TABLE 9:
Maximum Power Constraint 500mW
Number Number of Number of Number ofof cores=50 cores=100 cores=150
availableBIST circuits (m) test time R% test time R% test time R%
1 1335722 — 2502328 — 3388296 —
2 896512 32.89 1602632 35.95 2016354 40.49
4 512286 61.65 1142534 54.34 1276134 62.34
6 420864 68.49 930276 62.82 854472 74.78
TABLE 10:
Maximum Power Constraint 750mW
Number Number of Number of Number ofof cores=50 cores=100 cores=150
availableBIST circuits (m) test time R% test time R% test time R%
1 1335722 — 2502328 — 3388296 —
2 802322 39.93 1534864 38.66 1994578 41.13
4 501824 62.43 1115554 55.42 1224188 63.87
6 406638 69.56 889762 64.44 811832 76.04
Before applying the scheduling algorithm, we firstdivide memory cores into different partitions based onthe number of available BIST circuits. Then we allottwo BIST circuits to each partition. Memory cores aregrouped randomly such that the difference in numberof cores between any two partitions can be at mostone. For example, when the number of available BISTcircuits and total number of memory cores are 6 and100 respectively, the memory cores will be dividedinto 3 partitions. The number of cores in each partitionwill be 33, 33, and 34. The partitions thus created arebalanced with respect to each other. Among the 6available BIST circuits, we assign 2 of them to eachpartition and schedule them by using the proposedalgorithm.
When the number of available BIST circuit is one,cores will be tested sequentially one after another andthe test time can be represented by Tmax. We candefine the test time reduction factor (R) as,
Tmax – test-time-with m BIST circuitsR = ¾ ¾ ¾ ¾ ¾ ¾ ¾ ¾ ¾ ¾ ¾ ¾ ¾ ¾ 100%
Tmax
8. CONCLUSIONS
The paper demonstrates that for SOCs compris-ing of SRAMs and DRAMs the proposed, algorithmcan be used to test them. For DRAMs it can detect allNPSFs, SAFs, TFs, and CFs. For SRAMs it candetect all SAFs, TFs, and CFs. A programmable BISTcircuit is proposed, which provides good flexibility onboth test algorithms and memory types. It supportsdifferent types of test algorithms and memory coresaccording to the user choice. The user needs to programthe BIST before testing of a particular memory corewith a particular test algorithm. Today, an SOC mayconsist of tens to hundreds of embedded memories.Using a dedicated BIST for each of them is not afeasible solution due to large area overhead. So, sharingof BIST is needed for these types of memories. Apower-constraint test scheduling algorithm is alsoproposed to reduce overall testing time. Theexperimental results verify the above claims.
REFERENCES
1. Semiconductor Industry Association. Int.Technology Roadmap for Semicconductors, http://public.itrs.net/files/1999_51A. Roadmap/Home.htm.
2. Shankar Hemmady, Tom Anderson, & YervantZorian, Verification and Testing of Embedded Cores,In Proc of Design SuperCon, January 1997, pp s122-1-19.
3. K J Lin & C W Wu, PMBC: a programmable BISTcompiler for memory cores, In Proc of IEEE Int,Workshop on Testing Embedded Core-basedSystem Chips, April 1999, pp P2.1-P2.6.
4. Kuo-Liang Cheng, Chia-Ming Hsueh, Jing-RengHuang, Jen-Chieh Yeh, Chih-Tsun Huang & Cheng-Wen Wu, Automatic generation of memory built-inself-test cores for system-on-chip, In Proc of AsianTest Symposium, 19-21 Nov 2001, pp 91-96.
5 A J van de Goor, Testing Semiconductor Memories:Theory and Practice, John Wiley and Sons,CHicEester, England, 1998.
6. J P Hayes, Testing memories for single-cell patternsensitive fault, IEEE Transactions on Computers,1980, vol 29, pp 249-254.
7. K K Saluja & K Kinoshita, Test pattern generationfor API faults in RAM, IEEE Transactions onComputers. March 1985, vol 34, p 284-287.
8. Y Zorian, S Dey & M J Rodgers, Test of futuresystem-on-chips, In Proc of IETE/ACMInternational Conference on Computer AidedDesign, 5-9 Nov 2000, pp 392-398.
9. P Camurati, P Prinetto, M S Reorda, S Barbagallo, ABurri & D Medina, Industrial BIST of embeddedRAMs, IEEE Design and Test of Computers, 1995,vol 12, Issue 3, p. 86.
10. K Zarrineh & S J Upadhyaya, On programmablememory built-in self test architectures, In Proc ofDesign, Automation and Test in Europe Conferenceand Exhibition, 9-12 March 1990, pp 708-713.
11. Po-Chang Tsai, Sying-Jyan Wang & Feng-MingCharig, TSM-based programmable memory BISTwith macro command, In Proc of IEEE InternationalWorkshop on Memory Technology, Design, andTesting, 3-5 Aug. 2005, pp. 72-77.
12. Chih-Tsun Huang, Jing-Reng Huang, Chi-Feng Wu,Cheng-Wen Wu & Tsin-Yuan Chang, Aprogrammable BIST core for embedded DRAM,IEEE Design and Test of Computers, Jan-March1999, vol 16, Issue 1, pp 59-70.
13. H Koike, T Takeshima & M Takada, A BIST schemeusing microprogram ROM for large capacitymemories, In Proc of International Test Conference,10-14 Sept 1990, pp 815-822.
14. I Schanstra, D Lukita, A J van de Goor, K Veelenturf,& P J van Wijnen, Semiconductor manufacturingprocess monitoring using built-in self-test forembedded memories, In Proc of International TestConference, 18-23 Oct 1998, pp 872-881.
15. R Rajsuman, Testing a system-on-a-chip with em-bedded microprocessor, In Proc of InternationalTest Conference, 28-30 Sept 1997, pp 499-508.
16. Bai Hong Fang, Qiang Xu, & N Nicolici, Hardware/software co-testing of embedded memories incomplex SOCs, In Proc of International Conferenceon Computer Aided Design, 9-13 Nov. 2003, pp 599-605.
SHIBAJI BANERJEE et al : A PROGRAMMABLE BUILT-IN SELF-TEST FOR EMBEDDED MEMORY CORES 309
310 IETE TECHNICAL REVIEW, Vol 24, No 4, July-August 2007
17. Chin-Lung Su, Rei-Fu Huang, & Cheng-Wen Wu, Aprocessor-based built-in self-repair design forembedded memories, In Proc of Asian TestSymposium, 16-19 Nov 2003, pp 366-371.
18. J Dreibelbis, J Barth, H Kalter & R Kho, Processor-based built-in self-test for embedded DRAM, IEEEJournal of Solid-State Circuits, Nov 1998, vol33(11), p 1731.
19. Ching-Hong Tsai & Cheng-Wen Wu, Processor-programmable memory BIST for bus-connectedembedded memories, In Proc of Asia and SouthPacific Design Automation Conference, 30 Jan-2Feb 2001, pp 325-330.
20. C A Papachristou, F. Martin & M Nourani,Microprocessor based testing for core-basedsystem on chip, In Proc of Design AutomationConference, 21-25 June 1999, pp 586-591.
21. Kuo-Liang Chen, Ming-Fu Tsai & Cheng-Wen Wu,Efficient Neighborhood Pattern-Sensitive Fault TestAlgorithm for Semiconductor Memories, In Proc ofIEEE VLSI Test Symgosium, 29 May 2001, pp 225-230.
22. S Boutobza, M Nicolaidis, K M Lamara & A Costa,Programmable memory BIST, In Proc ofInternational Test Conference, 2005, pp 1155-1164.
23. Said Hamdioui & Georgi Gaydadjiev, Futurechallenges in memory testing, citeseer.ist.psu.edu/649203.html.
24. D Zhao & S Upadhyaya, Dynamically partitionedtest scheduling with adaptive TAM configurationfor power-constrained SoC testing, IEEETransactions on Computer-Aided Design ofIntegrated Circuits and Systems, June 2005, vol 24,Issue 6, pp 956-965.
25. M Nourani & C Papachristou, An ILP formulation tooptimize test access mechanism in system-on-chiptesting, In Proc of International Test Conference, 3-5 Oct 2000, pp 902-910.
26. Vikram Iyengar, Krishnendhu Chakrabarty, E JMarinissen, Test Wrapper and Test AccessMechanism Co-optimization for System-on-chip, inJournal of Electronic Testing: Theory andApplications, April 2002, vol 18, pp 213-230.
27. Sandeep Koranne & Vishal Suhas Choudhary,Formulation of SOC Test Scheduling as a NetworkTransportation Problem, In Proc of Design,Automation and Test in Europe Conference andExhibition, 4-8 March 2002, p 1125.
28. Yu Huang, Wu-Tung Cheng, Chien-Chung Tsai,Omer Samman, Yahya Zaidan, & Sudhakar M Reddy,Resource Allocation and Test Scheduling forConcurrent Test of Core-Based SOC Design, Nov2001, pp 361-366.
29. V Iyengar, K Chakrabarty, & E J Marinissen, Onusing rectangle packing for SOC wrapper/TAM co-optimization, In Proc of IEEE VLSI Test Symposium,28 April-2 May 2002, pp 253-258.
30. S K Goel & E J Marinissen, Effective and efficienttest architecture design for SOCs, In Proc ofInternational Test Conference, 7-10 Oct. 2002, pp529 538.
31. K Chakrabarty, Design of Systein-on-a-Chip TestAccess Architectures using Integer LinearProgramming, In Proceedings IEEE VLSI TestSymposium (VTS), 2000, pp 127-134.
32. K Chakrabarty, Test Scheduling for Core-BasedSystems Using Mixed-Integer Linear Programming,In Transactions on Computer-Aided Design, Oct2000, vol 19, pp 1163-1174.
33. Yu Huang, Sudhakar M. Reddy, Wu-Tung Cheng,Paul Reuter, Nilanjan Mukherjee, Chein-Chung Tsai,Omer Samman & Yahya Zaidan, Optimal CoreWrapper Width Selection and SOC Test SchedulingBased on 3-D Bin Packaging Algorithm, In Proc ofInternational Test Conference, Oct 2002, pp 74-82.
34. Wei-Lun Wang, March based memory core testscheduling for SOC, In Proc of Asian TestSymposium, 15-17 Nov 2004, pp. 248-253.
35. M L Bushnell & V D Agrawal, Essentials ofElectronic Testing for Digital, Memory, and Mixed-Signal VLSI Circuits, Kluwer Academic Publishers,Boston/Dordrecht/London, 2000.
36. S Hamdioui, Z Al-Ars & A J van de Goor, Testingstatic and dynamic faults in random accessmemories, In Proc of IEEE VLSI Test Symposium, 28April-2 May 2002 pp 395-400.
37. M L Bushnell & V D Agrawal, Essentials ofElectronic Testing for Digital, Memory and Mixed-Signal VLSI Circuits, Springer, Berline, Germany,2000.
38. A J van de Goor & I B S Tlili, A systematic methodfor modifying inarch tests for bit-oriented memoriesinto tests for word-oriented memories, IEEETransactions on Computers, Oct 2003, vol 52(10), p1320.
39. G L Craig & C R Kime, Pseudo-exhaustive adjacencytest: A BIST approach for stuck-open faults, In Procof International Test Conference (ITC), 1985, pp126-137.
40. W Wang & S K Gupta, Weighted random robustpath delay testing of synthesized multilevel circuits,In Proc of VLSI Test Symposium (VTS), 1994, pp 291-297.
41. I P Shaik & M L Bushnell, A graph approach to DFThardware placement for robust delay fault BIST, InProc of International Conference on VLSI Design,1995, pp 177-182.
42. I Voyiatzis, A Paschalis, D Nikolos & C Halatsis,An efficient built-in self test method for robustpath delay fault testing, Journal of ElectronicTesting : Theory and Applications (JETTA), 1996pp 219-222.
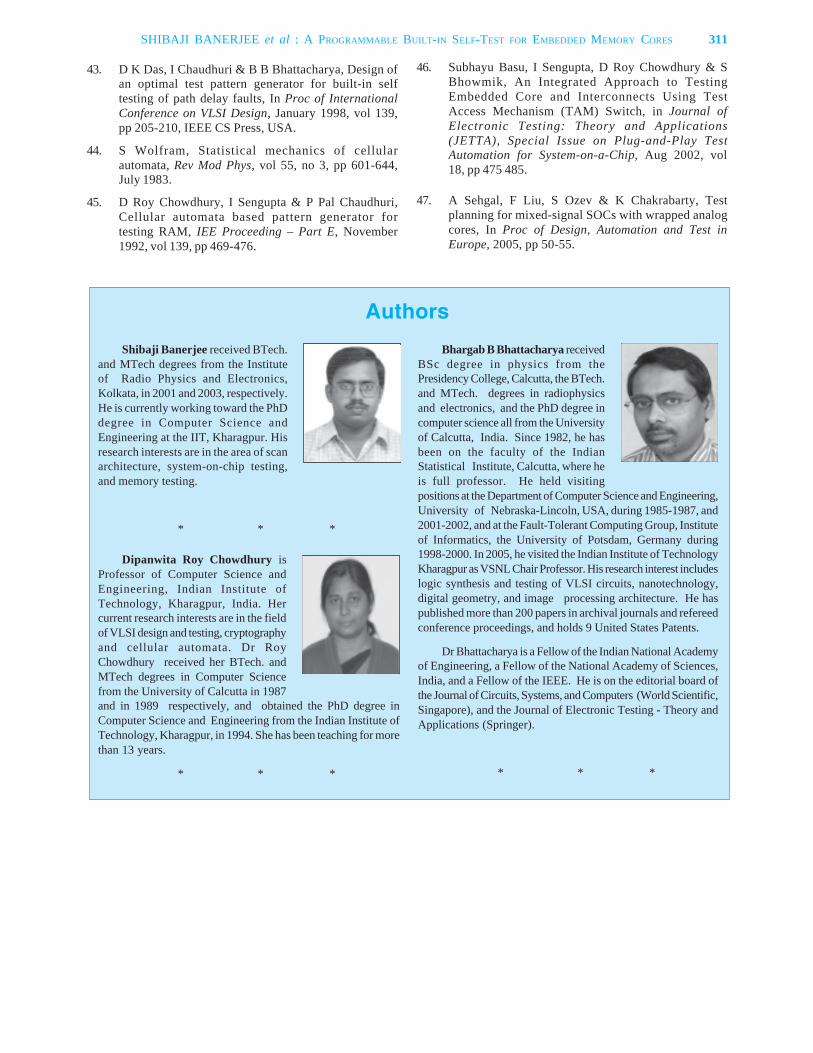
43. D K Das, I Chaudhuri & B B Bhattacharya, Design ofan optimal test pattern generator for built-in selftesting of path delay faults, In Proc of InternationalConference on VLSI Design, January 1998, vol 139,pp 205-210, IEEE CS Press, USA.
44. S Wolfram, Statistical mechanics of cellularautomata, Rev Mod Phys, vol 55, no 3, pp 601-644,July 1983.
45. D Roy Chowdhury, I Sengupta & P Pal Chaudhuri,Cellular automata based pattern generator fortesting RAM, IEE Proceeding – Part E, November1992, vol 139, pp 469-476.
46. Subhayu Basu, I Sengupta, D Roy Chowdhury & SBhowmik, An Integrated Approach to TestingEmbedded Core and Interconnects Using TestAccess Mechanism (TAM) Switch, in Journal ofElectronic Testing: Theory and Applications(JETTA), Special Issue on Plug-and-Play TestAutomation for System-on-a-Chip, Aug 2002, vol18, pp 475 485.
47. A Sehgal, F Liu, S Ozev & K Chakrabarty, Testplanning for mixed-signal SOCs with wrapped analogcores, In Proc of Design, Automation and Test inEurope, 2005, pp 50-55.
Shibaji Banerjee received BTech.and MTech degrees from the Instituteof Radio Physics and Electronics,Kolkata, in 2001 and 2003, respectively.He is currently working toward the PhDdegree in Computer Science andEngineering at the IIT, Kharagpur. Hisresearch interests are in the area of scanarchitecture, system-on-chip testing,and memory testing.
* * *
Dipanwita Roy Chowdhury isProfessor of Computer Science andEngineering, Indian Institute ofTechnology, Kharagpur, India. Hercurrent research interests are in the fieldof VLSI design and testing, cryptographyand cellular automata. Dr RoyChowdhury received her BTech. andMTech degrees in Computer Sciencefrom the University of Calcutta in 1987and in 1989 respectively, and obtained the PhD degree inComputer Science and Engineering from the Indian Institute ofTechnology, Kharagpur, in 1994. She has been teaching for morethan 13 years.
* * *
Authors
Bhargab B Bhattacharya receivedBSc degree in physics from thePresidency College, Calcutta, the BTech.and MTech. degrees in radiophysicsand electronics, and the PhD degree incomputer science all from the Universityof Calcutta, India. Since 1982, he hasbeen on the faculty of the IndianStatistical Institute, Calcutta, where heis full professor. He held visitingpositions at the Department of Computer Science and Engineering,University of Nebraska-Lincoln, USA, during 1985-1987, and2001-2002, and at the Fault-Tolerant Computing Group, Instituteof Informatics, the University of Potsdam, Germany during1998-2000. In 2005, he visited the Indian Institute of TechnologyKharagpur as VSNL Chair Professor. His research interest includeslogic synthesis and testing of VLSI circuits, nanotechnology,digital geometry, and image processing architecture. He haspublished more than 200 papers in archival journals and refereedconference proceedings, and holds 9 United States Patents.
Dr Bhattacharya is a Fellow of the Indian National Academyof Engineering, a Fellow of the National Academy of Sciences,India, and a Fellow of the IEEE. He is on the editorial board ofthe Journal of Circuits, Systems, and Computers (World Scientific,Singapore), and the Journal of Electronic Testing - Theory andApplications (Springer).
* * *
SHIBAJI BANERJEE et al : A PROGRAMMABLE BUILT-IN SELF-TEST FOR EMBEDDED MEMORY CORES 311
313
Paper No 126-E; Copyright © 2007 by the IETE.
IETE Technical ReviewVol 24, No 4, July-August 2007, pp 313-321
Space Enabled ICT Applications for RuralUpliftment – Experience of Participatory
Watershed DevelopmentP G DIWAKAR
Head, RRSSC, ISRO, Banashankari, 40th Main, Eashwar Nagar(Behind PSTI), Bangalore 560 070, India.
AND
V JAYARAMAN, FIETE
Director, EOS and NNRMS-RRSSC, ISRO Hq, Anthariksha Bhavan,New BEL Road, Bangalore 560 094, India.
Earth Observation (EO) inputs on various natural resources parameters are effectivelyused for integrated land and water resources development at grass roots helping inenhancing the productivity levels in dryland areas. EO inputs and a judicious mixGeographical Information System (GIS) and Management Information System (MIS) hashelped in characterization, prioritization, developmental plan preparation, generation ofimplementation strategies (with peoples’ participation), concurrent project monitoring andimpact assessment at various stages of implementation. The innovativeness of this studylies in the infusion of modern technologies in the form of providing EO-based inputs onnatural resources for development, simple-to-use information system with MIS/GIS in locallanguage, reporting and monitoring through simple client-server solutions, participation ofpeople, experts, Local Government, NGOs, project monitoring group and other stakeholderswith one clear objective of achieving sustainable development. This innovative method ofproject implementation and monitoring has brought about significant impacts on the naturalresources conservation and positive trends in livelihood condition of the people.
fed areas experience high degree of land degradationand suffer from low and uncertain rainfall, poor soilfertility, sparse vegetation cover, low productivity, lackof infrastructure and so on. Majority of the people ofthese areas have limited access to primary education,basic health care, clean drinking water, food and decentlivelihood conditions. Present day world has evolved aspecial focus on optimal management of land andwater resources with an approach of integrated missionof economic development, equity and environmentalsoundness, evolving multi-pronged strategy ofsustainable development with special focus on poorersections of the society and regenerating the erodednatural resource base. Watershed development isgradually evolving into a comprehensive program withsimultaneous pursuit of biophysical and ruraldevelopment objectives that promote rural livelihoods.
In order to make such programs more acceptableand simple, a set of innovative methods have beenevolved and field-tested with significant success. Useof EO data with respect to prespecified time frame,
INTRODUCTION
NATURAL resources conservation through watershed development programs with active
participation by communities has been practiced throughmany government-sponsored schemes. These programshave been executed by adopting conventional methodsacross the country. Such participatory approaches arefocused on mobilizing the farming community tocollectively take up measures to conserve the soil andwater resources in their respective watersheds. Theidea here is to adopt control mechanism to limit therunoff potential of the soil, based on terrain conditions,that ultimately drains to a common point by designinglocale specific approaches through communityparticipation. The green revolution that transformedagriculture in India did not significantly impact on rainfed agriculture in the arid and semi-arid tropical regions,which experience low agricultural productivity,degraded natural resources and poor people. The rain
INVITED PAPER

314 IETE TECHNICAL REVIEW, Vol 24, No 4, July-August 2007
image analysis, new software tools and geospatialdatabases for participatory watershed developmentprogram is well adapted in the ‘Sujala’ project beingimplemented in Karnataka state. Attempt has beenmade to use an optimal combination of earth observationinputs, field observations and Information Technologyfor planning in implementation, monitoring and impactassessment.
COMMUNITY BASED WATERSHEDDEVELOPMENT
Organization and societal issues have recentlybecome important subjects of GIS research(Obermeyer, 1998). Watershed development is a wellaccepted method of treating land through scientificmeans for sustainable development of natural resources.Watershed itself is a natural boundary connectingsimilar elevation points in the form of ridge tops whichis self contained polygon of natural resources which isamenable for conservation and protection. Differentmethods, suitable to locale specific conditions, havebeen practiced for ages across the world, that involvestreating land on a ridge-to-valley basis to restoreequitable use of soil and water resources in a giventerrain. It is a well known fact that any watersheddevelopment program poses varieties of challenges asthere are many stakeholders and players who areimportant for achieving success in implementation. Afew typical parameters considered while watersheddevelopment are: large extent of private land (belongingto farming community), common land (sharable by thevillage community), livestock, fuel and fodder areas,tanks and waterbodies, waterholding structures,farming community with land, landless labourers, infantsand so on. The newer techniques of image processing,extraction of natural resources information, using GISfor data integration and modeling, providing extract ofsuch processing in the form of land and water resourcesplans, IT tools for monitoring and impact assessmenthave made significant impacts in successfulimplementation of watershed development.
Watershed Development program
Sujala is a participatory watershed developmentprogramme, which is being implemented by Governmentof Karnataka with World Bank assistance in 5 districts,viz., Kolar, Tumkur, Chitradurga, Dharwad and Haveriof Karnataka State. The major objective of the projectis to improve the productive potential of degradedwatersheds in dry land areas and poverty alleviation ofrural community. The project is spread across 77 sub-watersheds covering an area of about 0.51 millionhectares and benefiting about 400,000 households.
This is a community driven program wherein villagepeople involve in participatory planning, implementationand maintenance of assets.
Geospatial inputs and IT solutions
Satellite Remote sensing inputs, GIS, a near real-time MIS solution and GIS solution for participatoryplanning are the core areas of technology utilisationfor resource mapping, database generation, analysisand information extraction for watershed planning,implementation and monitoring. In Sujala project, highresolution satellite data with a spatial resolution of 6meter has been utilised to generate maps on 1:12,500scale. Typical areas of technology utilization under theproject are
• Watershed prioritization• Resources Inventory and Mapping• Land and Water resources action plan• Site selection for implementation• Web based Management information system
(MIS) solution• GIS based action plan development• Implementation of concurrent Monitoring• Impact Assessment• Post project Evaluation• Run off estimation by imperial methods.
EO DATA FOR DEVELOPMENTALPLANNING
EO data from Indian Remote Sensing satellite hasproved to be very effective in similar such programsearlier. However, with the availability of high resolutionimages from space platforms, RESOURCESAT andCARTOSAT, there has been a significant shift in theway the technology is used for monitoring. LISS 4multispectral images (5.8 m) and high spatial resolutionCARTOSAT 1 PAN (2.5 m) could be effectivelyused to carry out an on-line tracking of the variousdevelopmental works effectively and accurately. It israre that such high resolution image data is used, notonly for facilitating the farming community to take uptechnically sound decisions for watershed development,but also for monitoring such implementations. Theusage of EO data has been facilitated by adoptingspecial product generation techniques, like, image fusion,natural color composites, landuse classification, changedetection and other thematic layers creation to aid inlocale specific action plan preparation. Geospatial layersat high resolution is created and integrated withcadastral/parcel data to facilitate proper planning of
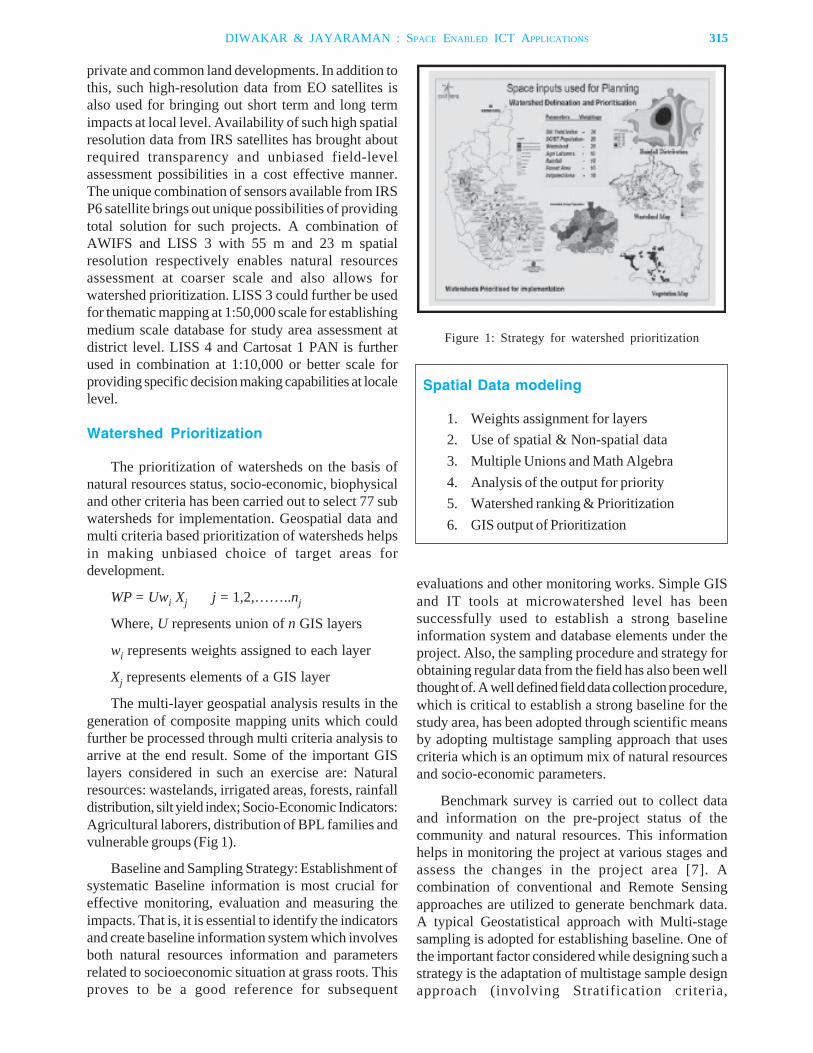
private and common land developments. In addition tothis, such high-resolution data from EO satellites isalso used for bringing out short term and long termimpacts at local level. Availability of such high spatialresolution data from IRS satellites has brought aboutrequired transparency and unbiased field-levelassessment possibilities in a cost effective manner.The unique combination of sensors available from IRSP6 satellite brings out unique possibilities of providingtotal solution for such projects. A combination ofAWIFS and LISS 3 with 55 m and 23 m spatialresolution respectively enables natural resourcesassessment at coarser scale and also allows forwatershed prioritization. LISS 3 could further be usedfor thematic mapping at 1:50,000 scale for establishingmedium scale database for study area assessment atdistrict level. LISS 4 and Cartosat 1 PAN is furtherused in combination at 1:10,000 or better scale forproviding specific decision making capabilities at localelevel.
Watershed Prioritization
The prioritization of watersheds on the basis ofnatural resources status, socio-economic, biophysicaland other criteria has been carried out to select 77 subwatersheds for implementation. Geospatial data andmulti criteria based prioritization of watersheds helpsin making unbiased choice of target areas fordevelopment.
WP = Uwi Xj j = 1,2,……..nj
Where, U represents union of n GIS layers
wi represents weights assigned to each layer
Xj represents elements of a GIS layer
The multi-layer geospatial analysis results in thegeneration of composite mapping units which couldfurther be processed through multi criteria analysis toarrive at the end result. Some of the important GISlayers considered in such an exercise are: Naturalresources: wastelands, irrigated areas, forests, rainfalldistribution, silt yield index; Socio-Economic Indicators:Agricultural laborers, distribution of BPL families andvulnerable groups (Fig 1).
Baseline and Sampling Strategy: Establishment ofsystematic Baseline information is most crucial foreffective monitoring, evaluation and measuring theimpacts. That is, it is essential to identify the indicatorsand create baseline information system which involvesboth natural resources information and parametersrelated to socioeconomic situation at grass roots. Thisproves to be a good reference for subsequent
evaluations and other monitoring works. Simple GISand IT tools at microwatershed level has beensuccessfully used to establish a strong baselineinformation system and database elements under theproject. Also, the sampling procedure and strategy forobtaining regular data from the field has also been wellthought of. A well defined field data collection procedure,which is critical to establish a strong baseline for thestudy area, has been adopted through scientific meansby adopting multistage sampling approach that usescriteria which is an optimum mix of natural resourcesand socio-economic parameters.
Benchmark survey is carried out to collect dataand information on the pre-project status of thecommunity and natural resources. This informationhelps in monitoring the project at various stages andassess the changes in the project area [7]. Acombination of conventional and Remote Sensingapproaches are utilized to generate benchmark data.A typical Geostatistical approach with Multi-stagesampling is adopted for establishing baseline. One ofthe important factor considered while designing such astrategy is the adaptation of multistage sample designapproach (involving Stratification criteria,
Spatial Data modeling
1. Weights assignment for layers2. Use of spatial & Non-spatial data3. Multiple Unions and Math Algebra4. Analysis of the output for priority5. Watershed ranking & Prioritization6. GIS output of Prioritization
Figure 1: Strategy for watershed prioritization
DIWAKAR & JAYARAMAN : SPACE ENABLED ICT APPLICATIONS 315
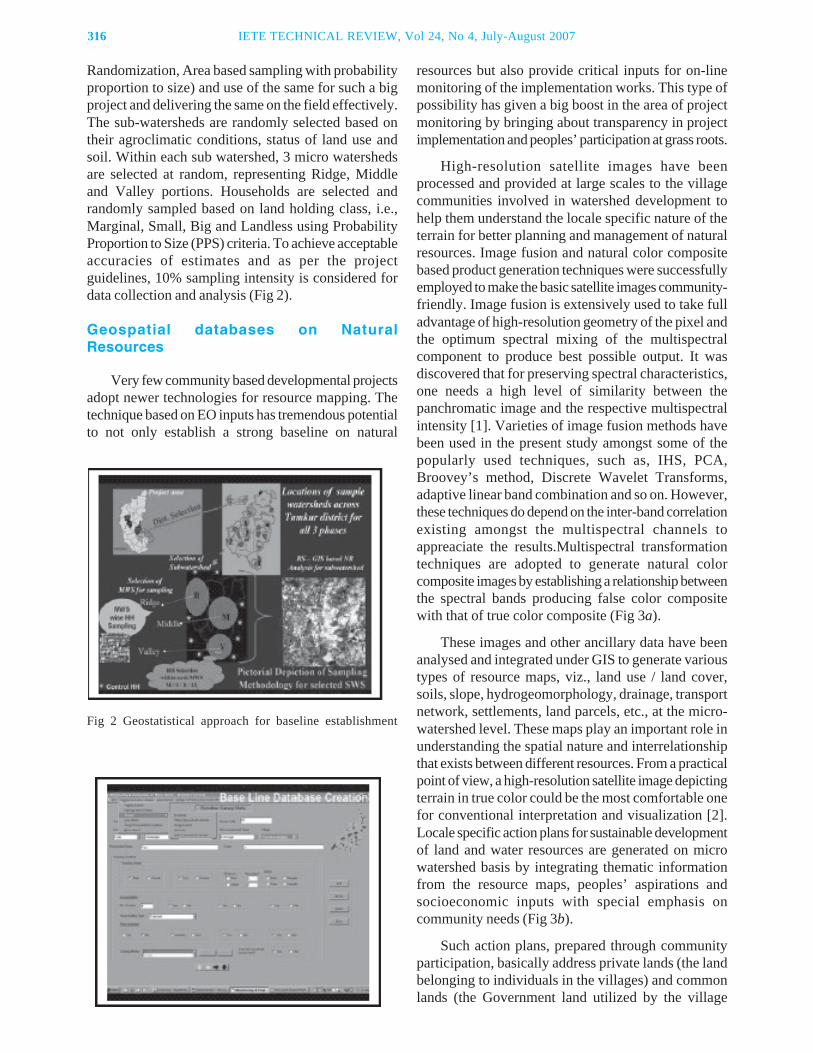
316 IETE TECHNICAL REVIEW, Vol 24, No 4, July-August 2007
Randomization, Area based sampling with probabilityproportion to size) and use of the same for such a bigproject and delivering the same on the field effectively.The sub-watersheds are randomly selected based ontheir agroclimatic conditions, status of land use andsoil. Within each sub watershed, 3 micro watershedsare selected at random, representing Ridge, Middleand Valley portions. Households are selected andrandomly sampled based on land holding class, i.e.,Marginal, Small, Big and Landless using ProbabilityProportion to Size (PPS) criteria. To achieve acceptableaccuracies of estimates and as per the projectguidelines, 10% sampling intensity is considered fordata collection and analysis (Fig 2).
Geospatial databases on NaturalResources
Very few community based developmental projectsadopt newer technologies for resource mapping. Thetechnique based on EO inputs has tremendous potentialto not only establish a strong baseline on natural
resources but also provide critical inputs for on-linemonitoring of the implementation works. This type ofpossibility has given a big boost in the area of projectmonitoring by bringing about transparency in projectimplementation and peoples’ participation at grass roots.
High-resolution satellite images have beenprocessed and provided at large scales to the villagecommunities involved in watershed development tohelp them understand the locale specific nature of theterrain for better planning and management of naturalresources. Image fusion and natural color compositebased product generation techniques were successfullyemployed to make the basic satellite images community-friendly. Image fusion is extensively used to take fulladvantage of high-resolution geometry of the pixel andthe optimum spectral mixing of the multispectralcomponent to produce best possible output. It wasdiscovered that for preserving spectral characteristics,one needs a high level of similarity between thepanchromatic image and the respective multispectralintensity [1]. Varieties of image fusion methods havebeen used in the present study amongst some of thepopularly used techniques, such as, IHS, PCA,Broovey’s method, Discrete Wavelet Transforms,adaptive linear band combination and so on. However,these techniques do depend on the inter-band correlationexisting amongst the multispectral channels toappreaciate the results.Multispectral transformationtechniques are adopted to generate natural colorcomposite images by establishing a relationship betweenthe spectral bands producing false color compositewith that of true color composite (Fig 3a).
These images and other ancillary data have beenanalysed and integrated under GIS to generate varioustypes of resource maps, viz., land use / land cover,soils, slope, hydrogeomorphology, drainage, transportnetwork, settlements, land parcels, etc., at the micro-watershed level. These maps play an important role inunderstanding the spatial nature and interrelationshipthat exists between different resources. From a practicalpoint of view, a high-resolution satellite image depictingterrain in true color could be the most comfortable onefor conventional interpretation and visualization [2].Locale specific action plans for sustainable developmentof land and water resources are generated on microwatershed basis by integrating thematic informationfrom the resource maps, peoples’ aspirations andsocioeconomic inputs with special emphasis oncommunity needs (Fig 3b).
Such action plans, prepared through communityparticipation, basically address private lands (the landbelonging to individuals in the villages) and commonlands (the Government land utilized by the village
Fig 2 Geostatistical approach for baseline establishment
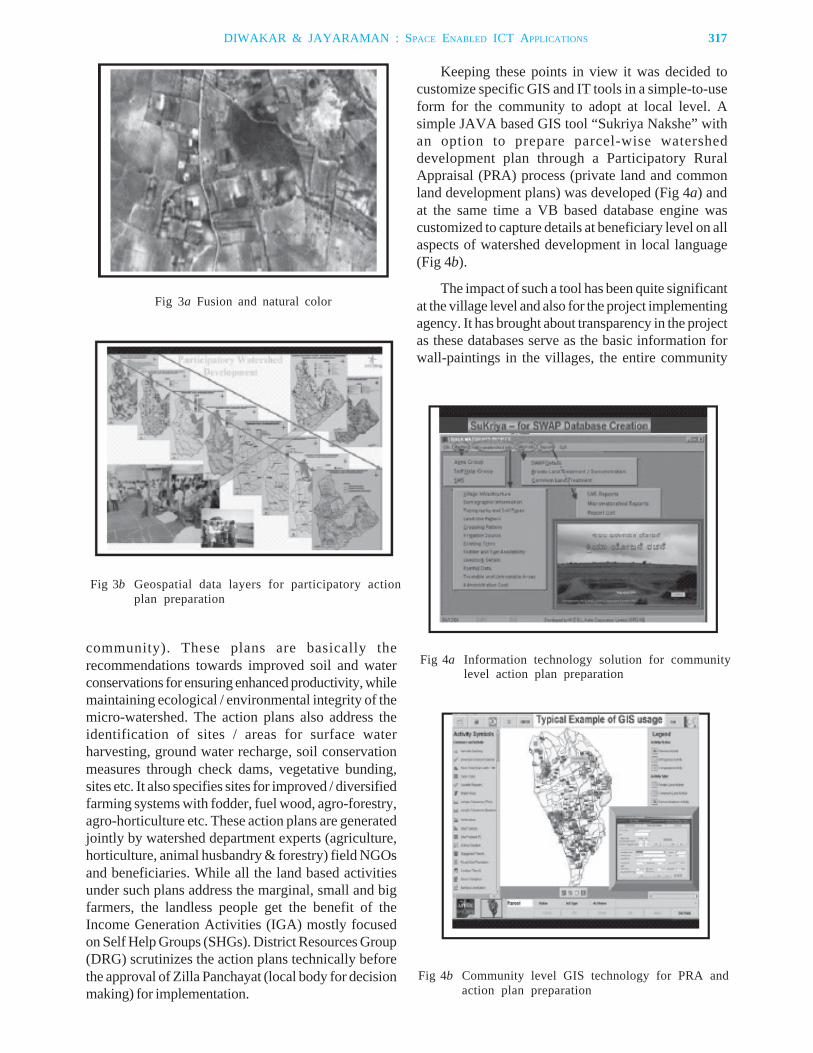
community). These plans are basically therecommendations towards improved soil and waterconservations for ensuring enhanced productivity, whilemaintaining ecological / environmental integrity of themicro-watershed. The action plans also address theidentification of sites / areas for surface waterharvesting, ground water recharge, soil conservationmeasures through check dams, vegetative bunding,sites etc. It also specifies sites for improved / diversifiedfarming systems with fodder, fuel wood, agro-forestry,agro-horticulture etc. These action plans are generatedjointly by watershed department experts (agriculture,horticulture, animal husbandry & forestry) field NGOsand beneficiaries. While all the land based activitiesunder such plans address the marginal, small and bigfarmers, the landless people get the benefit of theIncome Generation Activities (IGA) mostly focusedon Self Help Groups (SHGs). District Resources Group(DRG) scrutinizes the action plans technically beforethe approval of Zilla Panchayat (local body for decisionmaking) for implementation.
Keeping these points in view it was decided tocustomize specific GIS and IT tools in a simple-to-useform for the community to adopt at local level. Asimple JAVA based GIS tool “Sukriya Nakshe” withan option to prepare parcel-wise watersheddevelopment plan through a Participatory RuralAppraisal (PRA) process (private land and commonland development plans) was developed (Fig 4a) andat the same time a VB based database engine wascustomized to capture details at beneficiary level on allaspects of watershed development in local language(Fig 4b).
The impact of such a tool has been quite significantat the village level and also for the project implementingagency. It has brought about transparency in the projectas these databases serve as the basic information forwall-paintings in the villages, the entire community
Fig 3a Fusion and natural color
Fig 3b Geospatial data layers for participatory actionplan preparation
Fig 4a Information technology solution for communitylevel action plan preparation
Fig 4b Community level GIS technology for PRA andaction plan preparation
DIWAKAR & JAYARAMAN : SPACE ENABLED ICT APPLICATIONS 317
318 IETE TECHNICAL REVIEW, Vol 24, No 4, July-August 2007
know the contribution of the project and their share forimplementation, NGOs facilitating such an activity atthe community level finds it easy to monitor all activitieswith ease, the project authorities are able to quicklyprepare the yearly logical action plans for monitoring,package enables many technical evaluations like, Equity,Inclusiveness, Gender sensitivity, Environmental andsocial assessment of action plans etc., before approvingthe action plan for implementation.
IT tools for on-line project monitoring
The project is implemented at about 750microwatersheds across 5 Districts in Karnataka.Concurrent information on the status of implementationat each microwatershed is required on a continuousbasis for monitoring and management of variousresources under the project. This calls for a systematiccompilation of information at each microwatershedand the same to be made available at sub-watershed,District and State level for management at differentlevels of hierarchy. Such a requirement is facilitatedby adopting simple web-based tools at various levelsto enable systematic data flow across the differentstages of decision making. “Sujala Mahiti”, a web-based MIS-GIS tool enables data capture at the lowermost level of project implementation with respect toSocial aspects, IGA and action plan implementation.However, the package with different component asabove are used by Field NGOs, Specialist IGAconsultant and District Watershed development officerespectively to facilitate a data synthesis at the Districtand State level. This model of data compilation andsynthesis has been proved to be highly successful andfacilitated a smooth weekly monitoring of the project.The package is a browser based customization on theclient side with server component taking all thecomputation load. The server component includes anApache server, PHP scripting language interface,PostGresql RDBMS configured around CygWinenvironment. Following illustrations provide broadarchitecture of the working MISGIS model (Fig 5a).
Very few projects, implemented at communitylevel, are able to have access to such a wealth of datafrom the field for effective monitoring and carryingout specific analysis with respect to the key performanceindicators of the project. The data flow from the fieldlevel is regularized with respect to weekly inputs andthe same is used at all levels for online interactionsthrough Audio conferences. Thus a typical example ofhow proper data flow could empower planners andmanagers to effectively carry out monitoring of such amassive project. The package enables wide varietiesof report generation on all aspects of the processes
Fig 5b Hierarchical organization of query engine anddata flow
Fig 5a Package architecture & databasesynthesis - web-based model
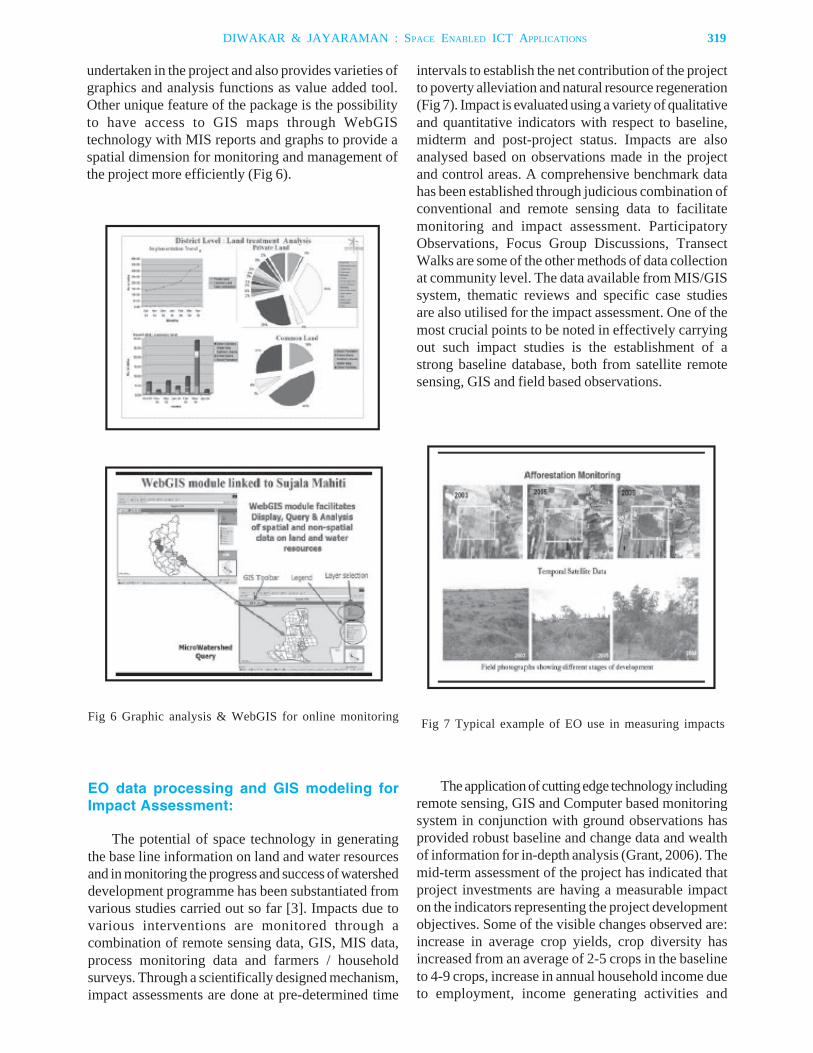
undertaken in the project and also provides varieties ofgraphics and analysis functions as value added tool.Other unique feature of the package is the possibilityto have access to GIS maps through WebGIStechnology with MIS reports and graphs to provide aspatial dimension for monitoring and management ofthe project more efficiently (Fig 6).
intervals to establish the net contribution of the projectto poverty alleviation and natural resource regeneration(Fig 7). Impact is evaluated using a variety of qualitativeand quantitative indicators with respect to baseline,midterm and post-project status. Impacts are alsoanalysed based on observations made in the projectand control areas. A comprehensive benchmark datahas been established through judicious combination ofconventional and remote sensing data to facilitatemonitoring and impact assessment. ParticipatoryObservations, Focus Group Discussions, TransectWalks are some of the other methods of data collectionat community level. The data available from MIS/GISsystem, thematic reviews and specific case studiesare also utilised for the impact assessment. One of themost crucial points to be noted in effectively carryingout such impact studies is the establishment of astrong baseline database, both from satellite remotesensing, GIS and field based observations.
EO data processing and GIS modeling forImpact Assessment:
The potential of space technology in generatingthe base line information on land and water resourcesand in monitoring the progress and success of watersheddevelopment programme has been substantiated fromvarious studies carried out so far [3]. Impacts due tovarious interventions are monitored through acombination of remote sensing data, GIS, MIS data,process monitoring data and farmers / householdsurveys. Through a scientifically designed mechanism,impact assessments are done at pre-determined time
The application of cutting edge technology includingremote sensing, GIS and Computer based monitoringsystem in conjunction with ground observations hasprovided robust baseline and change data and wealthof information for in-depth analysis (Grant, 2006). Themid-term assessment of the project has indicated thatproject investments are having a measurable impacton the indicators representing the project developmentobjectives. Some of the visible changes observed are:increase in average crop yields, crop diversity hasincreased from an average of 2-5 crops in the baselineto 4-9 crops, increase in annual household income dueto employment, income generating activities and
Fig 6 Graphic analysis & WebGIS for online monitoring Fig 7 Typical example of EO use in measuring impacts
DIWAKAR & JAYARAMAN : SPACE ENABLED ICT APPLICATIONS 319
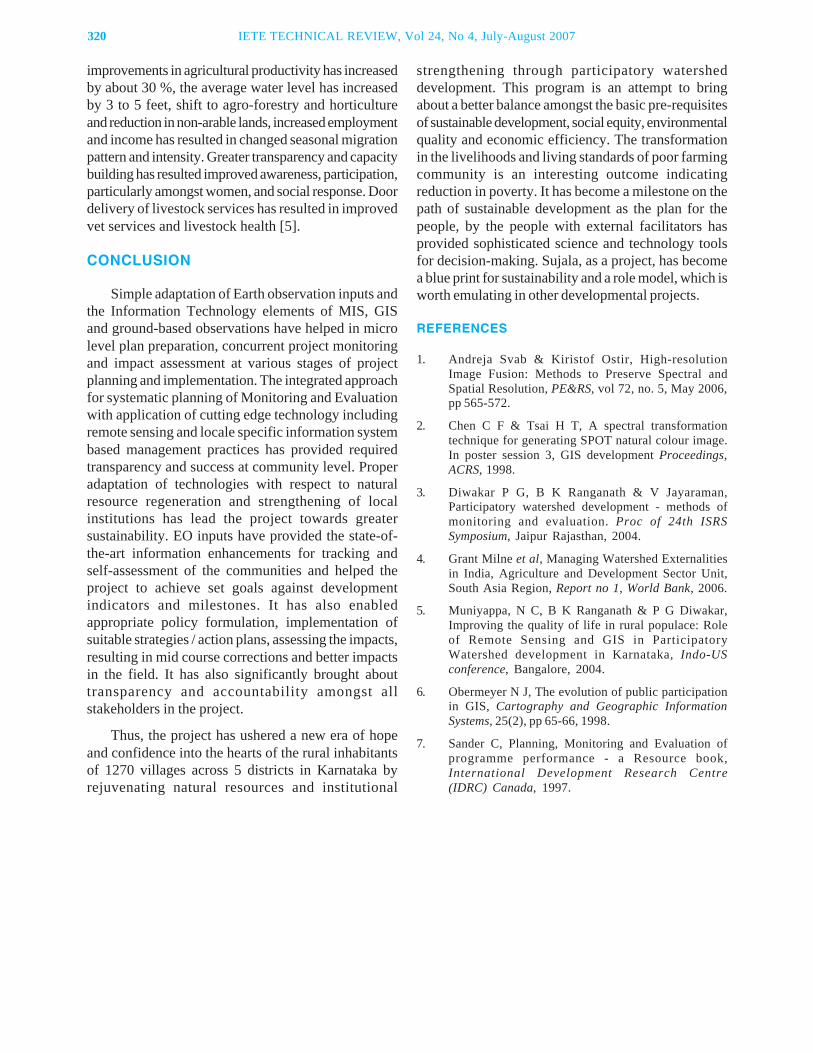
320 IETE TECHNICAL REVIEW, Vol 24, No 4, July-August 2007
improvements in agricultural productivity has increasedby about 30 %, the average water level has increasedby 3 to 5 feet, shift to agro-forestry and horticultureand reduction in non-arable lands, increased employmentand income has resulted in changed seasonal migrationpattern and intensity. Greater transparency and capacitybuilding has resulted improved awareness, participation,particularly amongst women, and social response. Doordelivery of livestock services has resulted in improvedvet services and livestock health [5].
CONCLUSION
Simple adaptation of Earth observation inputs andthe Information Technology elements of MIS, GISand ground-based observations have helped in microlevel plan preparation, concurrent project monitoringand impact assessment at various stages of projectplanning and implementation. The integrated approachfor systematic planning of Monitoring and Evaluationwith application of cutting edge technology includingremote sensing and locale specific information systembased management practices has provided requiredtransparency and success at community level. Properadaptation of technologies with respect to naturalresource regeneration and strengthening of localinstitutions has lead the project towards greatersustainability. EO inputs have provided the state-of-the-art information enhancements for tracking andself-assessment of the communities and helped theproject to achieve set goals against developmentindicators and milestones. It has also enabledappropriate policy formulation, implementation ofsuitable strategies / action plans, assessing the impacts,resulting in mid course corrections and better impactsin the field. It has also significantly brought abouttransparency and accountability amongst allstakeholders in the project.
Thus, the project has ushered a new era of hopeand confidence into the hearts of the rural inhabitantsof 1270 villages across 5 districts in Karnataka byrejuvenating natural resources and institutional
strengthening through participatory watersheddevelopment. This program is an attempt to bringabout a better balance amongst the basic pre-requisitesof sustainable development, social equity, environmentalquality and economic efficiency. The transformationin the livelihoods and living standards of poor farmingcommunity is an interesting outcome indicatingreduction in poverty. It has become a milestone on thepath of sustainable development as the plan for thepeople, by the people with external facilitators hasprovided sophisticated science and technology toolsfor decision-making. Sujala, as a project, has becomea blue print for sustainability and a role model, which isworth emulating in other developmental projects.
REFERENCES
1. Andreja Svab & Kiristof Ostir, High-resolutionImage Fusion: Methods to Preserve Spectral andSpatial Resolution, PE&RS, vol 72, no. 5, May 2006,pp 565-572.
2. Chen C F & Tsai H T, A spectral transformationtechnique for generating SPOT natural colour image.In poster session 3, GIS development Proceedings,ACRS, 1998.
3. Diwakar P G, B K Ranganath & V Jayaraman,Participatory watershed development - methods ofmonitoring and evaluation. Proc of 24th ISRSSymposium, Jaipur Rajasthan, 2004.
4. Grant Milne et al, Managing Watershed Externalitiesin India, Agriculture and Development Sector Unit,South Asia Region, Report no 1, World Bank, 2006.
5. Muniyappa, N C, B K Ranganath & P G Diwakar,Improving the quality of life in rural populace: Roleof Remote Sensing and GIS in ParticipatoryWatershed development in Karnataka, Indo-USconference, Bangalore, 2004.
6. Obermeyer N J, The evolution of public participationin GIS, Cartography and Geographic InformationSystems, 25(2), pp 65-66, 1998.
7. Sander C, Planning, Monitoring and Evaluation ofprogramme performance - a Resource book,International Development Research Centre(IDRC) Canada, 1997.
P G Diwakar, is a Post Graduate inStatistics, specialization in MathematicalModelling; Specialisation in SoftwareDevelopment - IISc & IIM-B andSpecialisation in Digital Image Processing(VIPS-32), SEP, France (1986).
He is working in the area of DigitalImage Processing, GIS and Modelingsolutions. He has more than 22 years ofservice in ISRO, since joining in 1984.
He is responsible for setting up and managing high-endImage Processing facilities at Regional Remote Sensing ServiceCentres (RRSSCs) of ISRO, across the country and a NationalFacility for Remote Sensing Applications at Mauritius.
He has held positions as System Manager and Softwareteam leader. As a Team leader his responsibilities are Applicationsoftware development for 3 major national mission projects.Project manager, NRIS: A major national mission for setting upNational Natural Resources Information System at district level.
His current responsibilities are Additional Project Director,Monitoring and Evaluation of watershed development (A WorldBank project for sustainable rural development in Karnataka);Head, RRSSC, ISRO, Bangalore – A National center for remotesensing applications in southern region; Program Manager &Regional Coordinator –Village Resource Centres: A new initiativeto provide space technology based solutions to rural community.
He has More than 50 Publications in national / internationalJournals and Conferences. He is Life member of Indian Societyof Remote Sensing.
* * *
V Jayaraman received Bachelordegree in Electronics and CommunicationEngineering from University of Madras;Master of Science in Electrical engineering(by Research) from Indian Institute ofTechnology, Madras; Diploma inManagement (specialized in InformationTechnology) from All India ManagementAssociation, New Delhi and Doctoratein Physics from Bangalore University,India.
Authors
He is Fellow of the Institution of Electronics andTelecommunications Engineers (FIETE); Fellow, Indian Geo-physical Union (FIGU); Member, Indian Society of RemoteSensing (MISRS); Member, Indian Society of Geomatics (MISG);Member, Astronautical Society of India (MASI).
He has more than 35 years of continuous service in ISRO,since joining it in 1971 as Design Engineer in Aryabhata Projectfor X-ray Astronomy Payload (1971-76); Systems Engineer inBhaskara I & II Projects (1977-81); Principal Systems Engineer(Payload, Mission, and Ground Segment) for Indian RemoteSensing Satellite, IRS-1A (1981-88) and Deputy Director, EarthObservations System in ISRO Hq (1989-96).
He is currently, concurrently holding three positions as:Director, Earth Observations System (from 1997 till date);Programme Director, ISRO Geosphere Biosphere Programme(from Sept 2002); Director, NNRMS-Regional Remote SensingService Centres (from Sept 2003).
Besides the above, also heading the National NaturalResources Management System (NNRMS) Secretariat at ISROHeadquarters. Member of various State Natural ResourcesManagement System (SNRMS) management Councils/ Boards.
Currently, serving as the Member Secretary of the PlanningCommittee of the NNRMS (PC-NNRMS), the apex body underthe aegis of the Planning Commission, Govt. of India, lookingafter the overall remote sensing activities in the country.
He is Member of Management Councils of various ISRO/DOS Centres/Programmes: Member, National Remote SensingAgency-Governing Society & NRSA - Governing Body; Member,Governing Council for the North Eastern- Space ApplicationsCentre; Member, ISRO Radar Development Unit - ProgrammeManagement Council (I & Member, Indian Remote SensingSatellite Programme Management Council (IRS- PMC) andMember, Earth Observation Applications Mission – ManagementCouncil (EOAM-MC).
He has published more than 230 Technical/ Scientific/Management papers in national and international journals ofrepute; Edited a book entitled ‘ Space & Agenda-21 - Caring forPlanet Earth’ in 1994.
* * *
DIWAKAR & JAYARAMAN : SPACE ENABLED ICT APPLICATIONS 321
323Paper No 126-A; Copyright © 2007 by the IETE.
IETE Technical ReviewVol 24, No 4, July-August 2007, pp 323-330
Performance Analysis of SC DS-CDMA andMC DS-CDMA Systems over Nakagami-m
Fading ChannelS ANURADHA, S SRIGOWRI, K S RAMA KRISHNA
Department of ECE, VRS Engineering College, Vijayawada 520 007, India.
AND
K V V S REDDY
Department of ECE, Andhra University College of Engineering,Vishakhapatnam 530 003, India.
email: [email protected]
This paper deals with simulation of Nakagami-m fading in wireless channels usinggeneralized SC DS-CDMA and MC DS-CDMA schemes using binary phase shift keyingmodulation scheme. The paper proposes for deriving Bit Error Rate (BER) in BPSK-SC DS-CDMA and MC DS-CDMA systems over Nakagami-m fading channels. The numerical resultsare plotted as BER vs SNR for various values of Nakagami factor m, number of users K andjamming interference (JSR) using MAT LAB software. The performance of Nakagami-mchannel using BPSK-SC DS-CDMA and MC DS-CDMA techniques are compared. It isobserved that there is a decrease in Bit Error Rate for increase in m for SC DS-CDMA andMC DS-CDMA. The number of users k, JSR increases as Bit Error Rate increases for MC DS-CDMA. For the same values of m BER for MC DS-CDMA is smaller when compared with SCDS-CDMA using Maximal Ratio Combining (MRC) diversity technique.
INTRODUCTION
FADING is observed in wireless communicationchannels [1] due to multi path propagation. The
Nakagami-m distribution accurately models the fadingeffect for short distance communications. This paperdeals with the derivation of BER in BPSK- SC DS-CDMA and MC DS-CDMA systems over Nakagami-m channel. In the generic form, DS-CDMA access isa spread spectrum technique for simultaneouslytransmitting a number of signals representinginformation messages from a multitude of users over achannel employing a common carrier. The method bywhich the various users share the channel is theassignment of a unique pseudo noise (PN) type codeto each user (which accompanies the transmission ofinformation) with orthogonal like properties that allowsthe composite received signal to be separated into itsindividual user components, each of which can then bedemodulated and decoded. A complete discussion oftechniques for accomplishing these functions and their
impact on system performance can be found in [2].
SYSTEM MODELS
(a) SC DS-CDMA
Introduction
In this section we apply the MGF-based approachpresented to derive the average BER performance ofbinary DS-CDMA systems over these channels [3].The results presented in this section are applicable tosystems that employ RAKE reception with coherentMaximum Ratio Combining (MRC).
1. Transmitter
We consider a binary DS-CDMA system withKu independent users sharing a channel simultaneously,each transmitting with power P at a common carrierfrequency fc=wc/2P .using a data rate Rb=1/Tb and achip rate Rc=1/Tc. The kth user, k=1, 2…Ku is assigneda unique code sequence {ak, j} of chip elements(–1, +1). So that its chip waveform is given by
CONTRIBUTED PAPER
324 IETE TECHNICAL REVIEW, Vol 24, No 4, July-August 2007
¥ak (t) = S ak,j PTc (t–jTc)
j=–¥
Where the function PT(.) denotes the chip pulse ofduration T. In the single carrier case we assume thatPT(.) is a unit rectangular pulse, where in the multicarrier case we will consider Nyquist pulses. Thecode sequence {ak,j}is assumed to be periodic, withperiod equal to the processing gain PG=Tb/Tc. Thedata signal wave form bk(t) given by
¥
bk (t) = S bk,j PTb (t–jTb)j=–¥
is the binary phase-shift-keyed (BPSK) on to thecarrier at fc, which is then spread by that user’s codesequence and transmitted over the channel. Theresulting kth user’s transmitted signal sk(t) is given by
sk (t) = 2Pak (t)bk (t) cos (wct)
The composite transmitted signal s(t) at the inputof the channel can then be expressed as
Ku
s (t) = S 2Pak (t)bk (t) cos (wct)k=1
2. CHANNEL MODEL
DS-CDMA systems involve a spreading process,which results in a transmitted signal whose bandwidthis much wider than the channel coherence bandwidth,and therefore undergoes frequency-selective fading.This type of fading is typically modeled by a linearfilter, which for a kth user is characterized by acomplex valued low loss equivalent impulse response[4,5].
Lp
hk (t) = S ak,l e–jqk,l d(t–tk,l)l=1
Where d(.) is the Dirac delta function. lthpropagation path index, and {ak,l}l=1
Lp,{qk,l} l=1Lp and
{tk,l} l=1Lp the random path amplitudes, phases, delays
respectively. We assume that the sets {ak,l}l=1Lp,
{q k,l} l=1Lp and {tk,l} l=1
Lp are mutually independent.Lp is the number of resolvable paths (the first pathbeing the reference path whose delay tl = 0) and isrelated to the ratio of the maximum delay spread tmaxto the chip time duration Tc. If the different paths givenimpulse response are different scatter they tend toexhibit negligible correlations [6,7]. We denote kth-
user lth resolved path ak,l which is a random variablewhose mean square is a2
k,l is assumed to beindependent of k and is denoted by W l.
After passing through the fading channel, the signalis perturbed Additive White Gaussian Noise (AWGN)with a one-sided power spectral design which isdenoted by N0(W/Hz). The AWGN is [10] assumedto be independent of the fading amplitudes. Hence theinstantaneous SNR per bit of the lth channel is givenby gk,l = a2
k,l Eb / N0. Where Eb(j) is the energy per bitand the average SNR per bit of the lth channel is givenby gl= W l Eb / N0.
3. RECEIVER
With multipath propagation, the received signalr(t) whose signal component is the time convolution ofs(t) and h(t),may be written as
Ku Lp ak,l ak (t–tk,l) ´r(t) = 2P S Sk=1 l=1 bk,(t–tk,l) cos [wc (t–tk,l) + qk,l] + n(t)
Where n(t) is the receiver AWGN random process.
Here we consider L-branch RAKE receiver. Theoptimum value for L is Lp. but L may be chosen lessthan Lp due to receiver complexity constraints. Eachof the L paths to be combined is first coherentlymodulated through multiplication by the demodulatedcarrier cos[wc(t–tk,l) + qk,l], then low pass filtered toremove the second harmonics of the carrier. All theoperations are assumed that the receiver is coherentlytimed and phase synchronized at every branch andassuming perfect knowledge of fading amplitude oneach finger, the L low pass filter outputs are individuallyweighted by their fading amplitudes and then combinedby a linear combiner yielding the decision variable
L
rk = S ak,l rk,l k=1,2...Kul=1
4. PERFORMANCE ANALYSIS
The decision variable rk can be written as sum ofdesired signal component and three interferencecomponents [8].
æ L ö Lrk = ± çS a2
k,l ÷ Eb + S ak,l (IS + IM + N)èl=1 ø l=1
Where IS is the self-interference component inducedby autocorrelation function of kth user’s spreading

code. The multiple access interference (MAI)component induced by the other Ku–1 users on thedesired user and N is the zero mean AWGN componentwith variance s2
N = N0/2. It can be considered to be azero mean Gaussian RV with variance
W T – 1 s2 s = ¾ ¾ ¾ W l Eb2PG
Where W T = S W l/W 1 can be interpreted as normalizedtotal average fading power and PG is ProcessingGain. IM can be modeled as zero mean GaussianRandom variable with variance
2(Ku – 1)W T s2 M = ¾ ¾ ¾ ¾ ¾ ¾ W l Eb
6PG
rk can be considered to be a conditional Gaussian RVwith mean and a conditional variance given by
æ L öE[rk | {ak,l}L
l=1 ] = ± ç S a2k,l ÷ Ebèl=1 ø
L
var (rk | {ak,l }L
l=1) = ± S a2 k,l (s2
N + s2S + s2
M)l=1
Assuming that the data bits +1 or –1 are equallyprobable the Kth user conditional SNR, is given by
(E [ri | ai])2 æ L ö EbSNR ({ak,l}L = ¾ ¾ ¾ ¾ ¾ = ç S a2k,l ÷ ¾ ¾
2 var (ri | ai) è l=1 ø Ne
Equivalent two-sided interference plus noise powerspectral density is defined as
Ne¾ ¾ º s2N + s2
S + s2M2
(2Ku +1) W T – 3 N0= ¾ ¾ ¾ ¾ ¾ ¾ ¾ W lEb + ¾ ¾6PG 2
With gl = W 1Eb / N0 the average received SNR per bitcorresponding to the first path.
Since we are assuming BPSK modulation, theaverage SNR per bit of lth path
W l Eb é (2Ku + 1) W T – 3 ù–1
gl,e = ¾ ¾ ¾ = gl ê1 + ¾ ¾ ¾ ¾ ¾¾ gl úNe ë 3PG û
The expression for average BER is given by:
1 p/2 L æ gee–(l–1)d ö –mlPb (E) = ¾ ò X ç 1 + ¾ ¾ ¾ ¾ ÷ df
p 0 l=1 è ml sin 2 f ø
Where
æ (2 ku + 1)W T –3 1 ö –1
ge = ç ¾ ¾ ¾ ¾ ¾ ¾ ¾ + ¾ ÷è 3PG g1 ø
LpW T = S e–(l–1)d
l=1
(b) MC DS-CDMA
Introduction
MC DS-CDMA Constitutes a trade off betweenSC DS-CDMA and MC DS-CDMA, MC DS-CDMAtypically requires low chip rate spreading codes thanDS-CDMA due to employing multiple sub-carriers. Itnecessitates a lower number of sub-carriers than MCDS-CDMA due to imposing DS spreading [2] on eachsub-carrier signal. MC DS-CDMA requires low ratesignal processing than DS-CDMA and has lower worst-case peak to average power than MC DS-CDMA.MC DS-CDMA has highest of freedom in family ofCDMA schemes. A MC DS-CDMA exhibit a no ofadvantageous properties, this technique is employed inwireless communication, irrespective of presence ofother techniques [9].
SYSTEM MODEL OF MC-DS CDMA
In this model a generalized MC DS-CDMA systemwith K users is shown in Fig 1. BPSK modulation isassumed. At the receiver, the desired user’s signalwill be decoded and the other K–1 user will contributeto multi-user interference.
1. Transmitter
Fig 1 System model for the MC DS-CDMA system
s0(i)
s1(i)
sN–1(i)
Trans-mitter
Channelh(l)
RakeReceiver
sk(n)
n(t)
PilotChannel
r(t)
ChannelEstimation
Multi-user Interference
l=1
S ANURADHA et al : SC DS-CDMA AND MC DS-CDMA SYSTEMS 325
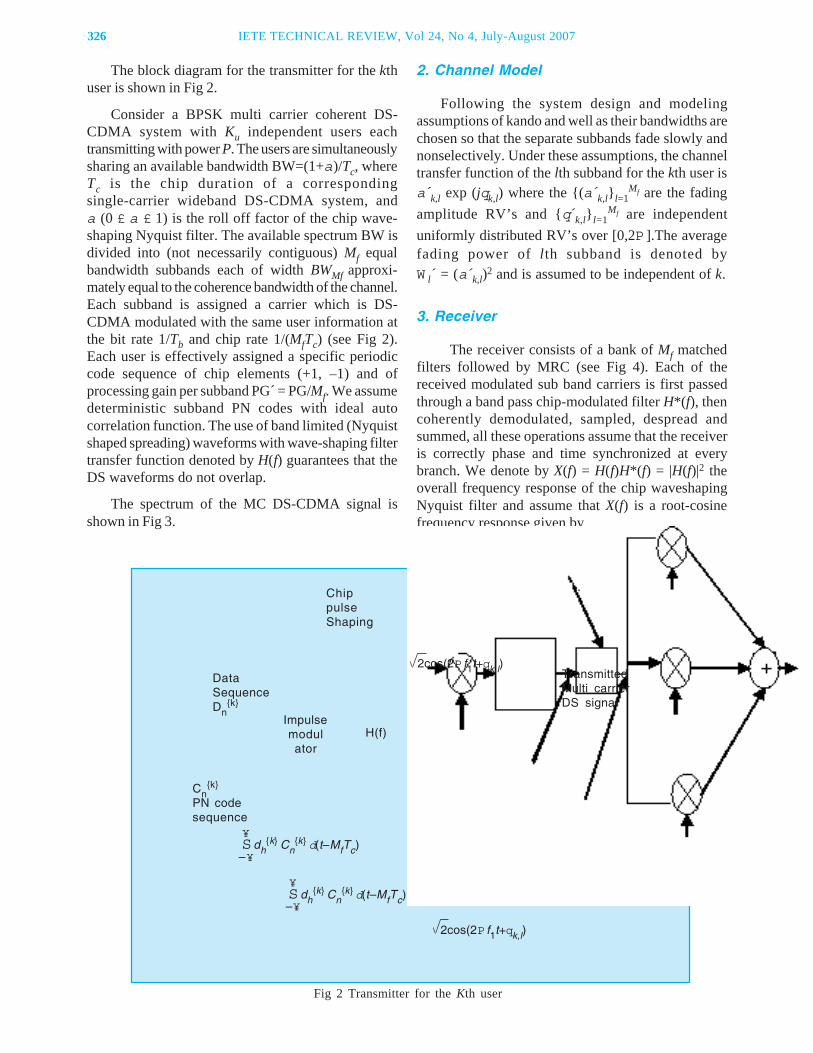
326 IETE TECHNICAL REVIEW, Vol 24, No 4, July-August 2007
The block diagram for the transmitter for the kthuser is shown in Fig 2.
Consider a BPSK multi carrier coherent DS-CDMA system with Ku independent users eachtransmitting with power P. The users are simultaneouslysharing an available bandwidth BW=(1+a)/Tc, whereTc is the chip duration of a correspondingsingle-carrier wideband DS-CDMA system, anda (0 £ a £ 1) is the roll off factor of the chip wave-shaping Nyquist filter. The available spectrum BW isdivided into (not necessarily contiguous) Mf equalbandwidth subbands each of width BWMf approxi-mately equal to the coherence bandwidth of the channel.Each subband is assigned a carrier which is DS-CDMA modulated with the same user information atthe bit rate 1/Tb and chip rate 1/(MfTc) (see Fig 2).Each user is effectively assigned a specific periodiccode sequence of chip elements (+1, –1) and ofprocessing gain per subband PG´ = PG/Mf. We assumedeterministic subband PN codes with ideal autocorrelation function. The use of band limited (Nyquistshaped spreading) waveforms with wave-shaping filtertransfer function denoted by H(f) guarantees that theDS waveforms do not overlap.
The spectrum of the MC DS-CDMA signal isshown in Fig 3.
2. Channel Model
Following the system design and modelingassumptions of kando and well as their bandwidths arechosen so that the separate subbands fade slowly andnonselectively. Under these assumptions, the channeltransfer function of the lth subband for the kth user isa´k,l exp (jqk,l) where the {(a´k,l}l=1
Mf are the fadingamplitude RV’s and {q´k,l}l=1
Mf are independentuniformly distributed RV’s over [0,2P ].The averagefading power of lth subband is denoted byW l´ = (a´k,l)2 and is assumed to be independent of k.
3. Receiver
The receiver consists of a bank of Mf matchedfilters followed by MRC (see Fig 4). Each of thereceived modulated sub band carriers is first passedthrough a band pass chip-modulated filter H*(f), thencoherently demodulated, sampled, despread andsummed, all these operations assume that the receiveris correctly phase and time synchronized at everybranch. We denote by X(f) = H(f)H*(f) = |H(f)|2 theoverall frequency response of the chip waveshapingNyquist filter and assume that X(f) is a root-cosinefrequency response given by
Fig 2 Transmitter for the Kth user
DataSequenceDn
{k}
Impulsemodulator
H(f)
ChippulseShaping
TransmittedMulti carrierDS signal
2cos(2P f1t+qk,l)
Cn{k}
PN codesequence
¥Sdh
{k} Cn{k} d(t–MfTc)
–¥
¥S dh
{k} Cn{k} d(t–MfTc)
–¥
2cos(2P f1t+qk,l)
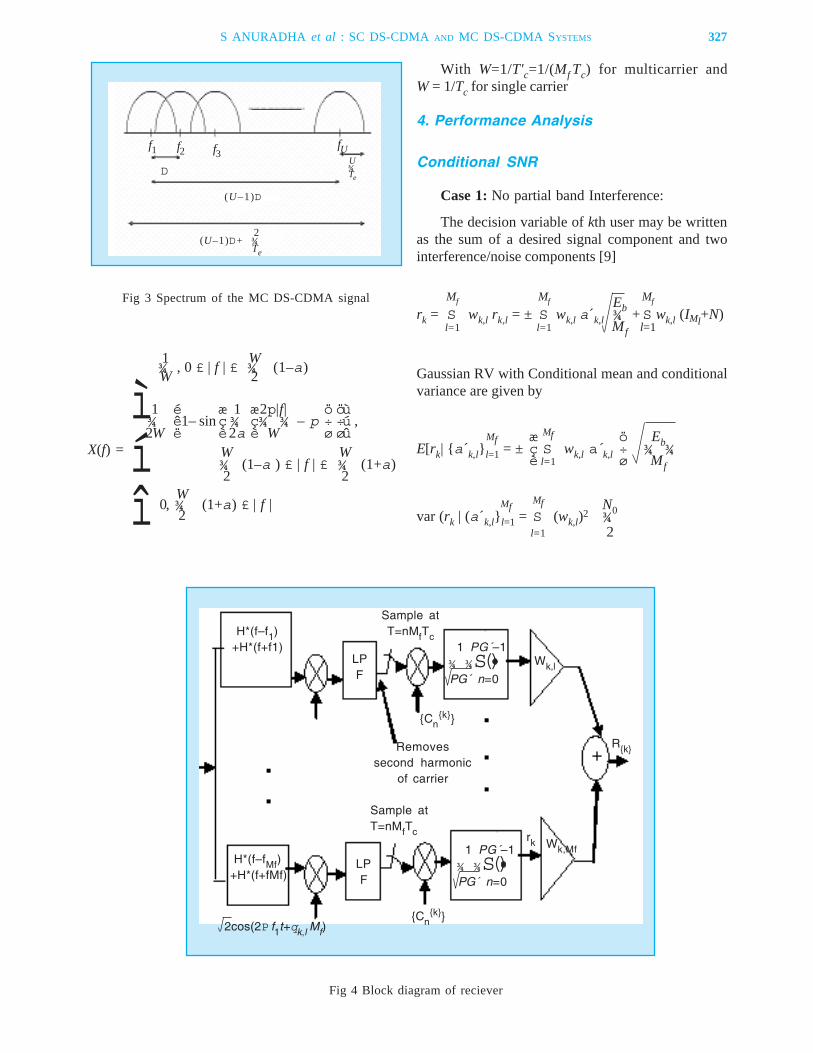
X(f) =
Fig 3 Spectrum of the MC DS-CDMA signal
(U–1)D
2(U–1)D+ ¾
Te
DU¾Te
f1 f2 f3fU
Fig 4 Block diagram of reciever
ìíî
1 W¾ , 0 £ | f | £ ¾ (1–a)W 2
W0, ¾ (1+a) £ | f |
2
1 é æ 1 æ2p|f| ö öù¾ ê1– sinç ¾ ç¾ ¾ – p ÷ ÷ú ,2W ë è2a è W ø øû
W W¾ (1–a ) £ | f | £ ¾ (1+a)2 2
Mf
Mf
H*(f–f1)+H*(f+f1)
LPF
H*(f–fMf)+H*(f+fMf)
LPF
Sample atT=nMfTc
Removessecond harmonic
of carrier
Sample atT=nMfTc
{Cn{k}}
Wk,l
R{k}
Wk,Mfrk
{Cn{k}}
2cos(2P f1t+qk,l Mf)
1 PG´–1¾ ¾S()PG´ n=0
1 PG´–1¾ ¾S()PG´ n=0
With W=1/T'c=1/(Mf Tc) for multicarrier andW = 1/Tc for single carrier
4. Performance Analysis
Conditional SNR
Case 1: No partial band Interference:
The decision variable of kth user may be writtenas the sum of a desired signal component and twointerference/noise components [9]
Mf Mf EbMf
rk = S wk,l rk,l = ± S wk,l a´k,l ¾ +S wk,l (IMl+N)l=1 l=1 Mf l=1
Gaussian RV with Conditional mean and conditionalvariance are given by
æ Mf ö EbE[rk| {a´k,l}l=1 = ± ç S wk,l a´k,l ÷ ¾ ¾è l=1 ø Mf
Mf N0var (rk | (a´k,l}l=1 = S (wk,l)2 ¾l=1 2
S ANURADHA et al : SC DS-CDMA AND MC DS-CDMA SYSTEMS 327
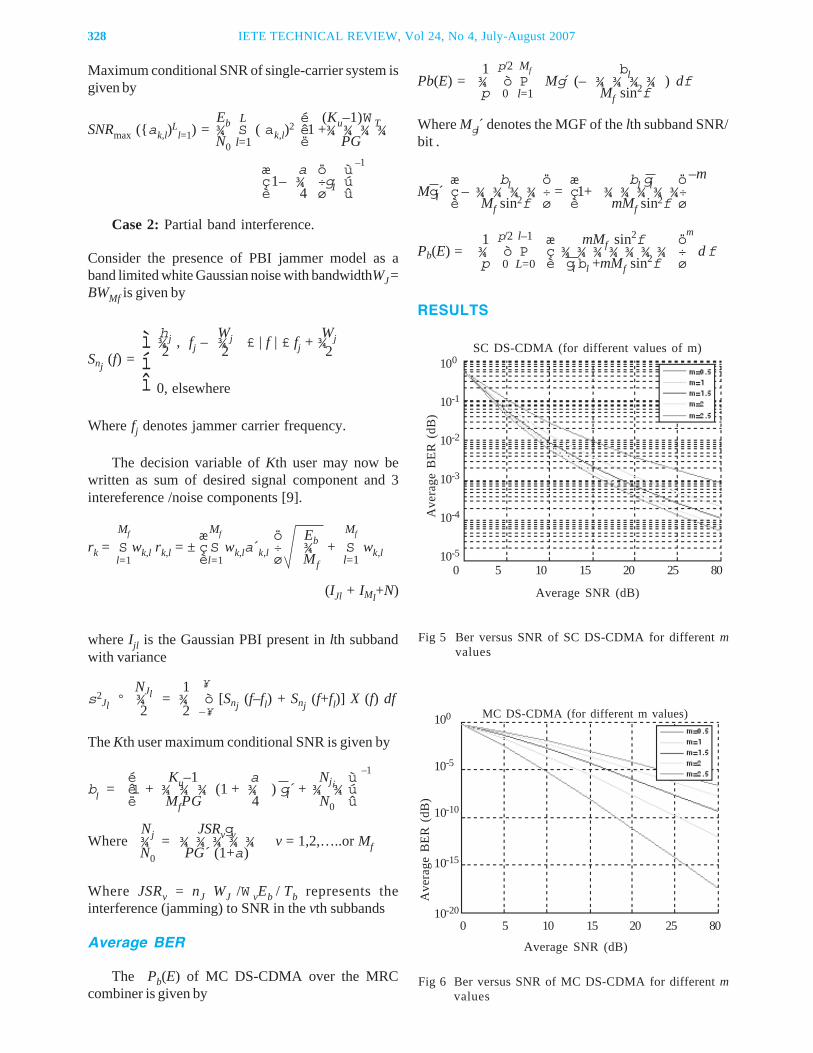
328 IETE TECHNICAL REVIEW, Vol 24, No 4, July-August 2007
ìíî
hj Wj Wj¾ , fj – ¾ £ | f | £ fj + ¾2 2 2
0, elsewhere
Fig 5 Ber versus SNR of SC DS-CDMA for different mvalues
SC DS-CDMA (for different values of m)
Average SNR (dB)
0 5 10 15 20 25 80
Ave
rage
BER
(dB
)
100
10-1
10-2
10-3
10-4
10-5
Fig 6 Ber versus SNR of MC DS-CDMA for different mvalues
MC DS-CDMA (for different m values)
0 5 10 15 20 25 80
Average SNR (dB)
Ave
rage
BER
(dB
)
100
10-5
10-10
10-15
10-20
Maximum conditional SNR of single-carrier system isgiven by
Eb L é (Ku–1)W TSNRmax ({ak,l)Ll=1) = ¾ S ( ak,l)2 ê1 +¾ ¾ ¾ ¾
N0 l=1 ë PG
æ a ö ù–1
ç1– ¾ ÷g1 úè 4 ø û
Case 2: Partial band interference.
Consider the presence of PBI jammer model as aband limited white Gaussian noise with bandwidthWJ =BWMf is given by
Snj (f) =
Where fj denotes jammer carrier frequency.
The decision variable of Kth user may now bewritten as sum of desired signal component and 3intereference /noise components [9].
Mf æMf ö EbMf
rk = S wk,l rk,l = ± çS wk,la´k,l ÷ ¾ + S wk,ll=1 èl=1 ø Mf l=1
(IJl + IMl+N)
where Ijl is the Gaussian PBI present in lth subbandwith variance
NJl 1 ¥s2
Jl º ¾ = ¾ ò [Snj (f–fl) + Snj (f+fl)] X (f) df2 2 –¥
The Kth user maximum conditional SNR is given by
é Ku–1 a Nji ù–1
bl = ê1 + ¾ ¾ ¾ (1 + ¾ ) gl´ + ¾ ¾ úë MfPG 4 N0 û
Nj JSRvgvWhere ¾ = ¾ ¾ ¾ ¾ ¾ v = 1,2,…..or MfN0 PG´ (1+a)
Where JSRv = nJ WJ /W vEb / Tb represents theinterference (jamming) to SNR in the vth subbands
Average BER
The Pb(E) of MC DS-CDMA over the MRCcombiner is given by
1 p/2 Mf blPb(E) = ¾ ò P Mg (– ¾ ¾ ¾ ¾ ) dfp 0 l=1 Mf sin2f
Where Mgl´ denotes the MGF of the lth subband SNR/bit .
æ bl ö æ bl gl ö–mMgl´ ç – ¾ ¾ ¾ ¾ ÷ = ç1+ ¾ ¾ ¾ ¾ ¾÷
è Mf sin2f ø è mMf sin2f ø
1 p/2 l–1 æ mMf sin2f öm
Pb(E) = ¾ ò P ç ¾ ¾ ¾ ¾ ¾ ¾ ¾ ÷ dfp 0 L=0 è gl bl +mMf sin2f ø
RESULTS
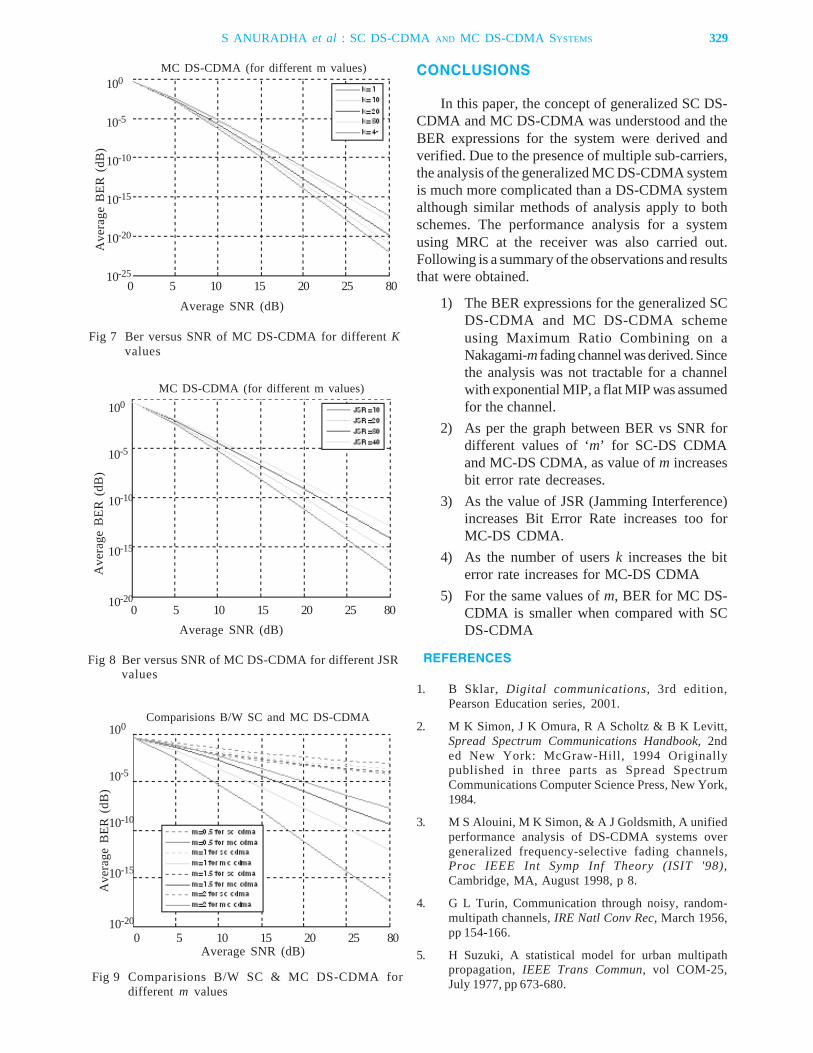
CONCLUSIONS
In this paper, the concept of generalized SC DS-CDMA and MC DS-CDMA was understood and theBER expressions for the system were derived andverified. Due to the presence of multiple sub-carriers,the analysis of the generalized MC DS-CDMA systemis much more complicated than a DS-CDMA systemalthough similar methods of analysis apply to bothschemes. The performance analysis for a systemusing MRC at the receiver was also carried out.Following is a summary of the observations and resultsthat were obtained.
1) The BER expressions for the generalized SCDS-CDMA and MC DS-CDMA schemeusing Maximum Ratio Combining on aNakagami-m fading channel was derived. Sincethe analysis was not tractable for a channelwith exponential MIP, a flat MIP was assumedfor the channel.
2) As per the graph between BER vs SNR fordifferent values of ‘m’ for SC-DS CDMAand MC-DS CDMA, as value of m increasesbit error rate decreases.
3) As the value of JSR (Jamming Interference)increases Bit Error Rate increases too forMC-DS CDMA.
4) As the number of users k increases the biterror rate increases for MC-DS CDMA
5) For the same values of m, BER for MC DS-CDMA is smaller when compared with SCDS-CDMA
REFERENCES
1. B Sklar, Digital communications, 3rd edition,Pearson Education series, 2001.
2. M K Simon, J K Omura, R A Scholtz & B K Levitt,Spread Spectrum Communications Handbook, 2nded New York: McGraw-Hill, 1994 Originallypublished in three parts as Spread SpectrumCommunications Computer Science Press, New York,1984.
3. M S Alouini, M K Simon, & A J Goldsmith, A unifiedperformance analysis of DS-CDMA systems overgeneralized frequency-selective fading channels,Proc IEEE Int Symp Inf Theory (ISIT '98),Cambridge, MA, August 1998, p 8.
4. G L Turin, Communication through noisy, random-multipath channels, IRE Natl Conv Rec, March 1956,pp 154-166.
5. H Suzuki, A statistical model for urban multipathpropagation, IEEE Trans Commun, vol COM-25,July 1977, pp 673-680.
Fig 7 Ber versus SNR of MC DS-CDMA for different Kvalues
Fig 8 Ber versus SNR of MC DS-CDMA for different JSRvalues
0 5 10 15 20 25 80
Ave
rage
BER
(dB
)100
10-5
10-10
10-15
10-20
10-25
Average SNR (dB)
MC DS-CDMA (for different m values)
0 5 10 15 20 25 80Average SNR (dB)
Ave
rage
BER
(dB
)
100
10-5
10-10
10-15
10-20
MC DS-CDMA (for different m values)
Fig 9 Comparisions B/W SC & MC DS-CDMA fordifferent m values
0 5 10 15 20 25 80Average SNR (dB)
Ave
rage
BER
(dB
)
100
10-5
10-10
10-15
10-20
Comparisions B/W SC and MC DS-CDMA
S ANURADHA et al : SC DS-CDMA AND MC DS-CDMA SYSTEMS 329
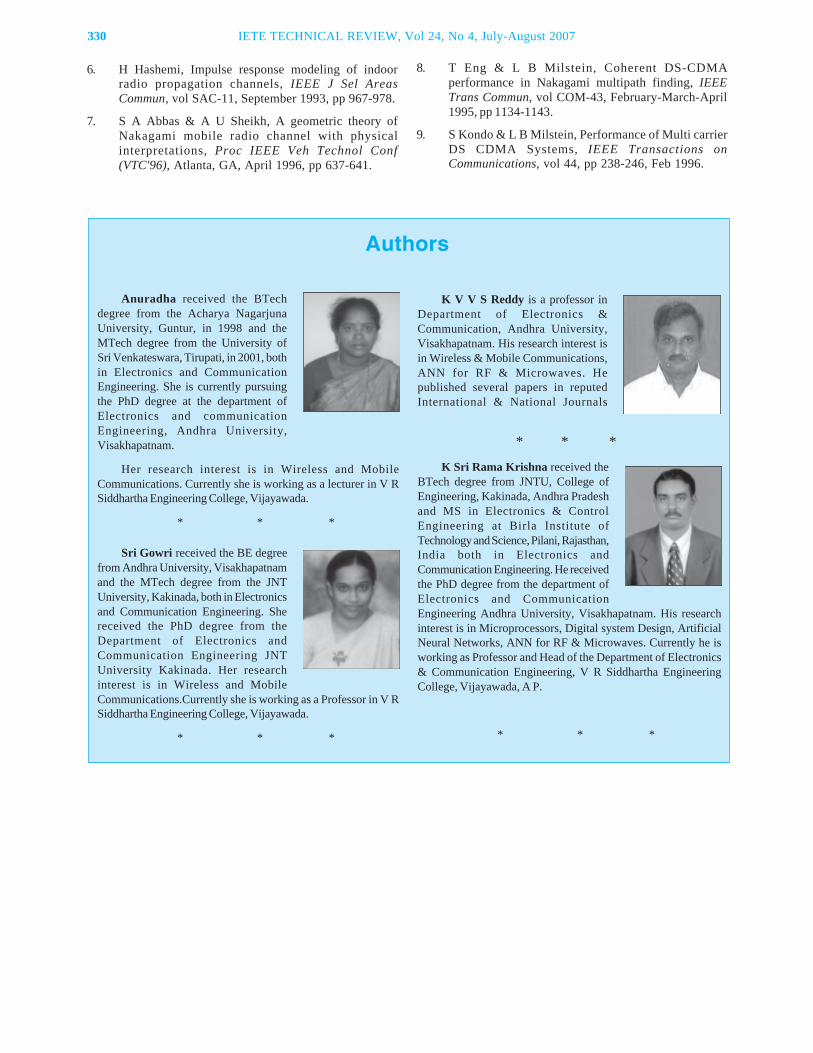
330 IETE TECHNICAL REVIEW, Vol 24, No 4, July-August 2007
6. H Hashemi, Impulse response modeling of indoorradio propagation channels, IEEE J Sel AreasCommun, vol SAC-11, September 1993, pp 967-978.
7. S A Abbas & A U Sheikh, A geometric theory ofNakagami mobile radio channel with physicalinterpretations, Proc IEEE Veh Technol Conf(VTC'96), Atlanta, GA, April 1996, pp 637-641.
8. T Eng & L B Milstein, Coherent DS-CDMAperformance in Nakagami multipath finding, IEEETrans Commun, vol COM-43, February-March-April1995, pp 1134-1143.
9. S Kondo & L B Milstein, Performance of Multi carrierDS CDMA Systems, IEEE Transactions onCommunications, vol 44, pp 238-246, Feb 1996.
Anuradha received the BTechdegree from the Acharya NagarjunaUniversity, Guntur, in 1998 and theMTech degree from the University ofSri Venkateswara, Tirupati, in 2001, bothin Electronics and CommunicationEngineering. She is currently pursuingthe PhD degree at the department ofElectronics and communicationEngineering, Andhra University,Visakhapatnam.
Her research interest is in Wireless and MobileCommunications. Currently she is working as a lecturer in V RSiddhartha Engineering College, Vijayawada.
* * *
Sri Gowri received the BE degreefrom Andhra University, Visakhapatnamand the MTech degree from the JNTUniversity, Kakinada, both in Electronicsand Communication Engineering. Shereceived the PhD degree from theDepartment of Electronics andCommunication Engineering JNTUniversity Kakinada. Her researchinterest is in Wireless and MobileCommunications.Currently she is working as a Professor in V RSiddhartha Engineering College, Vijayawada.
* * *
Authors
K V V S Reddy is a professor inDepartment of Electronics &Communication, Andhra University,Visakhapatnam. His research interest isin Wireless & Mobile Communications,ANN for RF & Microwaves. Hepublished several papers in reputedInternational & National Journals
* * *
K Sri Rama Krishna received theBTech degree from JNTU, College ofEngineering, Kakinada, Andhra Pradeshand MS in Electronics & ControlEngineering at Birla Institute ofTechnology and Science, Pilani, Rajasthan,India both in Electronics andCommunication Engineering. He receivedthe PhD degree from the department ofElectronics and CommunicationEngineering Andhra University, Visakhapatnam. His researchinterest is in Microprocessors, Digital system Design, ArtificialNeural Networks, ANN for RF & Microwaves. Currently he isworking as Professor and Head of the Department of Electronics& Communication Engineering, V R Siddhartha EngineeringCollege, Vijayawada, A P.
* * *
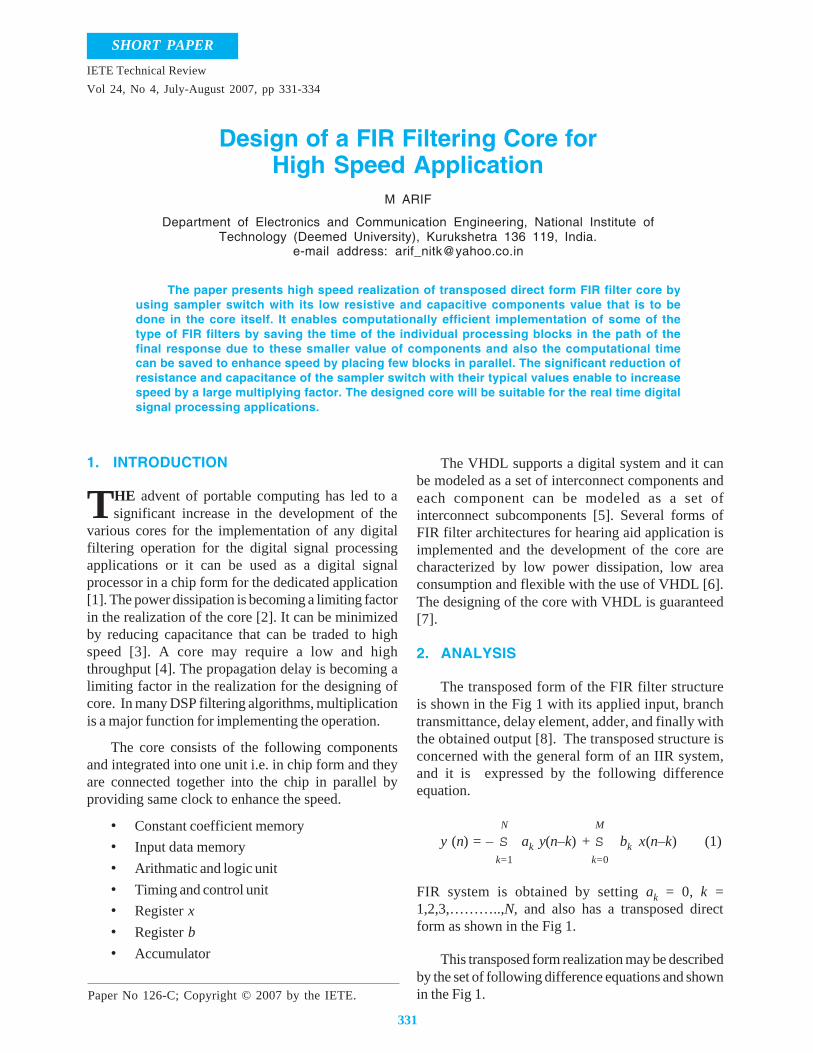
331
Paper No 126-C; Copyright © 2007 by the IETE.
IETE Technical ReviewVol 24, No 4, July-August 2007, pp 331-334
Design of a FIR Filtering Core forHigh Speed Application
M ARIF
Department of Electronics and Communication Engineering, National Institute ofTechnology (Deemed University), Kurukshetra 136 119, India.
e-mail address: [email protected]
The paper presents high speed realization of transposed direct form FIR filter core byusing sampler switch with its low resistive and capacitive components value that is to bedone in the core itself. It enables computationally efficient implementation of some of thetype of FIR filters by saving the time of the individual processing blocks in the path of thefinal response due to these smaller value of components and also the computational timecan be saved to enhance speed by placing few blocks in parallel. The significant reduction ofresistance and capacitance of the sampler switch with their typical values enable to increasespeed by a large multiplying factor. The designed core will be suitable for the real time digitalsignal processing applications.
The VHDL supports a digital system and it canbe modeled as a set of interconnect components andeach component can be modeled as a set ofinterconnect subcomponents [5]. Several forms ofFIR filter architectures for hearing aid application isimplemented and the development of the core arecharacterized by low power dissipation, low areaconsumption and flexible with the use of VHDL [6].The designing of the core with VHDL is guaranteed[7].
2. ANALYSIS
The transposed form of the FIR filter structureis shown in the Fig 1 with its applied input, branchtransmittance, delay element, adder, and finally withthe obtained output [8]. The transposed structure isconcerned with the general form of an IIR system,and it is expressed by the following differenceequation.
N My (n) = – S ak y(n–k) + S bk x(n–k) (1)
k=1 k=0
FIR system is obtained by setting ak = 0, k =1,2,3,………..,N, and also has a transposed directform as shown in the Fig 1.
This transposed form realization may be describedby the set of following difference equations and shownin the Fig 1.
1. INTRODUCTION
THE advent of portable computing has led to asignificant increase in the development of the
various cores for the implementation of any digitalfiltering operation for the digital signal processingapplications or it can be used as a digital signalprocessor in a chip form for the dedicated application[1]. The power dissipation is becoming a limiting factorin the realization of the core [2]. It can be minimizedby reducing capacitance that can be traded to highspeed [3]. A core may require a low and highthroughput [4]. The propagation delay is becoming alimiting factor in the realization for the designing ofcore. In many DSP filtering algorithms, multiplicationis a major function for implementing the operation.
The core consists of the following componentsand integrated into one unit i.e. in chip form and theyare connected together into the chip in parallel byproviding same clock to enhance the speed.
• Constant coefficient memory• Input data memory• Arithmatic and logic unit• Timing and control unit• Register x• Register b• Accumulator
SHORT PAPER
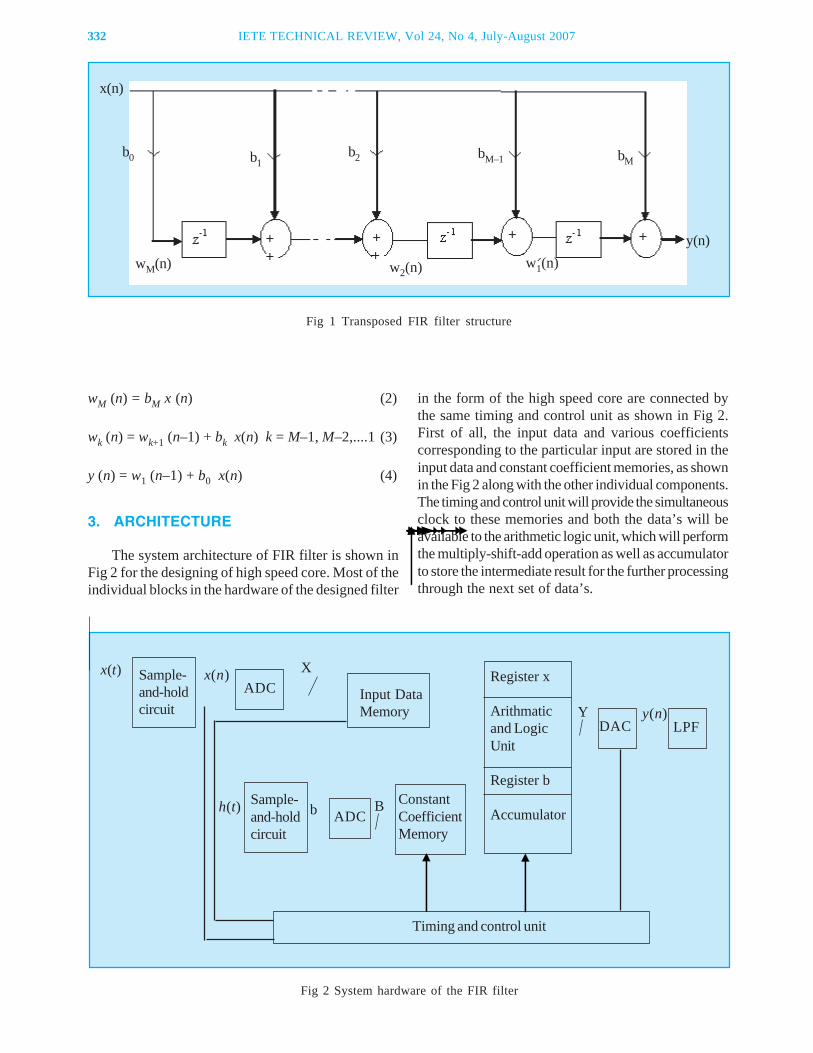
332 IETE TECHNICAL REVIEW, Vol 24, No 4, July-August 2007
wM (n) = bM x (n) (2)
wk (n) = wk+1 (n–1) + bk x(n) k = M–1, M–2,....1 (3)
y (n) = w1 (n–1) + b0 x(n) (4)
3. ARCHITECTURE
The system architecture of FIR filter is shown inFig 2 for the designing of high speed core. Most of theindividual blocks in the hardware of the designed filter
in the form of the high speed core are connected bythe same timing and control unit as shown in Fig 2.First of all, the input data and various coefficientscorresponding to the particular input are stored in theinput data and constant coefficient memories, as shownin the Fig 2 along with the other individual components.The timing and control unit will provide the simultaneousclock to these memories and both the data’s will beavailable to the arithmetic logic unit, which will performthe multiply-shift-add operation as well as accumulatorto store the intermediate result for the further processingthrough the next set of data’s.
x(n)
b0 b1b2 bM–1 bM
wM(n) w2(n) w1(n)y(n)
Fig 1 Transposed FIR filter structure
Fig 2 System hardware of the FIR filter
Sample-and-holdcircuit
x(t)ADC
X
Input DataMemory
Register x
Arithmaticand LogicUnit
Register b
Accumulator
DAC LPF
x(n)
Y y(n)
Timing and control unit
h(t) Sample-and-holdcircuit
ADCb B ConstantCoefficientMemory
4. SIMULATION RESULTS
The final response of the system is expressedmathematically in the following form.
My (n) = S bk x (n–k) (5)
k=0
= b0 x(n) + b1 x(n–1) + ... + bM x (n–M)
First of all, all the data’s are stored in the twomemories i.e. input data memory contains the binaryinformation after conversion by sample-and-hold circuitand ADC corresponding to the input signal in analogform represented by x(t), and, in the similar fashion,the constant coefficient memory also contains thesame type of the information corresponding to thecoefficient values that are present in the h(t) [9].Now, the various data’s are suitable for arithmetic andlogic circuit in the binary form. This circuit will performall the computations i.e. multiplications, additions, andshiftings operation. The intermediate results are storedin the accumulator, which will be required to obtain thefinal digital output values. After getting it, this calculatedvalue will pass through a DAC to convert into discreteanalog form, which will be the desired output value[10].
Let the input data x(n) has the following discretevalues after converting x(t) by sample-and-hold circuit.
x(n) = {0.1, 0.2, 0.3, 0.4}
and the coefficient corresponding to impulse responsehas the following values as per the input valuesaccordingly.
b = {0.01, 0.02, 0.03, 0.04}
These above data’s are taken arbitrarily for gettingtime output signal and the input data may be taken forany real time signal processing application i.e. speechsignal, audio signal, vedio signal, any othercommunication signal, and any biomedical signal etc.
From equation (5) for M = 3, the output equation willbe as below.
y(n) = b0 x(n) + b1x (n–1) + b2 x (n–2)+b3x(n–3)(6)
The final discrete output obtained after theprocessing is {0.001, 0.004, 0.010, 0.020}, which isdetermined by the MATLAB Software usingconvolution to the maximum length of the one of thesignal between input signal and impulse response inthe discrete domain and the analog output y(t) will bereconstructed by the LPF.
Compared with the direct form structure, the directform structure will also obtain the same value of theoutput as obtained for transposed form structure. Asfar as, the analysis contains the similar steps with thesame equation and difference observed only in thestructure.
5. CONCLUSION
In this paper, a high speed FIR filtering core fortransposed form structure is presented. This designapproach can also be applied for the implementationof other configuration of digital FIR filter and that willequally work well as far as high speed implementationis concerned. The digital portion of design can beeasily simulated by VHDL software and also it can bedownloaded on the FPGA package to allocate thevarious functioning of the pins for making core in theIC industry where micro chips are being fabricated.
REFERENCES
1. Ahmet Teyfik Erdogan & Tughrul Arslan, On theLow-Power Implementation of FIR FilteringStructures on Single Multiplier DSPs, IEEETransactions on Circuits and Systems-II: Analogand Digital Signal Processing, vol 49, no 3, March2002.
2. A T Erdogan & T Arslan, Low power multiplicationscheme for FIR filter implementation on singlemultiplier CMOS DSP processors, ElectronicsLetters, vol 32, no 21, 10th October, 1996.
3. V A Bartlett & E Grass, A Low power AsynchronousVLSI FIR Filter, IEEE 2001.
4. A Chandrakasan, S Shang & R W Broderson , Low-Power CMOS Digital Design, IEEE Journal of Solid-State Circuits, vol SC-27, pp 473-484, 1992.
5. J Bhasker, VHDL Primer, Third Edition, PearsonEducation Asia, India.
6. E P Zwyssig, A T Erdogan & T Arslan, Low powersystem on chip implementation scheme of digitalfiltering cores, Low Power IC Design Seminar, 19January 2001, London, UK.
7. Artur Krukowski & Izzet Kale, Simulink/Matlab-to-VHDL Route for Full-Custom/FPGA RapidPrototyping of DSP Algorithms, Matlab DSPConference (DSP'99), Tampere, Finland, 16-17November 1999.
8. John G Proakis & Dimitris G, Manolakis., DigitalSignal Processing Principles, Algorithms, andApplications, Third Edition, Prentice Hall of IndiaPrivate Limited, New Delhi- 110001, India, 2004.
9. Willis J Tompkins, Biomedical Digital SignalProcessing, Prentice-Hall of India Private Limited,New Delhi, India, 2006.
10. Simon Haykin, Communication System, ThirdEdition, Printed by Thomson Press (India) Ltd., JohnWiley & Sons.
M ARIF : DESIGN OF A FIR FILTERING CORE 333
334 IETE TECHNICAL REVIEW, Vol 24, No 4, July-August 2007
M Arif born on 11th January, 1965,at Ghazipur, UP, India. He received BEin (Electronics Engineering) fromGorakhpur University and MTech in(Electronics and CommunicationEngineering) from KurukshetraUniversity, India in 1987 and 1997respectively. He joined in Electronicsand Communication EngineeringDepartment, Regional Engineering
Author
College Kurukshetra, Haryana, India as Lecturer in 1988, andpresently serving in Electronics and Communication EngineeringDepartment. National Institute of Technology (Formerly RegionalEngineering College) Kurukshetra, Haryana, as Lecturer in SeniorScale. His research interest is Digital Signal Processing. He is lifemember of ‘The Institution of Society for Technical Education’.
* * *
335
Paper No 126-B; Copyright © 2007 by the IETE.
IETE Technical ReviewVol 24, No 4, July-August 2007, pp 335-337
Interactive Education through ECT —A Focus on Rural India
S ARUMUGA PERUMAL
Head, Department of Computer Science, S T Hindu College, Nagercoil 629 002, India.email: [email protected]
Science and technology education have enjoyed a meaningful partnership across mostof this century. The work of scientists embraces an array of technologies, and majorhappenings in science are often accompanied by complicated applications of technology. Asa result, a complete science education has involved a commitment to the inclusion oftechnology, both as a tool for learning science content and processes and as a topic ofinstruction in itself. Due to the fast development of information highway there is a remarkableraise in the quality of education throughout the world. With the invention of new technologieslike high speed computer networks and multimedia computers, there is an increasingawareness that direct face to face teaching is not the only possible mode of teaching in aschool system. There is a demand for preparing high quality multimedia course materialsacross all faculties, which can be used by learners of the course who either cannot attendthe live lectures or prefer to study in an off-line mode. This paper discusses and suggestssome ideas and necessary changes in implementation of independent learning of Scienceand Technology education through e-learning concepts in education which leads to improvethe education culture in rural area.
Structured approach is an approach that tells us“What to teach?” and not “How to teach?”. This kindof approach has the following characteristics
• Usefulness• Simplicity• Teaching abilityThe structured approach has the following
approaches
• Structured approach makes use of carefullyselected and graded language items
• Structured approach lays emphasis onpresentation
• Structured approach stresses habit formation• Structured approach makes the learner as
active participant.
The course structure is prepared effectively sothat it will coincide with the recent trends in theirrespective fields. The course structure is innovativeso that they can be motivated for research in theirfields. The curriculum is designed to make sure thatthe students get the core knowledge they need—thatthey learn what they need to know to succeed andthrive. The training material will improve the creativityof the new fields. So a well advanced planning is
INTRODUCTION
THE explosion of digital technology has created arevolution in development of information highway.
The flexibility, speed, and storage capacity ofcontemporary desktop computers is causing scienceeducators to redefine the meaning of hands-onexperience and rethink the traditional process ofteaching. The challenge facing both science educatorsand science teacher educators is to evaluate relevantapplications for information technologies in the sciencecurriculum. At the same time, instruction utilizinginformation technologies must reflect what is knownabout the effectiveness of student-centered teachingand learning. We choose the Core Knowledge Sequenceas the framework for much of the curriculum thatwe’ve developed in science and Technology.
Components for Education program
The three main elements of this Program are
• Course structure• CDROM materials• Web-based education support system.
SHORT PAPER
336 IETE TECHNICAL REVIEW, Vol 24, No 4, July-August 2007
needed in developing course structure. Beforepreparing course structure it must be discussed withsubject experts for standards. Good courseware mustgive guidance to candidate and also provide a richvariety of background material when ever such isneeded. The advent of digital libraries provides notonly the most significant chances for computer-basedtraining but also the extensive background reservoir ofmaterial needed in many situations.
When designing the course structure in teachingscience and Technology, the following three stages ofteaching structure must be adopted for betterunderstanding of the subject
• Presentation• Practice• Application
Presentation is a one-way traffic. The main aimof presentation is to make clear-cut meaning of thestructures to the students. The presentation involvesoral teaching and situation teaching. Structures arefirst presented orally and then through reading andwriting. Structures are taught in situations so that theybecome real and meaningful for the students. Showingobjects, pictures and charts, matchstick figures, actionsand gestures and verbal situations creates differentsituations.
The importance of the second stage practicing isto reinforce the structure in the minds of the students.
The importance of third stage application is to askthe students to apply the structure in new situations.
The CD-ROM materials are prepared, with thehelp of multi-media technology by subject experts sothat it will motivate their learning interest. The materialsare prepared by combining short phases of presencewith interleaved media-based self-study blocks; theyare well suited for web-based education. An innovativeapproach is taken by integrating all course elements-acoustic and written information, diagrams and figures,animations, simulations, video clips, and laboratoryexercises by presenting in a CDROM materials. Thematerial should include animation system. Animationis a best tool for teaching dynamic phenomena.Animations are used so that they will promote interestin further studying.
The web based education support system andCD-ROM materials are very useful to improvecandidate’s knowledge and skills, regardless of priorknowledge and skills. CD-ROM materials significantlyenhance the effectiveness of teachers creating materials,especially when the CD-ROM was used for self-
study. The web based support system helps forinteraction and evaluation. The interaction is achievedin the web by chatting or by mailing. Some timesadvanced technology of video conferencing may alsobe utilized.
Evaluation and certification can be done byevaluating individual students by giving assignments.Assignments can be submitted from home and discussedwith the subject experts or with peers in an interactivedistant mode.
Cultural change
Though the students learn a subject throughe-education the culture of a country should never beaffected. Every country esteems its own culture andso the fast development in education should go alongin a balanced way without neglecting its own culture.A country will look more gorgeous if it only shineswith blooming flowers of cultural values mingled withdeveloped education. To succeed in modern society,you have to know a lot. And you have to have thisknowledge instantly accessible at your mental fingertips.
In the eyes of sociologists culture is the sum totalof human experiences. It comprises of all humantraits, determined by a cluster of values. These culturalvalues are manifested in our traditions, customs,ideologies, and even in day-to-day life. Each group ofpeople beholds different but certain values and attitudes.A change in attitude alone can bring about a change inthe acquisition of cultural values. Languages on itspart are more helpful for the development of culture.Every language is a product of its own culture. All thechunks and expressions we come across help us tounderstand varied concepts. It is none other than alanguage, which assists each and every one to thinkand speak in terms of concepts. It is the language thathas a great control over the thought process of anindividual. The younger generation is blessed with thecultural elements through the decorative pipes of thelanguage.
The disadvantages of class room teaching are• The classroom pace is moving too slowly for
the gifted child.• The classroom pace is moving too fast—the
child needs 55 minutes to master a conceptbut the bell always rings at 50.
• The child feels left out or bullied.• The child can’t sit still in class or has a learning
challenge.• The child falls outside of the middle range in
the classroom.
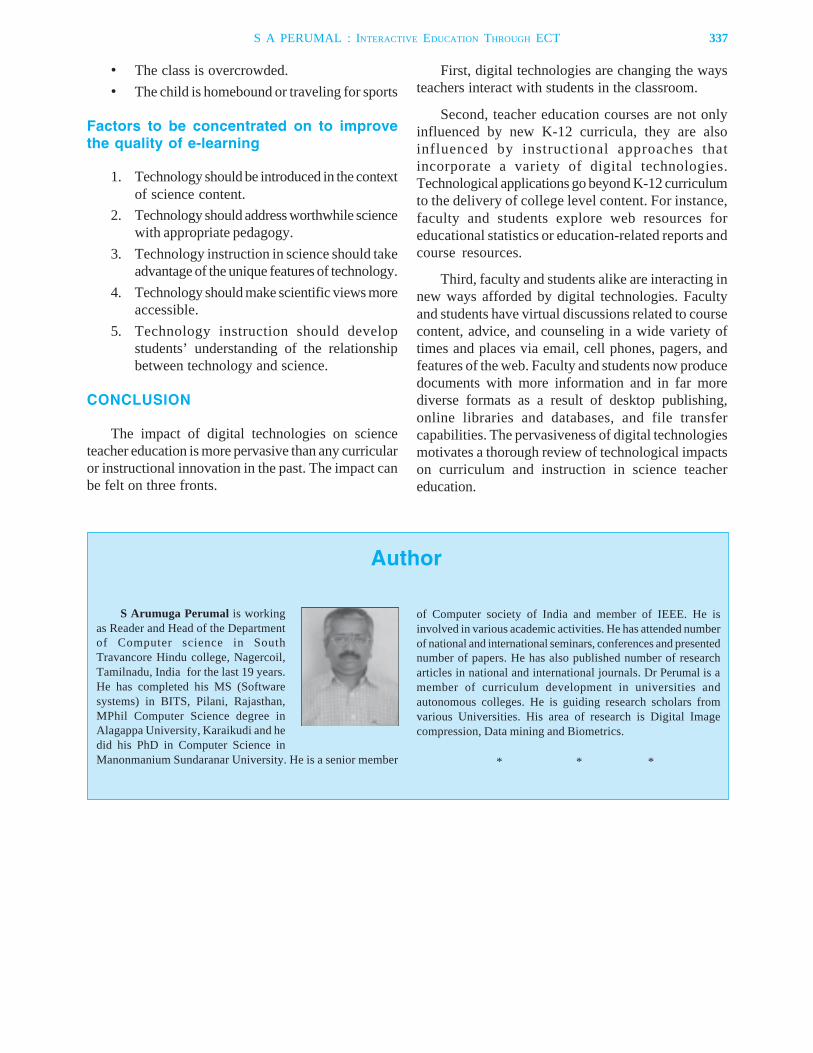
• The class is overcrowded.• The child is homebound or traveling for sports
Factors to be concentrated on to improvethe quality of e-learning
1. Technology should be introduced in the contextof science content.
2. Technology should address worthwhile sciencewith appropriate pedagogy.
3. Technology instruction in science should takeadvantage of the unique features of technology.
4. Technology should make scientific views moreaccessible.
5. Technology instruction should developstudents’ understanding of the relationshipbetween technology and science.
CONCLUSION
The impact of digital technologies on scienceteacher education is more pervasive than any curricularor instructional innovation in the past. The impact canbe felt on three fronts.
First, digital technologies are changing the waysteachers interact with students in the classroom.
Second, teacher education courses are not onlyinfluenced by new K-12 curricula, they are alsoinfluenced by instructional approaches thatincorporate a variety of digital technologies.Technological applications go beyond K-12 curriculumto the delivery of college level content. For instance,faculty and students explore web resources foreducational statistics or education-related reports andcourse resources.
Third, faculty and students alike are interacting innew ways afforded by digital technologies. Facultyand students have virtual discussions related to coursecontent, advice, and counseling in a wide variety oftimes and places via email, cell phones, pagers, andfeatures of the web. Faculty and students now producedocuments with more information and in far morediverse formats as a result of desktop publishing,online libraries and databases, and file transfercapabilities. The pervasiveness of digital technologiesmotivates a thorough review of technological impactson curriculum and instruction in science teachereducation.
S Arumuga Perumal is workingas Reader and Head of the Departmentof Computer science in SouthTravancore Hindu college, Nagercoil,Tamilnadu, India for the last 19 years.He has completed his MS (Softwaresystems) in BITS, Pilani, Rajasthan,MPhil Computer Science degree inAlagappa University, Karaikudi and hedid his PhD in Computer Science inManonmanium Sundaranar University. He is a senior member
Author
of Computer society of India and member of IEEE. He isinvolved in various academic activities. He has attended numberof national and international seminars, conferences and presentednumber of papers. He has also published number of researcharticles in national and international journals. Dr Perumal is amember of curriculum development in universities andautonomous colleges. He is guiding research scholars fromvarious Universities. His area of research is Digital Imagecompression, Data mining and Biometrics.
* * *
S A PERUMAL : INTERACTIVE EDUCATION THROUGH ECT 337

Serving the needs of Sectors of National Importance likeAtomic Energy, Defence, Space, Security, Power, Telecommunications,Oil/Gas, Steel, Process, Education and E-Governance towards achieving
Self-Reliance
E C I LE C I LE C I LE C I LE C I L
Offers: Control & Automation, Computers, Communication Systems, AntennaSystems, Strategic Electronics, Telecommunication Products, Encryption Systems,Instrumentation Systems, Integrated Security Solutions, Electronic Voting Machinesand more.
The only multi- technology company that providesTotal Systems Solutions
Electronics Corporation of India LimitedCorporate Business Development Group
PO ECIL, Hyderabad - 500 062, IndiaE-mail: [email protected] web: www.ecil.co.in

CALL FOR PAPERS
Special Issue of IETE Journal of Researchon
‘Microwave Circuits and Systems’
Microwave technology has rich history dating back to the 19th Century and fundamental discoveries inelectromagnetic with a very strong and elegant foundation established by Maxwell with his famous equations. Thethrust of the research supporting microwave technology has been in establishing the basic elements to support thegrowth and development of the application and also to extend the usable spectrum to higher and higher frequencies.Although major thrust and applications of Microwave Circuits are for the Defense field, the growth of Satellite andWireless Communication in last few decades has proved the utility of this band for civilian applications also. Thepurpose of this special issue on ‘Microwave Circuits and Systems’ is to exhibit the state-of-the-art research in ourcountry in this area and also to give future direction for research to young scientists and engineers.
Topics of interest for the Special issue are:
• RF Circuit Design• CAD of Microwave Circuits• EMI/EMC• Microwave Integrated Circuits• Satellite Communication Systems• Passive Microwave Devices• Radar Components• Super Components for EW systems• Feed Networks for Phased Arrays• TR/ATR Modules• Air Borne/Space Borne Microwave Circuits and Systems• MEMS• Circuit Synthesis and Simulation• Microwave Measurement techniques
Conceptual review papers covering the theme with less mathematics are invited. Research papers with original contributionin any of the above area with more stress on ‘Results and Discussion’ are most welcome. Articles of about 4000 to 5000words including figures, graphs, tables and references typed neatly in A4 size paper in double space as per IETEguidelines to author (given in website www.iete.org under the heading publication) should be sent to the Guest Editor atthe address given below. Two hard copies along with a soft copy in MS word should be sent to:
Prof V M Pandharipande,Guest Editor, IETE Journal of Research,Director,Centre for Excellence in Microwave Engineering,Department of Electronics & Communication Engineering,Osmania University, Hyderabad - 500 007 (AP).
Email: [email protected];Ph:040-27071273,27682234
Last Date for receiving the papers: 30th October 2007; Papers to be reviewed: 31st December 2007;Issue to be published: March 2008.
Printed and Published by Brig (Retd) V K Panday for the Institution of Electronics and Telecommunication Engineers,2, Institutional Area, Lodi Road, New Delhi 110 003 (India) and printed at the Shivam Offset Press, A-12/1, Naraina Indl. Area,Phase I, New Delhi-110 028 (India). Dy Managing Editor : CDR A P Sharma, IN (Retd) • Copyright © 2007 by the IETE
Registered with the Registrar of Newspapers for India, Delhi under Regn. No. 42814/84