IEA workshop Re-defining climate ambition to “well … workshop Re-defining climate ambition to...
17
© OECD/IEA 2016 Transport breakout group IEA workshop Re-defining climate ambition to “well-below 2°C” 20 June 2016 Pierpaolo Cazzola
Transcript of IEA workshop Re-defining climate ambition to “well … workshop Re-defining climate ambition to...

© OECD/IEA 2016
Transport breakout group
IEA workshop
Re-defining climate ambition to “well-below 2°C”
20 June 2016
Pierpaolo Cazzola

© OECD/IEA 2016
GHG emission projections Current ETP scenarios
0
5
10
15
20
25
30
35
40
45
2015 2020 2025 2030 2035 2040 2045 2050
GH
G e
mis
sio
ns
(Gt
CO
₂)
Other transformation reduction
Power reduction
Transport reduction
Agriculture reduction
Services reduction
Residential reduction
Industry reduction
Other transformation
Power
Transport
Agriculture
Services
Residential
Industry
Strongest cuts in power generation (fully decarbonized in OECD) Major contributions remain in transport and industry 800 Gt budget (2DS scenario is based on 1000 Gt) suggests that 2050
emissions should be halved
4DS
2DS
OECD
Non-OECD
World
© OECD/IEA 2016
0
2
4
6
8
10
12
14
2015 2020 2025 2030 2035 2040 2045 2050
We
ll to
wh
ee
l GH
G e
mis
sio
ns
(Gt
CO
₂)
Aviation reduction
Shipping reduction
Rail reduction
Trucks reduction
Buses reduction
Cars and LCVs reduction
2 and 3 wheelers reduction
Aviation
Shipping
Rail
Trucks
Buses
Cars and LCVs
2 and 3 wheelers
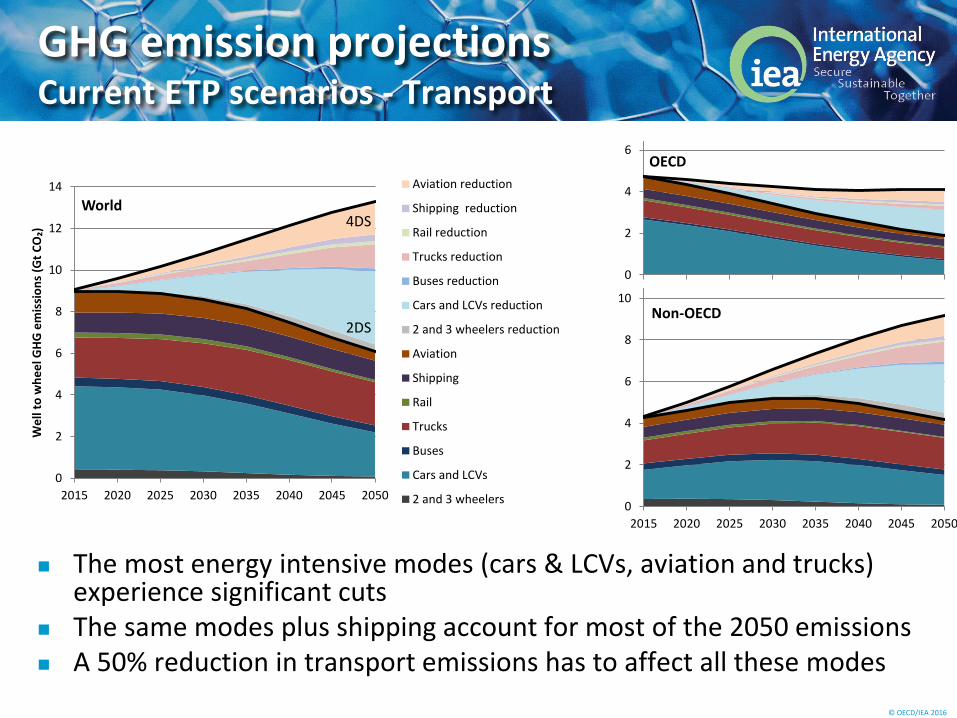
GHG emission projections Current ETP scenarios - Transport
The most energy intensive modes (cars & LCVs, aviation and trucks) experience significant cuts
The same modes plus shipping account for most of the 2050 emissions A 50% reduction in transport emissions has to affect all these modes
4DS
2DS
OECD
Non-OECD
World
© OECD/IEA 2016
Proposal to frame the discussion
It is clear that we need to identify ways to move beyond the changes envisaged in 2DS scenario
The roadmap proposed by Patrick Oliva is fairly aligned with 2DS developments
We would like to show you basic elements of our considerations for 2DS in each mode (as well as biofuels) and ask you questions on Wrong assumptions, vision, understanding Suggested changes to go beyond 2DS
We are suggesting some ideas, but the discussion shall not be restricted to those
We will get started from the main modes where plus biofuels and behavioural aspects, and then eventually cover the rest (less controversial), to maximize benefits of having you all here
The idea is to prioritize least cost options with the highest capacity to increase the sustainability of transport (win-win solutions for local pollution and noise work best)
We want you to talk, not us…

© OECD/IEA 2016
Going beyond the IEA 2DS Cars and LCVs 1/2
Stock growth contained by avoid and shift policies Technologies deliver fuel economy savings compatible with GFEI targets 150 million EVs on the road by 2030, nearly one billion by 2050, boosted by
encouraging signs and taking advantage of the PHEV flexibility Hydrogen market penetration limited
Need for curtailed electricity for production via electrolysis Need for centralized production to contain costs Need to build distribution infrastructure: unlikely without a systemic change in all sectors) Much higher investment risks
0
500
1 000
1 500
2 000
2 500
3 000
3 500
2010 2020 2030 2040 2050
mill
ion
s
2DS
Lighter shades (top) designate urban activity, darker shades (bottom) non
2010 2020 2030 2040 2050
4DS
2-wheelers are all urban by assumption
Gasoline ICE Diesel ICE CNG/LPG Hybrids
(urban) (urban) (urban) (urban)
2010 2020 2030 2040 2050 2010 2020 2030 2040
Plug-in electric Electric Fuel cell
(urban) (urban) (urban)
2040 2050
2050 4DS-2DS emission cuts over 4DS baseline: 62%
MEDIUM-HIGH

© OECD/IEA 2016
Going beyond the IEA 2DS Cars and LCVs 2/2
Role of EVs in a scenario beyond 2DS? No cap? Synergies (slow chargers) with smart energy systems and DSM, but also risks (fast chargers) Battery costs? Range limitations? Charging infrastructure? e-vkm % for PHEVs? Long-term impacts on governmental revenues & changes in taxation of transport?
Hydrogen? Role of shared mobility?
Higher mileage, lower stock, quicker stock turnover, faster technology penetration… What shall be the market share? Impacts on shares of public transport? Complementarity? Policy suggestions?
Role of autonomous driving? Counterproductive (increased car travel, detrimental for public transport)? Useful (ecodriving,
technology uptake)?
More modal shift?
0
500
1 000
1 500
2 000
2 500
3 000
3 500
2010 2020 2030 2040 2050
mill
ion
s
2DS
Lighter shades (top) designate urban activity, darker shades (bottom) non
2010 2020 2030 2040 2050
4DS
2-wheelers are all urban by assumption
Gasoline ICE Diesel ICE CNG/LPG Hybrids
(urban) (urban) (urban) (urban)
2010 2020 2030 2040 2050 2010 2020 2030 2040
Plug-in electric Electric Fuel cell
(urban) (urban) (urban)
2040 2050
2050 4DS-2DS emission cuts over 4DS baseline: 62%
MEDIUM-HIGH

© OECD/IEA 2016
Gasoline ICE Diesel ICE CNG/LPG Hybrids Plug-in electric
0
20
40
60
80
100
120
2010 2020 2030 2040 2050
mill
ion
s
2DS
2010 2020 2030 2040 2050
4DS
Going beyond the IEA 2DS Trucks 1/2
Stock growth contained by avoid and shift policies Baseline freight activity and hence stock growth may be underestimated (we are working on this)
Fuel economy improvement does not exceed 35% in OECD (catch up in Non-OECD) Improved diesels, some hybridization in both medium and heavy trucks PHEVs for medium trucks (urban)
No major technology shift currently assumed Limited electrification, given the high range Very limited use of hydrogen, given risks and need for systemic change to justify investment and
cost reductions for fuel cells and hydrogen distribution infrastructure costs
Need for biofuel for decarbonization Diesel pool: high risk with respect to cost reductions
Gasoline ICE Diesel ICE CNG/LPG Hybrids
(urban) (urban) (urban) (urban)
2010 2020 2030 2040 2050 2010 2020 2030 2040
Plug-in electric Electric Fuel cell
(urban) (urban) (urban)
2040 2050
2050 4DS-2DS emission cuts over 4DS baseline: 36%
LOW

© OECD/IEA 2016
Gasoline ICE Diesel ICE CNG/LPG Hybrids Plug-in electric
0
20
40
60
80
100
120
2010 2020 2030 2040 2050
mill
ion
s
2DS
2010 2020 2030 2040 2050
4DS
Going beyond the IEA 2DS Trucks 2/2
Role of EVs in a scenario beyond 2DS? Battery costs? Power requirements bring them up? Range assumptions (especially PHEV)? e-vkm % for PHEVs? Charging infrastructure? Catenary lines and PHEV heavy duty trucks? Prospects? Is this a priority? Long-term impacts on governmental revenues & changes in taxation of transport?
Hydrogen? Role of logistics?
Urban freight innovations
Modal shift? We would like to improve our assessment of change in the stock growth
Role of autonomous driving? Platooning? Eco-driving?
Gasoline ICE Diesel ICE CNG/LPG Hybrids
(urban) (urban) (urban) (urban)
2010 2020 2030 2040 2050 2010 2020 2030 2040
Plug-in electric Electric Fuel cell
(urban) (urban) (urban)
2040 2050
2050 4DS-2DS emission cuts over 4DS baseline: 36%
LOW
© OECD/IEA 2016
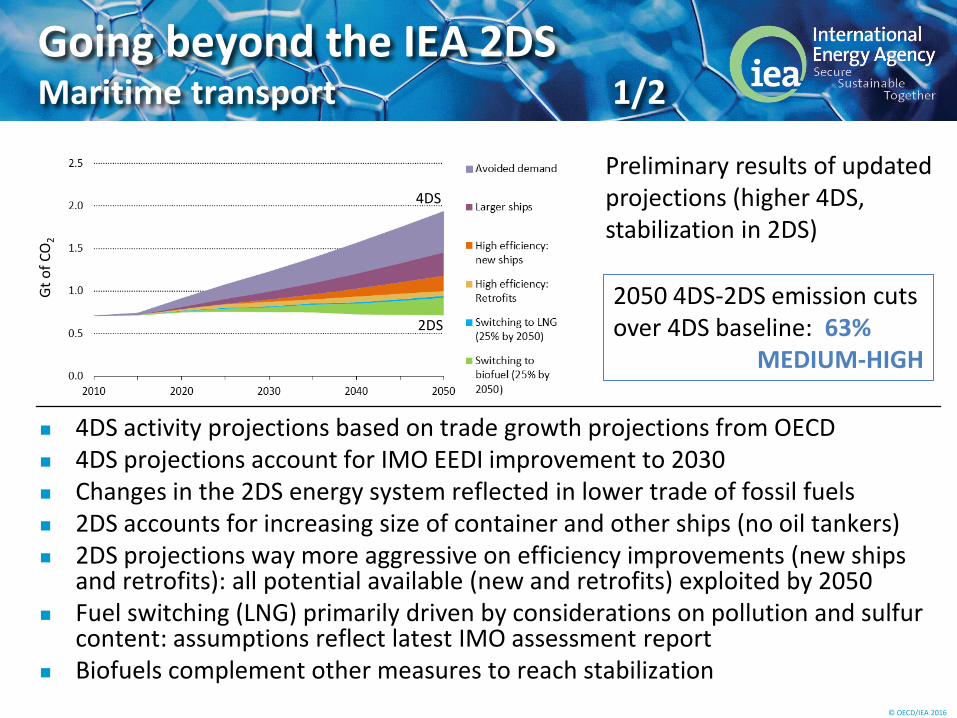
Going beyond the IEA 2DS Maritime transport 1/2
4DS activity projections based on trade growth projections from OECD 4DS projections account for IMO EEDI improvement to 2030 Changes in the 2DS energy system reflected in lower trade of fossil fuels 2DS accounts for increasing size of container and other ships (no oil tankers) 2DS projections way more aggressive on efficiency improvements (new ships
and retrofits): all potential available (new and retrofits) exploited by 2050 Fuel switching (LNG) primarily driven by considerations on pollution and sulfur
content: assumptions reflect latest IMO assessment report Biofuels complement other measures to reach stabilization
2050 4DS-2DS emission cuts over 4DS baseline: 63%
MEDIUM-HIGH
Gt
of
CO
2
Preliminary results of updated projections (higher 4DS, stabilization in 2DS)
4DS
2DS

© OECD/IEA 2016
Going beyond the IEA 2DS Maritime transport 2/2
Our current assumptions are rather radical on energy efficiency (especially retrofits): are we off track on this?
Increased use of biofuels to go beyond 2DS? Role of electrification and hydrogen? We excluded both options for long-distance
shipping in 2DS Electrification seems viable for passenger (e.g. ferries) and short sea shipping only. Correct? Hydrogen may be viable for longer distances (synergies for centralized production and contextual
use by road vehicles serving ports). Estimates on costs? Losses of carrying capacity? Storage? Liquid? Life cycle efficiency?
Role of renewables (wave power, kite sails, or solar)? Partly already accounted for in energy efficiency
2050 4DS-2DS emission cuts over 4DS baseline: 63%
MEDIUM-HIGH
Gt
of
CO
2
Preliminary results of updated projections (higher 4DS, stabilization in 2DS)
4DS
2DS

© OECD/IEA 2016
Modal shifts & behaviour
We have a fairly good understanding of some of the mechanisms leading to modal shifts in urban passenger transport, as well as the potential impacts of policy tools stimulating these changes
Modal shifts tend to lead to cost savings due to lower road transport infrastructure requirements and declines in the total car stock
Other behavioural changes may have similar impacts: Shifting to smaller/lighter vehicles for personal mobility, for instance, would
entail lower vehicle purchase and usage costs Sharing vehicles (car sharing) rather than owning them leads to changes in
mileage, stock and turnover Sharing rides leads to higher load factors and is likely to be associated with
lower ownership and higher mileages
To which extent shall we attempt to grasp these changes? Do you have suggestions on the estimation of potentials/impacts suitable for the
type of analysis we need to undertake? Which behavioral change shall we consider with priority? Why? Freight? Any suggestion on the way to assess modal shift potentials?

© OECD/IEA 2016
Biofuels
Biofuels are at the centre of the debate because of sustainability issues
Advanced biofuels supply chains can achieve significant reductions in well-to-wheel emission factors, do not compete directly for land with food, and have low LUC impacts. Even in these circumstances, they do not seem likely to get to net zero, due to residual emissions from processes and agriculture)
2DS results suggest that biofuels are required to substitute for diesel, but economic assessments suggest that the prospects for cost reductions are poorer
Biosyngas could be of interest, but the potential for its supply seems more limited than for other biofuels
What are your views on the statements above? How about grasses and soil carbon sequestration?
How do the cost prospects for biodiesel compare with those of alternative technologies (e.g. catenary lines in truck electrification) – which seems to be a more viable decarbonisation pathway?
Are residual emissions for advanced biofuels a showstopper for a scenario beyond 2DS? Are these one of the areas where we should think about offsets?
© OECD/IEA 2016
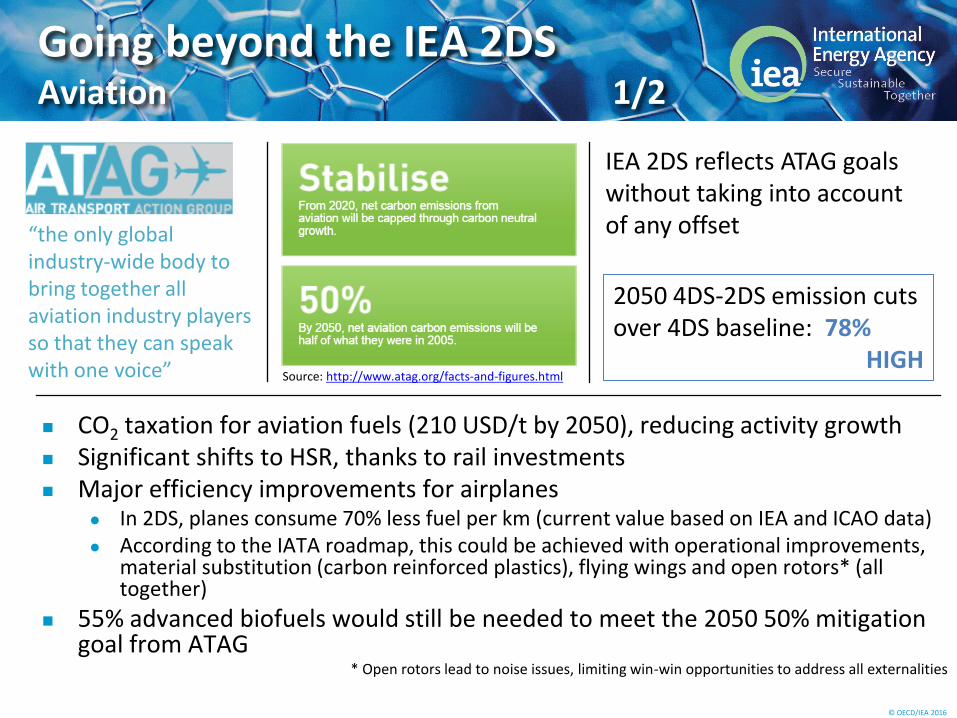
Going beyond the IEA 2DS Aviation 1/2
CO2 taxation for aviation fuels (210 USD/t by 2050), reducing activity growth Significant shifts to HSR, thanks to rail investments Major efficiency improvements for airplanes
In 2DS, planes consume 70% less fuel per km (current value based on IEA and ICAO data) According to the IATA roadmap, this could be achieved with operational improvements,
material substitution (carbon reinforced plastics), flying wings and open rotors* (all together)
55% advanced biofuels would still be needed to meet the 2050 50% mitigation goal from ATAG
* Open rotors lead to noise issues, limiting win-win opportunities to address all externalities
“the only global industry-wide body to bring together all aviation industry players so that they can speak with one voice”
2050 4DS-2DS emission cuts over 4DS baseline: 78%
HIGH
IEA 2DS reflects ATAG goals without taking into account of any offset
Source: http://www.atag.org/facts-and-figures.html

© OECD/IEA 2016
“the only global industry-wide body to bring together all aviation industry players so that they can speak with one voice”
Going beyond the IEA 2DS Aviation 2/2
Our current assumptions are rather radical in all areas (modal shift, energy efficiency, biofuel use). Is it too much?
Role of electrification and hydrogen? We excluded both options in 2DS
Role of offsets? Aviation is probably the transport mode where the decarbonization of the last
tonne would be extremely expensive, and therefore the mode that is more likely to need offsetting from other areas of the energy system (e.g. power generation from biomass with CCS) or other sectors (e.g. afforestation)
2050 4DS-2DS emission cuts over 4DS baseline: 78%
HIGH
IEA 2DS reflects ATAG goals without taking into account of any offset
Source: http://www.atag.org/facts-and-figures.html

© OECD/IEA 2016
Going beyond the IEA 2DS 2-3 wheelers
Already quasi-decarbonized in 2DS, thanks to electrification China ahead of any other region today, with about 200 M electric two-wheelers on
the road (more than 40% of the total stock) Costs: electric two wheelers already very cheap in Asia
(premium scooter models cost 500 EUR) Significant challenge on the regulatory side (successful introduction in China spurred
by bans for conventional 2-wheelers), but major benefits (GHG, local pollution, noise) Win-win solution to address other externalities local pollution and noise, need to
address recyclability, not an improvement for safety (and related health issues)
What are your views on the above? Shall we account for anything else?
0
200
400
600
800
1 000
1 200
2010 2020 2030 2040 2050
mill
ion
s
2DS
2010 2020 2030 2040 2050
4DS
2-wheelers are all urban by assumption
Gasoline ICE Diesel ICE CNG/LPG Hybrids
(urban) (urban) (urban) (urban)
2010 2020 2030 2040 2050 2010 2020 2030 2040
Plug-in electric Electric Fuel cell
(urban) (urban) (urban)
2040 2050
2050 4DS-2DS emission cuts over 4DS baseline: 82%
HIGH

© OECD/IEA 2016
Going beyond the IEA 2DS Buses
Not central in the IEA technology analysis due to limited fuel and GHG emission saving potential
Relevant mostly for modal shifts Now subject to significant commitments to reduce carbon intensity
(e.g. hybridization, electrification) High mileages and start-stop driving cycles justify technology
deployments to move away from ICEs Electrification seems to be one of the preferred deep
decarbonization options by operators BEVs emerging in China, Latin America (BYD), and elsewhere Trolleybuses widely used in the past and still in use in European cities Interest from UITP Included in narrative by C40 (contributor to the Paris declaration in 2015)
Do you share the views above? Are we missing something important (hydrogen, biofuels, other)?

© OECD/IEA 2016
Going beyond the IEA 2DS Implementing actions
What do you see as key policies allowing to reach 2DS and beyond? In ETP 2016 we recommended a policy portfolio including different
types of instruments
Do you agree with this? Are we off track? Which other actions do you think are necessary to mobilize the change?
Scope Policy category Impact
Avoid/Shift Vehicle
efficiency
Low carbon
fuels
Local Pricing (congestion charges, tolls
parking fees) Yes Possible none
Regulatory (access & parking
restrictions, low emission zones)Yes Possible Minor
Public transport investments Yes Possible none
Compact city Yes none none
National Fuel taxation Yes Yes Possible
Fuel economy regulations none Yes Possible
Vehicle taxation, feebates Possible Yes Possible
Low carbon fuel standards none none Yes
Alternative fuel mandates none none Yes
RD&D support none yes Yes