identifying author inventors from spain: methods and a first insight ...
33
02 2013 Working Paper INSTITUTO DE POLÍTICAS Y BIENES PÚBLICOS (IPP) IDENTIFYING AUTHOR- INVENTORS FROM SPAIN: METHODS AND A FIRST INSIGHT INTO RESULTS STÉPHANE MARAUT IT EXPERT, MADRID, SPAIN & CATALINA MARTÍNEZ CONSEJO SUPERIOR DE INVESTIGACIONES CIENTÍFICAS (CSIC) INSTITUTE FOR PUBLIC GOODS AND POLICIES (IPP)
Transcript of identifying author inventors from spain: methods and a first insight ...
022013 Working Paper
INSTITUTO DE POLÍTICAS Y BIENES PÚBLICOS (IPP)
IdentIfyIng author-Inventors from spaIn:
methods and a fIrst InsIght Into results
stéphane marautIt expert, madrId, spaIn
&CatalIna martínez
Consejo superIor de InvestIgaCIones CIentífICas (CsIC)
InstItute for publIC goods and polICIes (Ipp)
INSTITUTO DE POLÍTICAS Y BIENES PÚBLICOS CCHS-CSIC
Copyright ©2013. Maraut, S .& Martínez, C.. All Rights reserved.Do not quote or cite without permission from the author.
Instituto de Políticas y Bienes PúblicosCentro de Ciencias Humanas y SocialesConsejo Superior de Investigaciones CientíficasC/ Albasanz, 26-28.28037 Madrid (España)
Tel: +34 91 602 2300Fax: +34 91 304 5710
http://www.ipp.csic.es/
The working papers are produced by Spanish National Research Council – Institute of Public Goods and Policies and are to be circulated for discussion purposes only. Their contents should be considered to be preliminary. The papers are expected to be published in due course, in a revised form and should not be quoted without the authors´ permission.
How to quote or cite this document:
Maraut, S. y Martínez, C. (2013). Identifying author-inventors from Spain: methods and a first insight into results. Instituto de Políticas y Bienes Públicos (IPP), CCHS-CSIC, Working Paper. 2013-02Disponible en: digital.csic.es
1
Identifying author-‐inventors from Spain: methods and a first insight into results
Stéphane Maraut IT expert, Madrid, Spain
Catalina Martínez1 Institute of Public Goods and Policies (CSIC-IPP), Madrid, Spain
Abstract The aim of this paper is to describe a matching and disambiguation methodology for the identification of author-‐inventors located in the same country. It aims to maximize precision and recall rates by taking into account national name writing customs in the name matching stage and by including a recursive validation step in the person disambiguation stage. An application to the identification of Spanish author-‐inventors is described in detail, where all SCOPUS 2003-‐2008 publications of Spanish authors are matched to all 1978-‐2009 EPO applications with Spanish inventors. Using this data, we identify 4,194 Spanish author-‐inventors. A first look at their patenting and publication patterns reveal that Spanish author-‐inventors make quite a significant contribution to the overall country’s scientific and technological production in the time periods considered: 27% of all EPO patent applications invented in Spain and 15% of all SCOPUS scientific articles authored in Spain, with important differences across fields and excluding journals in non-‐technologically relevant fields.
Keywords: Authors-‐inventors, Spain, academic patenting, public research organisations, name-‐game, matching, disambiguation, SCOPUS, PATSTAT.
1 Corresponding author: [email protected], Institute of Public Goods and Policies, CSIC-‐IPP, Albasanz 26-‐28, Madrid-‐28037, Spain
2
1. Introduction The analysis of science-‐industry linkages is a growing area of research in science and innovation studies with high policy relevance. Empirical evidence has often relied on personal perceptions and self-‐declarations in surveys (Perkmann et al 2013), but the great potential of patents and publications as sources of information of patterns of effective collaborations is increasingly recognised and used (Meyer 2006). Patents owned by industry but invented by researchers from the public research sector can be used as an indicator of industry-‐science linkages, however building a database of patents reclassified by the institutional affiliation of inventors (public research sector institution, industry or other) requires a substantial effort and the evidence available is still scattered.2
A series of pioneering studies of academic patenting in Finland, Italy, Norway, France, the Netherlands and Sweden found that, in some countries, up to 70% of university-‐invented patents may not be owned by universities (Meyer 2003; Balconi et al. 2004; Iversen et al. 2007; Lissoni et al. 2008). Most available studies of academic patenting can be broken down into those that rely on matching inventors to university staff lists (Thursby et al 2009; Lissoni et al 2008; Lissoni et al 2009) and those that rely on searching for the ‘professor’ title in inventors’ name fields (Schmoch 2007; Czarnitzki et al 2007; von Proff et al 2012). The advantage of the first kind of studies is that they can provide a complete record of the inventive activity of public research sector employees, independently of their publication activity. However, they are usually restricted to one-‐off exercises and generally exclude non-‐permanent research staff. The second type of studies is of limited geographical applicability as it is basically valid only for patents of German and Austrian origin, countries where professors have the custom to sign with their title. The present paper is related to this line of research, regarding a third and less frequent kind of studies: those with the objective to match inventors to authors at a large scale (Noyons et al 2003a and 2003b; Schmoch et al 2012; Dornbusch et al 2012).
We describe the methodology used for a reclassification of Spanish patents by types of inventors, where their public research sector affiliation (or not) is borrowed from what they declare in their publications as authors. Although it is limited by definition to inventors having publication activity, which leaves out inventors with no publication records, it enables to capture changes in the careers of public researchers based on differences in affiliations from publications over time. Moreover, since it is based in a semi-‐automated methodology, it is replicable and scalable, and can be updated regularly, as new data on publications and patents becomes available.
Our aim is to contribute to the expanding literature on matching and disambiguation techniques to create unique person identifiers in patent and publication databases for science and innovation studies (Raffo and Lhuillery 2009; Dornbusch et al 2012; Pezzoni et al 2013). First, we explain the challenges faced and solutions adopted for matching records from two bibliographical databases (SCOPUS for publications and
2 One of the objectives of the European Science Foundation Research Networking Programme Academic Patenting in Europe (ESF APE INV) is to combine effort from different research groups and create a European database of academic patenting. The present project has been developed in the framework of that Programme. For information about the project see http://www.esf-‐ape-‐inv.eu.
3
PATSTAT for patents) where the relevant text fields for person and institution names and addresses are for the most part unstructured and uncleaned. Second, we describe a method that addresses those challenges and also takes account of country-‐specific customs for writing person names.
As regards our empirical results, we also present a first insight into publishing and patenting patterns of the author-‐inventors identified, and into the different types of institutional ownership of patents invented by authors affiliated to Spanish public universities and public research centers.
The remainder of the paper is organized as follows. Section 2 presents some background on previous author-‐inventor matching exercises, describes some of the methodological challenges faced, with particular attention to those specific to Spanish names, and briefly describes our data sources. Section 3 describes our matching and disambiguation methodology. Section 4 presents the results of testing our methodology against a benchmark, and the final results from applying it to the full dataset. Section 5 provides a first insight into patenting and publication patterns of the identified author-‐inventors and Section 6 concludes.
2. Background, challenges and data sources Previous studies implementing and describing large scale matching exercises of publications and patents from European countries include Noyons et al (2003a, 2003b); Schmoch et al (2011) and Dornbusch et al (2012). The first two have a sectoral focus, nanotechnology and life sciences, and the last two have an institutional focus, university authors.
Noyons et al (2003a, 2003b) combine patent and publication indicators at institutional level to identify European centres of excellence in nano-‐science/nanotechnology and in life sciences. They match EPO and PCT nanotechnology patents with priority 1996-‐2000 and Thomson WoS publications of the period 1996-‐2002 in each area. Their matching methodology relies on the exact match of surname and initial of primary first name; match of author and inventor country; match of first authors in case of publications with multiple institutions and match of all authors in case of publications with one institution. Then, based on the results of the previous phase, they manually assign patents and publications to institutions (universities, research institutes and companies). They matched about one third of nanotechnology inventors in their sample to SCI nanotechnology authors and found that at least 50 percent of all patent applications in nanotechnology originate from non-‐profit institutes (universities and non-‐university research institutes).
Schmoch et al (2011) and Dornbusch et al (2012) are closer to the present study insofar as they use the same data sources, the EPO Worldwide Patent Statistical Database (PATSTAT) and Elsevier’s worldwide Publications database SCOPUS, but their methodology is quite different to ours. Schmoch et al (2011) match German, Swiss and French university authors from SCOPUS to inventors of German origin in applications to the German Patent Office and inventors of German, Swiss and French origin in applications to the European Patent Office from PATSTAT for the period 1996-‐2006 using the following criteria: i) same country; ii) same institution; iii) same name and surname; iv) same region (2-‐digit postal code); v) same time period (priority year at
4
least one year before publication); and vi) concordance between technological area and scientific discipline. On the patent side, they rely on information about inventors. Dornbusch et al (2012) apply a similar methodology focusing on German data.
In contrast to these studies, we do not impose any sectoral or institutional restriction to our data sources ex-‐ante and apply a semi-‐automated methodology that is specifically adapted to the peculiarities of the country of origin of the patents and publications.
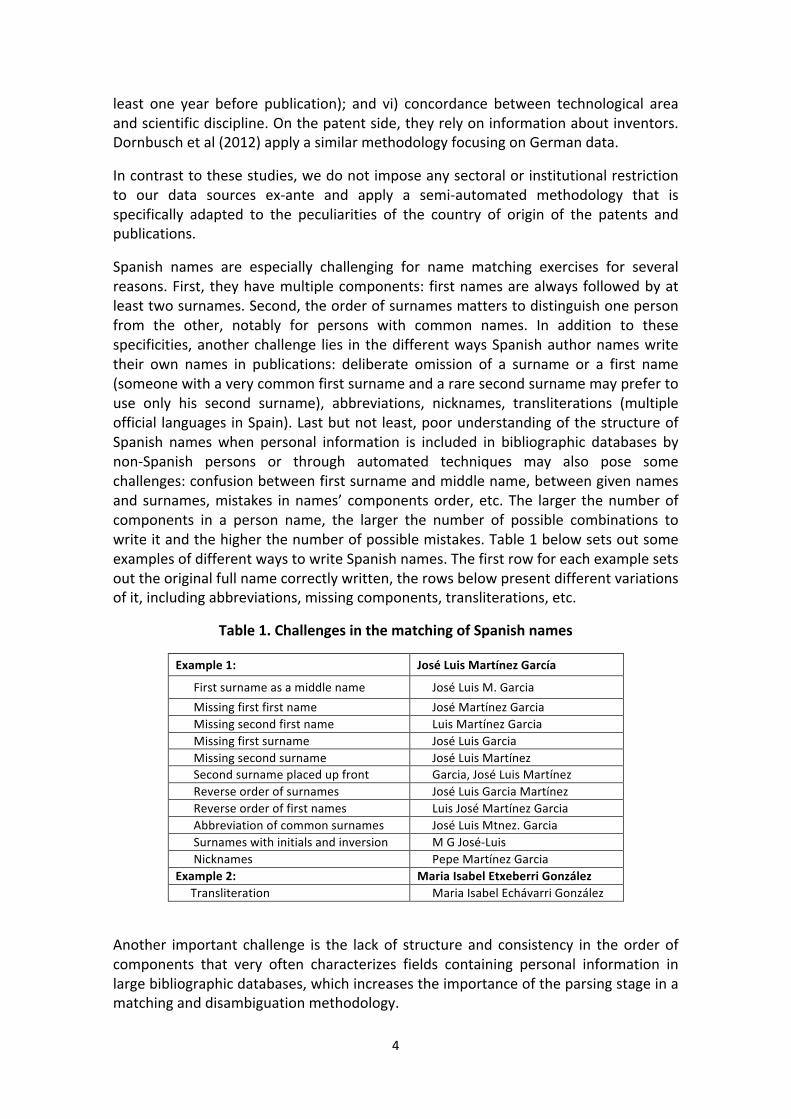
Spanish names are especially challenging for name matching exercises for several reasons. First, they have multiple components: first names are always followed by at least two surnames. Second, the order of surnames matters to distinguish one person from the other, notably for persons with common names. In addition to these specificities, another challenge lies in the different ways Spanish author names write their own names in publications: deliberate omission of a surname or a first name (someone with a very common first surname and a rare second surname may prefer to use only his second surname), abbreviations, nicknames, transliterations (multiple official languages in Spain). Last but not least, poor understanding of the structure of Spanish names when personal information is included in bibliographic databases by non-‐Spanish persons or through automated techniques may also pose some challenges: confusion between first surname and middle name, between given names and surnames, mistakes in names’ components order, etc. The larger the number of components in a person name, the larger the number of possible combinations to write it and the higher the number of possible mistakes. Table 1 below sets out some examples of different ways to write Spanish names. The first row for each example sets out the original full name correctly written, the rows below present different variations of it, including abbreviations, missing components, transliterations, etc.
Table 1. Challenges in the matching of Spanish names
Example 1: José Luis Martínez García
First surname as a middle name José Luis M. Garcia Missing first first name José Martínez Garcia Missing second first name Luis Martínez Garcia Missing first surname José Luis Garcia Missing second surname José Luis Martínez Second surname placed up front Garcia, José Luis Martínez Reverse order of surnames José Luis Garcia Martínez Reverse order of first names Luis José Martínez Garcia Abbreviation of common surnames José Luis Mtnez. Garcia Surnames with initials and inversion M G José-‐Luis Nicknames Pepe Martínez Garcia Example 2: Maria Isabel Etxeberri González Transliteration Maria Isabel Echávarri González
Another important challenge is the lack of structure and consistency in the order of components that very often characterizes fields containing personal information in large bibliographic databases, which increases the importance of the parsing stage in a matching and disambiguation methodology.

5
As said earlier, our main data sources are PATSTAT and SCOPUS, both as of September 2010. On the publications side, we have all 277,937 SCOPUS publications of 2003-‐2008 with at least one Spanish author. 3 On the patents side, we have all 16,731 EPO patent filings (granted or not), filed to the EPO between 1978 (year where EPO was created) and 2009, with at least one inventor located in Spain.4
Both PATSTAT and SCOPUS are large relational databases containing the most relevant bibliographical information from patents and publications as regards person and institution names, geographical location, scientific and technological areas. Most of these elements are recorded in these databases as they appear in the documents, often in unstructured text fields. This means that an important structuration effort needs to be done before being able to treat them statistically. For instance, person name and institution name can be found in the same field or person name can be split in two fields or a mix of both. Matching entities in non-‐structured data environments requires treatments far more complex than usual string matching. To reach a good level and quality of matching, it is essential to understand the meaning and the relevance of the processed entities, something enabled by Natural Language Processing tools. Table 2a and Table 2b below set out some fictitious examples of person names and addresses, as they may appear in PATSTAT and SCOPUS.
Table 2a. Challenges in data structuration (PATSTAT)
Person Name Address Correct Martinez Garcia, José Luis Universidad de Murcia Part of affiliation in person name Martinez Garcia, José Luis
Universidad de Murcia
Part of affiliation in person name Martinez Garcia, José Luis univ ersidad de Murcia Part of person name in address Martinez Garcia, José Luis Universidad de Murcia Multiple person names JL Martinez Garcia, A Garcia Lopez Universidad de Murcia
3 70% of these publications are ‘articles’ (original research or opinion published in peer reviewed journals). ‘Conference papers’ (original article presented at a conference or symposium) represent about 15% and ‘reviews’ (significant review of original research, which typically has an extensive bibliography) around 9% of the total. Other types of documents are much less frequent: letters (4%), notes (1%), editorials (1%) and short surveys (1%) and erratum (less than 1%). For a detailed analysis of SCOPUS coverage in terms of its coverage by areas – geographic and thematic – and the significance of peer-‐review in its publications see de Moya et al (2007). 4 A patent is generally first filed nationally (domestic priority) and additional international protection is eventually sought later in other countries. European applicants would generally then file a patent at EPO (directly or through the PCT route), what implies higher costs and efforts and therefore generally patents of lower value remain domestic, with no subsequent patent application filed at EPO (Martinez 2009; Martinez 2011). For filing years 2005-‐2007, PATSTAT records around 6,400 patent applications filed at the Spanish Patent and Trademark Office (OEPM) by Spanish applicants (PATSTAT only includes published filings, many other OEPM applications are withdrawn during the 18 months between filing and publication and are thus not included). In contrast, PATSTAT includes about 3,400 EPO patent applications filed in the same period by Spanish applicants.
6
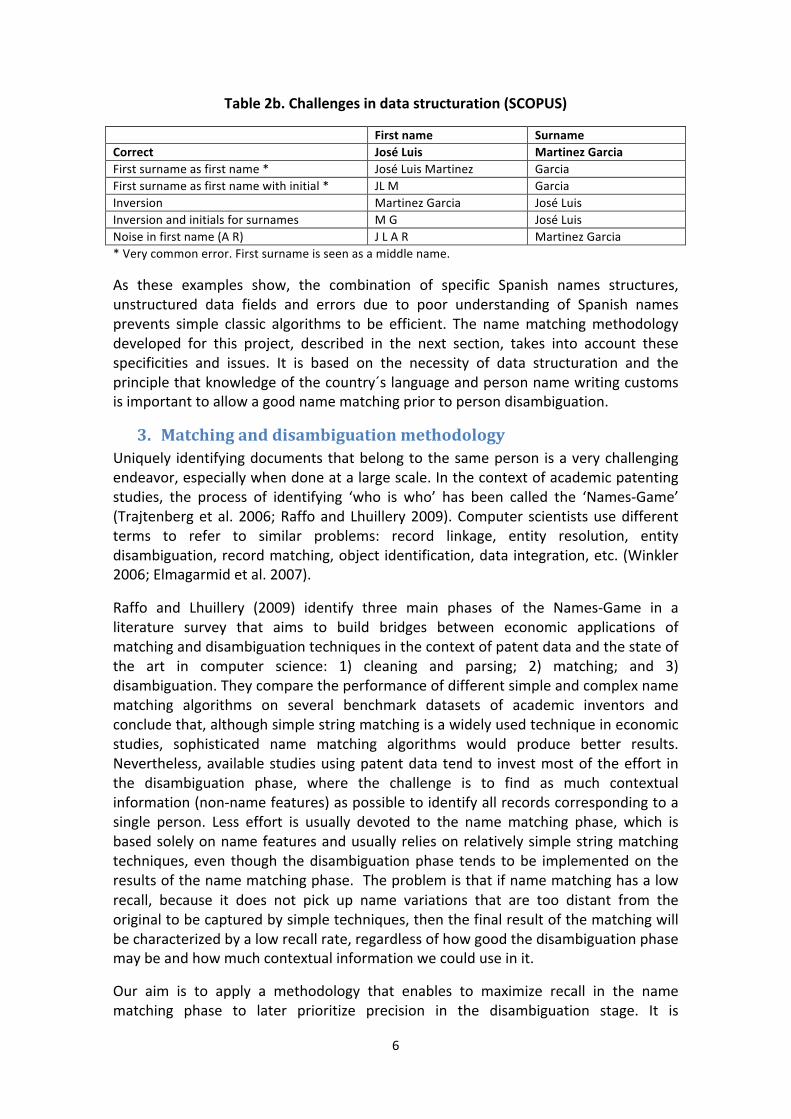
Table 2b. Challenges in data structuration (SCOPUS)
First name Surname Correct José Luis Martinez Garcia First surname as first name * José Luis Martinez Garcia First surname as first name with initial * JL M Garcia Inversion Martinez Garcia José Luis Inversion and initials for surnames M G José Luis Noise in first name (A R) J L A R Martinez Garcia * Very common error. First surname is seen as a middle name.
As these examples show, the combination of specific Spanish names structures, unstructured data fields and errors due to poor understanding of Spanish names prevents simple classic algorithms to be efficient. The name matching methodology developed for this project, described in the next section, takes into account these specificities and issues. It is based on the necessity of data structuration and the principle that knowledge of the country´s language and person name writing customs is important to allow a good name matching prior to person disambiguation.
3. Matching and disambiguation methodology Uniquely identifying documents that belong to the same person is a very challenging endeavor, especially when done at a large scale. In the context of academic patenting studies, the process of identifying ‘who is who’ has been called the ‘Names-‐Game’ (Trajtenberg et al. 2006; Raffo and Lhuillery 2009). Computer scientists use different terms to refer to similar problems: record linkage, entity resolution, entity disambiguation, record matching, object identification, data integration, etc. (Winkler 2006; Elmagarmid et al. 2007).
Raffo and Lhuillery (2009) identify three main phases of the Names-‐Game in a literature survey that aims to build bridges between economic applications of matching and disambiguation techniques in the context of patent data and the state of the art in computer science: 1) cleaning and parsing; 2) matching; and 3) disambiguation. They compare the performance of different simple and complex name matching algorithms on several benchmark datasets of academic inventors and conclude that, although simple string matching is a widely used technique in economic studies, sophisticated name matching algorithms would produce better results. Nevertheless, available studies using patent data tend to invest most of the effort in the disambiguation phase, where the challenge is to find as much contextual information (non-‐name features) as possible to identify all records corresponding to a single person. Less effort is usually devoted to the name matching phase, which is based solely on name features and usually relies on relatively simple string matching techniques, even though the disambiguation phase tends to be implemented on the results of the name matching phase. The problem is that if name matching has a low recall, because it does not pick up name variations that are too distant from the original to be captured by simple techniques, then the final result of the matching will be characterized by a low recall rate, regardless of how good the disambiguation phase may be and how much contextual information we could use in it.
Our aim is to apply a methodology that enables to maximize recall in the name matching phase to later prioritize precision in the disambiguation stage. It is
7
implemented in four steps. The one consists in structuring the text in name and address fields of PATSTAT and in first name and surname fields of SCOPUS.5 The second step consists in matching names of authors from SCOPUS to names of inventors from PATSTAT, as well as the names of their institutions, those to which the authors are affiliated to and those appearing in the name and address fields of patent applicants and inventors. The third step consists in disambiguating pairs of publications and patents to identify those corresponding to single persons. The fourth step is data quality control and disambiguation improvement by recursive techniques.
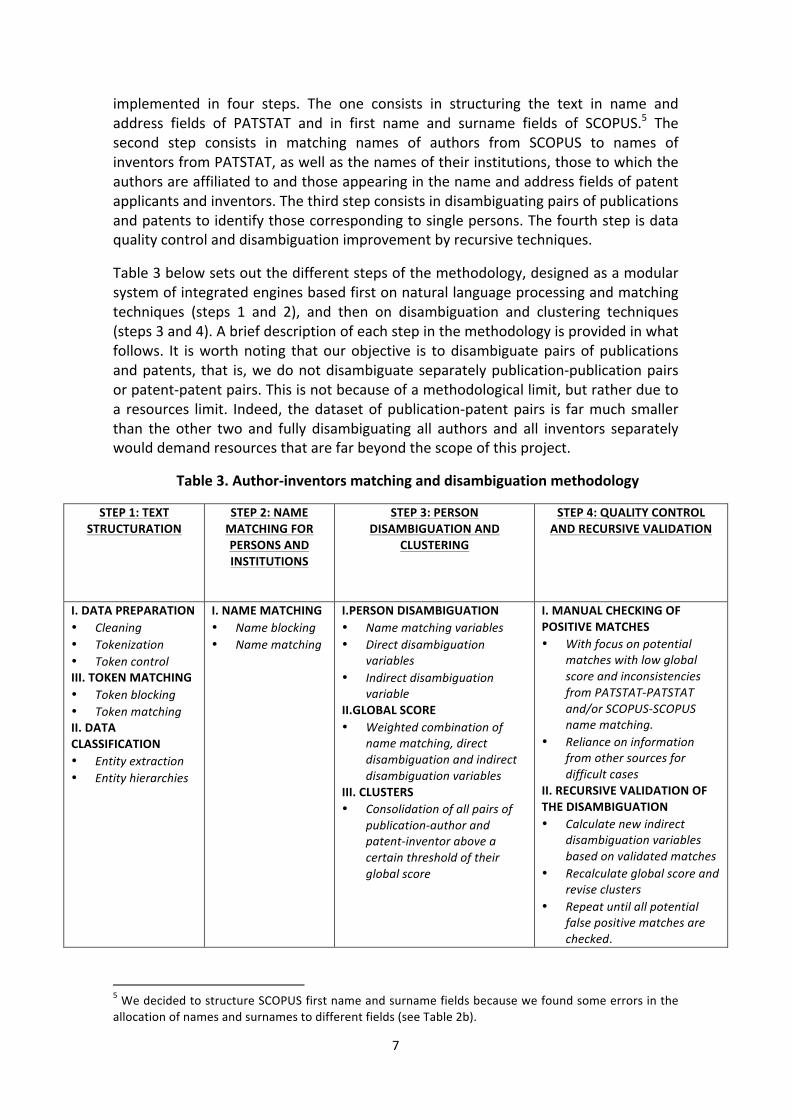
Table 3 below sets out the different steps of the methodology, designed as a modular system of integrated engines based first on natural language processing and matching techniques (steps 1 and 2), and then on disambiguation and clustering techniques (steps 3 and 4). A brief description of each step in the methodology is provided in what follows. It is worth noting that our objective is to disambiguate pairs of publications and patents, that is, we do not disambiguate separately publication-‐publication pairs or patent-‐patent pairs. This is not because of a methodological limit, but rather due to a resources limit. Indeed, the dataset of publication-‐patent pairs is far much smaller than the other two and fully disambiguating all authors and all inventors separately would demand resources that are far beyond the scope of this project.
Table 3. Author-‐inventors matching and disambiguation methodology
STEP 1: TEXT STRUCTURATION
STEP 2: NAME MATCHING FOR PERSONS AND INSTITUTIONS
STEP 3: PERSON DISAMBIGUATION AND
CLUSTERING
STEP 4: QUALITY CONTROL AND RECURSIVE VALIDATION
I. DATA PREPARATION • Cleaning • Tokenization • Token control III. TOKEN MATCHING • Token blocking • Token matching II. DATA CLASSIFICATION • Entity extraction • Entity hierarchies
I. NAME MATCHING • Name blocking • Name matching
I.PERSON DISAMBIGUATION • Name matching variables • Direct disambiguation
variables • Indirect disambiguation
variable II.GLOBAL SCORE • Weighted combination of
name matching, direct disambiguation and indirect disambiguation variables
III. CLUSTERS • Consolidation of all pairs of
publication-‐author and patent-‐inventor above a certain threshold of their global score
I. MANUAL CHECKING OF POSITIVE MATCHES • With focus on potential
matches with low global score and inconsistencies from PATSTAT-‐PATSTAT and/or SCOPUS-‐SCOPUS name matching.
• Reliance on information from other sources for difficult cases
II. RECURSIVE VALIDATION OF THE DISAMBIGUATION • Calculate new indirect
disambiguation variables based on validated matches
• Recalculate global score and revise clusters
• Repeat until all potential false positive matches are checked.
5 We decided to structure SCOPUS first name and surname fields because we found some errors in the allocation of names and surnames to different fields (see Table 2b).
8
3.1. Step 1: Text structuration As part of the first step on text structuration, we implement techniques traditionally used in ‘cleaning and parsing’, and introduce new ones specifically adapted to our setting. Our aim is not to develop a full text structuration solution but to focus on our specific needs in order to classify the most common cases: detect person names, institution names and addresses and then break them into different types of components (first name, surname, institution type and name, place, etc.). This step of our methodology requires a combination of different macro-‐operations: recognition of the language(s); division of the text into sub-‐elements (sentence, part of sentence, text in parentheses, words, signs, etc.); classification of these sub-‐elements into categories (person name, institution name, address, number, other, etc.); and correction of spelling mistakes. And their implementation requires the use of dictionaries and lists of syntactic patterns that we build drawing from different sources.
For the construction of dictionaries of person names, institution names and geographical locations we rely on the following: i) census data acquired from INE including frequency of first names and surnames of Spanish residents in 2009; ii) worldwide dictionaries of names and surnames broken by country and gender from different sources freely available online: iii) lists of Spanish cities, provinces and regions available online; iv) lists of Spanish provinces and regions from the OECD REGPAT database (Maraut et al 2008); v) Spanish, English and French dictionaries from the wiktionary project6; and finally, vi) our own Corpus, built for the project, which includes names of Spanish institutions, names of companies located in Spain and accepted abbreviations for Spanish public universities and public research centers.
Syntactic patterns (also known as grammars) are the structural rules of any given language. A grammar can be very complex (English or Spanish grammar, for instance) or very simple (how to write an address). To build the lists of syntactic patterns for person and institution names that will be used for their detection in unstructured text fields, we rely on the following: i) officially accepted syntactic patterns to write Spanish names; ii) syntactic patterns of Spanish names as written in PATSTAT or SCOPUS (see examples in Tables 2a and 2b); iii) rules to detect affiliations written in English/Spanish/French; and iv) rules to detect addresses, acronyms and abbreviations.
3.1.1. Data preparation Cleaning, tokenization and token control are three processes implemented sequentially as part of the data preparation stage.
The cleaning phase is usually used to eliminate noise (i.e. to delete ‘non-‐relevant’ information such as punctuation) and standardize characters (capital letters, accents or specific letters like Spanish letter ñ). This step can be very destructive and may suppress information that may be very relevant for data structuration. With this in mind, we try to minimize the cleaning stage in order to keep as much information as possible for the parsing step. Actually, we only deal with corrupted characters and replace them by a specific joker. We do not do standardization of characters either, because we use our own collation functions.
6 Based on very large corpus with grammatical tagging (also called part-‐of-‐speech tagging) and word frequency, his project gives access to dictionaries, thesaurus and lemmas (www.wiktionary.org).
9
For the tokenization of text strings, we have defined a list of separators and rules that apply to each separator (priority, position in the text, previous or next sign(s), etc…); separators are usually single non-‐alphanumeric signs but they can also be composed of various signs. Then we break the text into tokens, a token being an entity placed between two separators. It is important to note that we keep tokens and separators in the tokenization results (no information is lost). At this stage, new entries may be added to the dictionary. These new tokens may have several origins: new tokens that are correct but not referenced in our dictionaries, misspellings of existing tokens and false tokens.
Identifying and correcting false tokens is the aim of the final ‘token control’ phase in data preparation. Tokenization can be an issue when entities are processed separately from each other, when they should have been considered together (or vice versa). For example, ‘Maria Guti rrez’ is actually ‘Maria Gutiérrez’. Breaking the surname into two tokens ‘Guti’ and ‘rrez’ is a mistake. The same applies to ‘Maria Guttié rrez’, ‘MariaGutiérrez’ or ‘MariaGuti rrez’. This kind of input mistakes leads to consider false tokens. We have developed a procedure for automatic detection of tokenization mistakes based on new token entries. Automatic correction of those mistakes is far more complex than simply detecting them (except for the case when two existing tokens are merged, such as in ‘MariaGutiérrez’, a case we can deal with) and above all, it may be too costly in terms of performance since this kind of input mistakes are not very common. We therefore decided to correct them manually, given that the number of tokens to control was manageable.
3.1.2. Token matching The token blocking and token matching steps are implemented through a sequence of string matching algorithms where priority is given to efficiency (ability to deal with very large volumes of data in a reasonable processing time). These string matching algorithms rely on a combination of phonetic equivalence rules (sound similarity, position in the text, previous or next letter(s), etc.) based on Spanish and English phonetics and proximity of letters in a QWERTY keyboard.
We distinguish between two different types of token matching: one for misspelling/equivalent tokens (University vs Unvresity or Stéphane vs Stephen) and one for abbreviations (Departamento vs Dep or Dept or Depto). The same kind of string matching algorithms is used for both, but we use different parameter values to calibrate them.
Token blocking is implemented in two steps, sequentially, with the second step applying only to the results of the first.
• First step: simple phonetic functions (a Soundex-‐like function, but more permissive at it allows letters inversion, first letter difference and uses our phonetic rules) and bags (ratio of common letters or sounds). These techniques are selected for their ability to deal with great volumes of data and their good results in eliminating obvious useless comparisons (blocking). Thresholds are very permissive to keep the highest possible recall rate while the number of comparisons dramatically drops (approx. by 1000 times compared to the Cartesian number of comparisons).
10
• Second step: largest common sequence and bags on the retained pairs, but taking in account the position of common letters. These techniques are more sophisticated than those used in the first step, but still have a good blocking capacity and the ratio performance/filtering is good (the number of comparisons drops by 20 times approx.). Thresholds are still very permissive to keep the highest possible recall rate.
Token matching techniques are implemented on the results of the blocking and rely on more sophisticated and powerful algorithms: complex edit distance based on the occurrence of events such as missing, replacement, repetition, inversion, phonetic equivalence, typo, etc. These events take into account the position of the letters or group of letters and the type of letters (e.g. consonant, vowels, ‘weak’ letters such as the ‘h’). We also defined events as a combination of other events or as the absence of event. This phase requires more processing time, but since it is only implemented on the pairs retained after the previous two blocking steps, it has to deal with smaller volumes of data. A token matching score function is calculated as a weighted combination of the events and only pairs obtaining a value above a threshold pass to the following stage. We are quite permissive at this stage to keep as ‘matched tokens’ all comparisons worth considering at later stages of the methodology.
3.1.3. Data classification Data classification is one of the most important stages in our methodology, as it ensures better efficiency and quality to the whole matching process. A good classification will reduce both the number of errors and processing time by eliminating unnecessary comparisons. Also, decision rules can be more accurate and precise, which means a better precision rate with no major impact on the recall rate. It is done in two steps: entity extraction and entity hierarchies.
Entity extraction relies on linguistic grammar-‐based techniques (i.e. the syntactic patterns defined earlier), which enable us to obtain the best precision rates with a low impact on recall rates. It should be noted that the definition of grammars tends to be very time consuming, although in this project these issues have less importance because the scope of the data is relatively narrow (mostly person names, institutions, addresses) and related grammars are basic.
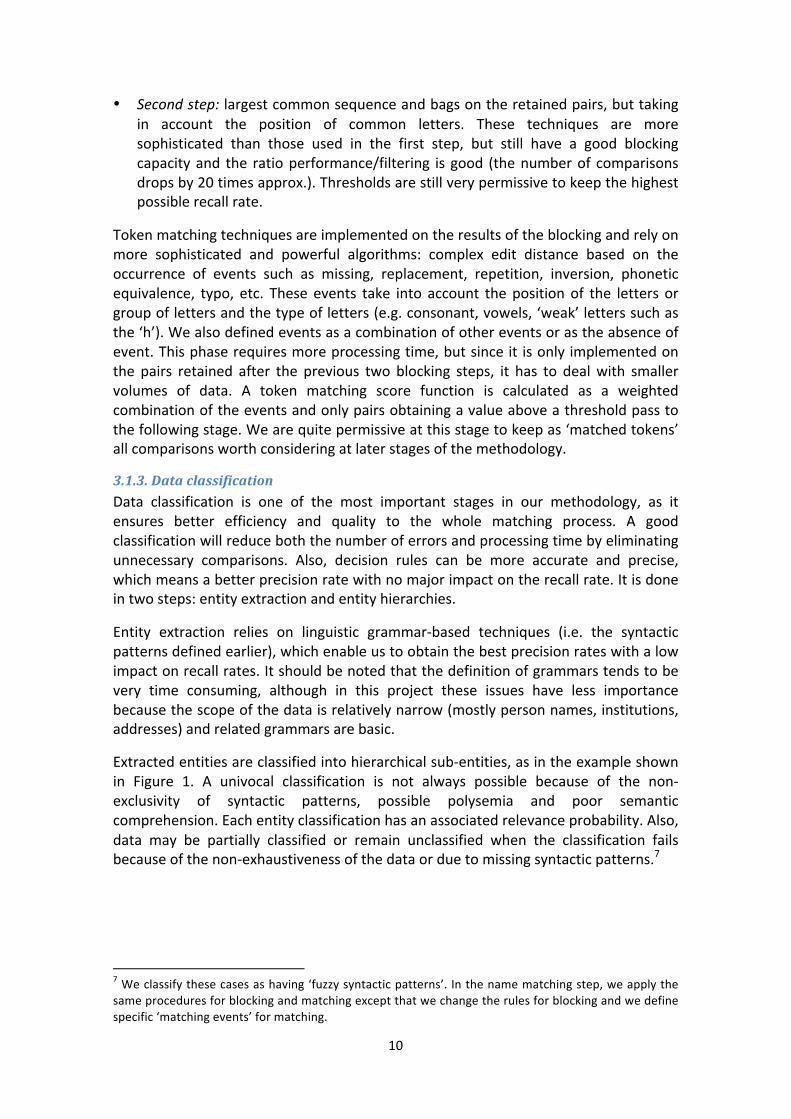
Extracted entities are classified into hierarchical sub-‐entities, as in the example shown in Figure 1. A univocal classification is not always possible because of the non-‐exclusivity of syntactic patterns, possible polysemia and poor semantic comprehension. Each entity classification has an associated relevance probability. Also, data may be partially classified or remain unclassified when the classification fails because of the non-‐exhaustiveness of the data or due to missing syntactic patterns.7
7 We classify these cases as having ‘fuzzy syntactic patterns’. In the name matching step, we apply the same procedures for blocking and matching except that we change the rules for blocking and we define specific ‘matching events’ for matching.
11
Figure 1. Example of data classification
Person name and Address
Garcia, Jose-‐Luis Mendoza Inst. of political sciences -‐ Cons. Sup. Invest. Cien. Serrano 117 Madrid Spain
Person name
Garcia, Jose-‐Luis Mendoza
Firstname
Jose-‐Luis
Surname
Mendoza Garcia
Firstname 1
Jose
Firstname 2
Luis
Affiliation 1
Inst. of political sciences
Affiliation 2
Cons. Sup. Invest. Cien.
Address
Serrano 117 Madrid Spain
Surname 1
Mendoza
Surname 2
Garcia
Street nr
117
Street name
Serrano
City
Madrid
Country
Spain
3.2. Step 2. Name matching for persons and institutions To reduce the number of possible name comparisons, we implement a name blocking phase first, and then apply the name matching techniques on the remaining pairs. 8
Our name blocking rules is quite simple: pairs for which no surname is matched are blocked and are thus not considered in the name matching phase. This is the only criterion when the matched names are rare. When the names are common, we impose two alternative additional rules: either another surname or a first name need to be matched (full token or initials) in order to survive the blocking phase.
Once the name blocking is done, we match names for person and institutions using a complex token edit distance measure that is based on the identification of ‘matching events’ that take account of the position of the tokens or group of tokens, the type of tokens (first name, last name, institution, place, unknown, etc…) and the token matching scores calculated previously. There can be many possible matching events in a given comparison, such as missing tokens, replacements, inversion of tokens, initials instead of full names, etc. We also define events as a combination of other events or as the absence of a given event. For example, if all surnames are matched we flag it as a ‘no missing surname’ event. The following three name matching variables are calculated in the name matching phase:
• RarityLevel: indicates the degree of rarity of a matched name. We calculate it based on the frequency of the matched tokens only (the frequency of the missing tokens is not used). If the frequency of the two components is different we use the
8 At this stage, we also introduce a non-‐name blocking criterion: we discard pairs that are very unlikely to correspond to author-‐inventors because the author´s publication is in a non-‐technical area. We consider that non-‐technical scientific fields correspond to the following five Scopus Science Classification areas (ASJC): i) Arts and Humanities; ii) Business, Management and Accounting; iii) Economics, Econometrics and Finance; iv) Psychology and v) Social Sciences.
12
frequency of the most common one (to avoid the effect of misspellings) and we eliminate from the calculation matching based only on initials. We use the frequency given by the census data from INE and also the frequency calculated from the set of data.
• MatchClass: indicates the level of concordance between the syntactic patterns of the matched names (excellent, good or bad), based on the specificities of Spanish names for person names or simplified grammars for institution names. For example, the match between ‘José Carlos Lopez Garcia’ and ‘José Carlos Garcia Lopez’ would have a bad MatchClass because of the inversion of surnames, but the match between ‘José Carlos Lopez Garcia’ and ‘J. Lopez’ would have a good MatchClass because they are both acceptable ways to write the same name.
• MatchLevel: indicates the level of similarity of the matched names and is calculated based on expert-‐adjusted weights for each event, some events giving a ‘bonus’ (e.g. no missing surname) and other a ‘malus’ (e.g. inversion of surnames).
It should be noted that MatchClass and MatchLevel measure different aspects of a name match. MatchClass can be good and MatchLevel bad or vice versa. If we go back to our previous example, the match between ‘José Carlos Lopez Garcia’ and ‘José Carlos Garcia Lopez’ would have a bad MatchClass but a good MatchLevel (4 tokens in common, 2 for first names and 2 for surnames, no initials, no missing and only one inversion). Likewise, the match between ‘José Carlos Lopez Garcia’ and ‘J. Lopez’ would have a good MatchClass but a bad MatchLevel (1 missing first name, 1 missing surname, 1 initial).
3.3. Step 3: Person disambiguation and clustering Once the token and name matching steps have been completed, we proceed to the person disambiguation step, where non-‐name personal information comes to play.
3.3.1. Person disambiguation Three types of variables are considered: name matching variables, direct disambiguation variables and indirect disambiguation variables.
The name matching variables are those resulting from the previous name matching stage, which we recall include the following:
• Raritylevel, informing of the rarity of the matched names. • MatchClass, informing of the concordance of syntactic patterns of the matched
names. • MatchLevel, informing of the similarity of matched names.
The direct disambiguation variables refer to the publication-‐author and the patent-‐inventor being compared and relate to the following:
• Institution of affiliation: we include a variable to indicate similarity of the institutions of affiliation of the author and the inventor (CompSameAff), which combines the values of i) CompAff, a continuous variable based on frequency of co-‐occurrence of two institutions in SCOPUS publications (e.g. institutional co-‐
13
authorship, multiple affiliations);9 and ii) SameAff, a binary variable equal to 1 when the name of the institution of affiliation of the author matches with any institutional information appearing in the inventor´s name or address. Information about institutions to build these two variables comes from matching institution names from PATSTAT with normalized institution of affiliation of authors from the Scimago Group normalization of institutions for SCOPUS publications (Scimago 2011).
• Scientific/technological area: we include two binary variables to indicate proximity between the technological field of the patent and the scientific area of the publication, assessed at two levels based on the correspondence tables between IPC codes for patents and ASJC fields for SCOPUS publications from Schmoch et al (2012): narrow correspondence (SameAreaF) and broad correspondence (SameAreaG). When SameAreaF equals 1, SameAreaG is also equal to 1, by definition.
• Patent applicant: we include a binary variable (SameApplt) to indicate when the name of the institution of affiliation of the author matches the institution that appears in the patent applicant field of PATSTAT. Again, information about institutions comes from matching institution names from PATSTAT with normalized institution of affiliation of authors from the Scimago Group normalization of institutions for SCOPUS publications (Scimago 2011).
• Geographical location: we include a binary variable (SameNuts3) to indicate when the author and the inventor are located in the same Spanish region (NUTS3 level of the Eurostat classification). Information about the location of inventors comes from the OECD REGPAT database (Maraut et al 2008) and about the location of authors from the Scimago Group regionalisation of SCOPUS publications (Scimago 2011).
Lastly, one indirect disambiguation variable is introduced after the manual validation phase (before the first iteration their value is set equal to zero), calculated based on validated matches of co-‐inventors and co-‐authors:
• Coinventor is coauthor: we include a binary variable (CoinvCoauth) equal to 1 when at least one co-‐inventor has been validated as a positive match of a coauthor of the focal author-‐inventors in the patent-‐publication pair being compared. This variable is left empty before the first manual validation phase takes place (Step 4 of the methodology), and is filled in progressively as new matches are validated recursively.
The introduction of an indirect disambiguation variable greatly enhances subsequent iterations of the matching, but has to be used with caution in order to avoid propagating false positive matches, that is why we only introduce it after a first manual validation of matches. Imagine we have two matching candidate couples as (Author A1 and Inventor I1) and (Author A2 and Inventor I2). A1 and A2 are coauthors and I1 and I2 are co-‐inventors. If (A1, I1) and (A2, I2) are false positives and if we include them in 9 For example, an author affiliated to a chemical institute can coauthor an article with another author from an institute specialized in archaeology because they work together in the analysis of samples, although at first sight chemistry and archaeology would seem to be very distant. When this type of collaboration is not frequent, it takes a low value, but still different from zero.
14
indirect disambiguation variable calculation, these two errors will mutually reinforce themselves. Now, if (A1, I1) is considered as a real true positive and (A2, I2) is a matching couple candidate, (A2, I2) will benefit from the indirect disambiguation variable.
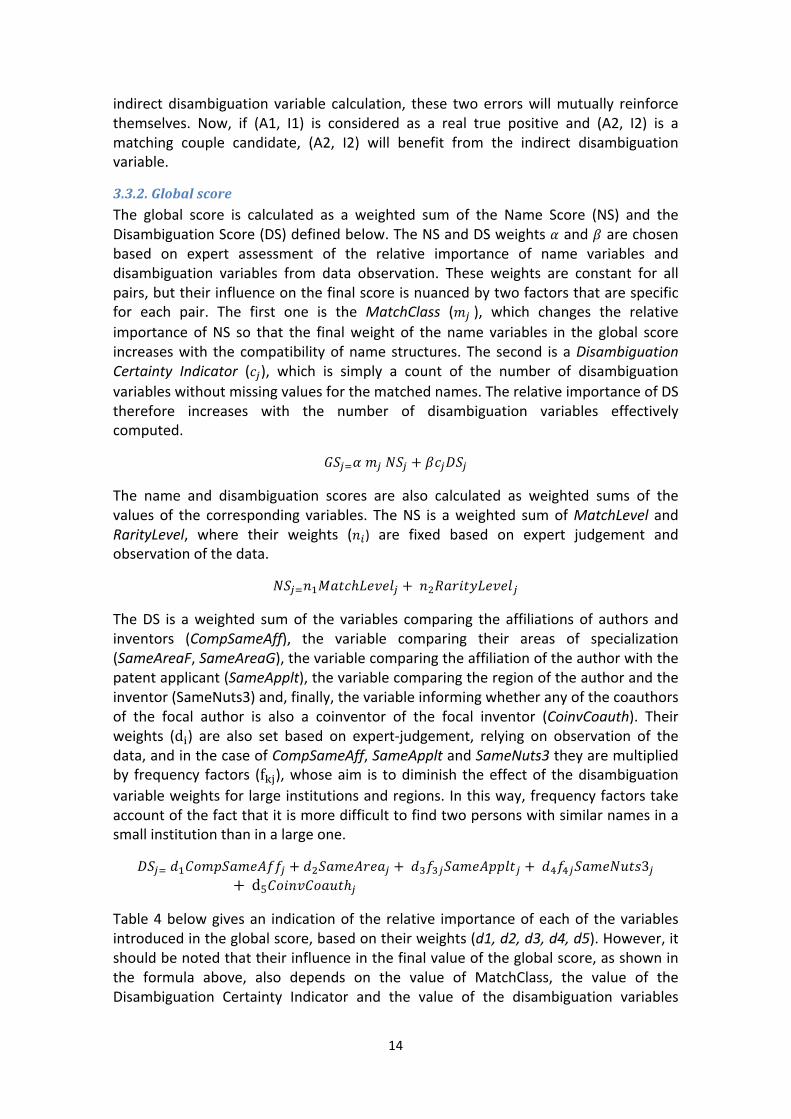
3.3.2. Global score The global score is calculated as a weighted sum of the Name Score (NS) and the Disambiguation Score (DS) defined below. The NS and DS weights 𝛼 and 𝛽 are chosen based on expert assessment of the relative importance of name variables and disambiguation variables from data observation. These weights are constant for all pairs, but their influence on the final score is nuanced by two factors that are specific for each pair. The first one is the MatchClass (𝑚! ), which changes the relative importance of NS so that the final weight of the name variables in the global score increases with the compatibility of name structures. The second is a Disambiguation Certainty Indicator (𝑐!), which is simply a count of the number of disambiguation variables without missing values for the matched names. The relative importance of DS therefore increases with the number of disambiguation variables effectively computed.
𝐺𝑆!!𝛼 𝑚! 𝑁𝑆! + 𝛽𝑐!𝐷𝑆!
The name and disambiguation scores are also calculated as weighted sums of the values of the corresponding variables. The NS is a weighted sum of MatchLevel and RarityLevel, where their weights (𝑛!) are fixed based on expert judgement and observation of the data.
𝑁𝑆!!𝑛!𝑀𝑎𝑡𝑐ℎ𝐿𝑒𝑣𝑒𝑙! + 𝑛!𝑅𝑎𝑟𝑖𝑡𝑦𝐿𝑒𝑣𝑒𝑙!
The DS is a weighted sum of the variables comparing the affiliations of authors and inventors (CompSameAff), the variable comparing their areas of specialization (SameAreaF, SameAreaG), the variable comparing the affiliation of the author with the patent applicant (SameApplt), the variable comparing the region of the author and the inventor (SameNuts3) and, finally, the variable informing whether any of the coauthors of the focal author is also a coinventor of the focal inventor (CoinvCoauth). Their weights (d!) are also set based on expert-‐judgement, relying on observation of the data, and in the case of CompSameAff, SameApplt and SameNuts3 they are multiplied by frequency factors (f!"), whose aim is to diminish the effect of the disambiguation variable weights for large institutions and regions. In this way, frequency factors take account of the fact that it is more difficult to find two persons with similar names in a small institution than in a large one.
𝐷𝑆!! 𝑑!𝐶𝑜𝑚𝑝𝑆𝑎𝑚𝑒𝐴𝑓𝑓! + 𝑑!𝑆𝑎𝑚𝑒𝐴𝑟𝑒𝑎! + 𝑑!𝑓!!𝑆𝑎𝑚𝑒𝐴𝑝𝑝𝑙𝑡! + 𝑑!𝑓!!𝑆𝑎𝑚𝑒𝑁𝑢𝑡𝑠3!+ d5𝐶𝑜𝑖𝑛𝑣𝐶𝑜𝑎𝑢𝑡ℎ!
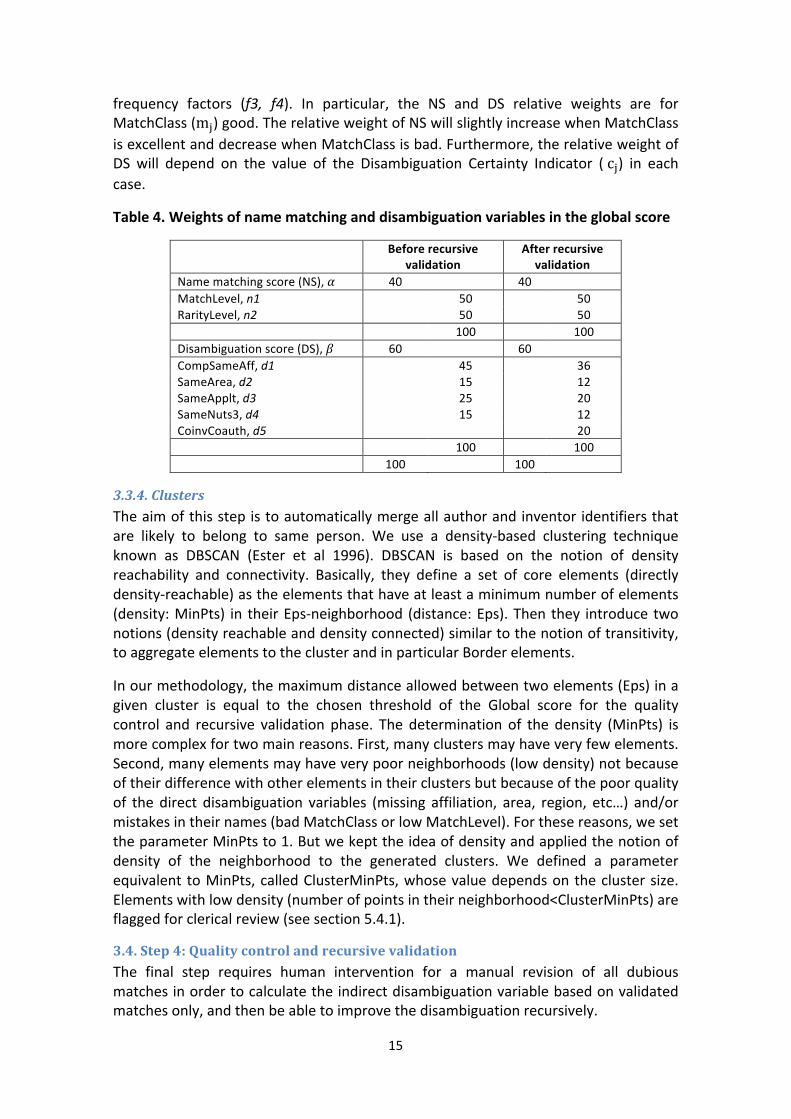
Table 4 below gives an indication of the relative importance of each of the variables introduced in the global score, based on their weights (d1, d2, d3, d4, d5). However, it should be noted that their influence in the final value of the global score, as shown in the formula above, also depends on the value of MatchClass, the value of the Disambiguation Certainty Indicator and the value of the disambiguation variables
15
frequency factors (f3, f4). In particular, the NS and DS relative weights are for MatchClass (m!) good. The relative weight of NS will slightly increase when MatchClass is excellent and decrease when MatchClass is bad. Furthermore, the relative weight of DS will depend on the value of the Disambiguation Certainty Indicator ( c!) in each case.
Table 4. Weights of name matching and disambiguation variables in the global score
Before recursive validation
After recursive validation
Name matching score (NS), 𝛼 40 40 MatchLevel, n1 50 50 RarityLevel, n2 50 50 100 100 Disambiguation score (DS), 𝛽 60 60 CompSameAff, d1 45 36 SameArea, d2 15 12 SameApplt, d3 25 20 SameNuts3, d4 15 12 CoinvCoauth, d5 20 100 100 100 100
3.3.4. Clusters The aim of this step is to automatically merge all author and inventor identifiers that are likely to belong to same person. We use a density-‐based clustering technique known as DBSCAN (Ester et al 1996). DBSCAN is based on the notion of density reachability and connectivity. Basically, they define a set of core elements (directly density-‐reachable) as the elements that have at least a minimum number of elements (density: MinPts) in their Eps-‐neighborhood (distance: Eps). Then they introduce two notions (density reachable and density connected) similar to the notion of transitivity, to aggregate elements to the cluster and in particular Border elements.
In our methodology, the maximum distance allowed between two elements (Eps) in a given cluster is equal to the chosen threshold of the Global score for the quality control and recursive validation phase. The determination of the density (MinPts) is more complex for two main reasons. First, many clusters may have very few elements. Second, many elements may have very poor neighborhoods (low density) not because of their difference with other elements in their clusters but because of the poor quality of the direct disambiguation variables (missing affiliation, area, region, etc…) and/or mistakes in their names (bad MatchClass or low MatchLevel). For these reasons, we set the parameter MinPts to 1. But we kept the idea of density and applied the notion of density of the neighborhood to the generated clusters. We defined a parameter equivalent to MinPts, called ClusterMinPts, whose value depends on the cluster size. Elements with low density (number of points in their neighborhood<ClusterMinPts) are flagged for clerical review (see section 5.4.1).
3.4. Step 4: Quality control and recursive validation The final step requires human intervention for a manual revision of all dubious matches in order to calculate the indirect disambiguation variable based on validated matches only, and then be able to improve the disambiguation recursively.
16
3.4.1. Manual checking of positive matches During the previous stages, we had favored recall over precision. At this stage, we work only on the positive matches retained from the previous steps in order to optimize the precision rate. This preference comes from the fact that it is easier to detect false positives than false negatives, so our aim is to keep a large set of potential matches for the last phase, from which false positives are later eliminated. To detect potential false positive matches, we focus on several indicators:
• clusters for which transitivity problems have been identified (low density) • low-‐confidence name matching variables (i.e. bad MatchClass) • low-‐confidence disambiguation variables (e.g. different affiliations, very
different scientific/technological areas) • low value of the Disambiguation Certainty Indicator • inconsistencies from PATSTAT-‐PATSTAT and/or SCOPUS-‐SCOPUS name
matching
The sensitivity threshold for each indicator depends on the desired degree of rigor and comprehensiveness in the control and time/budget available for this task. Given the high cost of manual validation, an arbitrage has to be made between precision, recall and available resources in order to determine the number of pairs that can be reviewed by experts in this last validation phase. This is fundamentally a pragmatic decision that needs to take into account the data volume involved in each matching exercise. Fixing high sensitivity thresholds imply dedicating a large amount of time to quality control.
3.4.2. Recursive validation of the disambiguation Once all the clusters built in the previous stage have been checked and the false clusters detected in the manual validation phase have been excluded, we go back to the person disambiguation stage. At this stage, we define two types of validated matches: those that have been already manually checked and those that did not need to be manually validated because are assumed to be positive matches (e.g. exact name match with same affiliation, same field and same region).10 We then recalculate the indirect disambiguation variable, drawing information from the validated matches, recalculate the global score and revise clusters taking into account the new value of the variables. We may refine the value of the DBSCAN distance at this point. New clusters may appear thanks to the indirect disambiguation variable and some clusters may disappear due to false positive elimination. We repeat the recursive process until the clusters do not change any more and all potential false positive matches (according to our rules for controls) have been reviewed.
4. Tests against a benchmark and final results It is quite difficult to find a benchmark that is sufficiently representative of the main dataset to which a matching and disambiguation methodology aims to be applied. In our case, given our focus on Spanish names of authors and inventors, we could not use
10 We consider, with a high confidence level, a non-‐dubious match as a validated matched because of our very conservative criteria to detect potential false positives. In case of less conservative criteria, a validated match could be defined with more restrictions.
17
benchmarks based on other countries11 or other kinds of data, so we decided to build our own by manually labeling pairs in a reduced dataset as positive or negative matches, using as much information as possible to discern the most dubious cases (personal websites, institutional reports, etc.). We first selected a subsample of our dataset by limiting the filing year of EPO patent applications with Spanish applicants to 2007-‐2008 (2,727 patents associated to 5,867 patent-‐inventor identifiers) and the publication year of SCOPUS publications to 2008 (55,980 publications associated to 196,441 publication-‐author identifiers).
After implementing the token matching and name blocking procedures of our methodology to this dataset, we retained 14,869 potentially matching pairs of publication-‐author and patent-‐inventor as the universe for our benchmark dataset and revised all of them manually. Using additional information from personal and institutional webpages when needed and often accessing original patent and publication documents to clarify the most dubious cases, we found 7,304 valid pairs, corresponding to 1,088 individual author-‐inventors (i.e. different clusters). Therefore, our benchmark has 49% valid pairs and 51% invalid ones. Table A1 in the Annex sets out some descriptive statistics of the values taken by the name and disambiguation variables for the pairs included in the benchmark, as well as the results of a t-‐test for the equality of means between valid and invalid pairs. Valid pairs always have significantly higher values of name and disambiguation variables than invalid pairs.
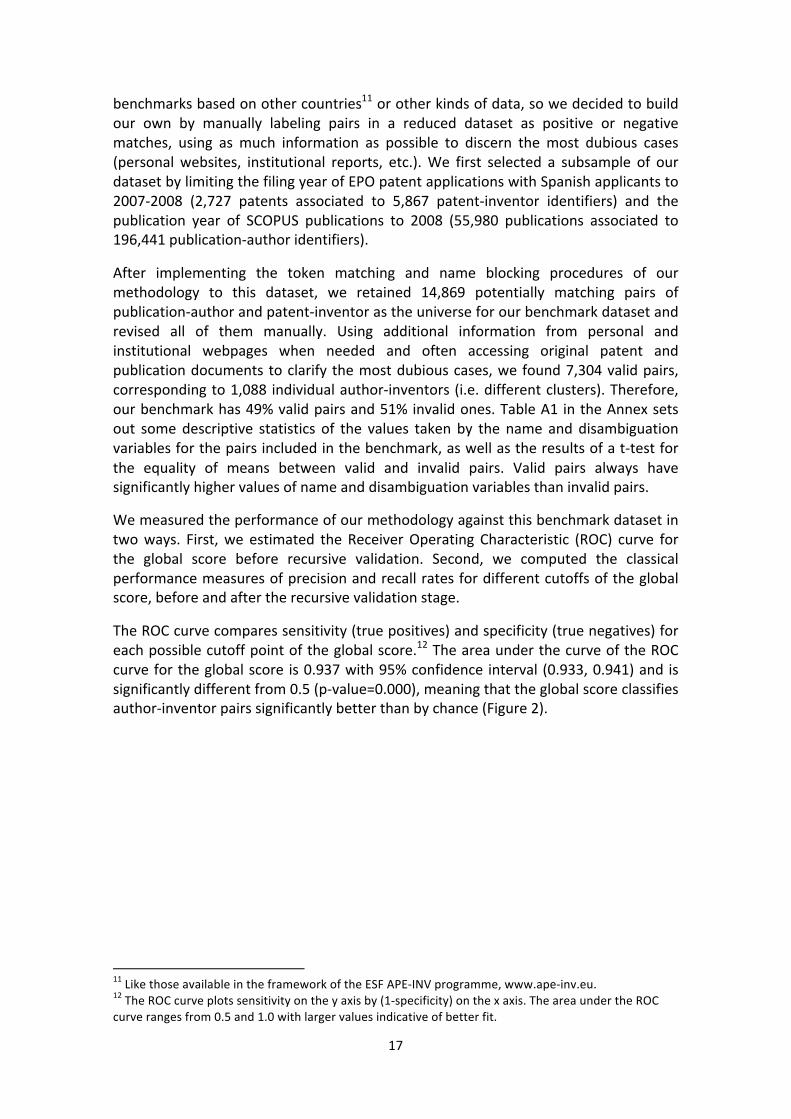
We measured the performance of our methodology against this benchmark dataset in two ways. First, we estimated the Receiver Operating Characteristic (ROC) curve for the global score before recursive validation. Second, we computed the classical performance measures of precision and recall rates for different cutoffs of the global score, before and after the recursive validation stage.
The ROC curve compares sensitivity (true positives) and specificity (true negatives) for each possible cutoff point of the global score.12 The area under the curve of the ROC curve for the global score is 0.937 with 95% confidence interval (0.933, 0.941) and is significantly different from 0.5 (p-‐value=0.000), meaning that the global score classifies author-‐inventor pairs significantly better than by chance (Figure 2).
11 Like those available in the framework of the ESF APE-‐INV programme, www.ape-‐inv.eu. 12 The ROC curve plots sensitivity on the y axis by (1-‐specificity) on the x axis. The area under the ROC curve ranges from 0.5 and 1.0 with larger values indicative of better fit.

18
Figure 2. ROC curve of the global score in the benchmark dataset
Precision and recall rates are classical performance measures in machine learning. Another performance measure often used in machine learning is the harmonic average of precision and recall rates, known as the F measure.13 They are defined as follows:
Precision =True positives
True positives+ False positives
Recall =True positives
True positives+ False negatives
F =2(Precision x Recall)(Precision+ Recall)
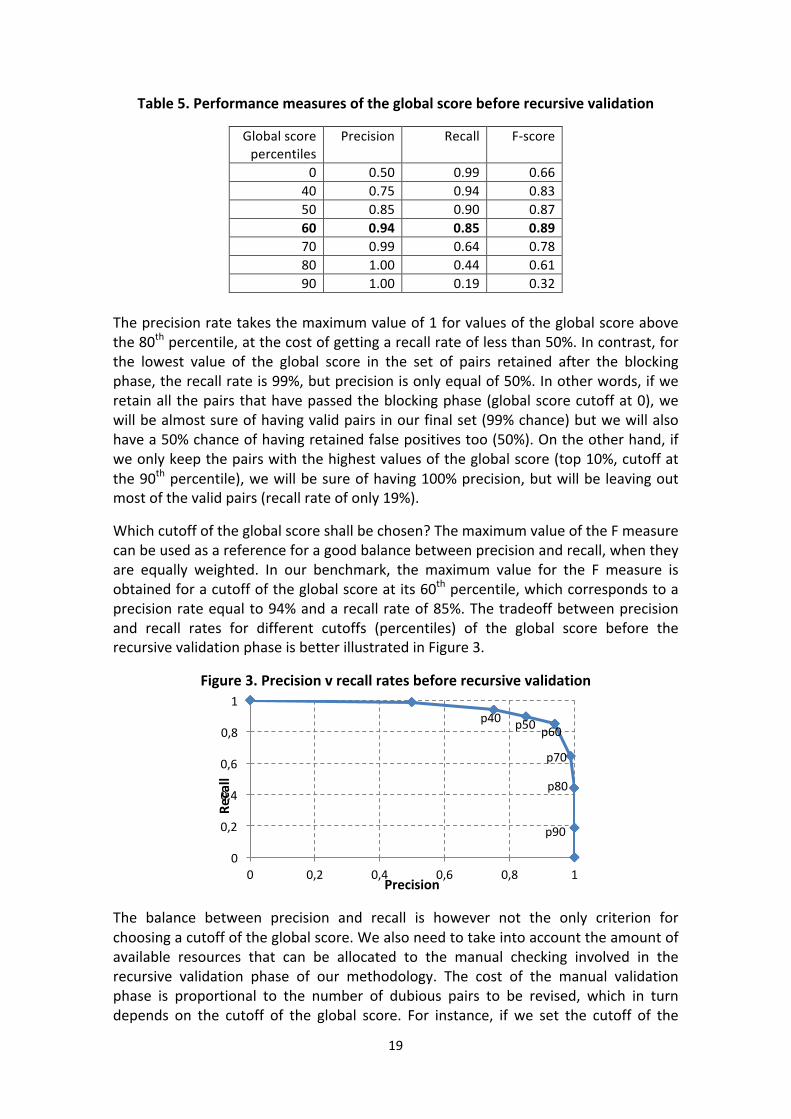
Where ‘true positives’ are valid author-‐inventor pairs with a value of the global score above the chosen cutoff, ‘false positives’ are invalid author-‐inventor pairs above the chosen cutoff of the global score and ‘false negatives’ are valid author-‐inventor pairs with a value of the global score below the chosen cutoff. Table 5 sets out the values of recall and precision rates as well as of the F measure for different cutoffs of the global score before the recursive validation phase, i.e. the global score is computed based solely on the automated results of our methodology, before the manual checking involved in the last part of it, and thus excluding the indirect disambiguation variable.
13 Dornbusch et al (2012) use a more general definition of the F measure with different weights given to precision and recall. The F measure presented here is the traditional one, where both rates are equally weighted.
19
Table 5. Performance measures of the global score before recursive validation
Global score percentiles
Precision Recall F-‐score
0 0.50 0.99 0.66 40 0.75 0.94 0.83 50 0.85 0.90 0.87 60 0.94 0.85 0.89 70 0.99 0.64 0.78 80 1.00 0.44 0.61 90 1.00 0.19 0.32
The precision rate takes the maximum value of 1 for values of the global score above the 80th percentile, at the cost of getting a recall rate of less than 50%. In contrast, for the lowest value of the global score in the set of pairs retained after the blocking phase, the recall rate is 99%, but precision is only equal of 50%. In other words, if we retain all the pairs that have passed the blocking phase (global score cutoff at 0), we will be almost sure of having valid pairs in our final set (99% chance) but we will also have a 50% chance of having retained false positives too (50%). On the other hand, if we only keep the pairs with the highest values of the global score (top 10%, cutoff at the 90th percentile), we will be sure of having 100% precision, but will be leaving out most of the valid pairs (recall rate of only 19%).
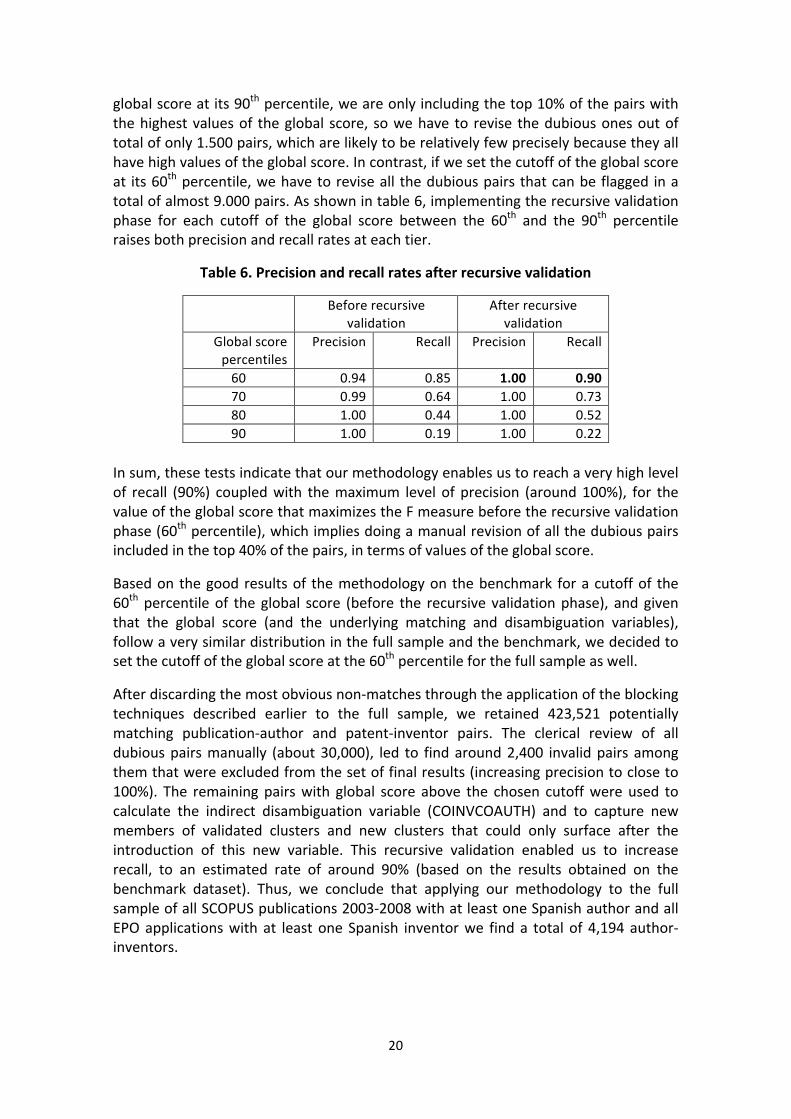
Which cutoff of the global score shall be chosen? The maximum value of the F measure can be used as a reference for a good balance between precision and recall, when they are equally weighted. In our benchmark, the maximum value for the F measure is obtained for a cutoff of the global score at its 60th percentile, which corresponds to a precision rate equal to 94% and a recall rate of 85%. The tradeoff between precision and recall rates for different cutoffs (percentiles) of the global score before the recursive validation phase is better illustrated in Figure 3.
Figure 3. Precision v recall rates before recursive validation
The balance between precision and recall is however not the only criterion for choosing a cutoff of the global score. We also need to take into account the amount of available resources that can be allocated to the manual checking involved in the recursive validation phase of our methodology. The cost of the manual validation phase is proportional to the number of dubious pairs to be revised, which in turn depends on the cutoff of the global score. For instance, if we set the cutoff of the
p40 p50 p60
p70
p80
p90
0
0,2
0,4
0,6
0,8
1
0 0,2 0,4 0,6 0,8 1
Recall
Precision
20
global score at its 90th percentile, we are only including the top 10% of the pairs with the highest values of the global score, so we have to revise the dubious ones out of total of only 1.500 pairs, which are likely to be relatively few precisely because they all have high values of the global score. In contrast, if we set the cutoff of the global score at its 60th percentile, we have to revise all the dubious pairs that can be flagged in a total of almost 9.000 pairs. As shown in table 6, implementing the recursive validation phase for each cutoff of the global score between the 60th and the 90th percentile raises both precision and recall rates at each tier.
Table 6. Precision and recall rates after recursive validation
Before recursive validation
After recursive validation
Global score percentiles
Precision Recall Precision Recall
60 0.94 0.85 1.00 0.90 70 0.99 0.64 1.00 0.73 80 1.00 0.44 1.00 0.52 90 1.00 0.19 1.00 0.22
In sum, these tests indicate that our methodology enables us to reach a very high level of recall (90%) coupled with the maximum level of precision (around 100%), for the value of the global score that maximizes the F measure before the recursive validation phase (60th percentile), which implies doing a manual revision of all the dubious pairs included in the top 40% of the pairs, in terms of values of the global score.
Based on the good results of the methodology on the benchmark for a cutoff of the 60th percentile of the global score (before the recursive validation phase), and given that the global score (and the underlying matching and disambiguation variables), follow a very similar distribution in the full sample and the benchmark, we decided to set the cutoff of the global score at the 60th percentile for the full sample as well.
After discarding the most obvious non-‐matches through the application of the blocking techniques described earlier to the full sample, we retained 423,521 potentially matching publication-‐author and patent-‐inventor pairs. The clerical review of all dubious pairs manually (about 30,000), led to find around 2,400 invalid pairs among them that were excluded from the set of final results (increasing precision to close to 100%). The remaining pairs with global score above the chosen cutoff were used to calculate the indirect disambiguation variable (COINVCOAUTH) and to capture new members of validated clusters and new clusters that could only surface after the introduction of this new variable. This recursive validation enabled us to increase recall, to an estimated rate of around 90% (based on the results obtained on the benchmark dataset). Thus, we conclude that applying our methodology to the full sample of all SCOPUS publications 2003-‐2008 with at least one Spanish author and all EPO applications with at least one Spanish inventor we find a total of 4,194 author-‐inventors.
21
5. A first insight into patents and publications of Spanish author-‐inventors
The contribution to overall Spanish technological and scientific production of the author-‐inventors identified as just described is quite significant: 27% of the 16,731 EPO patent applications invented in Spain and filed in 1978-‐2009 have a Spanish author of any kind of 2003-‐2008 SCOPUS publication among its Spanish inventors; and 15% of the 167,818 SCOPUS scientific articles published by Spanish authors in 2003-‐2008 in SCOPUS-‐indexed journals of technologically-‐relevant fields have a Spanish inventor of a 1978-‐2009 EPO patent filing in the authorship.14
To assess what part of such contribution corresponds to author-‐inventors from Spanish public research institutions, we rely on the sector classification of affiliations done by the Scimago group for SCOPUS publications (Scimago 2011; FECYT 2011).15 Public research sector institutions comprise Spanish public universities and public research centers. Other institutions, not part of the Spanish public research sector, include businesses; public administration; private universities and other higher education centers different from public universities; hospitals and other institutions from the health sector whose main activity is not research; as well as institutions not elsewhere classified.
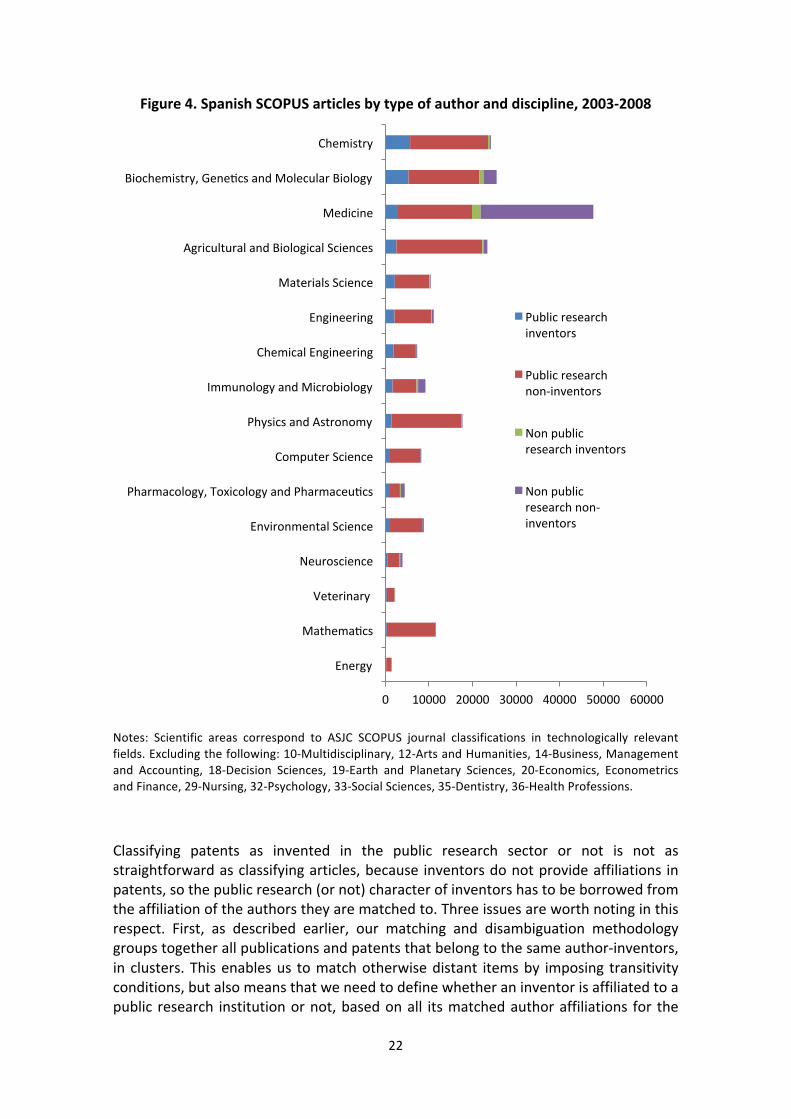
Considering that a publication is not originated in the public research sector when it does not have any author affiliated to a public university or public research center, we find that more than 79% of Spanish SCOPUS 2003-‐2008 scientific articles in technologically-‐relevant fields of 2003-‐2008 have authors from the public research sector and that 15% of them have author-‐inventors from the public research sector. There are important differences across fields as shown in Figure 4. Chemistry and biotechnology are the areas where the highest shares of articles written by public research sector author-‐inventors are found, with more than 20%. The number of articles written by public research author-‐inventors is also high in absolute terms in medicine, but they only represent around 5% of all articles due to the important presence of articles written by researchers from hospitals and other health institutions.16 The importance of chemical and biological sciences is consistent with evidence on university-‐invented patents from other European countries (Lissoni et al 2008).
14 Scientific areas correspond to ASJC SCOPUS journal classifications. We exclude scientific articles from journals assigned to following first ASJC areas (first two digits): 10-‐Multidisciplinary, 12-‐Arts and Humanities, 14-‐Business, Management and Accounting, 18-‐Decision Sciences, 19-‐Earth and Planetary Sciences, 20-‐Economics, Econometrics and Finance, 29-‐Nursing, 32-‐Psychology, 33-‐Social Sciences, 35-‐Dentistry, 36-‐Health Professions. We consider the following fields as being technologically relevant: 11-‐ Agricultural and Biological Sciences; 13-‐ Biochemistry, Genetics and Molecular Biology; 15-‐ Chemical Engineering; 16-‐Chemistry; 17-‐Computer Science; 21-‐Energy; 22-‐ Engineering; 23 – Environmental Science; 24: Immunology and Microbiology; 25-‐ Material Science; 26-‐Mathematics; 27-‐Medicine; 28-‐ Neuroscience; 30-‐Pharmacology, Toxicology and Pharmaceutics; 31-‐Physics and Astronomy; 34-‐ Veterinary. 15 http://www.scimagoir.com/ 16 Articles written by public research author inventors amount to 93% of all articles written by author-‐inventors in Chemistry, 84% in biotechnology (biochemistry, genetics and molecular biology) and 57% in medicine.
22
Figure 4. Spanish SCOPUS articles by type of author and discipline, 2003-‐2008
Notes: Scientific areas correspond to ASJC SCOPUS journal classifications in technologically relevant fields. Excluding the following: 10-‐Multidisciplinary, 12-‐Arts and Humanities, 14-‐Business, Management and Accounting, 18-‐Decision Sciences, 19-‐Earth and Planetary Sciences, 20-‐Economics, Econometrics and Finance, 29-‐Nursing, 32-‐Psychology, 33-‐Social Sciences, 35-‐Dentistry, 36-‐Health Professions.
Classifying patents as invented in the public research sector or not is not as straightforward as classifying articles, because inventors do not provide affiliations in patents, so the public research (or not) character of inventors has to be borrowed from the affiliation of the authors they are matched to. Three issues are worth noting in this respect. First, as described earlier, our matching and disambiguation methodology groups together all publications and patents that belong to the same author-‐inventors, in clusters. This enables us to match otherwise distant items by imposing transitivity conditions, but also means that we need to define whether an inventor is affiliated to a public research institution or not, based on all its matched author affiliations for the
0 10000 20000 30000 40000 50000 60000
Energy
Mathematcs
Veterinary
Neuroscience
Environmental Science
Pharmacology, Toxicology and Pharmaceutcs
Computer Science
Physics and Astronomy
Immunology and Microbiology
Chemical Engineering
Engineering
Materials Science
Agricultural and Biological Sciences
Medicine
Biochemistry, Genetcs and Molecular Biology
Chemistry
Public research inventors
Public research non-‐inventors
Non public research inventors
Non public research non-‐inventors
23
period 2003-‐2008, which may change from one publication to the other. Second, given that author affiliations do not indicate if the researcher has a permanent or temporary relationship with the institution (short term contract, postdoctoral researcher, visiting, etc.), we prefer to avoid extending too much in the past public research sector affiliations declared in 2003-‐2008 publications. Third, we have data on EPO patent applications published until Summer 2010, so considering that patent filings are published 18 months after the filing date, we should have all EPO patents with filing date up to December 2008 in our data and partial data afterwards.
With this in mind, we limit the analysis to the 10,801 EPO patent applications invented by Spanish inventor-‐authors with filing years 2000-‐2008. This seems reasonable (and not too restrictive) considering that patents are filed before submitting a publication disclosing related research, not to destroy the novelty of the patent, and it may take, in some fields, up to 2 years between submission and publication of a scientific article.17
Hence, following the same logic as for authors, we consider that an inventor is affiliated to a Spanish public research institution if the author he has been matched to has at least one publication (article or any other kind of SCOPUS publication) with an affiliation to a public university or to a public research center in 2003-‐2008. Non-‐public research inventors would be those without any public research author matched. Spanish public research centers include the Spanish National Research Council (CSIC), the largest Spanish public research organization with more than 100 research institutes in different fields, and other public research centers, mission oriented or independent. The term ‘public’ is understood here to comprise centers that receive most of their funding from public sources, regardless of their legal status (OECD 2011). Many independent public research centers have been recently created as private or public foundations, whereas CSIC and most mission oriented centers are traditional public research centers, under the aegis of ministries, where permanent researchers are civil servants.
17 Studies on academic invented patenting have used longer period of times, but they rely on matching lists of permanent university professors to inventors, and base their analysis on the matches confirmed by contacting the professors themselves. See for example evidence from the KEINS database regarding France, Italy and Sweden in Lissoni et al. (2008)
24
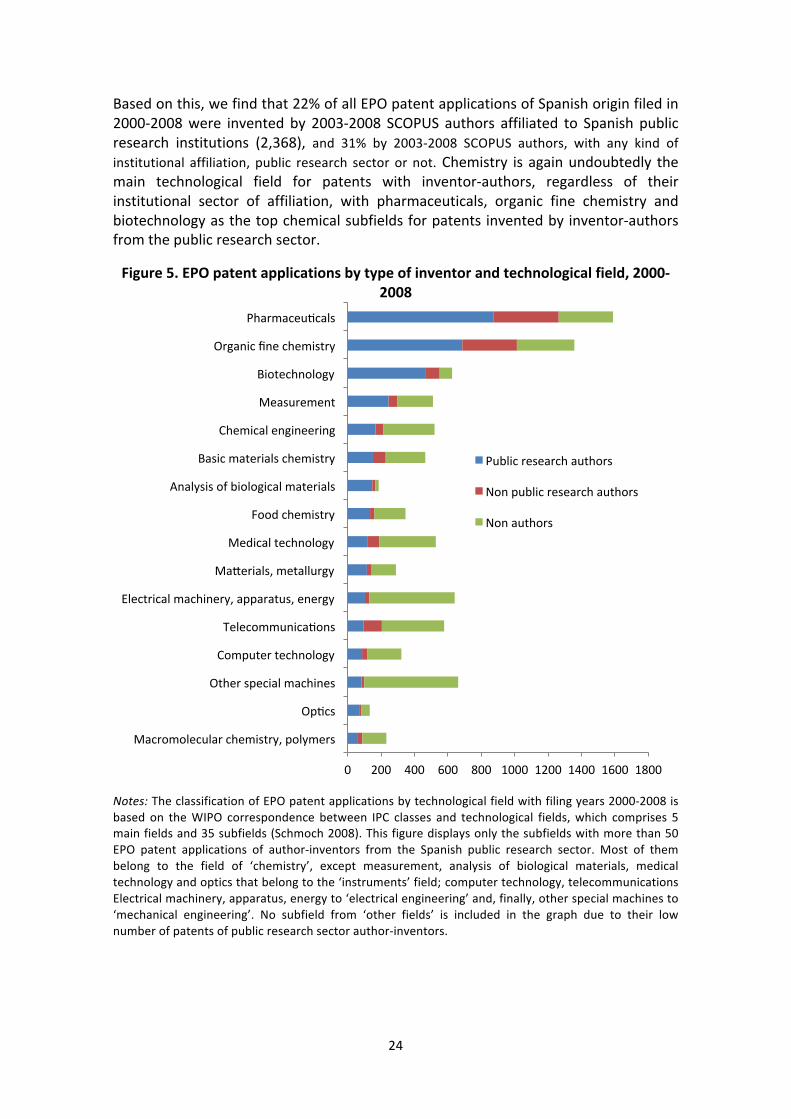
Based on this, we find that 22% of all EPO patent applications of Spanish origin filed in 2000-‐2008 were invented by 2003-‐2008 SCOPUS authors affiliated to Spanish public research institutions (2,368), and 31% by 2003-‐2008 SCOPUS authors, with any kind of institutional affiliation, public research sector or not. Chemistry is again undoubtedly the main technological field for patents with inventor-‐authors, regardless of their institutional sector of affiliation, with pharmaceuticals, organic fine chemistry and biotechnology as the top chemical subfields for patents invented by inventor-‐authors from the public research sector.
Figure 5. EPO patent applications by type of inventor and technological field, 2000-‐2008
Notes: The classification of EPO patent applications by technological field with filing years 2000-‐2008 is based on the WIPO correspondence between IPC classes and technological fields, which comprises 5 main fields and 35 subfields (Schmoch 2008). This figure displays only the subfields with more than 50 EPO patent applications of author-‐inventors from the Spanish public research sector. Most of them belong to the field of ‘chemistry’, except measurement, analysis of biological materials, medical technology and optics that belong to the ‘instruments’ field; computer technology, telecommunications Electrical machinery, apparatus, energy to ‘electrical engineering’ and, finally, other special machines to ‘mechanical engineering’. No subfield from ‘other fields’ is included in the graph due to their low number of patents of public research sector author-‐inventors.
0 200 400 600 800 1000 1200 1400 1600 1800
Macromolecular chemistry, polymers
Optcs
Other special machines
Computer technology
Telecommunicatons
Electrical machinery, apparatus, energy
Maverials, metallurgy
Medical technology
Food chemistry
Analysis of biological materials
Basic materials chemistry
Chemical engineering
Measurement
Biotechnology
Organic fine chemistry
Pharmaceutcals
Public research authors
Non public research authors
Non authors
25
Finally, to close this brief description of the results of the matching of Spanish authors and inventors, we present findings about ownership of patents invented by authors affiliated to Spanish public research institutions. Who owns patents invented by researchers from the public research sector is a matter of policy and debate in many countries and classifying patents by the institutional affiliation of inventors, rather than applicants, has unveiled a much higher contribution of public sector research to technological innovation protected by patents than what official statistics suggest (classified by institutional sectors of applicants). Previous research in Europe has shown that more than 60% of university-‐invented patents are owned by firms (Lissoni et al 2008). Considering patents that are non-‐university owned but university-‐invented may thus radically change the official view about the contribution of European public research institutions to patenting and about science-‐industry linkages. 18
The analysis of the institutional ownership of all 2000-‐2008 EPO applications of Spanish origin shows that 51% have Spanish business applicants, 28% foreign companies, 15% Spanish individuals and 7% Spanish public research institutions.19 Focusing on patents invented by public research authors we find 42% held by Spanish companies, 27% by foreign companies, 3% by Spanish individuals and 29% by Spanish public research institutions.
The rules that govern ownership of inventions generated by public research sector employees in Spain are the same as the rules governing ownership of inventions generated by employees in the business sector. They were set in the 1986 Spanish Patent Law: the invention belongs to the employer, unless it is otherwise stated.20 In contrast to other European countries, hence, the Spanish law does not include a professor’s privilege to retain ownership of inventions generated in the course of research.21 In practice, however, some public research institutions may be capable or willing to exert a tighter control on the ownership of their employees inventions than others, leading to the high share of non-‐public ownership of public research sector invented patents observed in the graph, consistent with findings from other countries.
18 We rely on the keyword-‐based method of KUL/Eurostat (van Looy et al 2006) for the institutional sector breakdown of patent applicants and refine the classification manually to include further categories. 19 It is worth noting that the annual share of EPO applications of Spanish origin held by Spanish PROs has doubled between 1990 and 2008, from 4% to 8%, whereas the share held by Spanish firms has only grown four percentage points, from 50% to 54%. The share of EPO patent applications invented in Spain that are filed by individuals has decreased significantly, from 29% in 1990 to 13% in 2008. 20 Articles 15-‐20 of the 1986 Spanish Patent Law states that inventions belong to the employers of the inventors, regardless of whether the institution they work for is public or private. Article 20 refers specifically to inventions done by public researchers and university professors and regulates that they belong to their institutions and should be disclosed to them. According to Article 20.5, universities could give the title of the professor´s inventions to the professor who invented them, and keep a non-‐exclusive free license for the institution. Article 20.7 says that when an invention is the result of a contract between the university professor and a public or private institution, such contract will have to specify to which contracting party corresponds the ownership of the invention. 21 In some European countries the researcher is allowed by law to retain title of his invention, an exception to the general law on the ownership of employees’ inventions. The professor´s privilege was abolished in Germany in 2002, but it is still in force in Sweden and was introduced in Italy in 2001 (Lissoni et al 2008; Lissoni et al 2012).

26
Figure 6 sets out the share of patents owned by Spanish public research institutions over all invented by their staff patents across different technology fields, for all of them and also separately for public universities, CSIC and other public research centers. It shows some differences across fields and institutions in the propensity to retain ownership, as well as total number of patents invented by public research sector author-‐inventors, to keep the order of magnitude in perspective. CSIC tends to retain ownership of the inventions of its author-‐inventors more frequently than Spanish universities and other public research centers in all fields, and more so in the field of ‘instruments’, which includes patents related to optics, measurement, analysis of biological materials, control and medical technologies.22 This reflects the longer patenting tradition of CSIC, which opened the first technology transfer office back in 1985, and its predominance as the top patenting Spanish public research institution (Azagra 2011).
Figure 6. Share of public research sector owned patents over all patents invented by public research sector researchers, by technological field and type of institution
Notes: Each column represents the share of EPO patent applications 2000-‐2008 within a specific technology field (Schmoch 2008) owned by a specific type of Spanish public research sector institution (public universities, CSIC, other public research centers) over all patents invented by author-‐inventors affiliated to them. The fourth column represents the total by field for the three kinds of public research institutions altogether.
22 More information about the WIPO concordance between patent IPC classes and fields can be found here: http://www.wipo.int/ipstats/en/statistics/technology_concordance.html
27
These results contrast with available evidence for Spain based on different samples. Results from the Pat-‐Val survey (Giuri et al 2007), based on EPO patent applications with priority 1993-‐1997 indicate that Spain is the only country from the six European countries analysed that has ‘a fraction of university-‐owned patents larger than the fraction of non-‐owned, but university-‐inventor-‐involved patents’ (Verspagen 2006). Azagra-‐Caro (2011) also finds that the majority of patent applications invented by permanent researchers from CSIC chemical institutes are owned by CSIC when considering a pool of EPO, PCT and Spanish patent applications, and finds a lower share of CSIC-‐owned patents when the analysis is limited to EPO patent applications. These differences suggest that results may be quite sensitive to the choice of the sample and, in line with these other authors, we remain cautious and avoid extracting general conclusions from our data about ownership of all patents invented by researchers from the public research sector. Nevertheless, our results seem to indicate that when no field restriction is imposed or relatively larger samples are used, patents invented in the Spanish public research sector are mostly owned by other institutions, as previously found for other countries in the case of universities.
We shall look into the question of ownership more closely in further research, ideally by combining the data presented here with personal information from staff lists from different institutions. In further research we shall also analyse the individual patenting and publishing patterns of public research sector author-‐inventors, as well as their changes of affiliation over time.
6. Conclusions We have described a methodology to identify Spanish author-‐inventors by matching 277,937 SCOPUS publications of Spanish authors to 16,731 EPO applications with Spanish inventors. We have also presented the results of testing it against a benchmark, and showed how we have addressed the tradeoff between recall and precision to reach our final sample, noting how costly it is in terms of quality control efforts (manual validation) to increase recall while maintaining a high precision as the priority. Extrapolating the results of the benchmark to the full dataset, we estimate that our final dataset has a recall rate of 90% in terms of author-‐inventor pairs. One advantage of our methodology is its reliance on country specific knowledge about customs for writing names (initials, abbreviations, order and number of surnames, dictionaries, etc.). Another important feature is its modular approach and the addition of a final recursive validation step, where results from manual checking are integrated in the methodology to improve matching and disambiguation results, increasing precision and recall. As we stress in the paper, it is important to take account of the cost of this last manual validation phase when choosing where to set the threshold of the global score resulting from the fully automated part of the methodology.
Our final dataset includes 4,194 Spanish authors having published in SCOPUS indexed publications between 2003 and 2008 are also listed as inventors in EPO applications filed between 1978 and 2009. They produced 33,801 SCOPUS publications between 2003 and 2008 and were listed as inventors in 4,426 EPO patent filings between 1978 and 2009. In relative terms, they contributed to 15% of all 2003-‐2008 SCOPUS scientific articles in technologically relevant fields and to 27% of all 1978-‐2009 EPO applications invented in Spain. Their contribution to overall Spanish scientific and technological
28
productivity is thus quite significant, especially in chemistry, which is their main field of specialization both for patents and publications. In line with evidence from academic patenting studies from other European countries, we find, for a shorter period, that patents invented by public research sector author-‐inventors are mostly owned by other institutions different from public research institutions, with differences across different types of institutions and technology fields.
To our knowledge, this is the first time that an exhaustive large scale identification of author-‐inventors like the one presented here, with no limitation in terms of fields or types of institutions, has been done for Spain. It focuses on a selected group of all Spanish author-‐inventors, as not all papers written in Spain are published in journals indexed in SCOPUS, not all inventors publish scientific papers at all, and not all inventions originated in Spain seek protection at EPO. We believe it offers many possibilities to investigate the trajectories researchers at the center of science-‐industry linkages that lead to the production of high value patents and publications originated in Spain.
ACKNOWLEDGEMENTS
We thank the Scimago Group for their help with SCOPUS data, in particular Félix de Moya and Elena Corera. We also thank Mº José Moyano for her assistance in the quality control and manual validation phase, Kenedy Alva for his assistance since the beginning and Francesco Lissoni, Luis Sanz-‐Menéndez, Domingo Represa, Ana Caldera, Antonio Fernández-‐Borrella, Laura Barrios, Paolo Freri, Joaquín M. Azagra-‐Caro, Nicolas Maisonneuve and Matthijs den Besten for their help at different stages of a long process. This work has greatly benefited from exchanges with members of the ESF-‐APE-‐INV research networking programme. Preliminary versions of the methodology were presented the name-‐game ESF-‐APE-‐INV workshops held in Paris December 2009 and Brussels September 2011, we thank participants for their comments. We acknowledge funding from the Spanish National Plan Project CSO2009-‐10845.
29
REFERENCES
Dornbusch, F., Schmoch, U., Schulze, N. and N. Bethke (2012), “Identification of university-‐based patents: a new large-‐scale approach”. Fraunhofer ISI Discussion Papers Innovation Systems and Policy Analysis No. 32. Karlsruhe, July 2012.
Elmagarmid, A., Ipeirotis, P. and V. Verykios (2007), “Duplicate record detection: a survey”, IEEE Transactions on Knowledge and Data Engineering, 19, 1, 1-‐16.
Ester, M., Kriegel, H.P., Sander, J. and X. Xu (1996). "A density-‐based algorithm for discovering clusters in large spatial databases with noise". In Evangelos Simoudis, Jiawei Han, Usama M. Fayyad. Proceedings of the Second International Conference on Knowledge Discovery and Data Mining (KDD-‐96). AAAI Press. pp. 226–231.
FECYT (2011), “Principales indicadores bibliométricos de la actividad científica española 2009”. FECYT. Madrid.
Giuri, P., Mariani, M., Brusoni, S., Crespi, G., Francoz, D., Gambardella, A., Garcia-‐Fontes, W., Geuna, A., Gonzales, R., Harhoff, D., Hoisl, K., Le Bas, C., Luzzi, A., Magazzini, L., Nesta, L., Nomaler, O., Palomeras, N., Patel, P., Romanelli, M. and B. Verspagen (2007), Inventors and Invention Processes. Results from the PatVal-‐EU Survey, Research Policy, 36, 8: 1107-‐27.
Lissoni, F., Maurino, A., Pezzoni M. and G. Tarasconi (2010), “APE-‐INV's “Name Game” Algorithm Challenge: A Guideline for Benchmark Data Analysis & Reporting”, http://www.esf-‐ape-‐inv.eu/download/Benchmark_document.pdf
Maraut., S., Dernis, H., Webb, C., Spieza, V. and D. Guellec (2008), “The OECD REGPAT database: a presentation”, OECD STI Working Papers 2008/2, OECD, Paris.
Martinez, C. (2009), Las familias de patentes triádicas de origen español: valor y estrategias, Cuadernos OEPM, 2. Oficina Española de Patentes y Marcas (OEPM), Madrid.
Martínez, C. (2011), “Patent families: when do different definitions really matter?”, Scientometrics, 86: 39-‐63.
Meyer, M. (2006), “Are patenting scientists the better scholars? An exploratory comparison of inventor-‐authors with their non-‐inventing peers in nano-‐science and technology”, Research Policy, 35, 1646-‐1662.
Moya-‐Anegón, F. Chinchilla-‐Rodríguez, Z., Vargas-‐Quesada, B., Corera-‐Álvarez, E., Muñoz-‐Fernández, F. J., González-‐Molina, A. and Herrero-‐Solana, V. (2007), “Coverage analysis of Scopus: A journal metric approach”, Scientometrics, 73, 1: 53–78.
Noyons, E., Buter, R., van Raan, A., Schmoch, U., Heinze, T., Hinze, S. and R. Rangnow (2003a), “Mapping excellence in science and technology across Europe Nanoscience and Nanotechnology”, Report of project EC-‐PPN CT-‐2002-‐0001 to the European Commission, October 2003.
Noyons, E., Buter, R., van Raan, A., Schmoch, U., Heinze, T., Hinze, S. and R. Rangnow (2003b), “Mapping excellence in science and technology across Europe Life Sciences”, Report of project EC-‐PPLS CT-‐2002-‐0001 to the European Commission, October 2003.
Perkmann, M., Tartari, V., McKelvey, M., Autio, E., Broström, A., D’Este, P., Fini, R., Geuna, A., Grimaldi, R., Hughes, A., Krabel, S., Kitson, M., Llerena, P., Lissoni, F., Salter, A. and M. Sobrero (2013), “Academic engagement and commercialisation: A review of the literature on university–industry relations”, Research Policy, 42, 423-‐442.
30
Raffo, J. and S. Lhuillery (2009), “How to play the “Names Game”: Patent retrieval comparing different heuristics” Research Policy, 38, 1617–1627
Schmoch, U. (2007), Patentanmeldungen aus deutischen Hochschulen, Studien zum deutschen Innovationsystem 10-‐2007, Karlsruhe.
Schmoch, U. (2008), Concept of a technology classification for country comparisons. Final report to the World Intellectual Property Office (WIPO), Karlsruhe: Fraunhofer ISI.
Schmoch, U., Dornbusch, F., Mallig, N., Michels, C., Schulze, N. and N. Bethke (2012), Vollstandige Erfassung von Patentanmeldungen aus Universitaten. Bericht an das Bundesministerium fur Bildung und Forschung (BMBF). Revidierte Fassung, Karlsruhe: Fraunhofer ISI.
SCImago (2011) SCImago Institutions Ranking. SIR World Report 2011: Global Ranking, http://www.scimagoir.com/pdf/sir_2011_world_report.pdf (retrieved January 2012)
Smalheiser N.R. and V.I. Torvik (2009), Author name disambiguation. In Annual Review of Information Science and Technology (B. Cronin, Ed.), 43, 287-‐313.
Trajtenberg M., Shiff G. and R. Melamed (2006), “The ‘names game’: Harnessing inventors’ patent data for economic research”, NBER working paper 12479.
Van Looy, B., du Plessis, M. and T. Magerman (2006), “Data Production Methods for Harmonized Patent Indicators: Patentee sector allocation”, Eurostat Working Paper and Studies, Luxembourg.
Von Proff, S., Buenstorf, G. and M. Hummel (2012), “University Patenting in Germany before and after 2002: What Role Did the Professors' Privilege Play?”, Industry and Innovation, 19: 23-‐44.
Winkler, W.E. (2006), “Overview of record linkage and current research directions”, Statistical Research Division U.S.
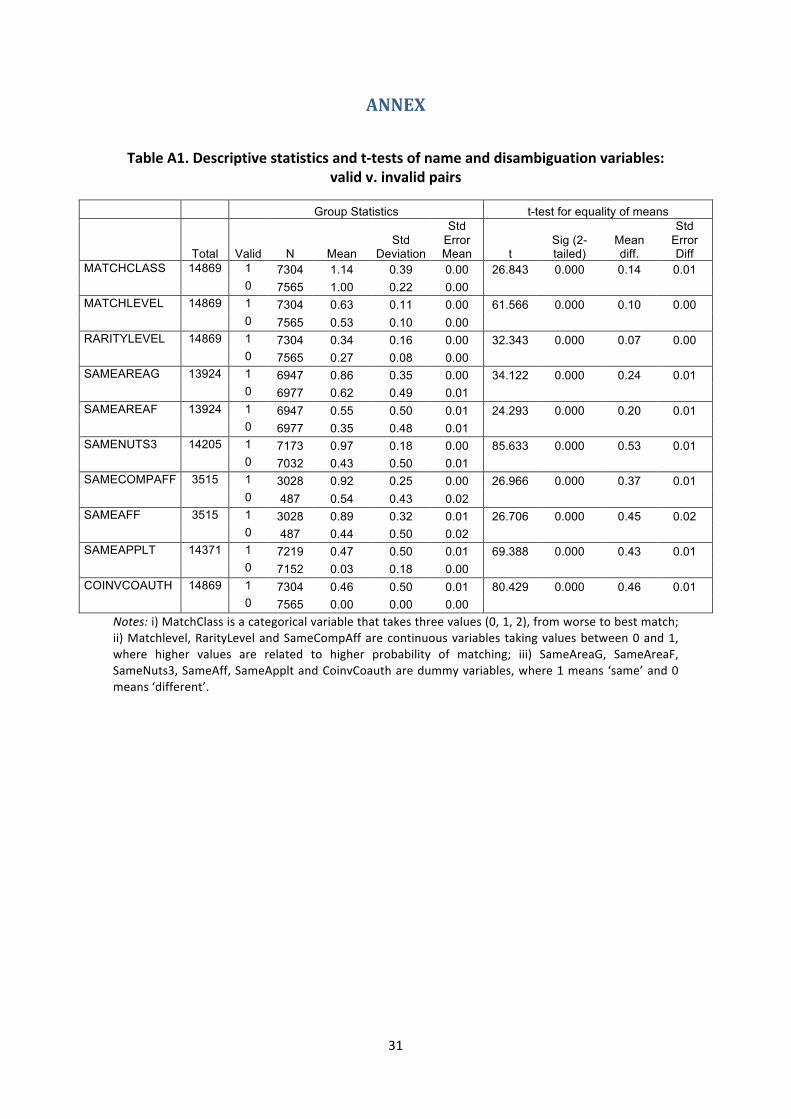
31
ANNEX
Table A1. Descriptive statistics and t-‐tests of name and disambiguation variables: valid v. invalid pairs
Group Statistics t-test for equality of means
Total Valid N Mean Std
Deviation
Std Error Mean t
Sig (2-tailed)
Mean diff.
Std Error Diff
MATCHCLASS 14869 1 7304 1.14 0.39 0.00 26.843 0.000 0.14 0.01 0 7565 1.00 0.22 0.00
MATCHLEVEL 14869 1 7304 0.63 0.11 0.00 61.566 0.000 0.10 0.00 0 7565 0.53 0.10 0.00
RARITYLEVEL 14869 1 7304 0.34 0.16 0.00 32.343 0.000 0.07 0.00 0 7565 0.27 0.08 0.00
SAMEAREAG 13924 1 6947 0.86 0.35 0.00 34.122 0.000 0.24 0.01 0 6977 0.62 0.49 0.01
SAMEAREAF 13924 1 6947 0.55 0.50 0.01 24.293 0.000 0.20 0.01 0 6977 0.35 0.48 0.01
SAMENUTS3 14205 1 7173 0.97 0.18 0.00 85.633 0.000 0.53 0.01 0 7032 0.43 0.50 0.01
SAMECOMPAFF 3515 1 3028 0.92 0.25 0.00 26.966 0.000 0.37 0.01 0 487 0.54 0.43 0.02
SAMEAFF 3515 1 3028 0.89 0.32 0.01 26.706 0.000 0.45 0.02 0 487 0.44 0.50 0.02
SAMEAPPLT 14371 1 7219 0.47 0.50 0.01 69.388 0.000 0.43 0.01 0 7152 0.03 0.18 0.00
COINVCOAUTH 14869 1 7304 0.46 0.50 0.01 80.429 0.000 0.46 0.01 0 7565 0.00 0.00 0.00
Notes: i) MatchClass is a categorical variable that takes three values (0, 1, 2), from worse to best match; ii) Matchlevel, RarityLevel and SameCompAff are continuous variables taking values between 0 and 1, where higher values are related to higher probability of matching; iii) SameAreaG, SameAreaF, SameNuts3, SameAff, SameApplt and CoinvCoauth are dummy variables, where 1 means ‘same’ and 0 means ‘different’.