The Ello social media network: Identifying the Joiners...
43
The Ello social media network: Identifying the Joiners, Aspirers, and Detractors November 2014 Insight Report using our DeepProfile™ capabilities
Transcript of The Ello social media network: Identifying the Joiners...
The Ello social media network:
Identifying the Joiners, Aspirers,
and Detractors
November 2014 Insight Report using our DeepProfile™ capabilities
About this Insight Report
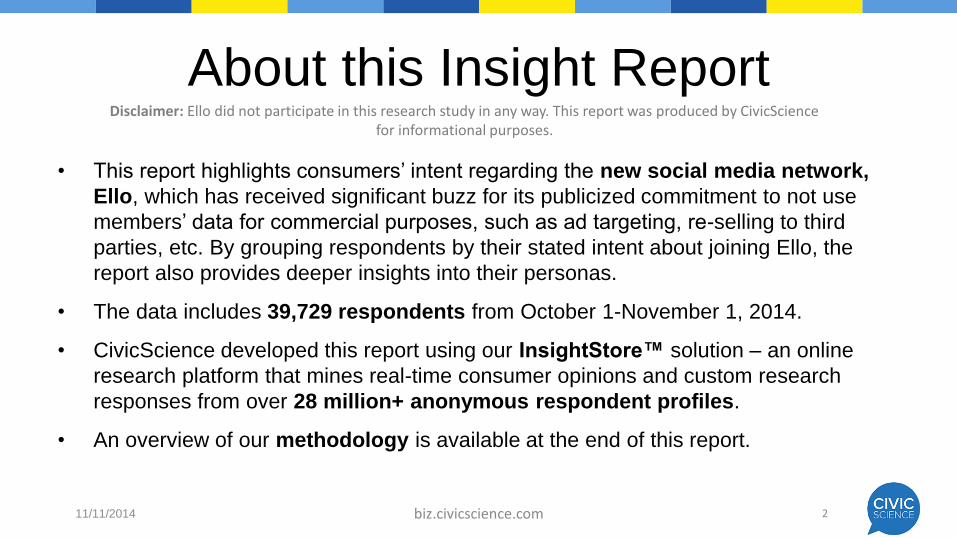
• This report highlights consumers’ intent regarding the new social media network,
Ello, which has received significant buzz for its publicized commitment to not use
members’ data for commercial purposes, such as ad targeting, re-selling to third
parties, etc. By grouping respondents by their stated intent about joining Ello, the
report also provides deeper insights into their personas.
• The data includes 39,729 respondents from October 1-November 1, 2014.
• CivicScience developed this report using our InsightStore™ solution – an online
research platform that mines real-time consumer opinions and custom research
responses from over 28 million+ anonymous respondent profiles.
• An overview of our methodology is available at the end of this report.
11/11/2014 biz.civicscience.com 2
Disclaimer: Ello did not participate in this research study in any way. This report was produced by CivicScience for informational purposes.

Topline Results

Our question:
“Have you received or requested an invitation to join Ello, the new
anti-ad social media network competitor to Facebook?”
11/11/2014 4biz.civicscience.com
(Note: Unweighted results were nearly identical in response breakdowns.)
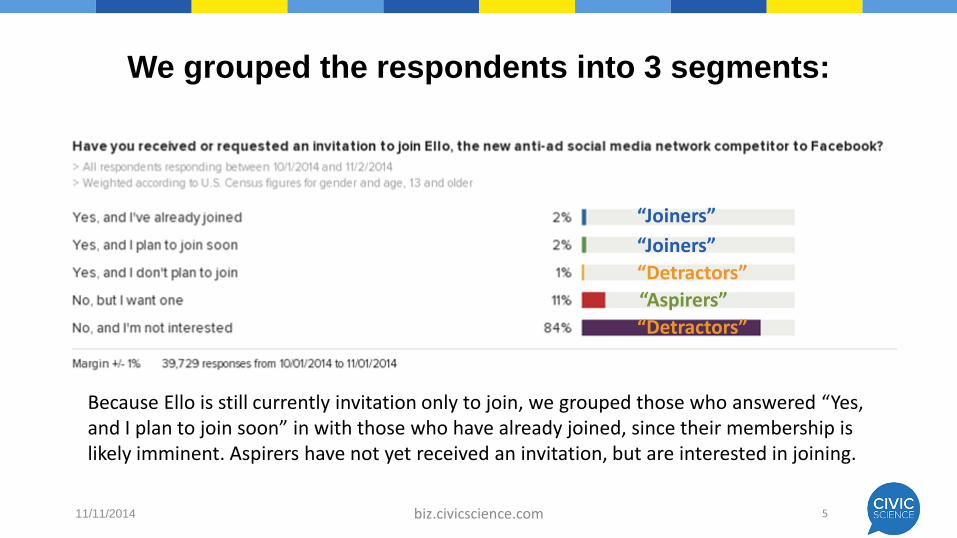
We grouped the respondents into 3 segments:
11/11/2014 5biz.civicscience.com
“Joiners”
“Joiners”
“Aspirers”
“Detractors”
“Detractors”
Because Ello is still currently invitation only to join, we grouped those who answered “Yes, and I plan to join soon” in with those who have already joined, since their membership is likely imminent. Aspirers have not yet received an invitation, but are interested in joining.

We used the CivicScience DeepProfile™ for this report.
Goal: To surface meaningful insights by
comparing 3 segments of people:
Those who have joined or are about to join
Ello (“joiners”)
Those who want to join (“aspirers”)
Those who don’t want to join (“detractors”)
and how they compare to the general U.S.
population.

Summary of Findings: Personas• Ello joiners overall are younger in age who are pre-college graduates, and therefore have lower incomes
and are not yet parents. However, they also include a healthy mix of higher-income, well-educated adults. Joiners are more urban that aspirers and detractors. They rank extremely high in our indices for market mavens, social media engagement (although they under-index in Facebook usage), and TV viewing, but are also strong in money management. They rank higher than the other groups in their price sensitivity and discriminating shopping practices, but are least likely to be influenced by TV ads vs. Internet ads or social media. Ironically, they are far less concerned about data privacy issues than the other groups.
• Ello aspirers are slightly more male, generally college-educated, middle-class, suburban adults who peak among those aged 35-44. Ranking behind the joiners, they still index higher than the general population in market maven and social media attributes. They are most addicted to their digital devices of the 3 groups. They are less price sensitive than the other groups and the general population, but they do tend to frequently price compare and showroom across websites. They rank highest in frequent Facebook use, but like YouTube too.
• Ello detractors tend to be over age 45, be either a parent or grandparent, and live in suburban or rural areas. They index below the other groups and the general population in market maven, social media, and tech savvy attributes. They are more influenced by ads on TV vs. Internet ads and social media. They are less price sensitive and less discriminating in their shopping.

Demographics

Please indicate your gender
Ello aspirers are somewhat more likely to be men than women. Joiners and detractors are fairly evenly split in gender distribution.
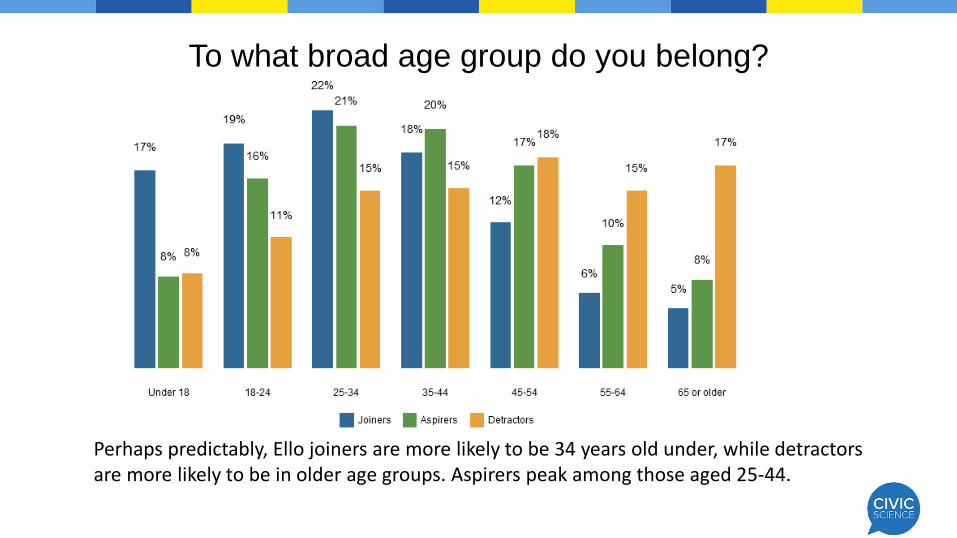
To what broad age group do you belong?
Perhaps predictably, Ello joiners are more likely to be 34 years old under, while detractors are more likely to be in older age groups. Aspirers peak among those aged 25-44.

What is your expected annual household income before taxes?
Ello joiners are more likely to be on the lowest (age is a big factor here) and highest ends of the income spectrum. Aspirers peak among those making $25K-$50K per year, as do detractors.

What is the highest level of education you have attained?
Consistent with the age and income demographic data, we see that Ello joiners are more likely than the other groups to have a high school education or advanced/graduate degrees.

What is your parental status?
Also consistent with the age proxy, the majority (54%) of Ello joiners are not yet parents, while the majority of detractors are a parent and/or grandparent (61%).
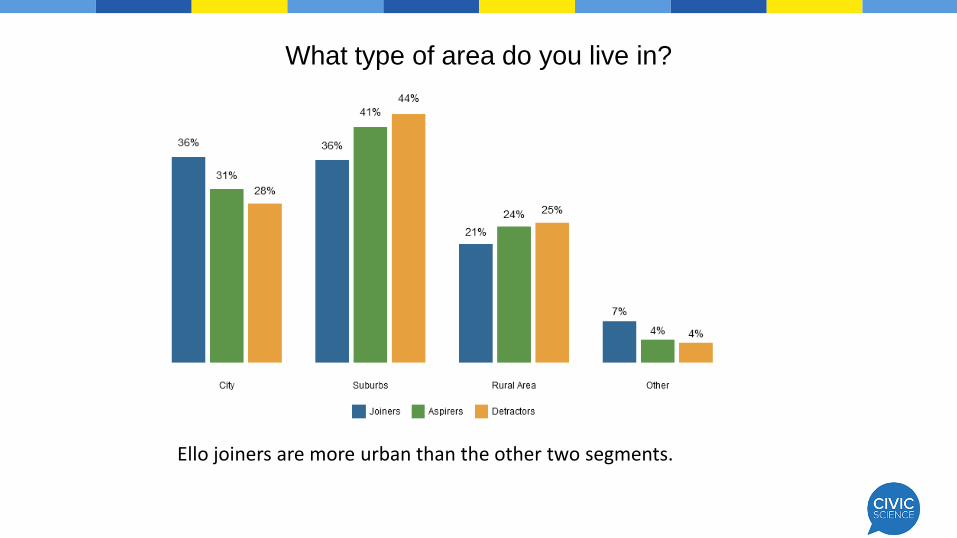
What type of area do you live in?
Ello joiners are more urban than the other two segments.

CivicScience DeepProfile™ Indices
How these 39,729 respondents also answered hundreds of other CivicScience questions over time, compared to the general U.S. population.

DeepProfile™ IndicesIn the following slides, we examine how Ello joiners, Ello aspirers, and
Ello detractors compare based on how the segments responded to a
number of questions that contribute to CivicScience’s DeepProfle™
indices. The visualizations on the following pages show relative
differences to the general population. In this report, we look at 7 of our
12 indices: Market Maven, Social Media, Tech Savvy, TV Viewing,
Money Manager, Price Sensitivity, and Discriminating Shopper.
General
Population
Ello joiners
Ello aspirers
Ello detractors
vs.
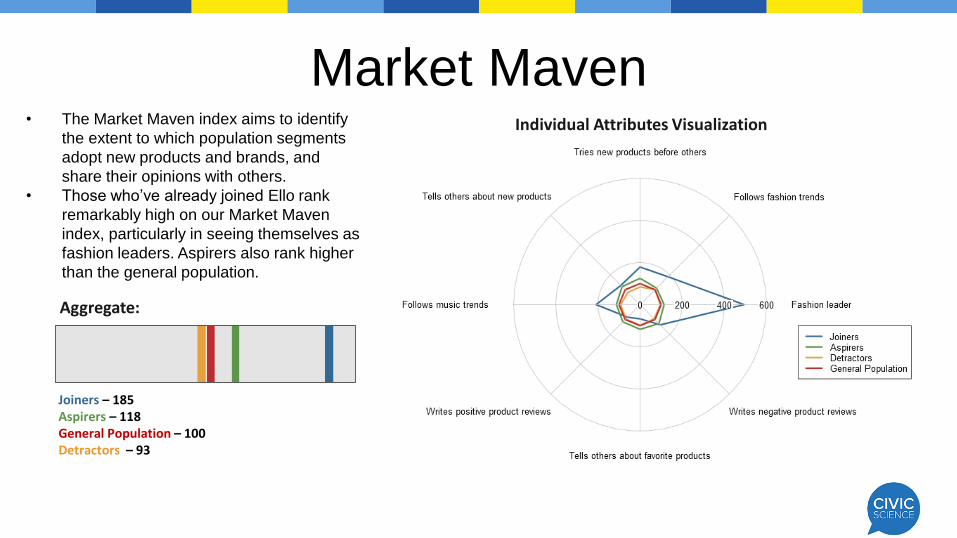
• The Market Maven index aims to identify
the extent to which population segments
adopt new products and brands, and
share their opinions with others.
• Those who’ve already joined Ello rank
remarkably high on our Market Maven
index, particularly in seeing themselves as
fashion leaders. Aspirers also rank higher
than the general population.
Market MavenIndividual Attributes Visualization
Aggregate:
Joiners – 185Aspirers – 118 General Population – 100Detractors – 93

Market Maven Index (continued)
Individual Attributes
• Ello joiners rank higher than the other groups in areas related to fashion and music trends, early
adoption of new products, and sharing info about new products. They are also more likely to write
negative product reviews.
• Those who aspire to join Ello rank higher than all other segments in talking and writing positively
about products they like.
Attribute Joiners Aspirers Detractors
Fashion leader 53% 12% 10%
Follows fashion trends 64% 38% 35%
Follows music trends 73% 39% 32%
Tries new products before others 52% 36% 24%
Tells others about new products 66% 62% 42%
Tells others about favorite products 37% 64% 54%
Writes positive product reviews 48% 66% 55%
Writes negative product reviews 62% 58% 43%

Social Media
• The Social Media index aims to identify the
extent to which social platforms influence their
preferences and behavior.
• It should be no surprise that Ello’s early joiners
rank twice as high as the general population on
our Social Media index, but aspirers also stand
well apart from the general population.
Individual Attributes Visualization
Aggregate:
Joiners – 207Aspirers – 127General Population – 100Detractors – 72
Social media influences purchases
Uses social media while watching TV
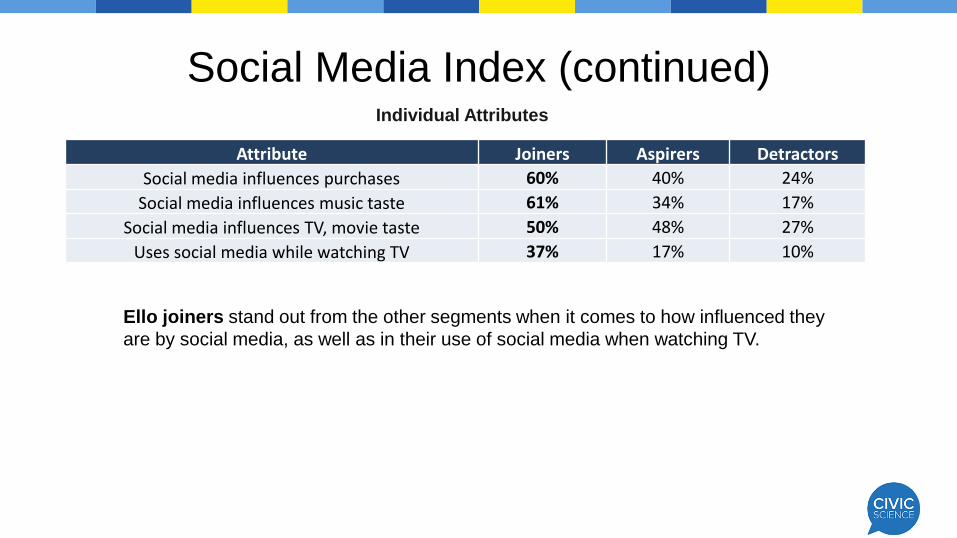
Social Media Index (continued)Individual Attributes
Ello joiners stand out from the other segments when it comes to how influenced they
are by social media, as well as in their use of social media when watching TV.
Attribute Joiners Aspirers Detractors
Social media influences purchases 60% 40% 24%
Social media influences music taste 61% 34% 17%
Social media influences TV, movie taste 50% 48% 27%
Uses social media while watching TV 37% 17% 10%
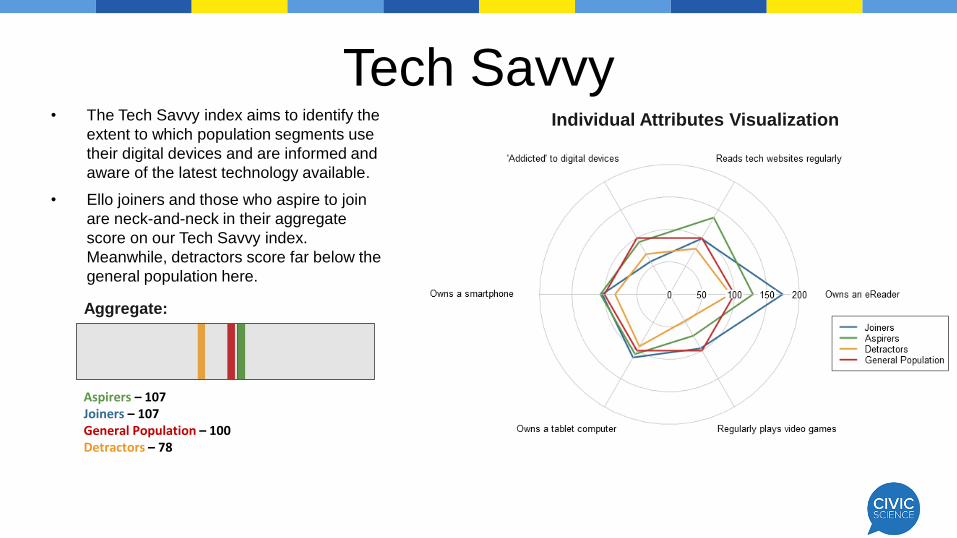
Tech Savvy• The Tech Savvy index aims to identify the
extent to which population segments use
their digital devices and are informed and
aware of the latest technology available.
• Ello joiners and those who aspire to join
are neck-and-neck in their aggregate
score on our Tech Savvy index.
Meanwhile, detractors score far below the
general population here.
Individual Attributes Visualization
Aggregate:
Aspirers – 107Joiners – 107General Population – 100Detractors – 78

Tech Savvy Index (continued)Individual Attributes
• This is an interesting index, with some surprising findings (we think). The Ello joiner segment has
the fewest calling themselves addicted to their digital devices, and aspirers are the most likely to say
they are addicted.
• Ello aspirers and joiners are fairly close in their ownership of smartphones and tablet computers,
despite the age and income differences we saw in the demographic splits.
• Aspirers are the most attentive to tech news and trends.
• Ello joiners have the highest percentage of those who regularly play video games.
Attribute Joiners Aspirers Detractors
'Addicted' to digital devices 37% 58% 45%
Owns a smartphone 71% 73% 58%
Owns a tablet computer 51% 48% 42%
Owns an eReader 51% 37% 27%
Reads tech websites regularly 33% 45% 27%
Regularly plays video games 43% 33% 21%

TV Viewing• The TV Viewing index aims to identify the
extent to which population segments
watch various genres of TV and are
influenced by what they see on TV.
• It’s pretty clear: Ello joiners love their TV,
scoring twice as high on our index than the
general population. Aspirers and
detractors look much more like the general
population in the aggregate.
Individual Attributes Visualization
Aggregate:
Joiners – 201Aspirers – 108Detractors – 102General Population – 100

TV Viewing Index (continued)Individual Attributes
• Ello joiners overall are bigger fans of nearly every TV genre when compared to the other segments and
to the general population – particularly when it comes to documentaries and sitcoms. They are far less
likely to say that TV ads influence them the most (compared to Internet ads and social media).
• Ello detractors are far more likely than the other segments to say they are most influenced by ads on
TV – this is a consistent characteristic that CivicScience sees in any segments we study with a sizable
population of ages 45+.
Attribute Joiners Aspirers Detractors
Drama fan 16% 14% 17%
Sitcom fan 30% 14% 14%
Reality fan 29% 11% 13%
Documentary fan 35% 14% 8%
Travel/home/cooking fan 26% 13% 12%
Music/entertainment fan 47% 31% 26%
Most influenced by ads on TV 29% 39% 56%
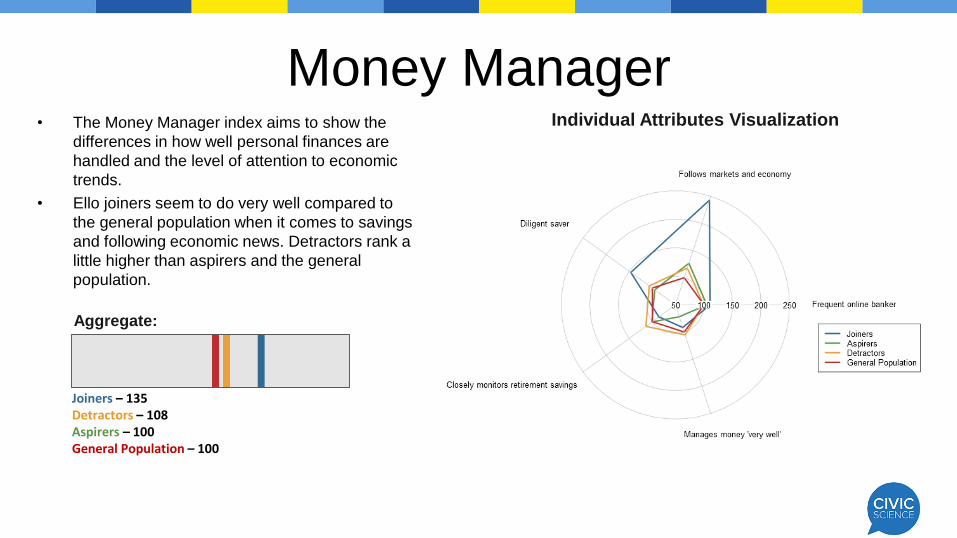
Money Manager• The Money Manager index aims to show the
differences in how well personal finances are
handled and the level of attention to economic
trends.
• Ello joiners seem to do very well compared to
the general population when it comes to savings
and following economic news. Detractors rank a
little higher than aspirers and the general
population.
Individual Attributes Visualization
Aggregate:
Joiners – 135Detractors – 108Aspirers – 100General Population – 100

Money Manager Index (continued)Individual Attributes
• Ello joiners, despite their overall younger age and lower incomes, rank higher than the other groups
when it comes to online banking activity, saving their money, and following the markets and
economy. But keep in mind, this segment also captured a sizable portion of those making over
$150K per year in household income.
• Aspirers rank the lowest in self-characterizing that they manage their money “very well.”
• Detractors, which tend to be older in age, rank highest when it comes to closely monitoring their
retirement savings.
Attribute Joiners Aspirers Detractors
Frequent online banker 49% 47% 44%
Follows markets and economy 36% 19% 17%
Diligent saver 62% 40% 45%
Closely monitors retirement savings 33% 39% 44%
Manages money 'very well' 18% 14% 20%
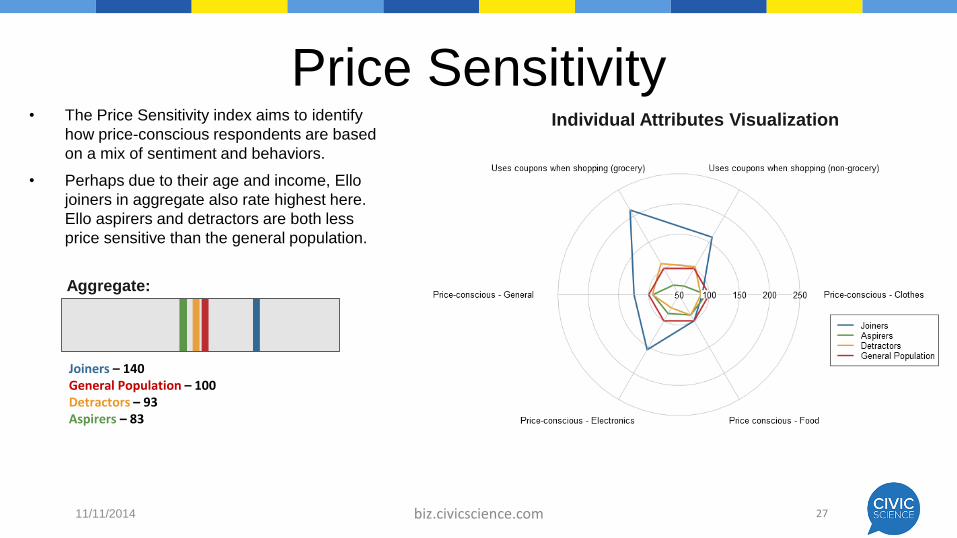
Price Sensitivity
11/11/2014 biz.civicscience.com 27
• The Price Sensitivity index aims to identify
how price-conscious respondents are based
on a mix of sentiment and behaviors.
• Perhaps due to their age and income, Ello
joiners in aggregate also rate highest here.
Ello aspirers and detractors are both less
price sensitive than the general population.
Individual Attributes Visualization
Aggregate:
Joiners – 140General Population – 100Detractors – 93Aspirers – 83

Price Sensitivity Index (continued)Individual Attributes
• Ello joiners are more likely to be couponers than the other segments (particularly compared to
aspirers). They are also more price conscious in general and in the category of electronics. Their
attributes on this index are likely due to their aggregate younger age and lower income.
• Ello aspirers are more likely to be price conscious in the category of clothing than the other
segments.
Attribute Joiners Aspirers Detractors
Uses coupons when shopping (non-grocery)
35% 14% 22%
Uses coupons when shopping (grocery) 50% 16% 26%
Price-conscious - General 53% 40% 40%
Price-conscious - Electronics 46% 26% 22%
Price conscious - Food 38% 34% 34%
Price-conscious - Clothes 48% 52% 47%

Discriminating Shopper• The Discriminating Shopper index aims to
identify the extent to which population
segments do research before making
purchases, and how easy or difficult they will
be to win over.
• Ello joiners also rank the highest here, with
detractors being the least discriminating on
this index in aggregate.
Individual Attributes Visualization
Aggregate:
Joiners – 137General Population – 100Aspirers – 98Detractors – 88

Discriminating Shopper Index (continued)Individual Attributes
• Ello joiners are much more likely than the other segments to be disloyal to brands. They also
tend to consult online reviews.
• Those who aspire to join Ello index higher in price-comparison behavior and showrooming
across different websites.
Attribute Joiners Aspirers Detractors
Always compares prices 41% 56% 45%
Not loyal to favorite brands 39% 8% 12%
Showrooms across websites 52% 71% 66%
Always consults online reviews 38% 35% 25%

Additional Insights

Ello and Data Privacy Sentiment
11/11/2014 32biz.civicscience.com
Attribute Joiners Aspirers Detractors
“Very concerned” about own privacy while using the Internet
35% 50% 50%
“Not concerned at all” about own privacy while using the Internet
24% 6% 7%
“Strongly believe” that companies should never sell the personal information from their
customers to other companies
45% 76% 84%
“Strongly believe” that companies seeking personal information online should disclose ALL the ways the data is collected and used
52% 90% 82%
Early joiners of Ello may be doing so less for the company’s “manifesto” about handling of users’ data than for its “new” factor. Joiners overall are less concerned about privacy issues, which is consistent with sentiment we see in younger adults in the general population. (See our recent two-part report on Data Privacy sentiment.)
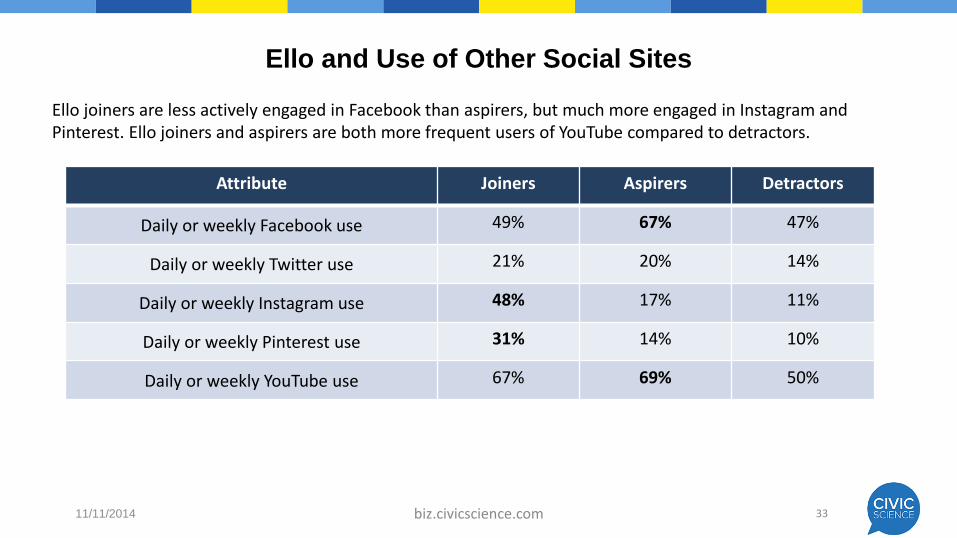
Ello and Use of Other Social Sites
11/11/2014 33biz.civicscience.com
Attribute Joiners Aspirers Detractors
Daily or weekly Facebook use 49% 67% 47%
Daily or weekly Twitter use 21% 20% 14%
Daily or weekly Instagram use 48% 17% 11%
Daily or weekly Pinterest use 31% 14% 10%
Daily or weekly YouTube use 67% 69% 50%
Ello joiners are less actively engaged in Facebook than aspirers, but much more engaged in Instagram and Pinterest. Ello joiners and aspirers are both more frequent users of YouTube compared to detractors.

Behavioral and Sentiment Insights
11/11/2014 34biz.civicscience.com
Attribute Joiners Aspirers Detractors
Shares celebrity gossip / news via social media every day.
22% 7% 3%
Shares sports news via social media every day 21% 6% 3%
Has used and loves SnapChat 32% 5% 6%
Buys organic food at every chance 37% 12% 8%
Self-reports they are more physically attractive than most people their age and gender
38% 10% 9%
Saves at least 20% of income each month on average, including for retirement savings
41% 7% 11%
Below lists an assortment of other behavioral and sentiment areas where Ello joiners index higher than the other two groups.

Brand and Celebrity Fandom
11/11/2014 35biz.civicscience.com
Brand / Celebrity Joiners Aspirers Detractors
Bruno Mars (“I love him”) 39% 9% 5%
Instagram (“I love it”) 37% 20% 12%
Seth Rogan (“I love him”) 34% 16% 7%
Ross stores (“I love it”) 26% 6% 5%
Gary Busy (“I love him”) 24% 6% 3%
Subaru cars (“I love them”) 23% 8% 7%
Mazda cars (“I love them”) 21% 5% 4%
We also track many brands and celebrities to show how they rank among customized segments. Below you can see some who index higher among Ello joiners compared to the other two segments.

Appendix Slides
biz.civicscience.com
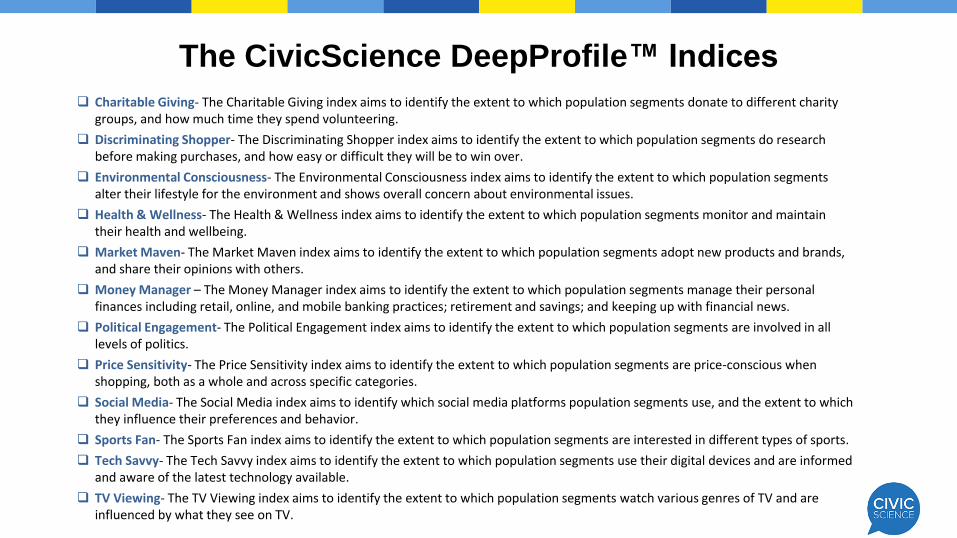
The CivicScience DeepProfile™ Indices
Charitable Giving- The Charitable Giving index aims to identify the extent to which population segments donate to different charity groups, and how much time they spend volunteering.
Discriminating Shopper- The Discriminating Shopper index aims to identify the extent to which population segments do research before making purchases, and how easy or difficult they will be to win over.
Environmental Consciousness- The Environmental Consciousness index aims to identify the extent to which population segments alter their lifestyle for the environment and shows overall concern about environmental issues.
Health & Wellness- The Health & Wellness index aims to identify the extent to which population segments monitor and maintain their health and wellbeing.
Market Maven- The Market Maven index aims to identify the extent to which population segments adopt new products and brands, and share their opinions with others.
Money Manager – The Money Manager index aims to identify the extent to which population segments manage their personal finances including retail, online, and mobile banking practices; retirement and savings; and keeping up with financial news.
Political Engagement- The Political Engagement index aims to identify the extent to which population segments are involved in all levels of politics.
Price Sensitivity- The Price Sensitivity index aims to identify the extent to which population segments are price-conscious when shopping, both as a whole and across specific categories.
Social Media- The Social Media index aims to identify which social media platforms population segments use, and the extent to which they influence their preferences and behavior.
Sports Fan- The Sports Fan index aims to identify the extent to which population segments are interested in different types of sports.
Tech Savvy- The Tech Savvy index aims to identify the extent to which population segments use their digital devices and are informed and aware of the latest technology available.
TV Viewing- The TV Viewing index aims to identify the extent to which population segments watch various genres of TV and are influenced by what they see on TV.

Methodology

About the CivicScience Methodology:
CivicScience collects real-time consumer research data via polling applications that run on hundreds of U.S. publisher websites, cycling through thousands of active questions on any given day. Respondents answer just for fun, are 100% voluntary opt-ins, and are kept anonymous, allowing for greatly reduced bias and higher levels of engagement. Using technology, CivicScience builds deep psychographic profiles of these anonymous respondents over time, providing valuable consumer sentiment data to the decision makers who care. Automated data science technology allows clients to rapidly gain robust consumer insight and trending reports. The CivicScience methodology has been scientifically validated by a team of academic leaders and by independent consulting firms. Responses may be weighted for U.S. census representativeness for gender and age. CivicScience currently has more than 28 million anonymous consumer profiles and 600 million responses stored, growing daily.
11/11/2014 biz.civicscience.com 39

CivicScience DeepProfile™ - How it WorksFor the segments we’re interested in, we look at
how those people responded to thousands of
other questions in our database, building a
contingency table for each pair of questions.
We automatically mine thousands of questions
related to our 12 DeepProfile™ indices, plus
demographic and behavioral attributes such as:
• Lifestyle
• Media consumption
• Entertainment
• Technology usage
• Health and wellness
• Politics and ideology
• Other general attributes
We calculate each table’s Pearson’s
chi-squared statistic, and then employ
the Benjamini-Hochberg false
detection rate procedure to screen
out likely false positives (i.e.,
statistically-significant associations that
may be due to random chance).
The tables that pass through our
screening process are then ranked by
their Tschuprow’s T coefficient,
which measures strength of
association.

The CivicScience InsightStore™
Dynamic
Question
Library
Publisher
Audience
Network
Correlation
Discovery
Engine
Real-Time
Insights
Solutions
The leading intelligent polling and real-time consumer insights platform. Runs on the largest proprietary, syndicated, and independent consumer survey database. Supports a variety of consumer research solutions, including our DeepProfile™.
biz.civicscience.com

Contact us to discuss a tailored CivicScience
DeepProfile™ Report, InsightStore™ Subscription,
and Custom Research for your brand: