Idaho!Low)Income Weatherization!Program! … · PCT& Participant!Cost!Test! PTRC&...
56
Idaho LowIncome Weatherization Program Evaluation Report For Program Years 20102012 Prepared for Rocky Mountain Power by and H Gil Peach & Associates January 26, 2015
Transcript of Idaho!Low)Income Weatherization!Program! … · PCT& Participant!Cost!Test! PTRC&...

Idaho Low-‐Income
Weatherization Program Evaluation Report
For Program Years 2010-‐2012
Prepared for Rocky Mountain Power by
and
H Gil Peach & Associates
January 26, 2015

TABLE OF CONTENTS TABLE OF ACRONYMS ....................................................................................................................... 1 REPORT SUMMARY ........................................................................................................................... 2 IMPACT EVALUATION ........................................................................................................................ 8
Methodology ........................................................................................................................ 8 Data and Document Review ................................................................................................. 9 Program Participation and Reported Savings ...................................................................... 10 Energy Savings Analysis ........................................................................................................ 12 Payments and Arrearages ................................................................................................... 14
ASSESSMENT OF NON-‐ENERGY BENEFITS ......................................................................................... 19 PROCESS EVALUATION ...................................................................................................................... 21
Methodology ........................................................................................................................ 22 Client Survey ........................................................................................................................ 23 Stakeholder and Agency Interviews ..................................................................................... 28 Process Evaluation Conclusions ........................................................................................... 32 Process Evaluation Recommendations ................................................................................ 32
COST EFFECTIVENESS ........................................................................................................................ 34 Assumptions and Results ..................................................................................................... 35 Cost-‐Effectiveness Results .................................................................................................... 37
CONCLUSIONS ................................................................................................................................... 39 RECOMMENDATIONS ........................................................................................................................ 39 REFERENCES ...................................................................................................................................... 41 APPENDIX .......................................................................................................................................... 42
Client Survey Protocol .......................................................................................................... 42 Agency Interview Protocol ................................................................................................... 51
1 | P a g e
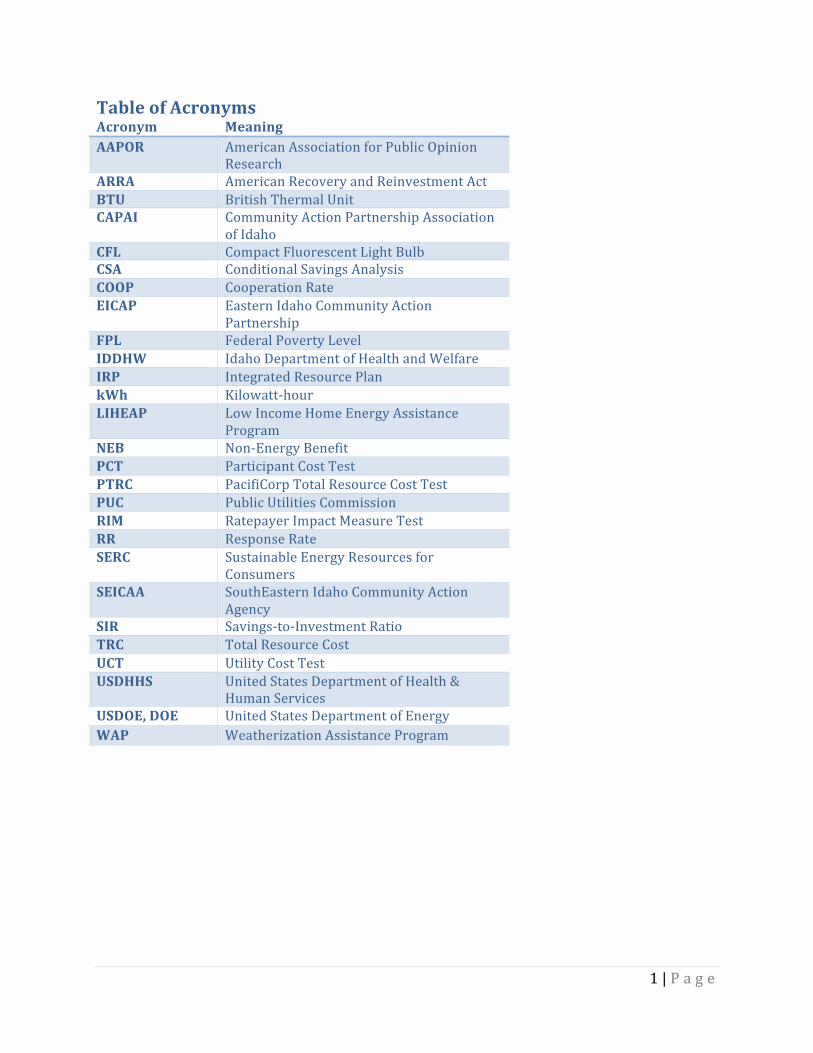
Table of Acronyms Acronym Meaning AAPOR American Association for Public Opinion
Research ARRA American Recovery and Reinvestment Act BTU British Thermal Unit CAPAI Community Action Partnership Association
of Idaho CFL Compact Fluorescent Light Bulb CSA Conditional Savings Analysis COOP Cooperation Rate EICAP Eastern Idaho Community Action
Partnership FPL Federal Poverty Level IDDHW Idaho Department of Health and Welfare IRP Integrated Resource Plan kWh Kilowatt-‐hour LIHEAP Low Income Home Energy Assistance
Program NEB Non-‐Energy Benefit PCT Participant Cost Test PTRC PacifiCorp Total Resource Cost Test PUC Public Utilities Commission RIM Ratepayer Impact Measure Test RR Response Rate SERC Sustainable Energy Resources for
Consumers SEICAA SouthEastern Idaho Community Action
Agency SIR Savings-‐to-‐Investment Ratio TRC Total Resource Cost UCT Utility Cost Test USDHHS United States Department of Health &
Human Services USDOE, DOE United States Department of Energy WAP Weatherization Assistance Program

2 | P a g e
REPORT SUMMARY Introduction Rocky Mountain Power’s Low-‐Income Weatherization Program in Idaho has a mission to improve energy efficiency of residential dwellings either owned or rented by customers meeting income guidelines through the installation of energy efficient measures.1 Rocky Mountain Power’s contract for weatherization services is held by two weatherization agencies: Eastern Idaho Community Action Partnership (EICAP) and SouthEastern Idaho Community Action Agency (SEICAA). Both agencies implement the program in Rocky Mountain Power’s service territory, with monitoring oversight from the Community Action Partnership Association of Idaho (CAPAI). CAPAI contracts directly with the Idaho Department of Health and Welfare (IDDHW), and is the link between the weatherization agencies and the federal funding system. Energy saving improvements and installation are provided at no cost to the low-‐income households. The United States Department of Energy (USDOE) and United States Department of Health and Human Services (USDHHS) fund and coordinate the government contribution to this program. From a utility perspective, coordination of utility support for low-‐income weatherization with the Weatherization Assistance Program (WAP) is a best practice because the substantial federal and state contributions are viewed as leverage that establishes high standards, provides training to weatherization specialists, ensures quality control and takes into account the health, safety and repair and replacement problems endemic to the low-‐income portion of the housing stock.
Agencies coordinate services by providing the weatherization specialists and crews to deliver the direct services. Each agency leverages funding from Rocky Mountain Power, USDOE, USDHHS, IDDHW, and other sources to achieve comprehensive weatherization of low-‐income customers’ homes. Intermountain Gas is the major natural gas provider in this area of Idaho and does not provide low-‐income weatherization funding.
Evaluation Approach Rocky Mountain Power contracted with Smith & Lehmann Consulting to conduct a process and impact evaluation for program years 2010, 2011, and 2012. The process evaluation assesses program delivery and opportunities for improvement. The impact evaluation assessed energy impacts and inputs for calculating program cost-‐effectiveness. Some of the components of the evaluation approach are discussed below.
♦ Data Collection Rocky Mountain Power provided participant and energy-‐saving improvement (measure) data, as well as program cost data and reported (ex-‐ante) savings. Rocky Mountain Power also produces annual reports of expected energy savings and program cost-‐effectiveness. To complete the analysis of evaluated energy savings, Rocky Mountain Power provided program participant (treatment group) and nonparticipant (comparison group) billing and payment histories.
1 Energy Efficiency -‐ The use of less energy to provide the same or an improved level of service to the energy consumer; or the use of less energy to perform the same function.

3 | P a g e
♦ Process Approach Smith & Lehmann Consulting conducted telephone interviews with CAPAI, EICAP and SEICAA staff. The evaluation team also conducted a telephone survey with a random sample of Rocky Mountain Power customers who received weatherization services to assess customer satisfaction with program delivery and efficacy, verify program services, and obtain opinions on various program components.
♦ Evaluation Approach to Program Energy Savings Planned Energy Savings: The evaluation team collected and is reporting Rocky Mountain Power’s program (ex-‐ante) estimates of energy savings.
Evaluated Energy Saving: Smith & Lehmann Consulting developed a pooled conditional savings analysis (CSA) regression model of energy (kWh) savings associated with the energy-‐saving improvements (measures) installed. The regression model was run to estimate weather-‐normalized, program-‐induced kWh savings based on participant and nonparticipant billing data.
Approximately 75% of program participant homes in Idaho have an electric heating source; consequently, measures installed through the Rocky Mountain Power program were often whole-‐home weatherization (shell-‐measures), energy-‐efficient electric lighting (compact fluorescent light bulbs or CFLs) and energy-‐efficient refrigerators.
♦ Evaluation Approach to Non-‐Energy Benefits (NEBs) Smith & Lehmann Consulting analyzed participant payment behavior and arrearages under a simple pre/post analysis design using a comparison group. This provided an assessment of the utility’s NEBs generated by the program.
♦ Cost-‐Effectiveness Assessment Cost-‐effectiveness was assessed using five different approaches. Smith & Lehmann Consulting provided inputs to the cost-‐effectiveness calculations to Cadmus, who performed the calculations of Benefit/Cost Ratio and Levelized Cost for each of the program years and for the total evaluation period.
Conclusions and Major Findings
♦ Rocky Mountain Power’s program exemplifies a utility best practice in that it is coordinated with USDOE, USDHHS, and IDDHW. This provides leverage to each utility dollar provided in this joint effort to serve low-‐income customers. Rocky Mountain Power’s decision to coordinate its weatherization efforts with Idaho’s subgrantee agencies provides leverage to each utility dollar and should be continued. Coordination with the Idaho WAP is a best practice.

4 | P a g e
♦ Program data to track heating sources of homes weatherized was often not entered in the old 2010 Rocky Mountain Power database. The primary heating fuel for each customer is included in the new Rocky Mountain Power program database, beginning in 2011. The fuel type can now be entered in the database as a specific electric or non-‐electric heat-‐type (i.e., electric baseboard, electric ceiling cable, electric forced air, electric portable, electric water heater, fireplace, gas furnace, oil furnace/stove, pellet stove, propane furnace/stove, woodstove/fireplace insert, and other).
♦ The partnership between Low Income Home Energy Assistance Program (LIHEAP) payment assistance and WAP is beneficial to both programs: LIHEAP certification streamlines the application process and WAP helps clients to decrease their energy burden by weatherizing their home. This decreases not only the energy burden to the client but also the burden placed on LIHEAP to help clients over future heating seasons.
♦ Overall, this evaluation demonstrates that the program is operating as planned within the design parameters outlined in the Rocky Mountain Power Electric Service Schedule No. 21, State of Idaho.
♦ Savings from program participation as determined through billing analysis are 540,660 kWh for all three program years, 2010-‐2012. This amounts to 102% of Rocky Mountain Power reported energy savings of 530,189 kWh, across the 2010, 2011, and 2012 program years (See Table 1). Therefore, the net realization rate for this program is 102%. A breakdown of the program savings by year and the respective realization rates are provided below.
Table 1. Net Program Savings (at Site) 2010-‐2012 Measure Reported
Savings (kWh) Evaluated Savings (kWh)*
Net Realization Rate
2010 71,346 93,699 131% 2011 228,605 233,199 102%
2012 230,238 221,990 96%
Total 530,189 540,660 102% *Evaluated savings are the results of the billing analysis, and are discussed in detail in the Impact Evaluation section of this report.
♦ The overall 2010-‐2012 timeframe was found to be cost-‐effective under all test perspectives
except the Ratepayer Impact Measure (RIM) test. The Participant Cost Test (PCT) is determined “Not Applicable” for the purpose of evaluating a low-‐income program with a zero cost to the participant. Further description of the individual tests and respective results can be found in the Cost-‐Effectiveness Analysis section of this report.

5 | P a g e
Table 2. 2010-‐2012 Low-‐Income Weatherization – Cost-‐Effectiveness including Non-‐Energy Benefits Cost-‐Effectiveness Test Levelized
$/kWh Costs* Benefits* Net Benefits Benefit/Cost
Ratio** PacifiCorp Total Resource Cost Test (PTRC)
$0.087 $618,249 $826,357 $208,109 1.34
Total Resource Cost Test (TRC) No Adder
$0.087 $618,249 $649,393 $31,145 1.05
Utility Cost Test (UCT) $0.087 $618,249 $649,393 $31,145 1.05 Rate Impact Test (RIM) $1,297,349 $649,393 ($647,956) 0.50 Participant Cost Test (PCT) $0 $877,882 $877,882 N/A Discounted Participant Payback (years)
N/A
Lifecycle Revenue Impact ($/KWh)
$0.00001323
*Smith & Lehmann Consulting provided evaluated costs and benefits necessary to calculating cost-‐effectiveness **Cadmus is responsible for results of the cost-‐effectiveness summary
Table 3. 2010 Low-‐Income Weatherization – Cost-‐Effectiveness including Non-‐Energy Benefits Cost-‐Effectiveness Test Levelized
$/kWh Costs* Benefits* Net Benefits Benefit/Cost
Ratio** PacifiCorp Total Resource Cost Test (PTRC)
$0.101 $133,672 $128,159 ($5,513) 0.96
Total Resource Cost Test (TRC) No Adder
$0.101 $133,672 $116,508 ($17,164) 0.87
Utility Cost Test (UCT) $0.101 $133,672 $116,508 ($17,164) 0.87 Rate Impact Test (RIM) $260,596 $116,508 ($144,088) 0.45 Participant Cost Test (PCT) $0 $126,924 $126,924 N/A Discounted Participant Payback (years)
N/A
Lifecycle Revenue Impact ($/KWh)
$0.00000294
*Smith & Lehmann Consulting provided evaluated costs and benefits necessary to calculating cost-‐effectiveness **Cadmus is responsible for results of the cost-‐effectiveness summary
6 | P a g e
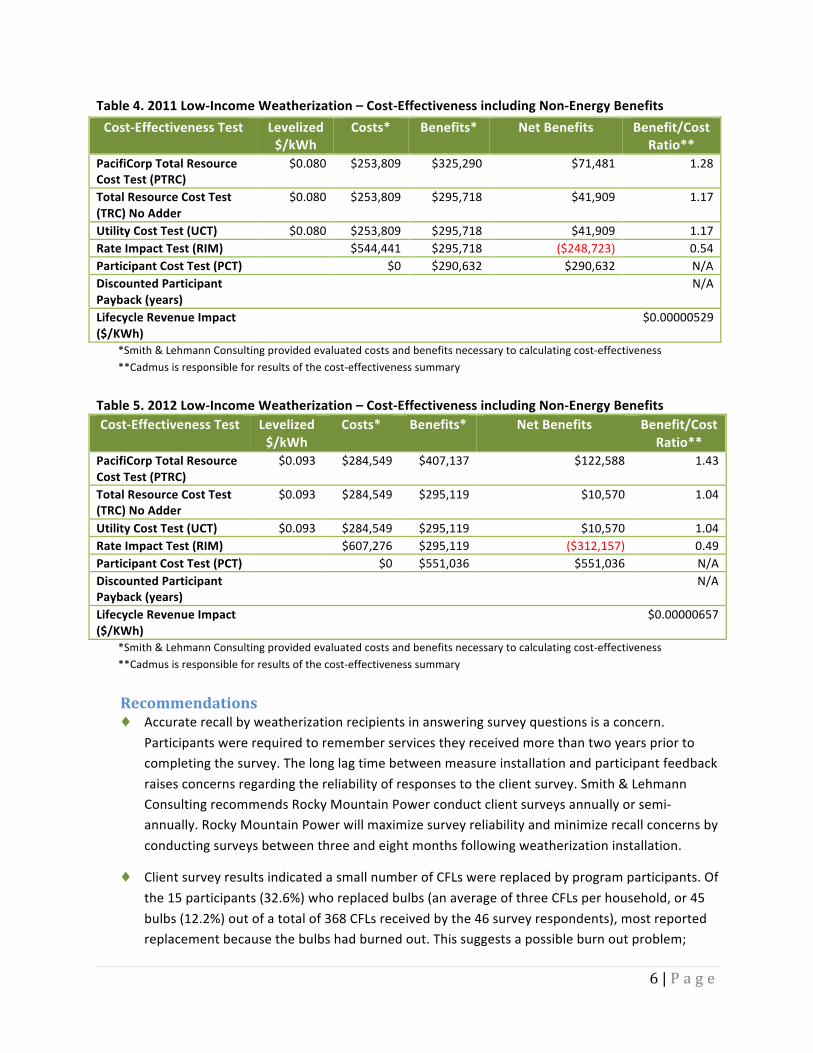
Table 4. 2011 Low-‐Income Weatherization – Cost-‐Effectiveness including Non-‐Energy Benefits Cost-‐Effectiveness Test Levelized
$/kWh Costs* Benefits* Net Benefits Benefit/Cost
Ratio** PacifiCorp Total Resource Cost Test (PTRC)
$0.080 $253,809 $325,290 $71,481 1.28
Total Resource Cost Test (TRC) No Adder
$0.080 $253,809 $295,718 $41,909 1.17
Utility Cost Test (UCT) $0.080 $253,809 $295,718 $41,909 1.17 Rate Impact Test (RIM) $544,441 $295,718 ($248,723) 0.54 Participant Cost Test (PCT) $0 $290,632 $290,632 N/A Discounted Participant Payback (years)
N/A
Lifecycle Revenue Impact ($/KWh)
$0.00000529
*Smith & Lehmann Consulting provided evaluated costs and benefits necessary to calculating cost-‐effectiveness **Cadmus is responsible for results of the cost-‐effectiveness summary
Table 5. 2012 Low-‐Income Weatherization – Cost-‐Effectiveness including Non-‐Energy Benefits Cost-‐Effectiveness Test Levelized
$/kWh Costs* Benefits* Net Benefits Benefit/Cost
Ratio** PacifiCorp Total Resource Cost Test (PTRC)
$0.093 $284,549 $407,137 $122,588 1.43
Total Resource Cost Test (TRC) No Adder
$0.093 $284,549 $295,119 $10,570 1.04
Utility Cost Test (UCT) $0.093 $284,549 $295,119 $10,570 1.04 Rate Impact Test (RIM) $607,276 $295,119 ($312,157) 0.49 Participant Cost Test (PCT) $0 $551,036 $551,036 N/A Discounted Participant Payback (years)
N/A
Lifecycle Revenue Impact ($/KWh)
$0.00000657
*Smith & Lehmann Consulting provided evaluated costs and benefits necessary to calculating cost-‐effectiveness **Cadmus is responsible for results of the cost-‐effectiveness summary
Recommendations ♦ Accurate recall by weatherization recipients in answering survey questions is a concern.
Participants were required to remember services they received more than two years prior to completing the survey. The long lag time between measure installation and participant feedback raises concerns regarding the reliability of responses to the client survey. Smith & Lehmann Consulting recommends Rocky Mountain Power conduct client surveys annually or semi-‐annually. Rocky Mountain Power will maximize survey reliability and minimize recall concerns by conducting surveys between three and eight months following weatherization installation.
♦ Client survey results indicated a small number of CFLs were replaced by program participants. Of the 15 participants (32.6%) who replaced bulbs (an average of three CFLs per household, or 45 bulbs (12.2%) out of a total of 368 CFLs received by the 46 survey respondents), most reported replacement because the bulbs had burned out. This suggests a possible burn out problem;

7 | P a g e
however, owing to the two-‐year time lapse, we cannot verify that bulbs replaced were those purchased separately by the client or provided by the agencies. If future client surveys confirm bulb burnout as a problem, Rocky Mountain Power should collaborate with local agencies to assess whether procurement specifications should be revised to exceed Energy Star certification as Energy Star certification only ensures a minimum standard for energy savings.
♦ Client survey results indicate 3% of participants remember or recognize that Rocky Mountain Power contributed to the weatherization work they received. Rocky Mountain Power should consider whether it is important that customers recognize Rocky Mountain Power’s contribution to the weatherization services received. If so, Rocky Mountain Power should consider providing a branded item concurrently with weatherization services to increase customer recognition.
♦ Smith & Lehmann Consulting recommends that agency’s wait-‐lists be updated semi-‐annually to remove past-‐dated applicants, and that wait-‐lists be made accessible to LIHEAP managers to better inform the participant during the application process of their respective wait-‐time for weatherization services. When possible, Smith & Lehmann Consulting also recommends agencies separate their wait-‐lists by gas and electric (as done by SEICAA) and by service provider.

8 | P a g e
IMPACT EVALUATION Rocky Mountain Power’s Low-‐Income WAP in Idaho is implemented by two weatherization agencies: EICAP and SEICAA. Both agencies administer the program in Rocky Mountain Power’s service territory, with monitoring oversight from CAPAI. CAPAI contracts directly with IDDHW, and is the link between the weatherization agencies and the federal funding system (USDOE and USDHHS). Energy saving improvements and measure installations are provided at no cost to qualifying low-‐income households.
Rocky Mountain Power contracted with Smith & Lehmann Consulting to conduct a process and impact evaluation for program years 2010, 2011 and 2012. The impact evaluation assesses energy impacts and inputs to calculating program cost-‐effectiveness. This section describes the approach used to develop reported savings and adjusted gross energy savings, based on utility electric billing data.
Methodology An energy usage analysis (regression analysis) was conducted by Smith & Lehmann Consulting to determine kWh savings and realization rates for the program for 2010, 2011, and 2012 program participation years.
Measures most frequently installed include: CFLs, water pipe insulation and sealing, air sealing and infiltration control, ceiling insulation, replacement windows, thermal door installation, and furnace repair and tune-‐ups.
The savings estimate was determined from a pooled CSA regression model. This model included data from a group of nonparticipant homes, which served as the baseline (comparison group). Impact evaluation data were obtained from a number of different sources, including:
♦ Program Database: Rocky Mountain Power provided information regarding the program’s participants and installed measures. Specifically, these data included participant contact information and lists of measures installed per home, as well as associated energy savings.
♦ Billing and Payment Records: Rocky Mountain Power provided participant and nonparticipant account records from December 2008 through January 2014. The comparison (nonparticipant) population was identified based on their receipt of energy assistance on their Rocky Mountain Power bill at some point during the data window (December 2008 through January 2014). To be considered nonparticipants for the comparison group, the homes could not have received weatherization with Rocky Mountain Power funds during the program period 2010-‐2012.
♦ Weather Data: Smith & Lehmann Consulting collected weather data from four representative weather stations for the corresponding time period from Weather Data Depot.2 Weather stations were selected based on proximity to Rocky Mountain Power service territory. Smith &
2 Weather data was pulled from Weather Data Depot available at: http://www.weatherdatadepot.com
9 | P a g e
Lehmann Consulting also considered relative topological elevations and local weather patterns when matching zip codes to their respective weather stations.
The evaluation team first matched participant accounts from program accounting data to billing records. This separated billing records into treatment and comparison groups. Monthly heating and cooling degree days were then matched by zip code to each of the respective calendar months in the billing data for use in a weather-‐adjusted CSA model. Data and Document Review The following data and information was reviewed to determine the average savings and participation levels as well as the distribution of measures over the 2010, 2011, and 2012 program years.
♦ Participant Data Rocky Mountain Power provided the initial program tracking database of participant data in two separate groupings: 2010 and 2011-‐2012. This split was due to an upgrade of the system to new database software in 2011. This required merging of the new and old databases to properly assess results for the entire evaluation timeframe. Through this process, it was discovered that the 2010 database had limited information and was missing kWh savings information for all measures. The evaluation team used the 2010 information presented in 2010 Idaho DSM Annual Report3 to supplement the database for that year.
The 2011-‐2012 database was comprehensive and included participant contact information, participant identifiers, measures installed, kWh savings per measure, year of installation, and agency and cost information. Data were summarized by measure and year. An adjustment was made by Rocky Mountain Power to change the kWh savings for CFLs counted in the database: in 2011, the program assumed 437 kWh per household that received CFLs; in 2012, the correction was made to reduce the kWh to 224 per household. Due to the limited information in the 2010 database, it was assumed that in 2010 Rocky Mountain Power reported 437 kWh-‐savings per household receiving CFLs. This assumption was confirmed with the Weatherization Program Manager at Rocky Mountain Power.
The initial data extract from Rocky Mountain Power included program participant information and account numbers that did not always match corresponding billing and payment information. The evaluation team relied on site-‐ID to match the participants with the billing and payment data.
♦ Invoice Data The program data provided by Rocky Mountain Power did not track invoice or project completion dates, and only included the dates the completed weatherized homes were entered
3Rocky Mountain Power Annual Report. 2010. 2010 Annual Energy Efficiency and Peak Reduction Report-‐ Idaho. Available at: http://www.pacificorp.com/content/dam/pacificorp/doc/Energy_Sources/Demand_Side_Management/ID_DSM_Report_2010.pdf

10 | P a g e
into the database. Delays between completion dates, invoice dates, and the date the job was entered into the system made it difficult to determine which program year each job was completed. It was determined that Rocky Mountain Power’s protocol is to enter projects into the tracking system during the same month they were invoiced, and so this information was used to assign homes to completion years.
♦ Quantity and Cost Data Collection Rocky Mountain Power’s 2010-‐2012 database tracked measure codes, measure names, and total measure costs per home, but does not track the quantity of the installed measures (e.g., number of CFLs installed). Measure quantity is necessary in cases for calculating reported energy savings estimates and is also helpful for assessing measure-‐level cost-‐effectiveness. For this analysis reported savings are based off of Rocky Mountain Power annual report information, and are calculated at the program level.
♦ Primary Heating Fuel Flag Program data to track heating sources of homes weatherized was often not updated correctly in the old 2010 Rocky Mountain Power database. The primary heating fuel for each customer was updated in the new Rocky Mountain Power program database, beginning in 2011. The fuel type can now be entered in the database as a specific electric or non-‐electric heat-‐type (i.e., electric baseboard, electric ceiling cable, electric forced air, electric portable, electric water heater, fireplace, gas furnace, oil furnace/stove, pellet stove, propane furnace/stove, woodstove/fireplace insert, and other).
♦ Measure Tracking Despite difficulties with the old database, measures were tracked accurately in the 2011-‐2012 database. Measures installed were matched with annual numbers reported by Rocky Mountain Power. The measures installed in 2011 and 2012 were consistent with information provided in the annual reports. Rocky Mountain Power’s annual report information allowed for reconciliation of 2010 measures installed.
Program Participation and Reported Savings Smith & Lehmann Consulting reviewed program data and annual reports to determine average annual savings, participation levels, and the distribution of measures installed over the program years 2010-‐2012. Table 6 displays the average savings and participation levels over the evaluation period, as well as for each program year.
Average savings per participant reported by Rocky Mountain Power were used as a benchmark to check the results of the billing analysis and to calculate the realization rate for each of the program years and for the total evaluation period 2010-‐2012.

11 | P a g e
Table 6. Annual Reported (Ex-‐Ante) Savings and Participant Levels
Program Year Participation* Reported at Site Energy Savings
(kWh)
Average Savings per Participant
(kWh) 2010 43 71,346 1,659 2011 100 228,605 2,286 2012 104 230,238 2,214 Total 247 530,189 2,147
*Participant numbers are taken from Rocky Mountain Power’s annual reports
Annual participation and reported program savings were calculated using Rocky Mountain Power’s program database and annual report information. Frequencies of the measures installed are tracked for each participant in Rocky Mountain Power’s program accounting database. Table 7 reports the frequency of homes receiving different measures, as reported in Rocky Mountain Power’s program accounting database. Note that the frequency reflects the number of homes that received a specific type of measure, and not the total number of individual measures installed. Approximately 75% of the 247 homes are electrically heated and received installations consisting of some type of insulation, CFLs, and health and safety measures.
Table 7. Frequency of Measure Installations 2010-‐2012 Measure Type Reported Frequency
Installed Grand Total
2010 2011 2012 2010-‐2012 Ceiling Insulation 17 37 50 104 Floor Insulation 6 30 26 62 Wall Insulation 3 6 6 15 Replacement Windows 16 37 47 100 Storm Windows 1 0 0 1 Duct Insulation/Sealing 5 9 13 27 Insulated (Thermal) Doors 14 36 45 95 Attic Ventilation 14 29 33 76 Infiltration Controls 19 57 59 135 Water Pipe Insulation and Sealing 31 88 85 204 Water Heater Repair/Replacement* 4 6 13 23 Furnace Repair/Tune-‐up/Filters 7 36 46 89 Furnace Replacement 3 6 2 11 Refrigerator Replacements 0 13 3 16 Compact Fluorescent Light bulbs (CFL) 43 97 87 227 Health & Safety Measure 15 43 64 122 *Water heater repair/replacement was reported as a combined category in Rocky Mountain Power’s 2010 Annual Report, but in 2011 and 2012 it was reported as separate categories; water “heater repair” and “water heater replacement.” For ease of reporting, and because there were very few of these measures installed, the separate categories were summed for program years 2011 and 2012, and reported in the above table.

12 | P a g e
Energy Savings Analysis Smith & Lehmann Consulting analyzed monthly billing data, provided by Rocky Mountain Power, for all residential customers from December 2008 through January 2014. This data included customer information, containing a list of customers that had received energy assistance for their Rocky Mountain Power bill, and were assumed to meet income requirements for the weatherization program. Methods for this analysis included:
♦ Data Screening To ensure a clean and reliable dataset for the billing analysis, the evaluation team screened the billing data for treatment group and comparison group usage. First, the evaluation team summarized monthly kWh usage and the respective number of billing days per usage-‐month for each account. These periods were then adjusted to represent usage per calendar month to prevent bias if more or fewer days occurred in each time usage-‐month determined by the meter-‐read dates. Treatment and comparison group sites were removed from analysis if any of the following criteria applied:
▬ Duplicate cases (duplicate site-‐ID, total kWh, and meter-‐read date) ▬ Fewer than 11 months of data were available in each year ▬ Total annual pre-‐ or post-‐consumption of less than 1,000 kWh; total annual pre-‐ or
post-‐consumption more than 50,000 kWh These criteria are commonly used in billing analyses and were selected to ensure sufficient data were available. This also helps to reduce the chances of including sites where significant changes occurred outside of weatherization that could affect energy consumption. After application of the above criteria, 216 participants remained in the analysis from the original population of 247 participants. The number of participants available for analysis in each individual year is further limited by the partitioning of the 216 screened participants by year weatherized and by requiring case level data match between the baseline and post year. These participants were used as the treatment group in this analysis.
♦ Comparison Group Selection Smith & Lehmann Consulting used a quasi-‐experimental research design, which consists of comparing the change in pre-‐ to post-‐energy consumption between participants and a comparison group of eligible nonparticipants, who are assumed to be eligible for the program but did not participate. The comparison group was required to have at least one energy assistance payment during the time window for the evaluation. By accounting for non-‐program related factors affecting energy use during the pre-‐ to the post-‐program periods, Smith & Lehmann Consulting can provide an estimate of “net” impacts of the program.
The comparison group population was matched to participant zip codes to ensure comparability of the housing stock and environmental conditions between both samples. The final nonparticipant comparison group consisted of a range from 482 to 587 participants, depending on the year. Average daily treatment group consumption was 40.1 kWh, and average daily

13 | P a g e
comparison group consumption was 37.9 kWh. Through this method and the proximity of these consumption estimates, we maximized comparability between the comparison group and the treatment group.
Once the screened treatment group of 216 participants and matching comparison groups were selected, accounts were matched back to billing data to obtain final, screened, monthly modeling billing data. Energy Savings Analysis Results The analytic approach used a CSA model. The final CSA regression model specification below was used to estimate energy savings from insulation measures:
ADC it = α + B1ANNUALPREi + B2POSTt + B3PARTPOSTit + B4CDDit + B5HDDit + εit Where for customer (i) and month (t):
• ADCit = average daily kWh consumption • ANNUALPREi= the total annual 2006 pre-‐ period kWh usage. • POSTt= indicator variable that is 1 in the post-‐ period for both the treatment and comparison groups, 0 otherwise.
• PARTPOSTit= indicator variable that is 1 in the post-‐ period for the treatment group, 0 otherwise. • HDDit = average daily heating degree-‐days (base 65) • CDDit = average daily cooling degree-‐days (base 65)
The key coefficient determining average program savings was B3. This coefficient represents the average daily savings per program participant, after accounting for nonparticipant trends. The inclusion of the ANNUALPRE variable was used to ensure level of energy use among participants and nonparticipants had no undue influence over the final savings estimate, resulting in a more robust model.
Table 8 summarizes overall adjusted gross kWh model savings results for the program. The table compares average, expected savings with the average per treatment group participant model savings to obtain an adjusted gross realization rate of 102% for the evaluation timeframe 2010-‐2012. The relative precision at the 90% confidence level for the total program savings estimate 2010-‐2012 was 13.6%.4
Results for individual program years are less stable due to the smaller number of cases in each year (relative precision is better for larger samples). The three year modeled estimate of savings is constructed by assigning each weatherization year’s pre-‐weatherization yearly energy use to a modelled base year and each weatherization year’s post year energy use to a common post year and running a
4 A common measure of model reliability is the relative precision of an estimate. In calculating relative precision of an estimate (B3 in the equation above) a normal distribution is assumed. Knowing the shape of the theoretical distribution of estimates permits us to use the appropriate z-‐value from the normal curve. For a 90% confidence interval, the z-‐value is 1.645. Relative precision is calculated by multiplying the z-‐value from the normal distribution by the standard error of the regression coefficient developed from the regression analysis and dividing by the value developed for the regression coefficient (here B3) from the regression analysis.

14 | P a g e
regression analysis on the total dataset. This result is reported with associated relative precision in Table 8. Table 8. Model Adjusted Net Savings and Realization Rate Summary (kWh/year) Program Year Reported Savings
per Participant Modeled Savings per Participant
Realization Rate Relative Precision at 90% Conf. Level
2010 1,659 2,179 131% 2011 2,286 2,332 102% 2012 2,214 2,135 96% Total (2010-‐2012) 2,147 2,189 102% 13.6%
Payments and Arrearages Monthly energy bills and payment histories were used to quantify the program impacts on payment patterns and customer arrearages. Changes between the pre-‐ and post-‐ periods were compared between the treatment and comparison groups to measure the net effects of the program. Methodology Rocky Mountain Power provided monthly payment data for the low-‐income customer sample from December 2008 to January 2014. The sample included all treatment group participants in addition to a nonparticipant, comparison pool that had been extracted from customers who had received energy assistance on their Rocky Mountain Power bills. Rocky Mountain Power payment datasets included the following information:
♦ Payment transaction date (monthly) ♦ Actual billed amount ♦ Actual paid amount ♦ Source of payment (direct customer payment, customer assistance payment, and collections
actions) ♦ Arrearage amount (customer’s monthly unpaid ending account balance)
In this analysis, two specific measurements were analyzed:5 1. The total payment amounts that individuals made during the pre-‐ and post-‐ periods. 2. The proportion of payments to the amount billed during the pre-‐ and post-‐ periods.
♦ Data Screening
To ensure a clean and reliable dataset, the evaluation team screened treatment and comparison group payment data. First, the comparison group population was matched to participant zip
5 Arrearage is also analyzed (in the section of the report following this one). Analysis of average number of payments per year was considered, however, since some low income customers make several small partial payments during parts of the year while others make regular payments in-‐full and still others come on and off the system, the interpretation of “number of payments” is ambiguous. So analysis is limited to dollars, which are a more direct indicator.

15 | P a g e
codes to ensure comparability of samples. The next step was to summarize the payment data and the total number of billing days for the pre-‐ and post-‐ periods for each account from 2009-‐2013. Pre-‐ and post-‐period payment information was summed on an annual basis. Treatment and comparison group sites were removed from the analysis if any of the following conditions applied:
- Removal of sites with more than 400 or less than 330 days in the pre-‐ and post-‐periods.
- Removal of sites with fewer than 11 bills or more than 13 bills in the pre-‐ and post-‐periods.
- Removal of sites where the total payment amount exceeded 150% of the billed amount in either the pre-‐ or post-‐period.
These criteria were employed to ensure sufficient data, and to reduce chances of including sites where extraneous changes affected payments. The joint application of these three screening rules also removed any remaining extreme values from the datasets. After applying the screening criteria, 92 treatment group participants and 221 comparison group participants remained from the original counts of 257 and 587, respectively, with some variation for specific calculations.
Payment Analysis Results Payment Amounts Table 9 shows the change in payment amounts from the pre-‐weatherization calendar year to the post-‐weatherization calendar year and summarizes data for weatherization years 2010, 2011 and 2012. The first three columns in the table report on the treatment homes and the second three columns report on the comparison homes. This model was constructed as if all weatherization took place in a single year. Results shown in this table can be characterized as follows:
♦ Participant bills in the treatment group are generally higher than bills for nonparticipants in the comparison group. The first row of Table 9 shows that treatment group bills are, on average, higher than comparison group bills in both the baseline year ($1441 for treatment group divided by $1111 for comparison group = 130%) and post-‐year ($1,518 for treatment group divided by $1,438 for comparison group = 106%). This is to be expected because one of the goals for the program is to serve high-‐energy-‐use homes, so agencies will generally tend to select homes that need weatherization and have installed electric heat more than other eligible homes.
♦ Bills increased more for the comparison group than for the treatment group. As shown in Table 9, bills went up for the treatment group by an average of $77 or about 5.3% and for the comparison by an average of $327 or about 29.2% for a net difference of $250 (first row, tenth

16 | P a g e
column).6 This means the average bill increase for the treatment group was $250 less than for the comparison group. This pattern is expected because for homes that have been weatherized, energy use is typically less responsive to changes in the weather and weatherization also serves as a general buffer for other bill increases because it reduces required energy use.
♦ Customer payments also increased, on average, for both treatment and comparison groups. The second row in Table 9 shows that customer payments went up for both groups. The treatment group paid, on average, $45 or about 3% more in the post-‐year than in the baseline year. The comparison group paid on average $366 more or 42%.7 Overall, the comparison group paid a net of $321 more than the treatment group (row two, column ten).
♦ Of course, as noted above, the average treatment group participant bill increase was $250 less than the average increase in comparison group bills. The other part of bill payment is external agency payment. For both the treatment and comparison groups, the amount of external agency payment declined (by $212 for treatment group and by $72 for comparison group, for a net difference of $140).
Putting these results together, both the treatment and comparison groups received higher bills in post-‐year than in the baseline year; both paid more; and both received lower external agency payments. In each of these comparisons, the treatment group typically did better than the comparison group. Overall, treatment group participant bills were reduced by a net of $250, which can be considered a benefit to the weatherization participant. Treatment group external agency payment assistance dropped by a net of $140, which can be assumed remains within general payment assistance funding available for other customers.
6 Bills and payments are only approximately related. They do not match exactly due to timing of meter reads and bill dates and the beginning and end of each year. In addition, shifting balances forward (arrearage) for many low income customers also means that bills and payments do not match. 7 The absolute size of large swings in bills and payments is likely due, in part, to the necessary data cleaning case exclusion rules for low income data analysis, which result in a smaller than desired number of comparison cases. It is reasonable to rely on the direction of the change, but the size is best considered an indicator that the size is large rather than taken as an exact numerical value. However, the math has been checked and is correct and the size of the swing in payment is consistent with the change in billing amount. With a much larger dataset, this size might remain the same or it might be damped down by inclusion of additional cases.

17 | P a g e
Table 9. Payment Amounts Summary 2010-‐2012 Payment Type
Treatment Group Comparison Group Net Difference
Pre-‐
Post-‐
Change
% Change
Pre-‐
Post-‐
Change
% Change
Amount
Total Billed Amount
$1,441 $1,518 $77 5.3% $1,111 $1,438 $327* 29.4% -‐$250*
Customer Payment
$1,522 $1,567 $45 2.9% $869 $1,235 $366* 42.1% -‐$321**
External Payment
$349 $137 -‐$212* -‐60.7% $270 $198 -‐$72* -‐26.7% -‐$140*
*Significant at the 0.001 level ** Significant at the 0.05 level Figure 1 below depicts the change in the yearly customer payments compared to the amount of external agency payment assistance between the pre-‐ and post-‐years for participants and nonparticipants. This figure is based on a three-‐year summary in which each year is calculated separately and results are then modeled in the form of a single year.
The values associated with the figure are provided in Table 9 above. The treatment group made 81% of the total annual payment amount in the pre-‐weatherization year and 92% of the total annual payment amount in the post-‐weatherization year. The comparison group paid about 76% of the total annual payment amount in the pre-‐weatherization year and about 86% in the post-‐weatherization year. This indicates that by participating in the program, clients are able to pay a larger portion of their annual payment amount.
$1,522 $1,567
$869 $1,235
$349 $137
$270
$198
$0 $200 $400 $600 $800
$1,000 $1,200 $1,400 $1,600 $1,800 $2,000
Dollar A
mou
nts
Groups in Pre-‐Weatherizahon and Post-‐Weatherizahon Years
Figure 1. Payment Summary 2010-‐2012
External Payments
Customer Payments
18 | P a g e
Change in Arrearages Arrearage is that portion of a customer’s bill they do not pay in a given month, or the unpaid ending balance. Table 10 shows the program impact on customer arrearage amounts. Table 10. Arrearage Summary 2010-‐2012 Treatment Group Annual Arrearage Comparison Group Annual
Arrearage Net
Difference
Pre-‐
Post-‐
Change %
Change
Pre-‐
Post-‐
Change %
Change
Change Total
Amount Paid
$37.47 $44.81 $7.34 19.6% $34.55 $64.60 $30.05 87%* -‐$22.71**
*Significant at the 0.001 level ** Significant at the 0.05 level The average customer arrearage represents their ending balance amount across the 12-‐month period. The arrearage value also takes into account the existing arrearage for each customer prior to the pre-‐ and post-‐ periods. Across all three years, the treatment group average monthly balance forward amount increased about 20% while the comparison group average monthly balance forward amount increased about 87%. The treatment group increase was not statistically significant, but the comparison group increase was statistically significant at the 0.001 level. The net difference between the two groups was a $22.71 decrease in the arrearage of participants versus nonparticipants, and this change was statistically significant at the 0.05 level. It is reasonable to take the $22.71 per treated home as a net payment benefit of the program.

19 | P a g e
ASSESSMENT OF NON-‐ENERGY BENEFITS Rocky Mountain Power’s Low-‐Income Weatherization program in Idaho has a mission to improve energy efficiency by reducing both the electricity requirements and increase the penetration of weatherization and electric efficiency measures in residential dwellings either owned or rented by qualifying low-‐income customers.
Energy saving improvements and installation are provided at no cost to the low-‐income households. USDOE and USDHHS fund and coordinate the federal government contribution to this program. This portion of the impact evaluation assesses non-‐energy impacts as additional inputs to calculating program cost-‐effectiveness. Current Idaho Public Utilities Commission (PUC) staff recommend that cost-‐effectiveness analyses include quantifiable, payment-‐related NEBs (e.g., reductions in utility arrearages and bad debt, and collection, disconnection, and reconnection expenses) when possible.8
NEBs of low-‐income programs are those benefits outside of energy savings that create positive change within the homes of participants. Additional NEBs accruing to Rocky Mountain Power include: reductions in external assistance payments and participant arrearages. The direct cost of health and safety repairs is also included as a NEB, and is quantified as a cost-‐offset to the program. Rocky Mountain Power internally tracks the cost-‐offset, and reported health & safety NEBs at $82,506 for the 2010-‐2012 program years based on program data. Smith & Lehmann Consulting relied on payment information for the assessment of NEBs. From the perspective of the average treatment group household, there is a meaningful drop in assistance payments the year after weatherization (Table 11). Treatment group external agency payment assistance dropped by a net of $140, which can be assumed remains within general payment assistance funding available for other customers. The evaluation team concludes it would be reasonable to accept the net drop in payment assistance as a payment benefit from this part of the analysis. Table 11. Payment Assistance Amounts Summary 2010-‐2012
External Payment
Treatment Group Comparison Group Net Difference
Pre-‐
Post-‐
Change
% Change
Pre-‐
Post-‐
Change
% Change
Amount
2010 $173 $87 -‐$86 -‐49.8% $256 $242 -‐$14* -‐5.6% -‐$172 2011 $484 $180 -‐$304* -‐62.8% $355 $149 -‐$206* -‐58.0% -‐$98 2012 $323 $110 -‐$213* -‐65.9% $232 $177 -‐$55** -‐23.7% -‐$158 Total $349 $137 -‐$212 -‐60.7% $270 $198 -‐$72 -‐26.7% -‐$140
*Significant at the 0.001 level ** Significant at the 0.044 level The average customer arrearage represents their ending balance amount across the 12-‐month period. The arrearage value also takes into account the existing arrearage for each customer prior to the pre-‐ 8 Idaho Public Utilities Commission Order No. 32788, State of Idaho, Case No. GNR-‐E-‐12-‐01, April 12, 2013.
20 | P a g e
and post-‐ periods. The net difference between the two groups was a $22.71 decrease in the arrearage of the treatment group versus the comparison group, and this change was statistically significant at the .05 level (Table 12). It is reasonable to take the $22.71 per treated home as a net payment benefit of the program. By combining these two variables, the evaluation team concludes a one-‐time per participant NEB of $162.71 be applied to the analysis of program cost-‐effectiveness. This will be in addition to the NEB attributed to health & safety repairs. Table 12. Arrearage Summary 2010-‐2012 Participants Annual Arrearage Nonparticipant Annual Arrearage Net
Difference
Pre-‐
Post-‐
Change %
Change
Pre-‐
Post-‐
Change %
Change
Change Total
Amount Paid
$37.47 $44.81 $7.34 19.6% $34.55 $64.60 $30.05 87%* -‐$22.71**
*Significant at the 0.001 level ** Significant at the 0.05 level

21 | P a g e
PROCESS EVALUATION Rocky Mountain Power’s contracts for weatherization services are held by two weatherization agencies: EICAP and SEICAA. Both agencies implement the program in Rocky Mountain Power’s service territory, with monitoring oversight from CAPAI.
CAPAI, EICAP, and SEICAA are the most important entities in this system because the two agencies directly deliver the weatherization services to residential low-‐income customers and CAPAI provides policy direction, administration, technical assistance, and quality control. CAPAI is also the link upwards through IDDHW to USDOE and USDHHS, which provide basic funding and guidance. From a utility perspective, coordination of utility support for low-‐income weatherization with WAP is a best practice because the substantial federal and state contributions are viewed as leverage.9 Idaho sets aside $10,000 of USDOE funding for leveraging, and typically $6,000 is disbursed to the two agencies while $4,000 is retained by CAPAI.
Agencies coordinate services by providing the weatherization specialists and crews to deliver the direct services. Each agency leverages funding from Rocky Mountain Power, USDOE, USDHHS, IDDHW, and other sources to achieve comprehensive weatherization of the homes of low-‐income customers.
Program Measures Rocky Mountain Power’s WAP focuses on the installation of electricity-‐saving and cost-‐effective measures, and is intended to maximize the efficient use of residential electricity by customers who meet income guidelines.10 Measures are categorized as either major or supplemental. Major measures are defined by the Rocky Mountain Power tariff to include ceiling insulation, wall insulation, floor insulation, and window replacement, applicable in dwellings with permanently installed operable electric space heating systems. Supplemental measures related to heating (e.g., attic ventilation and weather stripping) can only be installed in homes with an electric heating system. Additional measures targeting other electrical end uses and measures not related to heating can be installed in all homes.
Program Operations Agencies employ energy auditors to evaluate a home’s energy performance based on certain efficiency indicators. The auditor uses an energy audit software tool chosen from a list of USDOE approved software, identifying energy-‐saving opportunities and determining the energy-‐saving measures to install in each home. All agencies follow USDOE WAP guidelines for installation, which require measures to achieve a Savings-‐to-‐Investment Ratio (SIR) of 1.0 or greater when funded by USDOE or Rocky Mountain Power sources.
Auditors address the health and safety of the home, for example, by adjusting for proper ventilation (e.g., duct sealing and insulation repairs) and providing other necessary health and safety improvements
9 Coordinating utility and public program low-‐income weatherization program efforts can provide the most cost-‐effective low-‐income weatherization programs. Hill, Lawrence J. & Marilyn A. Brown, “Estimating the Cost Effectiveness of Coordinated DSM Programs.” Evaluation Review, Vol. 19, No. 2, April 1995, Pp. 181-‐196. 10 Rocky Mountain Power Electric Service Schedule No. 21, State of Idaho, Low Income Weatherization Services, June 1, 2013.

22 | P a g e
and by completing certain home repairs that are necessary to install the weatherization measures. In certain situations, such as failure of the heating system in winter weather, furnaces may be replaced on an emergency basis. Health, safety and repair work is simply a practical reality – a necessary activity when working with the low-‐income portion of the state housing stock. It extends the life of the housing stock and keeps homes habitable. This part of the work effort contributes to project costs but generally not directly to the energy savings goals of each weatherization project.11
After completing work on a home, the agencies submit invoices and documentation to Rocky Mountain Power directly and to USDOE through CAPAI. Rocky Mountain Power pays a rebate of 85% of the installed cost of all major measures and supplemental measures, as required by the Rocky Mountain Power Schedule 21. Rocky Mountain Power also pays a reimbursement for administrative costs based on 15% of Rocky Mountain Power’s rebate on installed measures. The annual Rocky Mountain Power funding cap was increased to $300,000 (from $150,000), as of December 28, 2010. Measures most frequently installed include: windows, insulation, furnace repair, and CFLs. Rocky Mountain Power reimbursements related to health and safety, which are frequently utilized in Idaho, are limited to 15% of the annual cost of total jobs performed by each agency. Methodology For the process evaluation, data collection consisted of telephone surveys of a sample of program participants, a telephone interview with the Executive Director of CAPAI, and telephone interviews with the Directors of both weatherization agencies.
♦ Client Survey For the treatment group surveys, Smith & Lehmann Consulting sampled Idaho residents who received WAP services for which Rocky Mountain Power provided full or partial payment. The purpose of this telephone survey was to obtain data documenting and aiding in measurement of customer satisfaction, verification of program services, and opinions on various program issues and perceived improvements.
♦ Sample Selection The evaluation team completed 59 participant telephone surveys in August 2014, achieving 9% precision and 90% confidence. The sample for client surveys was randomly obtained from homes with measures installed in the most recent program years, 2011 and 2012. The limitation to the two most recent years was taken to reduce recall concerns, thereby improving the reliability of the data. Sampling was completed with replacement.
Clients who received services in 2010 were expected to have greater recall bias than those who received services in 2011 and 2012. This recall bias is typically exacerbated among the elderly, who usually constitute at least one-‐third of low-‐income energy program recipients. There is a
11 In some cases, for example very old homes, the health and safety and repair costs may be too great, resulting in not treating a home (this is termed a “walkaway” or a “deferral”).

23 | P a g e
slight risk that the clients who received services in 2011 and 2012 will not be fully representative of the clients who received services in 2010. However, this risk is mitigated by the reduced recall bias when sampling is restricted to measures installed in 2011 and 2012.
♦ Stakeholder Interviews Stakeholder interviews were conducted to provide qualitative data documenting processes, funding sources, and issues related to Idaho’s WAP. These interviews addressed evaluation questions regarding program participation and wait listing. Program managers were selected from each of the following agencies, as well as with the Executive Director of CAPAI.
- EICAP - SEICAA
Process Evaluation Findings Client Survey The client survey achieved 59 completed participant surveys and one incomplete out of 102 clients reached, yielding a 58% cooperation rate. Table 13 reports the target and achieved survey samples as compared to the total population. Thirty-‐two respondents were not at home at the time the interviewer called or refused to participate. Two interviews could not be completed because the respondent was a Spanish-‐speaker. Out of the 227 phone numbers called, 45 were invalid, disconnected or the wrong number. This is typical due to the more transient nature of the low-‐income population, the general shift away from landline phones with a fixed phone number to cellular phones, and more frequent changes of phone numbers. For reference, the client survey protocol can be found in the Appendix of this report.
Smith & Lehmann Consulting initially exhausted the call list of 2012 clients, even after receiving updated phone numbers for some clients, and expanded the sample to include 2011 clients. Table 13. Target and Achieved Survey Samples for Idaho’s Participant Survey
Total 2012 & 2011 Population
Viable Population
Target Completes
Desired Precision at 90% Conf.
Achieved Completes
Achieved Precision at 90% Conf.
227 102 54 10% 59 9%
Survey response rates and cooperation rates were calculated according to the American Association for Public Opinion Research (AAPOR) standard definitions. For the purpose of this evaluation Smith & Lehmann Consulting calculated Response Rates (RR) following RR1 and RR2 AAPOR calculations12 (Figure 14). These response rates consider all customers attempted, whether or not they could be reached. RR1 12 American Association for Public Opinion Research provided calculations for Response Rates (RR1 and RR2) and Cooperation Rates (COOP1 and COOP2). The American Association for Public Opinion Research. 2011. Standard Definitions: Final Dispositions of Case Codes and Outcome Rates for Surveys. 7th edition. AAPOR. Pg. 44.
24 | P a g e
0% 10% 20% 30% 40% 50% 60% 70% 80% 90%
100%
2014
Figure 2. Program awareness -‐ How Rocky Mountain Power clients heard about the program
Family/friends/word-‐of-‐mouth
Don't know/don't remember
Through another energy assistance program Agency staff
Other
Wriuen materials at the agency
Rocky Mountain Power representavve
is the minimum response rate, while RR2 counts partial interviews as respondents. Cooperation Rates (COOP) represent the proportion of all cases interviewed based on all eligible customers who could be contacted. These are household-‐level cooperation rates based on all households that could be contacted.13 COOP1 is the minimum cooperation rate, while COOP2 counts partial interviews as respondents.
Table 14. AAPOR Response and Cooperation Rates
RR1 RR2 COOP1 COOP2 25.65% 26.09% 57.84% 58.82%
Program Awareness Interviewers asked participants how they heard about the program. A third of participants, or 20 out of 59 (34%) said that they heard about the program from family, friends, or word-‐of-‐mouth. Four participants indicated that they heard about the program directly from Rocky Mountain Power, either through a Rocky Mountain Power representative (2 participants) or from information on their electricity bill (2 participants). Figure 2 demonstrates that “other” (6 participants) was the fifth most common response to the question. For recording purposes, Smith & Lehmann Consulting asked interviewees to specify an “other” response. Participant responses ranged from Health and Welfare services to seeing information on TV. No “other” responses were duplicated among the six participants.
While 34% of participants heard about the program from family and friends, there was less awareness of the program’s funding source: 42% (25 out of 59) of participants had no knowledge of funding sources and 17% (10 out of 59) indicated they simply did not remember. Some participants responded with the agency that provided the services to their home (32% or 19 out of 59), but only two participants (3%) identified Rocky Mountain Power or the “power company” as the funding source.
13 These are good Cooperation Rates and probably reflect the extensive nature of the weatherization work performed in many of the weatherized homes.

25 | P a g e
Installation Verification Most participants verified that they received the services indicated in Rocky Mountain Power’s records (88% or 52 out of 59). Four participants indicated they did not receive light bulbs, new windows, and/or a new refrigerator; however, they did receive other weatherization services and phone interviews were continued. When a home has been weatherized, typically a particular individual will have conducted the primary interaction with the weatherization agency. This person may or may not have been available for the phone survey; however, considerable effort was made by Smith & Lehmann Consulting to screen participants for accuracy of responses and level of engagement in the program/survey. Measure Satisfaction Clients were asked about their satisfaction with the lighting in their home, their new windows, and/or their new refrigerator, depending on which measure or mix of measures they received. Figure 3 indicates that the majority of participants were more satisfied with their new refrigerators and/or new windows (100% or 3 out of 3 for refrigerators, 83% or 20 out of 24 for windows). There were slightly fewer clients who were more satisfied with their new lighting (42% or 20 out of 48), while another 42% (20 out of 48) clients said the lighting was about the same. For Figure 3, the color green indicates a positive result, red as negative, and light gray as neutral.
Light Bulbs Fifty-‐eight percent of participants indicated that agency staff installed light bulbs directly into their fixtures (29 out of 59). Fifteen participants (33%) said that they have replaced some of their light bulbs, averaging about three bulbs each. Of those who replaced light bulbs, seven participants (47%) reported installing new CFLs, six (40%) replaced the CFLs with traditional incandescent bulbs, one (7%) replaced with halogen light bulbs. The majority of participants who replaced bulbs indicated that they did so because the CFLs provided by the program burned out (80% or 12 out of 15 participants who replaced CFLs). This result is typical as most bulbs are eventually replaced when burned-‐out and not for other non-‐necessity reasons. Despite considerable efforts to minimize recall bias of participants, concerns
0%
10%
20%
30%
40%
50%
60%
70%
80%
90%
100%
Light bulbs Refrigerator Windows
Figure 3. Client Sahsfachon with Services
More savsfied
About the same
Less savsfied
Refused

26 | P a g e
remained within the evaluation team in regards to the accuracy of survey responses owing to the two year time gap between bulb installation and survey. Smith & Lehmann Consulting was unable to verify whether the bulbs that failed were those installed by the agencies. Bulb failures could be due to a quality problem with the bulbs supplied by the agencies or they could have been bulbs purchased and installed by the client. Participants were also asked whether they have purchased and installed any additional energy-‐efficient light bulbs after receiving the CFLs from the agency. Under half (41% or 19 out of 46) indicated that they did purchase and install additional light bulbs. Fourteen of these participants indicated that they purchased CFLs (74%) while three (16%) purchased incandescent and two (11%) purchased halogen light bulbs. This may indicate a change in behavior due to exposure and education of the program. However, more research on customer behavior would be needed to confidently report a significant change. Refrigerators Clients were asked about their satisfaction with their new refrigerator. Only three of the sampled clients received this measure and all three were more satisfied with their new refrigerator. Shell Measures: Windows and Insulation Twenty-‐three participants (39%) verified that they had work done to the windows in their home. Most participants either had only one window replaced or had most/all of the windows in their home replaced (61% or 14 out of 23). Insulation was installed for 18 of the 23 clients (78%) who received windows. The insulation was most commonly installed in the ceiling (33% or 6 out of 18), the floor (22% or 4 out of 18), or other areas of the home such as the attic, around the windows, and around the duct-‐work (22% or 4 out of 18). Energy Information After weatherization was completed, 52 participants (88%) voluntarily indicated that they noticed changes in their home. A majority (79%) reported improved comfort (i.e. cooler in the summer, warmer in the winter) (Figure 4). Fifteen participants (29%) indicated their electric bill is more affordable after the completion of weatherization. Five respondents (10%) gave interviewers other responses, mostly commenting about the performance of their windows and that their home was quieter due to new windows. Again, green in Figure 4 indicates a positive result, red as negative and light gray as neutral.

27 | P a g e
Participants were asked their opinions on energy usage and efficiency. When asked whether it was important or unimportant to save energy by reducing usage in the home, 88% of participants believed it was very important to save energy. Additionally, most participants (80%) strongly agreed that most people have things that could be done to improve the energy efficiency of their home. Program Delivery and Satisfaction Almost all clients (95%) would recommend the weatherization program to friends and family with three participants (5%) not recommending the program at all. Seventeen clients (29%) believed that there could be improvements to the program. Most of these participants indicated increasing funding (7 out of 17) as a crucial program improvement, in addition to providing more free services (4 out of 17), and improving the amount of time it took to receive services (3 out of 17) (Figure 5).
0 5 10 15 20 25 30 35 40 45
Comfort worse
Air quality improved
Appearance worse
Energy bill higher
Appearance improved
Other
Energy bill lower
Comfort improved
# of respondents
Figure 4. Self-‐reported changes in clients' homes aler weatherizahon measures completed
0 1 2 3 4 5 6 7 8
Professionalism of the installers
Other
Product quality
Wait vme for service
More services (free stuff) provided per home
Increase funding
# of respondents
Figure 5. Customer suggested program improvements

28 | P a g e
Stakeholder and Agency Interviews Representatives from both Idaho agencies were interviewed for the evaluation. The two agency interviews followed a common protocol, while the interview with the Executive Director of CAPAI followed a similar, yet shortened, pattern of questions. The agency interview protocol can be found in the Appendix. Interviews addressed the following topics, but allowed for conversation to flow in different directions when other subjects of interest arose.
♦ Program Consistency All agency administrators agreed the program’s primary goals are to save energy and help reduce participants’ utility bills. Due to the regulatory structure in Idaho, all agencies operate under supervision from CAPAI, which is the agency responsible for contract compliance, training, and technical assistance. CAPAI reports directly to IDDHW, serving as the link between the State and the weatherization agencies. This structure is meant to streamline processes and align agency practices across the State.
For example, CAPAI is currently working with the State of Idaho to develop a new statewide database that will provide a completely paperless system for reporting of all assistance programs (e.g., Emergency Food Services, Community Block Grant, LIHEAP, and WAPs). This system will streamline processing and is expected to be operable by summer 2015. The reporting system will track important participant information on specific quantities of measures installed, but also on household income and demographic information that can be used in future studies to better assess the program’s target population.
♦ Link Between WAP and LIHEAP Both Idaho agencies are partnering with LIHEAP, administered by CAPAI to bring in clients and streamline their qualification process.14 All Idaho weatherization clients are deemed eligible by first being screened through LIHEAP income eligibility guidelines, which are set at 150% of Federal Poverty Level (FPL). As a precaution, Idaho increased the income guidelines for LIHEAP (funded by USDHHS) to 150% to expand access to services in general, and to align the partnership between the two program operations. Rocky Mountain Power’s Schedule 21 also defines income eligibility based on 150% of federal poverty guidelines.
Using LIHEAP qualification as proof of eligibility reduces program costs considerably and allows for easier access to the program, as participants can qualify for multiple services under LIHEAP qualification processes.
♦ Impact and Adequacy of Rocky Mountain Power Funding Agencies reported that Rocky Mountain Power funding supplemented the other funding sources and allowed for more homes to be weatherized per year. Typically EICAP receives $200,000 and
14 Low Income Home Energy Assistance Program (LIHEAP) http://www.idahocommunityaction.org/programs/ programsenergyassistance/

29 | P a g e
SEICAA receives $100,000 of Rocky Mountain Power funding each program year, which runs from April 1st through March 31st. An increase in the cap occurred on January 2011, when it was increased from $150,000 to $300,000 per year.
♦ Impact of American Recovery and Reinvestment Act An enormous effort was made in Idaho to properly plan and ramp-‐up processes for American Recovery and Reinvestment Act (ARRA) funding that inflated the program from 2010-‐2011. Planning meetings began during spring 2009; CAPAI pulled the “network” of agencies together (representation from each agency was at every planning meeting) in a collaborative effort where the goal of successfully completing ARRA was going to include the success of each agency. The Executive Director of CAPAI mentioned “stressing the fact that they needed to produce units and always encouraged agency managers to hire the people they needed.” Additional training dollars helped push the message that staff hired under ARRA would be trained and able to transfer those skills to another job/location. CAPAI also used ARRA funding as an opportunity to take a deeper look into project management and understand the strengths and weaknesses in Idaho’s network of agencies. Idaho was second in the nation to complete ARRA funding, and was awarded additional Sustainable Energy Resources for Consumers (SERC) funding to include innovative measures and aid in ramping-‐down from the inflated economic stimulus funding provided by the federal government in response to the Great Recession.15
♦ Provision of Energy Education CAPAI developed a client energy education curriculum that was distributed to both WAP agencies. From there, it was given to LIHEAP managers in the energy assistance offices to distribute to participants who apply for the program. The Energy Assistance Program distributed Energy Kits to Rocky Mountain Power clients, which included CFLs, a kitchen aerator, outlet gaskets, a night-‐light and a refrigerator temperature card as well as educational information on energy saving tips.
♦ Prioritization and Wait-‐Listing All agencies are following a priority list that is set by the State to follow USDOE guidelines. Points are assigned to weatherization participants in typical need-‐base categories such as elderly, disabled, and presence of children in the home. CAPAI is undergoing a review process to update State prioritization policy to account for fuel type and participant energy burden percentage. The updated priority guidelines are currently under review and are expected to be in place for the 2015 program year.
It is standard practice to place customers on the wait-‐list as soon as they become eligible. All Idaho agencies manage individual wait-‐lists, and set their own timeline for updating applicant
15 American Recovery and Reinvestment Act (ARRA). Grants – Award Summary. http://www.recovery.gov/arra/Transparency/ RecipientReportedData/pages/recipientprojectsummary508.aspx?AwardIDSUR=43616&vendorstart=23

30 | P a g e
priority among the participants on the wait-‐list. SEICAA maintains a separate wait-‐list for electric and gas-‐heated homes; however, neither list is updated regularly. SEICAA’s wait-‐list for electric customers is typically around 200 participants, while the gas-‐heated wait-‐list is currently around 450 participants. Participants are only removed if they update their application or if they are contacted for weatherization and do not respond after multiple attempts by SEICAA to initiate the process. EICAP maintains a single weatherization wait-‐list of both gas and electric applicants, which is updated as needed (e.g., typical update would be if a home turns into an emergency case, priority typically does not change) and typically has around 400 homes on its wait-‐list. Due to the large volume of potential participants on the different wait-‐lists, EICAP reports a timeframe of three years to weatherize all the homes on the wait-‐list. The Director of SEICAA indicated at current funding and production levels (approximately 120 homes per year), it would take six or seven years to weatherize all the homes on the wait-‐list. However, since agencies compile all weatherization participants into large waitlists, it is difficult to determine the relative wait times for service experienced by Rocky Mountain Power customers, specifically. Many of the participants with lower priority status are no longer living at the residence once their name makes it to the top of the list. Smith & Lehmann Consulting recommends that agency’s wait-‐lists be updated semi-‐annually to remove past-‐dated applicants, and that wait-‐lists be made accessible to LIHEAP managers to better inform the participant during the application process of their respective wait-‐time for weatherization services. When possible, Smith & Lehmann Consulting also recommends agencies separate their wait-‐lists by gas and electric (as done by SEICAA) and by service provider.
♦ Refrigerator Replacement Guidelines Both agencies operate under DOE guidelines for refrigerator replacement.16 Refrigerator model numbers are input into a program that compares the usage of the old refrigerator with the expected usage of the new one to determine if a replacement is cost-‐effective, or carries a SIR ratio greater than 1. Agencies can also monitor actual energy consumption by refrigerator units, as an alternative way to determine need for replacement. In this case, every refrigerator is tested for a minimum of 72 hours, and results are entered into the audit software to determine the SIR ratio. The recycling process is typically contracted in the price of the new refrigerator. SEICAA does not report any difficulties or issues working with the contractor. Motivated by security and health concerns, Idaho now requires a formal background check for anyone associated with the program who enters a home. While this has not been a problem for
16 United States Department of Energy (USDOE). Residential Refrigerators and Freezers. http://www1.eere.energy.gov/ buildings/appliance_standards/product.aspx/productid/43

31 | P a g e
other measures, the new security and health documentation required for contractors has become a barrier to replacement of refrigerators. EICAP has reported being unable to find a contractor in the area who is willing to go through the rigorous background check. SEICAA indicates that while they have found one contractor with the capacity to replace refrigerators, they have only been replacing an average of ten per year. This indicates this barrier is only affecting a small number of participants.
♦ Invoicing and Payments In order to receive payments, Idaho agencies submit monthly invoices directly to Rocky Mountain Power. Agencies receive payments from Rocky Mountain Power based on their monthly invoices. Neither agency reports any issues in receiving payments from Rocky Mountain Power. CAPAI is not involved with the invoicing or payment process.
♦ Reporting and Monitoring Agency reporting occurs in conjunction with invoicing. Agencies are required to submit a one-‐page addendum to Rocky Mountain Power for each completed home. Agencies submit a cover invoice along with the addenda for each completed home, which includes:
- Customer name and address (and owner’s name and address in case of rental) - Account number - Home occupant (owner versus renter) - Dwelling type (single-‐family, multifamily, manufactured home) - Measures installed - Material, labor, and total cost per measure - Rocky Mountain Power rebate for each measure - Agency administrative fee billed to Rocky Mountain Power - Total reimbursement requested - kWh savings estimated for total job - Total cost of all measures.
CAPAI compiles agency reports and submits them to IDDHW. As the grantee for federal funding, IDDHW reviews and submits the reports prepared by CAPAI. These reports are submitted quarterly for USDOE and annually for LIHEAP. Reports submitted to USDOE include the following:
- Number of completions - Number of leveraged units - British Thermal Units (BTUs) saved - Housing types - Occupancy status (owner/renter) - Household and individual demographics

32 | P a g e
The State of Idaho’s quality control process requires 100% of completed units must be inspected at the agency level. The State also requires 5% of completed units plus one unit of completed complex units be reviewed annually for compliance by CAPAI and Department staff, regardless of federal funding source. Additional federal reporting was required with ARRA funding and CAPAI hired additional staff to handle increased reporting requirements. New regulations, after federal assessment of ARRA, will require all homes weatherized after July 1, 2015 to be inspected by a Quality Control Specialist.
♦ Program Achievements and Lessons Learned Both CAPAI and the agencies noted that successful completion of ARRA, and the award of additional SERC funding, was the greatest challenge and achievement experienced over the 2010-‐2012 program years. Both agencies reported that while production of weatherized homes doubled, the program continued to operate smoothly from 2010-‐2012. The most notable change during the evaluation period was the closeout of ARRA support. Due to the decrease in funding levels, beginning in fiscal year 2011, agencies were forced to lay off many of the staff hired to handle the increased capacity brought about by temporary ARRA funding. CAPAI reported that many of the workers who were laid off were hired by weatherization programs in other states. Despite management challenges, the weatherization program in Idaho continues to serve a large number of homes, while improving its process, outreach, and operations.
Process Evaluation Conclusions
♦ Rocky Mountain Power’s decision to coordinate its weatherization efforts with Idaho’s subgrantee agencies provides leverage to each utility dollar and should be continued. Coordination with the Idaho WAP is a best practice.
♦ Aligning WAP with LIHEAP The partnership between LIHEAP payment assistance and WAP is beneficial to both programs: LIHEAP certification streamlines the application process and WAP helps clients to decrease their energy burden by weatherizing their home. This decreases not only the energy burden to the client but also the burden placed on LIHEAP to help the client over future heating seasons.
Process Evaluation Recommendations
♦ Client Surveys
Results of the client survey suggested a possible CFL burnout issue. However, the gap of two years between measure installation and client survey has made it impossible to verify whether clients are referring to Rocky Mountain Power bulbs or services. In the future, conducting surveys within six months of weatherization services will enable Rocky Mountain Power to confidently determine whether services and products meet the utility’s standards and to proactively respond to any client concerns that may be identified.

33 | P a g e
♦ CFL-‐Procurement Client survey results indicated a small number of CFLs were replaced by program participants. Of the 15 participants who replaced bulbs (an average of three CFLs per household, or 45 bulbs out of a total of 368 CFLs received by the 46 survey respondents), most reported replacement because the bulbs had burned out. This suggests a possible burn out problem; however, owing to the two-‐year time lapse, we cannot verify that bulbs replaced were those purchased separately by the client or provided by the agencies. If future client surveys confirm bulb burnout as a problem, Rocky Mountain Power should collaborate with local agencies to assess whether procurement specifications should be revised to exceed Energy Star certification as Energy Star certification only ensures a minimum standard for energy savings.
♦ Rocky Mountain Power Recognition Client survey results indicate 3% of participants remember or recognize that Rocky Mountain Power contributed to the weatherization work they received. Rocky Mountain Power should consider whether it is important that customers recognize Rocky Mountain Power’s contribution to the weatherization services received. If so, Rocky Mountain Power should consider providing a branded item concurrently with weatherization services to increase customer recognition.
♦ Client Wait-‐Lists Smith & Lehmann Consulting recommends that agency’s wait-‐lists be updated semi-‐annually to remove past-‐dated applicants, and that wait-‐lists be made accessible to LIHEAP managers to better inform the participant during the application process of their respective wait-‐time for weatherization services. When possible, Smith & Lehmann Consulting also recommends agencies separate their wait-‐lists by gas and electric (as done by SEICAA) and by service provider.

34 | P a g e
COST EFFECTIVENESS ANALYSIS The impact evaluation produced the energy impacts and inputs used to calculate program cost-‐effectiveness.
Cost-‐effectiveness was assessed using five different approaches. Smith & Lehmann Consulting provided inputs to the cost-‐effectiveness calculations to Cadmus, who performed the calculations of the Benefit/Cost Ratio and Levelized Cost for each of the program years and for the total evaluation period.
Cost Tests Cost-‐Benefit analysis was conducted by Cadmus using the five specified tests: PacifiCorp Total Resource Cost (PTRC) test, Total Resource Cost (TRC) test, Utility Cost Test (UCT), Ratepayer Impact Measure (RIM), and the Participant Cost Test (PCT). The inputs were provided by Smith & Lehmann Consulting to evaluate cost-‐effectiveness. Cost-‐effectiveness perspectives of the five tests include:
♦ PTRC: This test incorporates program costs and benefits from the perspectives of both Rocky Mountain Power and Rocky Mountain Power customers combined. Benefit measures include the present value of avoided energy, capacity costs, and line losses, plus a 10% adder to represent non-‐qualified benefits. Cost measures include both the costs to the participant and the utility. Cost-‐effectiveness analyses also included quantifiable, payment-‐related NEBs (i.e., reductions in utility arrearages and external agency assistance payments).17
♦ TRC: This test approaches program costs and benefits from the perspectives of both Rocky
Mountain Power and Rocky Mountain Power customers combined. Benefit measures include the present value of avoided energy, capacity costs, and line losses. Cost measures include both the costs to the participant and the utility. In this case, the cost to the participant is zero. Utility costs are all program costs including all administration, implementation, and incentive costs associated with funding the program.
♦ UCT: This test approaches costs and benefits from Rocky Mountain Power’s perspective.
Benefits included avoided energy and capacity costs as well as line losses. Costs included all administration, implementation, and incentives costs associated with funding the program.
♦ RIM: This test measures what happens to customer bills or rates due to changes in utility
revenues and operating costs caused by the program. Rates or bills will go up to cover lost revenues. This test indicates the direction and magnitude of the expected change in customer
17 Idaho Public Utilities Commission Order No. 32788, State of Idaho, Case No. GNR-‐E-‐12-‐01, April 12, 2013.

35 | P a g e
bills or rate levels. Benefits include all avoided energy and capacity costs, as well as line losses. Costs included all Rocky Mountain Power program costs as well as lost revenues.
♦ PCT: This test approaches costs and benefits from the participants perspective. In this case, the cost to the participant is zero. While benefits would include bill reductions, the result of the test would be undefined due to zero costs. Therefore, the result of PCT was determined “Not Applicable.”
Table 15. Benefits and Costs Included in Various Tests Test Benefits Costs
PTRC Present value of avoided energy and capacity costs with 10% adder for non-‐quantified benefits plus selected NEBs as specified in Idaho PUC Order No. 32788, State of Idaho.
Program costs including administration and marketing
TRC Present value of avoided energy and capacity costs
Program costs including administration and marketing
UCT Present value of avoided energy and capacity costs
Program costs including administration and marketing; and incentive costs
RIM Present value of avoided energy and capacity costs
Program costs including administration and marketing; plus the present value of lost revenues
PCT Present value of bill savings Participant share of measure costs (zero)
Note 1: The present value of avoided energy and capacity costs includes avoided line losses from reduced energy use by program participants. Note 2: Federal and State coordinated contributions to project costs are treated as external to the calculation. Note 3: Any avoided capital and/or operating cost resulting from measures are included as a participant benefit. Assumptions and Results Cost-‐effectiveness for 2010 was tested using the 2008 IRP 46% east residential whole house load factor decrement, and the 2011 IRP 35% east residential whole house load factor decrement was used for 2011 and 2012. Tables 16 and 17 include a breakdown of the agency and utility costs, as well as the discount rate, line loss, inflation rate, and residential energy rate. Table 18 lists the annual energy savings for each program year, and Table 19 provides an estimate of the dollar amounts included in the assessment of NEBs. The discount rate was provided by Rocky Mountain Power as reported in Idaho Annual Reports for each of the program years: 2010, 2011, and 2012. The Annual Reports also provided the line losses and program costs.
Table 16. ID Low-‐Income Weatherization Financial Inputs
Parameter 2010 Value 2011 Value 2012 Value Discount Rate 7.40% 7.17% 7.17% Residential Line Loss 9.96% 9.96% 11.47% Residential Energy Rate ($/kWh) $0.0848 $0.0848 $0.1007
Inflation Rate 2.50% 1.80% 1.80%
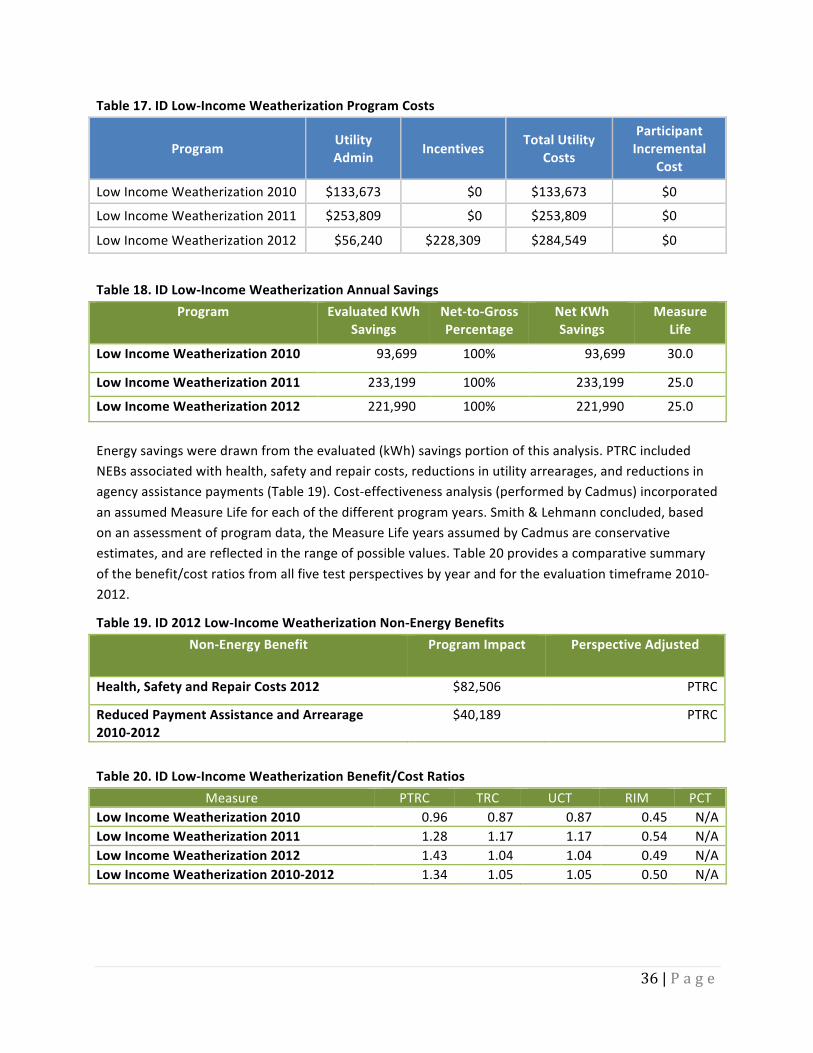
36 | P a g e
Table 17. ID Low-‐Income Weatherization Program Costs
Program Utility Admin Incentives Total Utility
Costs
Participant Incremental
Cost
Low Income Weatherization 2010 $133,673 $0 $133,673 $0
Low Income Weatherization 2011 $253,809 $0 $253,809 $0
Low Income Weatherization 2012 $56,240 $228,309 $284,549 $0
Table 18. ID Low-‐Income Weatherization Annual Savings
Program Evaluated KWh Savings
Net-‐to-‐Gross Percentage
Net KWh Savings
Measure Life
Low Income Weatherization 2010 93,699 100% 93,699 30.0
Low Income Weatherization 2011 233,199 100% 233,199 25.0
Low Income Weatherization 2012 221,990 100% 221,990 25.0
Energy savings were drawn from the evaluated (kWh) savings portion of this analysis. PTRC included NEBs associated with health, safety and repair costs, reductions in utility arrearages, and reductions in agency assistance payments (Table 19). Cost-‐effectiveness analysis (performed by Cadmus) incorporated an assumed Measure Life for each of the different program years. Smith & Lehmann concluded, based on an assessment of program data, the Measure Life years assumed by Cadmus are conservative estimates, and are reflected in the range of possible values. Table 20 provides a comparative summary of the benefit/cost ratios from all five test perspectives by year and for the evaluation timeframe 2010-‐2012.
Table 19. ID 2012 Low-‐Income Weatherization Non-‐Energy Benefits Non-‐Energy Benefit Program Impact Perspective Adjusted
Health, Safety and Repair Costs 2012 $82,506 PTRC
Reduced Payment Assistance and Arrearage 2010-‐2012
$40,189 PTRC
Table 20. ID Low-‐Income Weatherization Benefit/Cost Ratios Measure PTRC TRC UCT RIM PCT
Low Income Weatherization 2010 0.96 0.87 0.87 0.45 N/A Low Income Weatherization 2011 1.28 1.17 1.17 0.54 N/A Low Income Weatherization 2012 1.43 1.04 1.04 0.49 N/A Low Income Weatherization 2010-‐2012 1.34 1.05 1.05 0.50 N/A

37 | P a g e
Cost-‐Effectiveness Results Tables 21-‐24 present the results of the program cost-‐effectiveness tests for each of the program years, and for the evaluation period 2010-‐2012. PTRC includes a 10% conservation adder, as well as selected payment-‐related NEBs (i.e., reductions in utility arrearages and external agency assistance payments).18 The 2010 program is not cost-‐effective from any perspective. The 2011 and 2012 programs, as well as the overall 2010-‐2012 portfolio, are cost-‐effective from all test perspectives except RIM.
Table 21. 2010-‐2012 Low-‐Income Weatherization – Cost-‐Effectiveness including Non-‐Energy Benefits Cost-‐Effectiveness Test Levelized
$/kWh Costs* Benefits* Net Benefits Benefit/Cost
Ratio** PacifiCorp Total Resource Cost Test (PTRC)
$0.087 $618,249 $826,357 $208,109 1.34
Total Resource Cost Test (TRC) No Adder
$0.087 $618,249 $649,393 $31,145 1.05
Utility Cost Test (UCT) $0.087 $618,249 $649,393 $31,145 1.05 Rate Impact Test (RIM) $1,297,349 $649,393 ($647,956) 0.50 Participant Cost Test (PCT) $0 $877,882 $877,882 N/A Discounted Participant Payback (years)
N/A
Lifecycle Revenue Impact ($/KWh)
$0.00001323
*Smith & Lehmann Consulting provided evaluated costs and benefits necessary to calculating cost-‐effectiveness **Cadmus is responsible for results of the cost-‐effectiveness summary
Table 22. 2010 Low-‐Income Weatherization – Cost-‐Effectiveness including Non-‐Energy Benefits Cost-‐Effectiveness Test Levelized
$/kWh Costs* Benefits* Net Benefits Benefit/Cost
Ratio** PacifiCorp Total Resource Cost Test (PTRC)
$0.101 $133,672 $128,159 ($5,513) 0.96
Total Resource Cost Test (TRC) No Adder
$0.101 $133,672 $116,508 ($17,164) 0.87
Utility Cost Test (UCT) $0.101 $133,672 $116,508 ($17,164) 0.87 Rate Impact Test (RIM) $260,596 $116,508 ($144,088) 0.45 Participant Cost Test (PCT) $0 $126,924 $126,924 N/A Discounted Participant Payback (years)
N/A
Lifecycle Revenue Impact ($/KWh)
$0.00000294
*Smith & Lehmann Consulting provided evaluated costs and benefits necessary to calculating cost-‐effectiveness **Cadmus is responsible for results of the cost-‐effectiveness summary
18 Idaho Public Utilities Commission Order No. 32788, State of Idaho, Case No. GNR-‐E-‐12-‐01, April 12, 2013.
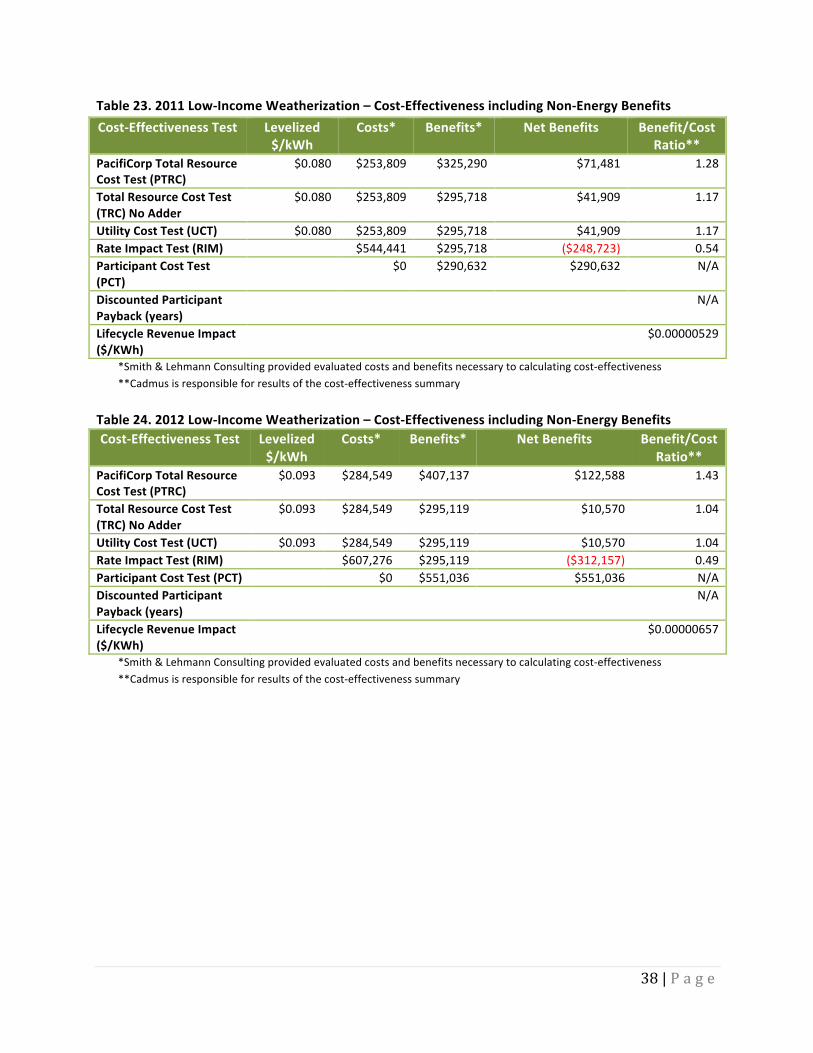
38 | P a g e
Table 23. 2011 Low-‐Income Weatherization – Cost-‐Effectiveness including Non-‐Energy Benefits Cost-‐Effectiveness Test Levelized
$/kWh Costs* Benefits* Net Benefits Benefit/Cost
Ratio** PacifiCorp Total Resource Cost Test (PTRC)
$0.080 $253,809 $325,290 $71,481 1.28
Total Resource Cost Test (TRC) No Adder
$0.080 $253,809 $295,718 $41,909 1.17
Utility Cost Test (UCT) $0.080 $253,809 $295,718 $41,909 1.17 Rate Impact Test (RIM) $544,441 $295,718 ($248,723) 0.54 Participant Cost Test (PCT)
$0 $290,632 $290,632 N/A
Discounted Participant Payback (years)
N/A
Lifecycle Revenue Impact ($/KWh)
$0.00000529
*Smith & Lehmann Consulting provided evaluated costs and benefits necessary to calculating cost-‐effectiveness **Cadmus is responsible for results of the cost-‐effectiveness summary
Table 24. 2012 Low-‐Income Weatherization – Cost-‐Effectiveness including Non-‐Energy Benefits Cost-‐Effectiveness Test Levelized
$/kWh Costs* Benefits* Net Benefits Benefit/Cost
Ratio** PacifiCorp Total Resource Cost Test (PTRC)
$0.093 $284,549 $407,137 $122,588 1.43
Total Resource Cost Test (TRC) No Adder
$0.093 $284,549 $295,119 $10,570 1.04
Utility Cost Test (UCT) $0.093 $284,549 $295,119 $10,570 1.04 Rate Impact Test (RIM) $607,276 $295,119 ($312,157) 0.49 Participant Cost Test (PCT) $0 $551,036 $551,036 N/A Discounted Participant Payback (years)
N/A
Lifecycle Revenue Impact ($/KWh)
$0.00000657
*Smith & Lehmann Consulting provided evaluated costs and benefits necessary to calculating cost-‐effectiveness **Cadmus is responsible for results of the cost-‐effectiveness summary

39 | P a g e
CONCLUSIONS This evaluation demonstrates that Rocky Mountain Power’s coordination of its weatherization efforts with the Idaho agencies and with USDOE and USDHHS is cost effective on all perspectives for the evaluation period except RIM test. RIM test result is not unusual since RIM test normally shows a less than cost effective result for energy saving programs. Coordination of this kind is a utility best practice because it provides significant leverage for every utility dollar. Both Idaho agencies are partnering with LIHEAP to bring in clients and streamline their qualification process.19 All Idaho weatherization clients are deemed eligible by first being screened through LIHEAP income eligibility guidelines, which are set at 150% of FPL. As a precaution, Idaho increased the income guidelines for LIHEAP (funded by USDHHS) to 150% to expand access to services in general, and to align the partnership between the two program operations. Rocky Mountain Power’s Schedule 21 also defines income eligibility based on 150% of federal poverty guidelines. The partnership between LIHEAP payment assistance and WAP is beneficial to both programs: LIHEAP certification streamlines the application process and WAP helps clients to decrease their energy burden by weatherizing their home. This decreases not only the energy burden to the client but also the burden placed on LIHEAP to help the client over future heating seasons. Overall, this evaluation demonstrates that the program is operating as planned within the design parameters outlined in Rocky Mountain Power Electric Service Schedule No. 21, State of Idaho.
RECOMMENDATIONS ♦ Accurate recall by weatherization recipients in answering survey questions is a concern.
Participants were required to remember services they received more than two years prior to completing the survey. The long lag time between measure installation and participant feedback raises concerns regarding the reliability of responses to the client survey. Smith & Lehmann Consulting recommends Rocky Mountain Power conduct client surveys annually or semi-‐annually. Rocky Mountain Power will maximize survey reliability and minimize recall concerns by conducting surveys between three and eight months following weatherization installation.
♦ Client survey results indicated a small number of CFLs were replaced by program participants. Of the 15 participants who replaced bulbs (an average of three CFLs per household, or 45 bulbs out of a total of 368 CFLs received by the 46 survey respondents), most reported replacement because the bulbs had burned out. This suggests a possible burn out problem; however, owing to the two-‐year time lapse, we cannot verify that bulbs replaced were those purchased separately by the client or provided by the agencies. If future client surveys confirm bulb burnout as a problem, Rocky Mountain Power should collaborate with local agencies to assess
19 Low Income Home Energy Assistance Program (LIHEAP) http://www.idahocommunityaction.org/programs/ programsenergyassistance/

40 | P a g e
whether procurement specifications should be revised to exceed Energy Star certification as Energy Star certification only ensures a minimum standard for energy savings.
♦ Rocky Mountain Power should consider whether it is important that customers recognize Rocky Mountain Power’s contribution to the funding of coordinated weatherization services. If so, Rocky Mountain Power may want to distribute a small branded item in conjunction with weatherization services to increase branding.
♦ Smith & Lehmann Consulting recommends that agency’s wait-‐lists be updated semi-‐annually to
remove past-‐dated applicants, and that wait-‐lists be made accessible to LIHEAP managers to better inform the participant during the application process of their respective wait-‐time for weatherization services. When possible, Smith & Lehmann Consulting also recommends agencies separate their wait-‐lists by gas and electric (as done by SEICAA) and by service provider.

41 | P a g e
REFERENCES ♦ The American Association for Public Opinion Research. 2011. Standard Definitions: Final
Dispositions of Case Codes and Outcome Rates for Surveys. 7th edition. AAPOR. Pg. 44. ♦ American Recovery and Reinvestment Act (ARRA). Grants – Award Summary.
http://www.recovery.gov/arra/Transparency/RecipientReportedData/pages/recipientprojectsummary508.aspx?AwardIDSUR=43616&vendorstart=23
♦ The Cadmus Group, Inc., Energy Services. April 20, 2011. Idaho Low-‐Income Weatherization Program Evaluation (2007-‐2009). Prepared for PacifiCorp, pg. 1.
♦ Hill, Lawrence J. & Marilyn A. Brown, “Estimating the Cost Effectiveness of Coordinated DSM Programs.” Evaluation Review, Vol. 19, No. 2, April 1995, Pp. 181-‐196.
♦ Low Income Home Energy Assistance Program (LIHEAP) http://www.idahocommunityaction.org/programs/programsenergyassistance/
♦ PacifiCorp’s 2011 Integrated Resources Plan Vol. I: page 156 ♦ Rocky Mountain Power Annual Report. 2010. 2010 Annual Energy Efficiency and Peak Reduction
Report-‐ Idaho. Available at: http://www.pacificorp.com/content/dam/pacificorp/doc/Energy_Sources/Demand_Side_Management/ID_DSM_Report_2010.pdf
♦ Rocky Mountain Power Electric Service Schedule No. 21, State of Idaho, Low Income Weatherization Services, June 1, 2013.
♦ Idaho Public Utilities Commission Order No. 32788, State of Idaho, Case No. GNR-‐E-‐12-‐01, April 12, 2013.
♦ United States Department of Energy (USDOE). Residential Refrigerators and Freezers. http://www1.eere.energy.gov/buildings/appliance_standards/product.aspx/productid/43

42 | P a g e
APPENDIX
Interview Protocols
Client Survey
Participants: Idaho residents who received Weatherization Assistance Program (WAP) services for which Rocky Mountain Power provided full or partial payment. Purpose: To provide qualitative data documenting and aiding in measurement of cost-‐effectiveness, customer satisfaction, verification of program services, and opinions on various program issues and perceived improvements.
Introductory Protocol Hello, my name is [FIRST AND LAST NAME] from Smith & Lehmann Consulting and I am calling on behalf of Rocky Mountain Power. We are talking with people who received energy-‐saving services from (The Agency) over the past few years.
Agency Selection: [It will be indicated which agency the participant applied through] o Eastern Idaho Community Action Partnership (EICAP), Idaho Falls (Bonneville, Butte, Clark,
Fremont, Jefferson, Lemhi, Madison and Teton counties) o Southeastern Idaho Community Action Agency (SEICAA), Pocatello (Bannock, Bear Lake,
Bingham, Caribou, Franklin, Oneida and Power counties May I speak with , or the person who remembers receiving energy efficiency services through [insert Agency]? This is a short survey and will take approximately 10 minutes.
o Agreed to participate o Refused to participate o Refused, person not home
[Background] The survey is voluntary. You may decline to answer any of the questions, and may terminate the survey at any time. If you have questions regarding this survey, I can provide you with contact information for someone at Rocky Mountain Power [provide contact information if Respondent requests it]: Shawn Grant, Project Manager P: 801-‐220-‐4196 E: Shawn.Grant@rockymountainpower-‐pacificpower.net Potential Research Questions:
1. Our records indicate that you have participated in (The Agency’s) weatherization/energy efficiency program, is this correct? [Note: use “weatherization”, “energy efficiency”, or “services” throughout, whichever the client understands better]
o Yes o No [CONTINUE TO QUESTION 2] o Don’t know/don’t remember o Refused

43 | P a g e
2. Do you remember receiving [insert service/measure received by customer]? [This will be provided].
o Yes o No [PROBE WITH SUPPLEMENTAL SCRIPT]
o Supplement: Our records indicate that your home received [insert service] from [Agency]. Do you remember someone coming to your home in [month of service] 2012 and [insert service received].
§ [If Yes:] SKIP to Q3 § [If NO:] Is there someone else in your home who
remembers this? • [If Yes:] May I speak with that person? [If yes,
continue interview with other person] • [If No:] [Skip to interview termination script][Do not
count this as completed interview] o Don’t know/don’t remember o Refused
3. Are you still living in the same home where you received the services?
o Yes o No o Don’t know/don’t remember o Refused
4. How did you hear about this program/services provided by [Agency]? [DO NOT READ
THROUGH LIST] o Agency staff o Information on my electric bill o Rocky Mountain Power representative o Rocky Mountain Power website o Other website [SPECIFY] o Through another energy assistance program o Written materials at (Agency) o Family/friends/word-‐of-‐mouth o Other [SPECIFY] o Don’t know/remember o Refused
5. When you applied for this program, did you find it easy, difficult, or in-‐between?
o Easy o Difficult o In-‐between o Don’t know/remember o Refused

44 | P a g e
6. How long did you wait to receive weatherization/energy efficiency services [Clarify: from the time you applied for the program until service delivery]? [Don’t read choices if a timeframe is volunteered]
o Less than one month o At least one month but less than three months o At least three months but less than six months o At least six months but less than a year o More than a year o Don’t know/remember o Refused
7. [Ask question if light bulbs in record] Our records indicate that you received several new
energy-‐efficient light bulbs. Did the agency staff install these directly into your fixtures? o Yes, the new light bulbs were installed directly into the light fixture. [SKIP TO
QUESTION 9] o No, the agency staff left the light bulbs for me to install. [CONTINUE TO
QUESTION 8] o No, I didn’t receive any new light bulbs. o Don’t know/don’t remember o Refused
8. Did you install these energy-‐efficient light bulbs?
o Yes o No [SKIP TO QUESTION 14] o Don’t know/remember o Refused
9. Did you replace any of the new energy-‐efficient light bulbs with different ones? [For
interviewer: did Client remove any of the CFL light bulbs that were installed by the Agency, or any of the CFL light bulbs from the agency that he/she installed his/herself]?
o Yes o No [SKIP TO QUESTION 14] o Don’t know/remember [SKIP TO QUESTION 14] o Refused [SKIP TO QUESTION 14]
10. How many energy-‐efficient light bulbs did you replace?
Record Number:
11. What type of bulb did you replace it with? [DO NOT READ THROUGH LIST – PROBE TO
IDENTIFY TYPE OF LIGHT BULB] o Incandescent o Halogen (looks like old type but isn’t) o Energy-‐saving (CFL) (the curly expensive type) o Energy-‐saving (LED) o Other: [SPECIFY]

45 | P a g e
o Don’t know/remember
12. Why did you replace it/them?
o Not bright enough o Bulb(s) failed o Didn’t like the quality o Other: [SPECIFY] o Don’t know/remember
13. After receiving the new energy-‐efficient light bulbs from the [Agency], have you
purchased and installed additional energy-‐efficient light bulbs? o Yes [SPECIFY TYPE]
• Incandescent • Halogen (looks like old type but isn’t) • Energy-‐saving (CFL) (the curly expensive type) • Energy-‐saving (LED)
o No o Don’t know/remember o Refused
Data Entry Point (for Interviewer): How confident are you that the respondent answered questions 8-‐13 to the best of their ability?
o 1 = very concerned o 2 = somewhat concerned o 3 = neither concerned or confident o 4 = somewhat confident o 5 = very confident
14. [Ask question if window replacement on record] Our records indicate that you received
a new window(s). How many windows were replaced with new ones? o 1 o 2 o 3-‐4 o All the windows were replaced o I didn’t receive new windows [SKIP TO QUESTION 17] o Don’t know/remember [SKIP TO QUESTION 17] o Refused [SKIP TO QUESTION 17]
15. [Ask question if participant remembers receiving new windows] When the [Agency]
installed new windows, did they also install new insulation? o Yes o No [SKIP TO QUESTION 17] o Don’t know/remember [SKIP TO QUESTION 17] o Refused [SKIP TO QUESTION 17]
46 | P a g e
16. Where was the insulation installed? [DO NOT READ THROUGH LIST – PROBE TO
IDENTIFY AREA] o Ceiling o Wall o Floor o Combination o Other o Don’t know/remember o Refused
17. [Ask specifically based on records] Since the [Agency] performed this work in your
home, are you more satisfied or less satisfied with the lighting in your home compared to the old bulbs? [SKIP QUESTION IF DON’T REMEMBER RECEIVING LIGHT BULBS OR SAYS THEY DIDN’T RECEIVE LIGHT BULBS]
o More satisfied o About the same o Less satisfied o Don’t know/remember o Refused
18. [Ask specifically based on records] Our records show you received a new refrigerator
from [Agency]. Since the [Agency] performed this work in your home, are you more satisfied or less satisfied with the refrigerator in your home compared to the old model?
o More satisfied o About the same o Less satisfied o Don’t know/remember o Refused
19. [Ask specifically based on records] Our records show you received a new window(s)
from [Agency]. Since the [Agency] performed this work in your home, are you more satisfied or less satisfied with the windows in your home compared to the old ones?
o More satisfied o About the same o Less satisfied o Don’t know/remember o Refused
20. Now I have some questions about the impact of weatherization on your home. Did you
notice any changes in your home after the Weatherization was completed? [PROMPT: change in comfort, change in appearance, change in air quality, change in energy bill]
[IF Yes: could you tell me what changed?] [DO NOT READ OPTIONS – CHECK ALL THAT APPLY] o No change noticed
47 | P a g e
o Comfort improved o Comfort worse o Appearance worse o Appearance improved o Appearance worse o Air quality improved o Air quality worse o Energy bill lower o Energy bill higher o Other [SPECIFY]
21. Since the [Agency] performed this work in your home, do you believe that your electric
bill is more affordable or less affordable? [Do not ask if volunteered in #20, just choose answer]
o More affordable o About the same o Less affordable o Don’t know/remember o Refused
22. I would like to ask you if you agree or disagree with the following statement: Do you
think it is important or unimportant to save energy by reducing the energy usage in the home? Do you think it is very [important/unimportant] or somewhat [important/unimportant]?
o Important (very/somewhat) o Unimportant (very/somewhat) o Neither important nor unimportant o Don’t know/remember o Refused
23. I would like to ask you if you agree or disagree with the following statement: Most
people probably have things that could be done to improve the energy efficiency of their home. Do you strongly [agree/disagree] or somewhat [agree/disagree]?
o Agree (strongly/somewhat) o Disagree (strongly/somewhat) o Neither agree nor disagree o Don’t know/remember o Refused
24. When the [Agency] performed this work on your home, were the agency staff
courteous, and respectful towards you, your family, and your home? o Yes o No o Don’t know/remember o Refused

48 | P a g e
25. Did the work crew work carefully to protect your home, or was there damage to your
home from the work crew? o Home protected o Home damaged o Don’t know/remember o Refused
26. Was there any work left uncompleted, or that was not fully completed?
o Yes [SPECIFY] o No o Don’t know/remember o Refused
27. Would you recommend this weatherization/energy efficiency program to family and
friends? o Yes o No o Don’t know o Refused
28. Is there anything about the program that needs to be improved?
o Yes o No [SKIP TO QUESTION 30] o Don’t know [SKIP TO QUESTION 30] o Refused [SKIP TO QUESTION 30]
29. [If yes to 28] In what ways do you think the program can be improved? (Check all that
apply) o Customer Service Quality o Product Quality o Professionalism of the Installers o Level of services provided o More services (free stuff) provided per home
30. What type of residence do you live in?
o Single family home o Duplex o Condominium o Mobile or Manufactured Home o Apartment o Refused o Other [SPECIFY]
31. Do you own or rent your residence?

49 | P a g e
o Own o Rent o Don’t know o Refused
32. Do you have an air conditioner in your home?
o Yes o No [SKIP TO QUESTION 35] o Don’t know o Refused
33. [If yes to 32] Is it a window AC unit or central AC?
o Central AC o Window AC [SPECIFY UNITS] o Other [SPECIFY] o Don’t know o Refused
34. Do you have a swamp-‐cooler in your home?
o Yes o No o Don’t know o Refused
35. Do you know which organization provided the funding for the [Insert: measure received:
CFLs, new refrigerator]? o Yes, Rocky Mountain Power or “power company” o Yes, Agency [SPECIFY] o Yes, Other [SPECIFY] o No o Don’t know/remember o Refused
That is the end of our survey. We would like to thank you for taking your time to participate; your responses are very valuable to our process. Have a wonderful rest of your day, goodbye. Data Entry Point (for Interviewer): Last 5 digits of phone number: How well did the respondent understand the questions? (Did the respondent need you to repeat a lot of questions, seem confused by the questions, or give answers that didn’t seem like they really answered the question, or were the answers linked well to the questions?)
o 1 = respondent misunderstood the questions o 2 = respondent somewhat misunderstood the questions

50 | P a g e
o 3 = respondent neither misunderstood or understood o 4 = respondent somewhat understood the questions o 5 = respondent understood the questions well
How confident are you that the respondent answered the questions to the best of their ability? (i.e. was respondent rushing through the interview and not appearing to think very much about their responses, or do you think the respondent was trying to answer as accurately as possible?
o 1 = very concerned o 2 = somewhat concerned o 3 = neither concerned or confident o 4 = somewhat confident o 5 = very confident
How confident was the respondent in recalling events accurately? (i.e. did respondent seem confused, have trouble with memory, seem to be “guessing” with responses, or did respondent seem to recall events fairly easily?
o 1 = very concerned with respondent’s memory of event o 2 = somewhat concerned with respondent’s memory of events o 3 = neither concerned or confident o 4 = somewhat confident in respondent’s recall o 5 = very confident in respondent’s recall
51 | P a g e
Idaho Agency Interview Protocol
Participants: Program managers from Eastern Idaho Community Action Partnership (EICAP), located in Idaho Falls, ID and SouthEastern Idaho Community Action Agency (SEICCA), located in Pocatello, ID will be interviewed. The Executive Director of Community Action Partnership Association of Idaho (CAPAI) will also be contacted and informed of the process, as a courtesy, prior to the interview start-‐date. The Director will also be asked a series of basic interview questions, detailed below. Purpose: To provide qualitative data documenting processes, funding sources, and issues related to Rocky Mountain Power’s Idaho Weatherization Assistance Program. These interviews will address PacifiCorp’s evaluation questions regarding program participation and wait listing.
Introductory Protocol Thank you for speaking with me today. I am from [Smith & Lehmann Consulting or H. Gil Peach & Associates] and am working with Rocky Mountain Power (a division of PacifiCorp), to find out more about how Rocky Mountain Power’s Weatherization Assistance Programs (WAPs) operate in Idaho. Our evaluation focuses on the 2010, 2011, and 2012 program years. The purpose of our evaluation is to measure the cost-‐effectiveness and general impacts of the program, as well as assess program operations. [Be sure interviewee understands this pertains specifically to Rocky Mountain Power’s WAP] You were recommended as someone who plays an important role in administering WAP services provided by [Agency]. I have some questions that should take about 20 minutes to answer, is this still a good time to talk? Do you mind if I record our call? This is just for note taking purposes; I will not share the recording or your individual answers with anyone outside of the project. None of the comments you share today will be attributed to you as an individual. They may, instead, be attributed to your organization. Do you have any questions before we begin? Potential Research Questions:
1. Please tell us your title and role in the weatherization program?
2. What were [your Agency’s] biggest accomplishments during each of the program years: 2010, 2011, and 2012?
3. What were the major challenges [your Agency’s] faced in each year: 2010, 2011,
and 2012?
4. Were any significant changes made to the WAP during each of the program years: 2010, 2011, and 2012?
5. Does your agency use a priority list in determining who gets services? If yes, how
are priorities determined? (i.e. is there a point system, what is it, who is

52 | P a g e
prioritized?)
6. Does [your Agency] have any data sources with participant income or poverty level information? (Explain that client data will be kept confidential, names/addresses will not be specified in our report, etc.)
o What is the format of this data – excel, paper records? o Can we get copies of electronic files? o Would those files include the customer ID for Rocky Mountain
Power?
7. Please explain how your weatherization participant wait list is compiled. At what point in the process is s a household moved to the wait list?
o When they first call in. o After they are qualified by telephone or by interview o After the home is audited and found to be eligible o Other:
__________________________________________________________
8. How many clients (they generally refer to the households they serve as clients
are now on your wait list?
9. How many PacifiCorp (Rocky Mountain Power) clients are currently on the waiting list?
10. How far out in time does your wait list go (in other words, if you were to
weatherize all of the homes currently on your wait list, about when would the last home be finished? Year: ________ Month: _______
11. Does your agency revise/update the list as households move, etc.?
12. Does your agency have a time goal for weatherizing a home, once it is on the
wait list?
13. Is this time target usually met?
14. Are there any points in the process where [Agency] routinely observes a backlog of participants/clients? [DO NOT READ THROUGH LIST]
o Application processing o Home audits o Scheduling o Measure/Job completion
53 | P a g e
15. Does your agency use a priority list in determining measures for each house or does it use a software package?
o If a list, how are priorities determined? (i.e. is there a point system, what is it, how are measures prioritized?)
o If software, which USDOE approved software package do you use? o If software, do you typically enter in twelve months of prior
usages data for the home? o Yes o No
16. What rules or guidelines determine refrigerator replacement as a measure to be installed in a particular home?
o Are measurements taken on every refrigerator that is a candidate for replacement or does the agency follow priority rules?
17. Were there any roadblocks in increasing refrigerator replacements during 2010-‐
2012? If so, what?
18. When an energy-‐efficient refrigerator in installed as a measure; who installs the new one?
o Who takes away the old refrigerator and how is it disposed of?
19. How can we determine which houses that receive their electricity form Rocky Mountain Power were funded by other sources (ex: ARRA funding)?
o Is this information available electronically for each Rocky Mountain Power customer?
o If not, how are the records of weatherization services maintained, and how could we access this information?
20. Where Savings to Investment Ratios (SIR Ratios) are being relied upon, are they
reflecting total cost of each measure no matter which funding source or combination of funding sources are used, or are they calculated according to the USDOE approved optional discounted method (which permit the agency to disregard the non-‐federal portion of costs)?
21. Has the [Agency] taken any steps to prioritize refrigerator replacements? If so, what steps.
• Are there any issues with increasing refrigerator replacements, and how are they being addressed or how might they be addressed?
• Does [Agency] believe there is a need to prioritize refrigerator replacements?
22. What kinds of barriers limit participation in the program? [If any]

54 | P a g e
23. How is the [Agency] addressing any program participation barriers?
o What challenges has the [Agency] faced with these strategies to address barriers?
o What strategies have worked?
24. What are some of the reasons for walkaways?
25. How are walkaways among potential weatherization clients addressed by the [Agency]?
26. What are the problems with the weatherization program from the perspective of
the [Agency] and how might these be solved? Specific Questions for CAPAI:
1. Please tell us your title and role in the weatherization program?
2. What were [your Agency’s] biggest accomplishments during each of the program years: 2010, 2011, and 2012?
3. What were the major challenges [your Agency’s] faced in each year: 2010, 2011,
and 2012?
4. Were any significant changes made to the Rocky Mountain Power WAP during each of the program years: 2010, 2011, and 2012?
5. Were any significant changes made to the overall WAP program (supported by
DOE funding) during each of the program years: 2010, 2011, and 2012?
6. What was your perspective on the previous evaluation? [If concerns are expressed: How might our team be able to address those concerns in the way we approach the evaluation?]
7. What are the problems with the weatherization program from the perspective of
the [Agency] and how might these be solved?