ICT, Innovation and Productivity Growth - … · innovation, havde til gengæld en gennemsnitlig,...
88
CENTRE FOR ECONOMIC AND BUSINESS RESEARCH CEBR EN DEL AF COPENHAGEN BUSINESS SCHOOL ICT, Innovation and Productivity Growth Marts 2013 Henrik Fosse · Joannes Jacobsen · Anders Sørensen
Transcript of ICT, Innovation and Productivity Growth - … · innovation, havde til gengæld en gennemsnitlig,...

CENTRE FOR ECONOMIC AND BUSINESS RESEARCH
CEBREN DEL AF COPENHAGEN BUSINESS SCHOOL
ICT, Innovation and Productivity Growth
Marts 2013
Henrik Fosse · Joannes Jacobsen · Anders Sørensen


ICT, Innovation and Productivity Growth
Henrik Fosse [email protected]
Joannes Jacobsen, [email protected]
Anders Sørensen [email protected]
CEBR – Centre for Economic and Business Research
Copenhagen Business School
22. marts 2013


Table of Contents
1
Table of Contents
Table of Contents ....................................................................... 1
1 Sammenfatning ................................................................... 3
2 Executive summary ............................................................ 10
3 Overview .......................................................................... 17
3.1 Introduction ................................................................... 17
3.2 Hypothesis under investigation ......................................... 17
3.3 Data used in the analyses ................................................ 18
3.4 Approach to the analyses ................................................. 19
3.5 Main results ................................................................... 21
3.6 The case of product innovation ......................................... 22
3.7 Demand and Supply innovation ......................................... 27
3.8 Technology upgrading and organizational changes ............... 32
4 Descriptive analysis ............................................................ 36
4.1 Motivation ...................................................................... 36
4.2 Hypothesis under investigation ......................................... 36
4.3 Approach to descriptive statistics ...................................... 38
4.4 The Data ....................................................................... 38
4.5 Innovation Activities and ICT expenditures ......................... 44
4.6 Productivity growth ......................................................... 49
5 Quantitative analysis .......................................................... 57
5.1 Approach to the analyses ................................................. 57
5.2 Results .......................................................................... 62
Appendiks A Further descriptive statistics ................................. 74

Table of Contents
2
References .............................................................................. 81

Sammenfatning
3
1 Sammenfatning
Denne CEBR-rapport præsenterer nye analyseresultater, der peger på, at investeringer i informations- og kommunikationsteknologi (IKT) kan stimulere innovation. På denne måde kan IKT-investeringer være en effektiv vej til at forøge produktiviteten i danske virksomheder.
BOX S.1.1 HOVEDRESULTATER
Vores grunddata viser, at:
IKT-intensive virksomheder i 2007 havde mellem 5,8 og 12,4 procentpoint større sandsynlighed for at engagere sig i fire innovationsaktiviteter (produkt-, markedsførings-, proces- og/eller organisatorisk innovation) end IKT-ikke-intensive virksomheder.
IKT-intensive virksomheder havde i gennemsnit 2,4 procentpoint højere årlig produktivitetsvækst end IKT-ikke-intensive virksomheder i perioden 2007-2010.
Henholdsvis 26,3 %, 22,5 %, 18,3 % og 19,2 % af forskellen i den årlige produktivitetsvækst på 2,4 procentpoint mellem IKT-intensive og IKT-ikke-intensive virksomheder kan forklares ved IKT-drevet produkt-, markedsførings-, proces- og organisatorisk innovation.
En kombination af produkt- og markedsføringsinnovation forklarer 32,5 % af forskellen i den årlige produktivitetsvækst på 2,4 procentpoint mellem IKT-intensive og IKT-ikke-intensive virksomheder.
Proces og organisatorisk innovation kan ikke forklare forskellen i den årlige produktivitetsvækst på 2,4 procentpoint mellem IKT-intensive og IKT-ikke-intensive virksomheder.
Ved brug af et supplerende datasæt finder vi, at:
Kombinationen af organisatoriske forandringer og implementering af IKT-integreret produktionsudstyr (i modsætning til f.eks. logistikudstyr) kan forklare 60 % af forskellen på 3,5 procent point i gennemsnitlig årlig produktivitetsvækst i perioden 2007-2010 mellem virksomheder, der gennemførte disse aktiviteter, og virksomheder, som ikke foretog nogen af delene.

Sammenfatning
4
Sammenhængen mellem IKT og produktivitetsvækst
Det er generelt accepteret, at IKT er en såkaldt ‘general purpose technology’, som skaber en bred platform for effektiv innovation i virksomhederne. IKT gør det lettere at udføre innovationsaktiviteter, for eksempel med hensyn til nye produkter, omkostningsreduktioner, forbedring af produktionsprocesser og værdikæder. Derudover er innovation på disse og andre områder også selvstændigt en vigtig kilde til produktivitetsvækst.
Den mekanisme, der sammenkæder IKT-investeringer og produktivitetsvækst, har ikke tidligere været undersøgt for danske virksomheder. Med udgangspunkt i en unik kombination af register- og spørgeskemadata for danske virksomheder analyserer vi i denne CEBR-rapport følgende hypotese:
Interaktionen mellem IKT-investeringer og innovationsaktivitet er en vigtig kilde til produktivitetsvækst i danske virksomheder.
Vi undersøger hypotesen ved at søge svar på to specifikke spørgsmål:
Har IKT-intensitet betydning for innovationsaktiviteten i danske virksomheder?
Er samspillet mellem IKT-investeringer og innovationsaktiviteter vigtigt for produktivitetsvæksten i danske virksomheder?
Analyse og resultater
I det første trin i analysen undersøger vi, om intensiv brug af IKT er forbundet med en højere sandsynlighed for at være engageret i de fire innovationsaktiviteter produktinnovation, procesinnovation, markedsføringsinnovation og organisatorisk innovation.
Vi kategoriserer virksomhederne i datasættet som IKT-intensive, hvis de tilhører den halvdel af virksomhederne i stikprøven, som havde de største IKT-udgifter per medarbejder i 2007. Modsat kategoriserer vi virksomheder som IKT-ikke-intensive, hvis de tilhører den halvdel af virksomhederne i stikprøven, som havde de laveste IKT-udgifter per medarbejder i 2007.
Som vist i figur S.1.1 nedenfor har IKT-intensive virksomheder en klart højere sandsynlighed for at være engageret i innovationsaktiviteter end IKT-ikke-intensive virksomheder.

Sammenfatning
5
FIGUR S.1.1 IKT-INTENSITET OG INNOVATIONSHYPPIGHED, 2007
Note: De viste hyppigheder bygger på analyse af en stikprøve på 781 virksomheder. “IKT-passiv”
omfatter de 390 virksomheder i stikprøven, som havde IKT-udgifter per medarbejder under median-niveauet i 2007. “IKT-intensiv” omfatter de 391 virksomheder i stikprøven, som havde IKT-udgifter per medarbejder på eller over median-niveauet in 2007.
Kilde: CEBR-analyse på register- og spørgeskemadata fra Danmarks Statistik.
Figur S.1.2 nedenfor viser, at IKT-intensive virksomheder har højere produktivitetsvækst end IKT-ikke-intensive virksomheder. For eksempel viser de to søjler længst til venstre i figuren, at IKT-intensive virksomheder, der er engageret i produktinnovation, havde en gennemsnitlig, årlig produktivitetsvækst i perioden 2007 til 2010, der var 4,7 procentpoint højere end produktivitetsvæksten i stikprøven som helhed. De IKT-ikke-intensive virksomheder havde på den anden side en gennemsnitlig, årlig produktivitetsvækst i samme periode, der var 0,6 procentpoint lavere end produktivitetsvæksten i stikprøven som helhed. Figuren viser tilsvarende resultater for de tre øvrige innovationsaktiviteter.
Samlet set havde de IKT-intensive virksomheder i gennemsnit 2,4 procentpoint højere, årlig produktivitetsvækst end de IKT-ikke-intensive virksomheder i perioden 2007-2010.
28,9
48,1
35,3
55
22,3
34,9
29,5
42,6
0
10
20
30
40
50
60
Produkt Markedsføring Proces Organisatorisk
%
IKT-intensive IKT-ikke-intensive

Sammenfatning
6
FIGUR S.1.2 IKT-INTENSITET I 2007 OG GENNEMSNITLIG, ÅRLIG
PRODUKTIVITETSVÆKST I FORHOLD TIL SAMLET
GENNEMSNIT, 2007-2010
Note: De viste vækstrateforskelle bygger på en stikprøve på 781 virksomheder.
Produktivitetsvækstraterne er opgjort relativt til det samlede stikprøvegennemsnit på -3,3 %.
Kilde: CEBR-analyse på register- og spørgeskemadata fra Danmarks Statistik.
Tabel S.1.1 viser, at IKT-drevne innovationsaktiviteter kan forklare en væsentlig andel af mervæksten i produktivitet i gruppen af IKT-intensive virksomheder relativt til gruppen af IKT-ikke-intensive virksomheder (resten af forskellen skyldes forskelle i virksomheds-størrelse, uddannelsessammensætning af virksomhedernes arbejdskraft etc.).
4,7
3,1
4,4
2,5
-0,6 -0,5 -0,5
-1,3-2
-1
0
1
2
3
4
5
Produkt Markedsføring Proces Organisatorisk
%-point
IKT-intensive IKT-ikke-intensive

Sammenfatning
7
TABEL
S.1.1 ANDEL AF MERVÆKST I PRODUKTIVITET FOR IKT-INTENSIVE
VIRKSOMHEDER, DER KAN FORKLARES AF IKT-DREVET
INNOVATION
Produkt-
innovation Markedsførings-
innovation Proces-
innovation Organisations-
innovation
Andel 26,3 %*** 22,5 %*** 18,3 %*** 19,2 %** Note: Baseret på en stikprøve på 781 virksomheder. *** angiver, at den pågældende andel er
beregnet på grundlag af estimater, der er statistisk signifikante på 1 %-niveau. ** angiver, at den pågældende andel er beregnet på grundlag af estimater, der er statistisk signifikante på 5 %-niveau.
Kilde: CEBR-analyse på register- og spørgeskemadata fra Danmarks Statistik.
Interaktion mellem innovationsaktiviteter
Hvis en virksomhed er engageret i én type innovationsaktivitet, så er det overvejende sandsynligt, at den også er engageret i én eller flere andre innovationsaktiviteter. Effekten af de individuelle innovations-aktiviteter kan derfor ikke opgøres uafhængigt af hinanden.
For at tage højde for mulige samspilseffekter mellem innovationsaktiviteterne grupperer vi de fire innovationsaktiviteter i to ny kategorier:
Efterspørgselsinnovation, der omfatter produkt- og markedsføringsinnovation
Udbudsinnovation, der omfatter proces- og organisatorisk innovation
De to søjler længst til venstre i figur S.1.3 nedenfor viser, at IKT-intensive virksomheder, der var engageret i produkt- og markedsføringsinnovation, havde en gennemsnitlig, årlig produktivitetsvækst i perioden 2007 til 2010, der var 3,6 procentpoint højere end produktivitetsvæksten i stikprøven som helhed. De IKT-ikke-intensive virksomheder, der var engageret i produkt- og markedsføringsinnovation, havde på den anden side en gennemsnitlig, årlig produktivitetsvækst i perioden 2007 til 2010 der var 1,1 procentpoint lavere end den gennemsnitlige produktivitetsvækst i hele stikprøven.
De to søjler længst til højre i figur S.1.3 viser, at IKT-intensive virksomheder, der var engageret i proces- og organisatorisk innovation, havde en gennemsnitlig, årlig produktivitetsvækst i perioden 2007 til 2010, der var 1,5 procentpoint højere end produktivitetsvæksten i datasættet som helhed. De IKT-ikke-intensive virksomheder, der var engageret i proces- og organisatorisk innovation, havde til gengæld en gennemsnitlig, årlig

Sammenfatning
8
produktivitetsvækst i perioden 2007 til 2010 der var 1,7 procent point lavere end produktivitetsvæksten i hele datasættet.
FIGUR S.1.3 IKT-INTENSITET 2007 OG GENNEMSNITLIG, ÅRLIG
PRODUKTIVITETSVÆKST I FORHOLD TIL DEN
GENNEMSNITLIGE PRODUKTIVITETSVÆKST I STIKPRØVEN
2007-2010
Note: De viste vækstrateforskelle bygger på en stikprøve på 781 virksomheder.
Produktivitetsvækstraterne er opgjort relativt til det samlede stikprøvegennemsnit på -3,3 %.
Kilde: CEBR-analyse på register- og spørgeskemadata fra Danmarks Statistik.
Vores analyse viser, at IKT-drevet efterspørgselsinnovation kan forklare en væsentlig andel af mervæksten i produktivitet i gruppen af IKT-intensive virksomheder engageret i efterspørgselsinnovation relativt til gruppen af IKT-ikke-intensive virksomheder engageret i efterspørgselsinnovation. Den første kolonne i tabel S.1.2 nedenfor viser, at kombinationen af produkt- og markedsføringsinnovation forklarer 32,5 % af mervæksten i produktivitet på 2,4 procentpoint i gruppen af IKT-intensive virksomheder i forhold til gruppen af IKT-ikke-intensive virksomheder.
3,6
1,5
-1,1-1,7-2
-1
0
1
2
3
4
Produkt og Markedsføring Proces og Organisatorisk
%-point
IKT-intensive IKT-ikke-intensive

Sammenfatning
9
TABEL S.1.2 ANDEL AF MERVÆKST I PRODUKTIVITET FOR IKT-INTENSIVE
VIRKSOMHEDER, DER KAN FORKLARES AF IKT-DREVET
INNOVATION
Produkt,
Markedsføring Proces, organisation
Andel 32,5 %*** 14,6 % Note: Baseret på en stikprøve på 781 virksomheder. *** angiver, at den pågældende andel er
beregnet på grundlag af estimater, der er statistisk signifikante på 1 %-niveau. ** angiver, at den pågældende andel er beregnet på grundlag af estimater, der er statistisk signifikante på 5 %-niveau.
Kilde: CEBR-analyse på register- og spørgeskemadata fra Danmarks Statistik.
Den anden kolonne i tabellen viser, at IKT-drevne udbudsinnovationsaktiviteter kun kan forklare en lille andel (der statistisk set ikke er forskellig fra 0) af produktivitetsmervæksten blandt IKT-intensive virksomheder, der er engageret i udbudsinnovation, i forhold til IKT-ikke-intensive virksomheder, der ligeledes er engageret i udbudsinnovation.
For at undersøge denne overraskende mangel på effekt af IKT-drevet udbudsinnovation lidt nærmere, inddrager vi en spørgeskemaundersøgelse fra 2007, hvor 2.840 virksomheder har svaret på spørgsmål om implementering af teknologiske og organisatoriske ændringer.
Ved hjælp af dette datasæt finder vi, at IKT-drevet udbudsinnovation faktisk bidrager til produktivitetsvækst. Bidraget til produktivitets-væksten kommer dog primært fra implementering af nye IKT-integrerede maskiner, der bruges i selve produktionsprocessen fremfor i forbindelse med logistik, distribution osv.
Produktivitetseffekten fra IKT-drevet udbudsinnovation er særlig stor i virksomheder, der kombinerer implementering af nye IKT-integrerede maskiner med organisatoriske ændringer. Denne kombination kan forklare 60 % af forskellen på 3,5 procent point i gennemsnitlig årlig produktivitetsvækst i perioden 2007-2010 mellem på den ene side virksomheder, der både investerede i nye IKT-integrerede maskiner og gennemførte organisatoriske ændringer, og på den anden side virksomheder, der ikke gjorde nogen af delene.
Executive summary
10
2 Executive summary
This CEBR report presents new evidence which suggests that investments in Information and Communication Technology (ICT) further productivity growth in Danish firms by stimulating innovation activities.
BOX S.2.1 MAIN RESULTS
Analysis using our main data sample shows that:
ICT intensive firms are more often engaged in innovative activities than ICT non-intensive firms. Across 4 innovation activities (product, marketing, process, and organizational innovation), ICT intensive firms had between 5.8 and 12.4 percentage points higher probability of being engaged in the specific innovation activity than ICT non-intensive firms in 2007.
ICT intensive firms had on average 2.4 percentage point higher annual productivity growth than ICT non-intensive firms over the period 2007 to 2010.
Analyzed individually, ICT induced product, marketing, process, and organizational innovation explain 26.3 %, 22.5 %, 18.3 % and 19.2 %, respectively, of the actual 2.4 percentage point productivity growth difference between the ICT intensive group and the ICT non-intensive group.
A combination of product and marketing innovation explains 32.5 % of the 2.4 percentage point excess productivity growth of ICT intensive firms relative to ICT non-intensive firms.
A combination of process and organizational innovation does not explain any of the excess productivity growth of ICT intensive firms relative to ICT non-intensive firms.
Further analysis using an alternative data sample shows that:
A combination of organizational changes and implementation of machinery embedding ICT technology specifically related to the production process (rather than e.g. logistics) explains 60 % of the actual 3.5 percentage point productivity growth difference over the period 2007-2010 between firms who both invested in new machines embedding ICT technology and introduced organizational changes and firms who did neither.

Executive summary
11
Linking ICT and productivity growth
It is widely accepted that ICT is a ‘general purpose technology’ which creates a basis for effective business innovation. ICT facilitates innovation in firms with respect to for example new products, costs reductions, process streamlining and value chain improvements. Innovation, in turn, is a significant contributor to productivity growth.
The strength of the ICT-to-productivity-growth mechanism has not been evaluated in a Danish context before. This CEBR report utilizes a unique combination of register and survey data for Danish firms to analyze a hypothesis which states that:
The interaction between new technology in the form of ICT and innovation is an important driver of productivity growth in Danish firms.
We investigate the stated hypothesis by obtaining answers to the following specific questions:
Is ICT intensity an important driver of innovation in Danish firms?
Is the interaction between ICT investments and innovation activities important for the productivity of Danish firms?
Analysis and results
In the first step of the analysis we investigate whether intensive use of ICT is related to higher probability of being engaged in the following four innovation activities: product innovation, process innovation, marketing innovation, and organizational innovation.
We categorize the firms in the data set as ICT intensive if they belonged to the 50 % of the sample who spent the most on ICT per employee in 2007. Conversely, we categorize firms as ICT non-intensive if they were part of the 50 % of the sample who spent the least on ICT per employee.
As shown in Figure ES.2.1 below, ICT intensive firms are clearly more engaged in innovative activities than ICT non-intensive firms.

Executive summary
12
FIGURE ES.2.1 ICT INTENSITY AND SHARE OF FIRMS ENGAGED IN
INNOVATION, 2007
Notes: The results are based on analysis of a sample of 781 firms. “ICT non-intensive” refers to
those 390 firms in the sample who had lower than median ICT expenditure per employee in2007. “ICT intensive” refers to those 391 firms in the sample who had median ICTexpenditure per employee in 2007 or higher.
Source: Statistics Denmark and CEBR analysis.
Figure ES.2.2 below illustrates that ICT intensive firms have higher productivity growth than ICT non-intensive firms. For example, the first two columns in the figure show that ICT intensive firms engaged in product innovation had 4.7 percentage point higher average annual productivity growth than the firms in the data set as a whole, while ICT non-intensive firms engaged in product innovation had 0.6 percentage point lower productivity growth than the firms in the data set as a whole. The figure shows qualitatively similar results with respect to the other three innovation activities.
Across the whole sample of firms, ICT intensive firms had on average 2.4 percentage point higher annual productivity growth than IKT non-intensive firms over the period 2007-2010
28,9
48,1
35,3
55
22,3
34,9
29,5
42,6
0
10
20
30
40
50
60
Product Marketing Process Organizational
%
ICT intensive ICT non-intensive

Executive summary
13
FIGURE ES.2.2 ICT INTENSITY IN 2007 AND AVERAGE ANNUAL
PRODUCTIVITY GROWTH RELATIVE TO TOTAL SAMPLE
GROWTH 2007-2010
Notes: The analysis is based on a sample of 781 firms. Productivity growth rates are measured
relative to the average total sample productivity growth rate, which equals -3.3 %.
Source: Statistics Denmark and CEBR analysis.
Table ES.2.1 shows that ICT induced innovation activities can explain a significant part of the 2.4 percentage points excess productivity growth of the ICT intensive firms relative to the ICT non-intensive firms (the rest being accounted for by differences in size, education mix of employees etc.).
TABLE ES.2.1 SHARE OF EXCESS PRODUCTIVITY GROWTH OF ICTINTENSIVE FIRMS EXPLAINED BY ICT INDUCED INNOVATION
Product
innovation Marketing innovation
Process innovation
Organizational innovation
Share 26.3 %*** 22.5 %*** 18.3 %*** 19.2 %** Notes: The results are based on analysis of a sample of 781 firms. *** refers to shares calculated
on the basis of estimates that are statistically significant at the 1 % level. ** refers to share calculated on the basis of estimates that are statistically significant at the 5 % level.
Source: Statistics Denmark and CEBR analysis.
4,7
3,1
4,4
2,5
-0,6 -0,5 -0,5
-1,3-2
-1
0
1
2
3
4
5
Product Marketing Process Organizational
%-points
ICT intensive ICT non-intensive

Executive summary
14
Innovation interactions
It is very likely that if a firm is engaged in one line of innovation activity it will also be engaged in one or more of the other innovation activities. Therefore, the effects of the individual innovation activities cannot be fully separated from each other.
To account for the possibility of synergies between innovation activities we group the four innovation categories into two new categories;
Demand innovation, which covers product and marketing innovation activities
Supply innovation, which covers process and organizational innovation activities
The first two columns in Figure ES.2.3 below show that ICT intensive firms engaged in product and marketing innovation had 3.6 percentage points higher average annual productivity growth over the period 2007-2010 than the firms in the data set as a whole, while ICT non-intensive firms engaged in product and marketing innovation had 1.1 percentage points lower productivity growth over the period 2007-2010 than the firms in the data set as a whole.
The last two columns in Figure ES.2.3 show that ICT intensive firms engaged in process and organizational innovation had 1.5 percentage points higher average annual productivity growth over the period 2007-2010 than the firms in the data set as a whole, while ICT non-intensive firms engaged in process and organizational innovation had 1.7 percentage point lower productivity growth over the period 2007-2010 than the firms in the data set as a whole.

Executive summary
15
FIGURE ES.2.3 ICT INTENSITY 2007 AND AVERAGE ANNUAL
PRODUCTIVITY GROWTH RELATIVE TO TOTAL SAMPLE
GROWTH 2007-2010
Notes: The analysis is based on a sample of 781 firms. Productivity growth rates are measured
relative to the average total sample productivity growth rate, which equals -3.3 %.
Source: Statistics Denmark and CEBR analysis.
We find that ICT induced demand innovation activities can explain a significant part of the excess productivity performance of ICT intensive firms engaged in demand innovation relative to ICT non-intensive firms engaged in demand innovation. The first column in Table ES.2.2 below shows that the product and marketing innovation combination explains 32.5 % of the 2.4 percentage point excess productivity growth of the ICT intensive firms relative to the ICT non-intensive firms.
3,6
1,5
-1,1-1,7-2
-1
0
1
2
3
4
Product and Marketing Process and Organizational
%-points
ICT intensive ICT non-intensive

Executive summary
16
TABLE ES.2.2 SHARE OF EXCESS PRODUCTIVITY GROWTH OF ICTINTENSIVE FIRMS EXPLAINED BY ICT INDUCED
INNOVATION
Product,
Marketing Process, organizational
Share 32.5 %*** 14.6 % Notes: The results are based on analysis of a sample of 781 firms. *** refers to share calculated on
the basis of estimates that are statistically significant at the 1 % level.
Source: Statistics Denmark and CEBR analysis.
The second column in the table shows that ICT induced supply innovation activities can only explain a small and statistically insignificant part of the 2.4 percentage point excess productivity performance of ICT intensive firms engaged in supply innovation relative to ICT non-intensive firms engaged in supply innovation.
In order to investigate the surprising lack of an effect of ICT induced supply innovation on productivity growth a bit more closely, we introduce a 2007 survey of 2,840 firms concerning implementation of technological changes and organizational changes, respectively.
From this extended sample we find that productivity gains from ICT induced supply innovation do exist, but the gains are primarily related to implementation of machinery embedding ICT technology which is used specifically in the production process rather than in logistics, distribution etc.
The productivity effect is even stronger for firms that combined new machines embedding ICT technology and organizational changes. In fact, this combination accounts for 60 % of the actual 3.5 percentage point productivity growth difference over the period 2007-2010 between firms who both invested in new machines embedding ICT technology and introduced organizational changes, and the group of firms who did neither.

Overview
17
3 Overview
This chapter provides a non-technical and easy to read overview of the implementation of this project, i.e. the motivation for and set-up of the hypotheses analyzed, the data used in the analyses, the approach used for the analyses of the stated hypotheses, and the results obtained. Full results and technical details are provided in the following chapters.
3.1 Introduction
A high standard of living in Denmark depends on the existence of a plentiful supply of competitive and productive firms who create a large pool of high paying jobs.
Product and marketing innovation result in new and better products that can obtain better prices in markets, while process and organizational innovation results in more efficient production processes that lower production costs. Thus, innovation is an important determinant of competitive advantage for firms and productivity growth for society as a whole.
A widely held hypothesis holds that information and communications technology (ICT) creates a basis for effective innovation activities. Until now, this hypothesis has not been tested on Danish data. This CEBR report utilizes a unique combination of register- and survey data for Danish firms in order to remedy this omission.
The report documents that the interaction between ICT investments and innovation activities is an important driver of productivity growth. Specifically, we document that ICT intensive firms in general obtain a large productivity growth effect through increased potential for a combination of product and marketing innovation. We also document that a combination of organizational innovation and a specific type of ICT investments in process innovation, i.e. automation of the production process, results in higher productivity growth.
3.2 Hypothesis under investigation
Theoretical links between ICT, innovation, and productivity growth
One possible mechanism through which digitalization impacts innovation activity and productivity growth is that digitalization leads

Overview
18
to product and process innovation which results in new and better products and processes. Further, digitalization may cause productivity growth through organizational innovation, for example with respect to management techniques and business models.
On a more fundamental level, the argument is that digitalization changes the way firms work with innovation, and that this change creates opportunities for permanent increases in innovation activities and productivity growth (Brynjolfsson, 2011).
Gretton, Gali and Parham (2004) for example emphasize that ICT investments are a determinant of innovation. Their argument is that ICT is a so called 'general purpose technology' which provides a platform for innovation. Therefore, ICT makes it relatively easier and cheaper to develop new productivity enhancing innovation.
ICT is thus a valuable facilitator of innovation in firms as ICT makes it possible to reduce transaction costs, improve internal processes, improve coordination with suppliers, slice the value chain both horizontally, vertically and geographically, and increase diversification (Koellinger, 2005).
Hypothesis under investigation
On the basis of these proposed theoretical mechanisms in the academic literature we will analyze a hypothesis which states that:
The interaction between new technology in the form of ICT and innovation is an important driver of productivity growth in Danish firms.
We investigate the stated hypothesis by obtaining answers to the following specific questions:
Is ICT intensity an important driver of innovation in Danish firms?
Is the interaction between ICT investments and innovation activities important for the productivity of Danish firms?
3.3 Data used in the analyses
Primary data set
Based on the hypotheses under investigation our main interest is in data on ICT expenditure, innovation activity and productivity growth. We have therefore constructed a data set with information on firm ICT

Overview
19
expenditure per employee in 2007, four possible innovation activities within Danish firms in 2007 (product innovation, process innovation, marketing innovation, and organizational innovation), and average annual productivity growth for each firm over the period 2007-2010.
The numbers on ICT expenditure and the information on innovation activity within each firm are gathered from two separate surveys conducted by Statistics Denmark, while the data on productivity growth are constructed from firm register data also from Statistics Denmark. Combining the survey and register data we can construct a sample of 781 firms which we will use for most of the statistical analyses.
Alternative data set
We also use data from a third survey conducted by Statistics Denmark together with register data to construct a data set with 2,840 firms that we use to perform some robustness checks of some of the results obtained with our main data set.
The main idea in the statistical analyses is to control for the influence of other firm characteristics that may determine innovation potential and productivity growth in order to isolate the relationship between ICT expenditure, innovation activity, and productivity growth. In addition to the data on the main variables, we therefore have data on firm characteristics that may also influence innovation activity and productivity growth such as firm size, exporter status etc.
3.4 Approach to the analyses
This section describes our approach to the analyses in this report. The results obtained from the analyses are discussed in the following sections.
ICT intensive and ICT non-intensive firms
With respect to the presentation of the results of the analyses, the main idea is to construct two separate groups of firms according to their level of ICT expenditure per employee and then compare these two groups with respect to innovation activity and productivity growth.
Specifically, we sort the firms according to ICT expenditure per employee and find the median firm with respect to amount of ICT expenditure per employee in 2007, i.e. the firm which had higher ICT

Overview
20
expenditure than one half of the firms in the sample and lower ICT expenditure than the other half of the firms in the sample.
We then construct two groups of firms: One group with those firms with lower ICT expenditure per employee than the median firm and one group with those firms with higher ICT expenditure per employee than the median firm (the median firm itself is placed in the high ICT expenditure group) so that there are 390 firms in the ICT non-intensive group and 391 firms in the ICT intensive group.
Descriptive statistics
We first use basic descriptive statistics to describe the relationship between ICT investments, innovation activities, and growth performance within these two groups and the differences in these relationships between the two groups.
Two step procedure for individual innovation activities
We then use a two step statistical procedure to investigate whether we can attribute part of any found difference in growth performance between these two groups to differences in the average ICT expenditure per employee and innovation activity amongst them.
First, we investigate whether intensive use of ICT leads to a more pronounced tendency for engaging in one or more of the four different innovation activities: Product innovation, process innovation, marketing innovation, and organizational innovation.
In order to analyze the relationship between ICT investments and innovation activities we utilize a statistical model – a so called probability model - which estimates a firm’s innovation tendency based on observable firm characteristics such as ICT investments, size, education mix of employees etc.
Second, we investigate whether differences in innovation tendency leads to differences in productivity growth. In order to analyze the relationship between innovation tendency and productivity growth, we utilize another statistical model which explains a firm’s productivity growth based on the estimated innovation tendency from the first step in the statistical analysis. As for the analyses in the first step, we control for the influence of other observable factors such as the size of the firm’s capital stock and education mix of the employees.

Overview
21
Two step procedure for combinations of innovation activities
The results from the two step procedure above can be criticized for not taking into account that the firm’s choices of which innovation activities to engage in are at least to some extent interrelated which implies that we cannot fully separate the effects of the individual innovation activities from each other.
We therefore repeat the two step statistical procedure with the only difference that we this time around use a so called bivariate probability model in the first step which is able to take into account this interaction between the choices of different innovation activities. Therefore, using the bivariate probability model we can estimate the tendency for a firm to engage in different combinations of innovation activities rather than just the tendency to engage in individual innovation activities.
We can then use the results from the bivariate probability model in the second step to investigate whether differences in the tendency to engage in different combinations of innovation activities leads to differences in productivity growth.
Further exploration using alternative data
Third, we use the alternative data set in order to further explore one particular aspect of the ICT, innovation, productivity growth nexus, namely the relationship between a particular type of ICT investment, process and organizational innovation, and productivity growth.
3.5 Main results
For easy reference, this section summarizes the main results. The following sections then elaborate on the main conclusions listed here.
Using descriptive statistics to compare the ICT intensive group of firms with the ICT non-intensive group of firms we find that:
ICT intensive firms are more often engaged in innovative activities than ICT non-intensive firms.
ICT intensive firms have higher productivity growth than ICT non-intensive firms.
ICT expenditure is more important for productivity growth for firms who engage in product innovation than for firms who do not engage in innovation activity.

Overview
22
In the first round of our two step statistical procedure to control for various firm characteristics that influence productivity growth, we find that:
ICT induced product, marketing, process, and organizational innovation explain 26.3 %, 22.5 %, 18.3 % and 19.2 %, respectively, of the actual 2.4 percentage point productivity growth difference between the ICT intensive group and the ICT non-intensive group.
In the second round of our two step statistical procedure to control for various firm characteristics that influence productivity growth, we find that:
The combination of product and marketing innovation explains 32.5 % of the actual 2.4 percentage point productivity growth difference between the ICT intensive group and the ICT non-intensive group.
Process and organizational innovation do not explain any of the excess productivity growth of ICT intensive firms relative to ICT non-intensive firms.
Using the alternative data sample to investigate the effect of organizational innovation and a more narrowly defined type of process innovation on productivity, we find that:
A combination of ICT induced organizational changes and process innovation defined as the implementation of machinery embedding ICT technology used specifically in the production process (rather than in logistics, distribution etc.) explains 60 % of the actual productivity growth difference between firms who both invested in new machines embedding ICT technology and introduced organizational changes and firms who did neither.
3.6 The case of product innovation
ICT and product innovation
In order to present the results as clearly as possible we focus on the most important results. The full array of results and technical details about how they are obtained can be found in the following chapters.

Overview
23
Here we present the case of the relationship between ICT investments and product innovation. Chapter 4 provides full results for all four innovation types.
In Table 3.1 below we use the construction with one group of ICT non-intensive firms and one group of ICT intensive firms to show the relationship between ICT expenditure and product innovation activity within the firms in our sample.
TABLE 3.1 ICT INTENSITY AND PRODUCT INNOVATION 2007
Engaged in product innovation
Share of firms Yes No Total
ICT non-intensive 10.7 % 39.3 % 50.0 %
ICT intensive 13.7 % 36.3 % 50.0 %
Total 24.4 % 75.6 % 100.0 % Notes: Based on a sample of 781 firms. The table shows the relationship between ICT expenditure
per employee and product innovation activity. “ICT non-intensive” refers to those 390 firms in the sample who had lower than median ICT expenditure per employee in 2007. “ICTintensive” refers to those 391 firms in the sample who had median ICT expenditure peremployee in 2007 or higher.
Source: Statistics Denmark and CEBR analysis.
The table shows that 21.4 % of the firms in the ICT non-intensive group (i.e. 10.7 % of the firms in the full sample) were engaged in product innovation, while 27.4 % of the firms in the ICT intensive group (i.e. 13.7 % of the firms in the full sample) were engaged in product innovation. This implies a 6.0 percentage point difference in product innovation activity between the two groups of firms.
ICT, product innovation, and productivity growth
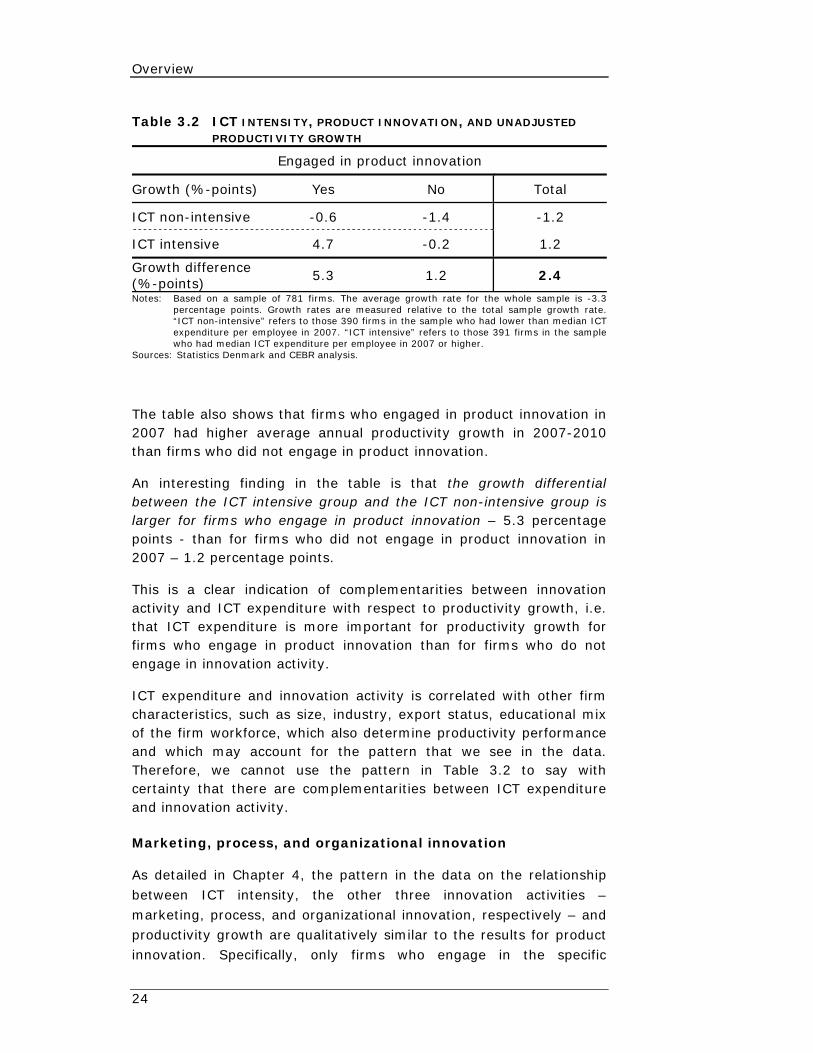
Table 3.2 below shows there was a 2.4 percentage point difference in average productivity growth between the ICT intensive and ICT non-intensive groups over the period 2007-2010. In our statistical analyses a main objective will be to find out how much of this 2.4 percentage point difference can be explained by ICT induced differences in innovation tendency between the two groups of firms.
Overview
24
Table 3.2 ICT INTENSITY, PRODUCT INNOVATION, AND UNADJUSTED
PRODUCTIVITY GROWTH
Engaged in product innovation
Growth (%-points) Yes No Total
ICT non-intensive -0.6 -1.4 -1.2
ICT intensive 4.7 -0.2 1.2
Growth difference (%-points)
5.3 1.2 2.4
Notes: Based on a sample of 781 firms. The average growth rate for the whole sample is -3.3percentage points. Growth rates are measured relative to the total sample growth rate.“ICT non-intensive” refers to those 390 firms in the sample who had lower than median ICTexpenditure per employee in 2007. “ICT intensive” refers to those 391 firms in the samplewho had median ICT expenditure per employee in 2007 or higher.
Sources: Statistics Denmark and CEBR analysis.
The table also shows that firms who engaged in product innovation in 2007 had higher average annual productivity growth in 2007-2010 than firms who did not engage in product innovation.
An interesting finding in the table is that the growth differential between the ICT intensive group and the ICT non-intensive group is larger for firms who engage in product innovation – 5.3 percentage points - than for firms who did not engage in product innovation in 2007 – 1.2 percentage points.
This is a clear indication of complementarities between innovation activity and ICT expenditure with respect to productivity growth, i.e. that ICT expenditure is more important for productivity growth for firms who engage in product innovation than for firms who do not engage in innovation activity.
ICT expenditure and innovation activity is correlated with other firm characteristics, such as size, industry, export status, educational mix of the firm workforce, which also determine productivity performance and which may account for the pattern that we see in the data. Therefore, we cannot use the pattern in Table 3.2 to say with certainty that there are complementarities between ICT expenditure and innovation activity.
Marketing, process, and organizational innovation
As detailed in Chapter 4, the pattern in the data on the relationship between ICT intensity, the other three innovation activities – marketing, process, and organizational innovation, respectively – and productivity growth are qualitatively similar to the results for product innovation. Specifically, only firms who engage in the specific

Overview
25
innovation activity and are in the ICT intensive group have higher than average annual productivity growth.
And as is the case for product innovation, there is also a clear indication of complementarities between innovation activity and ICT expenditure with respect to productivity growth for the other innovation activities, as ICT expenditure is more important for productivity growth for firms who engage in a specific innovation activity than for firms who do not engage in the innovation activity.
Innovation potential and adjusted productivity growth
To find how much of the 2.4 percentage point growth difference between the ICT intensive group and the ICT non-intensive group can be attributed to ICT expenditure and innovation activity, we start by estimating the strength of the relationship between ICT expenditure per employee and innovation activity while we are careful to control for the effects of firm size, industry, exporter status and educational mix of the firm workforce.
Combining the obtained strength of the relationship with the numbers for ICT expenditure per employee for the two groups, we can find the innovation tendency for the two groups and thus measure the share of the difference between the average innovation tendencies for the two groups that can be attributed to differences in ICT expenditure. The results are shown in Table 3.3 below.
We find that there is a 6.3 percentage point difference in product innovation tendency between the two groups that can be attributed to differences in ICT expenditure.
TABLE 3.3 ICT INTENSITY AND PRODUCT INNOVATION TENDENCY
Product innovation
Innovation tendency for ICT non-intensive 20.9 %
Innovation tendency for ICT intensive 27.2 %
Difference in innovation potential (%-points) 6.3 Notes: Based on a sample of 781 firms. “ICT non-intensive” refers to those 390 firms in the sample
who had lower than median ICT expenditure per employee in 2007. “ICT intensive” refers tothose 391 firms in the sample who had median ICT expenditure per employee in 2007 orhigher.
Source: Statistics Denmark and CEBR analysis.

Overview
26
The estimated differences in innovation potential for marketing, process, and organizational innovation activities are 8.9 percentage points, 6.1 percentage points and 8.6 percentage points, respectively (see Chapter 3).
To find out what these differences in innovation tendencies related to differences in ICT expenditure imply for productivity growth differences between the two groups, we estimate growth regressions where we in separate regressions estimate the effects of each of the innovation tendencies for the four innovation activities on firm productivity growth from 2007 to 2010.
The result for product innovation is shown in Table 3.4 below. The first row shows a predicted 0.63 percentage point difference in productivity growth from ICT induced product innovation. Thus, ICT induced product innovation explains 26.3 % of the actual 2.4 percentage point productivity growth difference between the ICT intensive group and the ICT non-intensive group.
TABLE 3.4 GROWTH DIFFERENCE BETWEEN “ICT NON-INTENSIVE”-GROUP
AND “ICT INTENSIVE”-GROUP FROM ICT INDUCED PRODUCT
INNOVATION
Product innovation
Growth difference top-bottom explained by ICT induced innovation (%-points)
0.63***
Growth difference top-bottom in unadjusted data (%-points)
2.4
Share of growth difference explained by ICT induced innovation potential
26.3 %***
Notes: Based on a sample of 781 firms. “ICT non-intensive” refers to those 390 firms in the sample who had lower than median ICT expenditure per employee in 2007. “ICT intensive” refers tothose 391 firms in the sample who had median ICT expenditure per employee in 2007 orhigher. *** refers to numbers calculated on the basis of estimates that are statisticallysignificant at the 1 % level.
Source: Statistics Denmark and CEBR analysis.
The estimated average annual productivity growth differences induced by ICT potential for marketing, process, and organizational innovation activities are 0.54 percentage points, 0.44 percentage points and 0.46 percentage points, respectively (see Chapter 4). Thus, ICT induced marketing, process, and organizational innovation explain 22.5 %, 18.3 % and 19.2 %, respectively, of the actual 2.4 percentage point productivity growth difference between the ICT intensive group and the ICT non-intensive group.

Overview
27
3.7 Demand and Supply innovation
The results above are established by analysis of each of the four innovation activities separately. The results can be criticized for not taking into account that if a firm is engaged in one innovation activity there is a tendency for it to also being engaged in one or more of the other innovation activities which implies that we cannot fully separate the effects of the individual innovation activities from each other.
We therefore modify our approach slightly in order to account for this possibility of interrelated effects. A firm can become more productive – i.e. raise the value of a unit of production relative to the cost of a unit of production - in two basic ways: Through increased demand which allows the firm to charge higher prices for any given number of units of its products or through lower supply costs of any given number of units of its products.
The four innovation activities of the firms that are surveyed in our data can be thus grouped into two distinct categories which we label Demand innovation and Supply innovation:
Product and Marketing innovation aim to affect customers’ demand for the firms’ output. In economists’ terms, Product and Marketing innovation aim to shift the demand curve that the firm faces outwards, i.e. to increase the demand for any given price that the firm demands for its products. For the purposes of this report, we therefore group Product and Marketing innovation together under the heading “Demand Innovation”.
Process and Organizational innovation aim to affect the efficiency with which the firm is able to satisfy customer’s demand for the firms’ output. Process and Organizational innovation thus aim to shift the supply curve of the firm downwards, i.e. to decrease the cost of supplying any given amount of products to customers. For the purposes of this report, we therefore group Process and Organizational innovation together under the heading “Supply Innovation”.
The statistical analysis in Junge, Severgnini and Sørensen (2012b) confirms that demand innovation activities and supply innovation activities also empirically are two distinct, non-overlapping categories. Based on these considerations we analyze the relationship between ICT expenditure, the two demand innovation activities, and productivity growth together and the relationship between ICT
Overview
28
expenditure, the two supply innovation activities, and productivity growth together.
The case of demand innovation
With two innovation activities under consideration simultaneously, the statistical procedure used to find the relationship between ICT investments and innovation activity is in principle the same as for only one innovation activity. But the procedure gets a little bit messier as firms do not choose between either engaging in a specific innovation activity or not but rather choose between four options, two for each of the two innovation activities under consideration simultaneously. With respect to demand innovation they can choose to engage in:
Both product and marketing innovation Product innovation but not marketing innovation Marketing innovation but not product innovation Neither product innovation or marketing innovation
We now look at the two demand innovation components – product innovation and marketing innovation – together. We group the firms in the sample into four types according to whether they were engaged in product innovation in 2007 or not and whether they were engaged in marketing innovation in 2007 or not. Together with the split of the firms into those with above median and below median ICT expenditure per employee, this gives us 8 firm categories.
ICT, demand innovation, and unadjusted productivity
The unadjusted growth performance of these 8 firm groups is displayed in Table 3.5 below. We see a clear indication of complementarities between ICT expenditure and innovation activity as the difference in average annual productivity growth between the top and bottom groups according to ICT expenditure increases with innovation activity: more active firms with respect to innovation have a higher growth rate in absolute terms but also in relative terms if they are in the ICT intensive group. Of course, the total growth differential between the two groups is still 2.4 percentage points.

Overview
29
TABLE 3.5 DEMAND INNOVATION AND UNADJUSTED GROWTH FOR “ICT
NON-INTENSIVE”-GROUP AND “ICT INTENSIVE”-GROUP
Growth (%-points)
Product and marketing
Product but not
marketing
Not product
but marketing
Not product and not
marketing
Total
ICT non-intensive
0.7 1.0 -1.7 -1.3 -1.2
ICT intensive 5.5 1.0 1.0 -0.9 1.2
Growth difference (%-points)
4.8 4.4 2.7 0.4 2.4
Notes: Based on a sample of 781 firms. “ICT non-intensive” refers to those 390 firms in the sample who had lower than median ICT expenditure per employee in 2007. “ICT intensive” refers tothose 391 firms in the sample who had median ICT expenditure per employee in 2007 orhigher.
Source: Statistics Denmark and CEBR analysis.
Demand innovation potential and adjusted productivity growth
To find out how much of the growth difference of 2.4 percentage points can be attributed to ICT expenditure and innovation activity, we first investigate the link between ICT expenditure per employee and demand innovation activity via statistical analysis where we control for other determinants of innovation activity such as firm size, industry, exporter status and educational mix of the firm workforce.
Combining the obtained statistical link between ICT expenditure and innovation activity with the numbers for average ICT expenditure per employee for the two groups (above median ICT expenditure and below median ICT expenditure), we can for each of the four possible demand innovation combinations find the differences between the innovation tendency for the two groups that can be attributed to differences in ICT expenditure.
The results are shown in the bottom row of Table 3.6. For example, we find that the difference in ICT expenditure per employee in the two groups corresponds to a predicted 6.0 percentage point difference in combined product and marketing innovation tendency between the two groups that can be attributed to differences in ICT expenditure.
In total, we find that a randomly chosen firm from the ICT non-intensive group has a 43.4 % demand innovation tendency while a randomly chosen firm from the ICT intensive group has a 52.5 % demand innovation tendency for a total difference of 9.1 percentage points.

Overview
30
TABLE 3.6 DEMAND INNOVATION POTENTIAL FOR “ICT NON-INTENSIVE”-GROUP AND “ICT INTENSIVE”-GROUP
Product,
marketing Product, not marketing
Not product,
marketing
Not product, not marketing
Innovation potential for ICT non-intensive
16.3 % 5.9 % 20.1 % 56.6 %
Innovation potential for ICT intensive
22.3 % 5.9 % 23.1 % 47.5 %
Difference in innovation potential (%-points)
6.0 0.1 3.0 -9.1
Notes: Based on a sample of 781 firms. “ICT non-intensive” refers to those 390 firms in the sample who had lower than median ICT expenditure per employee in 2007. “ICT intensive” refers tothose 391 firms in the sample who had median ICT expenditure per employee in 2007 orhigher.
Source: Statistics Denmark and CEBR analysis.
To find out what these differences in innovation tendencies related to differences in ICT expenditure imply for productivity growth differences between the two groups, we estimate a growth regression from which we obtain estimates of the effects of being in one of the three innovation active groups (product and marketing, only product, only marketing) on firm productivity growth relative to the last group (neither product nor marketing) which is taken to be the reference group.
The results are shown in Table 3.7 below. The table shows a predicted 0.78 percentage point difference in productivity growth from ICT induced product and marketing innovation, which is 32.5 % of the 2.4 percentage point unadjusted productivity growth difference between firms in the upper and lower half of the ICT distribution. The estimated 0.78 percentage point difference in productivity growth from ICT induced product and marketing innovation is highly statistically significant. That the difference in ICT induced combined product and marketing innovation tendency alone can explain almost a third of the actual difference in productivity growth between the two groups is a remarkable result.

Overview
31
TABLE 3.7 GROWTH DIFFERENCE BETWEEN “ICT NON-INTENSIVE”-GROUP
AND “ICT INTENSIVE”-GROUP FROM ICT INDUCED DEMAND
INNOVATION
Product,
marketing Product, not marketing
Not product, marketing
Growth difference top-bottom from ICT induced innovation (%-points)
0.78*** -0.01 -0.25
Growth difference top-bottom in unadjusted data (%-points)
2.4 2.4 2.4
Share of growth difference explained by ICT induced innovation potential
32.5 %*** -0.4 % -10.4 %
Notes: Based on a sample of 781 firms. “ICT non-intensive” refers to those 390 firms in the sample who had lower than median ICT expenditure per employee in 2007. “ICT intensive” refers to those 391 firms in the sample who had median ICT expenditure per employee in 2007 orhigher. Growth differences top-bottom from ICT induced innovation are measured relative to group of firms who engaged in neither product, nor marketing innovation in 2007. *** refers to shares calculated on the basis of estimates that are statistically significant at the 1% level.
Source: Statistics Denmark and CEBR analysis.
To find the total effect of ICT induced demand innovation potential on productivity growth we should then add up the contributions from the three demand innovation combinations (relative to the fourth category which is neither product nor marketing innovation). But actually, the point estimates for the product innovation only and marketing innovation only groups in the growth regression are not statistically different from zero. We therefore conclude that the growth contribution from ICT induced innovation comes only from the firms who implement the product-marketing innovation combination.
The case of supply innovation
When we do the same analysis for the possible effect of supply innovation, i.e. process and organizational innovation either separately or in combination, on productivity growth we do not find any statistically significant effect from supply innovation on growth (see Chapter 4 for details). None of the 2.4 percentage point productivity growth rate difference between the ICT intensive and the ICT non-intensive group can therefore be attributed to ICT induced supply innovation.
This is a surprising result. A possible explanation is that the question put to the firms regarding their process innovation activities in the questionnaire from Statistics Denmark is specified in very broad terms: it asks about a variety of aspects of firm processes such as

Overview
32
logistics, distribution, production processes etc., all under the same heading of “process innovation”. Thus, there might still be a link between ICT, supply innovation, and productivity growth through particular aspects of process innovation.
In the subsection below, we use the alternative data set which we have constructed in order to investigate whether we can find a link between investments in ICT, supply innovation and productivity growth when we employ a narrower definition of process innovation.
3.8 Technology upgrading and organizational changes
In order to investigate whether the broad definition of process innovation in the survey from which we get the data might explain the lack of a relationship between ICT induced supply innovation potential and productivity growth we utilize the third survey mentioned in section 3.3 above. This survey contains answers to a question that specifically concerns the firms’ production activity (rather than, for example, logistics).
The two questions in the survey which we use ask firms whether they in 2007:
Had introduced new machines embedding ICT technology? Had introduced organizational changes in 2007?
ICT, supply innovation, and unadjusted productivity growth
In Table 3.8 below we group the 2,840 firms into 4 groups according to whether they answer “yes” or “no” to the two questions about implementing technological changes and about implementing organizational changes, respectively. We take the group of firms which answer “no” to both questions to be the reference group.
The table shows the connection between this form of technology upgrading and organizational changes in 2007, and productivity growth over the period 2007-2010 for the firms in our sample. The productivity growth in the group of firms who did not invest either in new machines embedding ICT technology or in organizational changes is normalized to 0.0 % and the three other individual cells show the deviation from this normalized mean for each of the other three subgroups of firms.

Overview
33
TABLE 3.8 TECHNOLOGY UPGRADING AND ORGANIZATIONAL CHANGES, UNADJUSTED RELATIVE GROWTH RATES
Organizational changes
Growth (%-points) Yes No Total
New machines embedding ICT technology
Yes 3.5 3.1 3.2
No -0.8 0.0 -0.1
Total 2.9 1.8
Notes: Based on a sample of 2,840 firms. Growth rates are measured relative to group of firms who neither invested in new machines embedding ICT technology nor organizational innovation in 2007. Sources: Statistics Denmark and CEBR analysis.
The first cell in the figure shows that the firms in the sample who answered “yes” both to the question about whether they had introduced new machines embedding ICT technology in 2007 and the question about whether they had introduced organizational changes in 2007 on average had a 3.5 percentage point higher annual productivity growth than the reference group over the period 2007-2010. The group of firms who introduced organizational changes but did not invest in technology upgrading actually had 0.8 percentage point lower average annual productivity growth over the period 2007-2010 than the reference group. Finally, the group of firms who invested in new machines embedding ICT technology but did not make organizational changes had 3.1 percentage point higher average annual productivity growth over the period 2007-2010 than the reference group.
Thus, the figure shows very clearly that firms which introduced new machines embedding ICT technology in 2007 had the highest average productivity growth the following three years of the four groups of firms, particularly if the new machines were introduced in conjunction with organizational changes.
The figure indicates that the main driver of differences in productivity growth is whether a firm had introduced new machines embedding ICT technology as the average difference in productivity growth between firms who answered “yes” and “no” to this question is 3.3 % while the average productivity growth difference between firms who answered “yes” and “no” respectively to whether they had introduced organizational changes was 1.1 %.

Overview
34
We again underscore that this result is only indicative as there are relevant factors that we have not controlled for although it does lend credence to our hypothesis of a connection between ICT-driven innovation and firm productivity growth. We now control for these other determinants of productivity growth in order to isolate the relationship between investments in new machines embedding ICT technology, organizational changes, and productivity growth.
ICT, supply innovation, and adjusted productivity growth
Table 3.9 provides an answer to the question of whether there is a connection between investments in new machines embedding ICT technology and firm productivity growth. In the table we control for the possible influence of firm industry, change in the size of the capital stock, and change in number of employees over the period 2007-2010. Formally, the table presents the results of a regression of average firm productivity growth over the period 2007-2010 on variables indicating whether there was technological upgrading in the form of investments in new machines embedding ICT-technology, and organizational change, respectively, within the firm in 2007.
The table shows that firms which implemented new machines embedding ICT technology in 2007 but did not make organizational changes on average had about 1.0 percentage point higher annual productivity growth over the period 2007-2010 than firms which neither implemented new machines embedding ICT technology nor implemented organizational changes. However, our statistical estimate of 1.0 percentage point higher annual growth is not statistically significant. Firms which only introduced organizational changes on average had 1.6 percentage point higher annual productivity growth than the baseline group but this estimate is also not statistically significant.

Overview
35
TABLE 3.9 TECHNOLOGY UPGRADING AND ORGANIZATIONAL CHANGES, ADJUSTED RELATIVE GROWTH RATES
Organizational changes
Growth (%-points) Yes No
New machines embedding ICT technology
Yes 2.1*** 1.0
No 1.6 0.0
Notes: Based on a sample of 2,840 firms. Growth rates are measured relative to group of firms who neither invested in new machines embedding ICT technology nor organizational innovationin 2007. *** implies statistical significance at the 1 % level.
Source: Statistics Denmark and CEBR analysis.
In contrast, firms which introduced both new machines embedding ICT technology and organizational changes in 2007 had on average 2.1 percentage point higher annual productivity growth over the period 2007-2010 than firms which introduced neither. This estimate is highly statistically significant.
This result is also economically highly significant as it implies that 60 % (2.1 percentage points as a share of 3.5 percentage points) of the actual productivity growth difference between the group of firms who both invested in new machines embedding ICT technology and introduced organizational changes and the group of firms who did neither can be attributed to the combination of investment in new machines embedding ICT technology and introduction of organizational changes. The rest of the difference (1.4 percentage points) is accounted for by other factors such as differences across the groups in average firm size, exporter/non-exporter status etc.
This result thus points to large productivity benefits from suitable investments in production machinery and accompanying organizational adjustments.

Descriptive analysis
36
4 Descriptive analysis
This chapter and the next provide full results and technical details of the implementation of this project. This chapter provides the motivation for and set-up of the hypotheses analyzed, an overview of the data used in the analyses, and descriptive statistics which provide a first look at what the data has to say about the hypotheses analyzed in the report. The next chapter documents the approach used for the formal statistical analyses of the stated hypotheses, and the results obtained. Some supplementary descriptive statistics, that are not central to the analyses, are relegated to an appendix.
4.1 Motivation
A high standard of living in Denmark depends on the existence of a plentiful supply of competitive and productive firms as a foundation for a large pool of high paying jobs.
Innovation results in better products that can obtain better prices in markets and more efficient production processes that lower production costs. Thus, innovation is an important determinant of competitive advantage for firms and productivity growth for society as a whole.
A widely held hypothesis holds that information and communications technology (ICT) creates a basis for effective innovation activities. Until now, this hypothesis has not been tested on Danish data. This CEBR report utilizes a unique combination of register- and survey data for Danish firms in order to remedy this omission.
The report documents that the interaction between ICT investments and innovation activities is an important driver of productivity growth in Danish firms. Specifically, we document that ICT intensive firms in general obtain a large productivity growth effect through increased potential for a combination of product and marketing innovation. We also document that a combination of organizational innovation and a specific type of ICT investments in process innovation, i.e. automation of the production process, results in higher productivity growth.
4.2 Hypothesis under investigation
One possible mechanism through which digitalization impacts innovation activity and productivity growth is that digitalization leads to product and process innovation resulting in new and better

Descriptive analysis
37
products and processes. Furthermore, digitalization may cause productivity growth through organizational innovation, for example with respect to management techniques and business models.
On a more fundamental level, the argument is that digitalization changes the way firms work with innovation, and that this change creates opportunities for permanent increases in innovation activities and productivity growth (Brynjolfsson, 2011).
Gretton, Gali and Parham (2004) for example emphasize that ICT investments are a determinant of innovation. Their argument is that ICT is a so called 'general purpose technology' which provides a platform for innovation. Therefore, ICT makes it relatively easier and cheaper to develop new productivity enhancing innovation, for example product and process innovation.
Thus, ICT is a valuable facilitator of innovation in firms because ICT facilitates reduction of transaction costs, improves internal processes, improves coordination with suppliers, slices the value chain both horizontally, vertically and geographically, and increases diversification (Koellinger, 2005).
On the basis of these proposed theoretical mechanisms we will analyze whether the interaction between new technology in the form of ICT and new knowledge, for example created through market driven innovation, is an important driver of productivity growth in Danish firms. Specifically, the analyses will focus on obtaining answers to the following questions:
Is ICT intensity an important driver of innovation in Danish firms?
Is the interaction between ICT investments and innovation activities important for the productivity of Danish firms?
The descriptive analysis in this chapter will not give definitive answers to the questions posed above. We perform more sophisticated statistical analysis in the following chapter to deliver better answers to how much extra value added can be obtained from investments in ICT.
The descriptive analysis in this chapter should therefore be viewed as a first few steps down the path that will lead us to answers to these two questions. We will argue that our data can say something useful about our two key questions, and we will show that the results imply

Descriptive analysis
38
that there is reason to believe that the answer to both questions is “yes”.
4.3 Approach to descriptive statistics
This chapter presents an overview of our data sample including the specific survey questions posed to the firms and the number of observations from each of the three surveys used to address the questions on innovation activities, ICT expenditure and productivity.
We present various characteristics of the firms used in the analysis such as average number of employees, average expenditure on ICT, and the share of firms in the sample that earn at least some of their revenue from exports. We compare the characteristics of the firms in our sample with the characteristics of the full population of Danish firms and show the coverage of our sample in terms of share of total revenue or total number of employees in Danish firms.
We take a preliminary look at connections between ICT expenditure and innovation activity by presenting simple correlations in graphic or tabular form. Specifically, we descriptively investigate a connection between characteristics such as ICT expenditure per employee and innovation activity within the firm. These investigations concern the first of our two questions.
Finally, we take a preliminarily address our second question concerning whether a connection exists between innovation activities within the firm and subsequent firm productivity growth.
4.4 The Data
The surveys
To carry out the analyses we use different samples for different questions. The reason is that we rely on three different surveys containing answers from Danish firms to different questions needed to perform our analyses. The main characteristics of the three surveys are presented in Table 4.1 on page 40. The surveys are, in short name format, FUI, VITA, and VITU. These three surveys are matched with very rich employer-employee-matched registry data. All data are from Statistics Denmark.

Descriptive analysis
39
The FUI1 survey is an annual questionnaires in which firms are asked about their R&D and innovation activities. We specifically focus on questions put to the firms about four types of innovation activity: Product innovation, process innovation, organizational innovation, and marketing innovation.
The VITA2 survey is an annual questionnaire in which firms answer questions about their use of IT. However, and more importantly to us, the survey covers three questions about the firms’ technology upgrading and organizational changes in 2007 and onwards. These three questions have been included in the questionnaire upon request from CEBR.
The VITU3 survey is an annual questionnaire in which firms answer questions about their ICT expenditures. We only use information provided on total ICT expenditures, however.
Throughout, we use information from the FUI and VITU questionnaires on innovation activities and ICT-spending together with detailed registry data from Statistics Denmark on firm accounting numbers and employee education mix to answer our two key questions. Information from the VITA questionnaire on technology upgrading and organizational strategy activities will be used to further refine and qualify our answer to particular aspects of the two questions above.
1 Danish abbreviation for ”R&D and Innovation” (”Forskning, udvikling og innovation”)
2 Danish abbreviation for ”IT-use in Firms” (”IT-anvendelse i virksomhederne”)
3 Danish abbreviation for ”Firm IT-expenses” (”IT-udgifter i virksomhederne”)

Descriptive analysis
40
TABLE 4.1 THE SURVEY DATA FUI survey
Coverage Survey of firm level R&D and Innovation Statistics
Time span 2007-2010, annual frequency
Question: Has the firm during the last year engaged in… (yes/no answers)
1) Product innovation? 2) Process innovation? 3) Organizational innovation? 4) Marketing innovation?
Additional information
The survey stretches discontinuously back to 2004 but only for some questions.
VITA survey
Coverage
Survey of firm level IT usage and coverage, and questions asked specifically upon request from CEBR about organizational strategies involving reorganization of labor resources and technological upgrading
Time span 2007-2010, annual frequency
Question: Has the firm during the last year… (yes/no answers)
1) TECH Invested in new machinery embedding ICT?
2) NOTECH Invested in new machinery not embedding ICT?
3) OC Made organizational changes involving reorganization of labor resources?
Additional information
We also ask sub-questions to each of the three questions above about impact on skilled and tertiary labor resources, respectively
The survey stretches discontinuously back to 1999but only for some questions.
VITU
Coverage Survey of firm level expenditures on ICT
Time span 2007-2010, annual frequency
Question: During the last year, what was the firms…
Total expenditure in Danish kroner on ICT (specifically: Computers and other ICT equipment)?
Additional information
The survey stretches discontinuously back to 2001 but only for some questions.
Notes: Some of the surveys stretch further back continuously or discontinuously. However, in the analyses performed we effectively use only survey data from 2007-2010.
Source: Statistics Denmark and CEBR

Descriptive analysis
41
Firm characteristics in the sample data
Before moving on to the description of the key variables of the analysis in the next section - specifically innovation activities, technology upgrading, organizational strategy activities, and ICT-spending - we continue with the description of the samples that result from the surveys and which we base our analyses upon.
Table 4.2 sums up certain characteristics of firms in the sample. The upper half of the table compares all firms in the sample to the full population of firms in Denmark. The lower half of the table looks at firms in the sample who have more than 50 employees and compares them to the full population of firms in Denmark who have more than 50 employees. For practical reasons we have grouped the FUI (innovation) and VITU (ICT expenditure) survey samples together. The two samples are used jointly in one of our main analyses.

Descriptive analysis
42
TABLE 4.2 THE SAMPLES – MEANS AND SHARE OF ALL FIRM ACTIVITY IN
2010
Mean comparison FUI + VITU VITA Full population
of firms
Number of firms 1,165 3.140 271,346
Average number of fulltime employees
297 123 16
Exporter status (%) 70 % 61 % 11 %
Fulltime high-skilled labor % of fulltime firm labor force
24 % 17 % 20 %
Share of full population
revenue
Revenue (M DKK) 926 333 35 %
Firms with 50+ employees
Number of firms 878 1,253 2,439
Share of revenue
Revenue (M DKK) 1,177 758 71 %
Notes: The number of firms in the sample is the effective number of observations in the formalanalyses performed in chapter 5. The loss of observations from the sample totals (about 4,500 firms in VITA and FUI) is inevitable due to estimation method requirements.Skill-ratio is based on number of unskilled fulltime employees relative to the number offulltime employees
Source: Statistics Denmark and CEBR
The three surveys do not amount to a representative sample of Danish firms with respect to key characteristics, e.g. size distribution as measured by employment or revenue. The 1,165 firms in the FUI+VITU sample are, on average, large, employing about 300 employees and earning revenues of above 900M DKK. This is in stark contrast to the full population of Danish firms as registered firms in Denmark employ, on average, 16 employees. The 3,140 firms in the VITA sample are also large, on average, with 123 employees and revenues of 333M DKK.
Firms which obtain at least some of their revenue from exports are also heavily overrepresented in our sample as 70 % of the firms in the
Descriptive analysis
43
FUI+VITU sample and 61 % of the VITA sample are exporters compared to only 11 % in the full population of Danish firms. Therefore, generalizing the results in this report to the full population of Danish firms is not possible without making additional assumptions.
On a more positive note, the high-skilled share of the labor force4 in the firms in the sample is 24 % in the FUI+VITU sample and 17 % in the VITA sample which is comparable to the 20 % high-skilled labor share in the full population of Danish firms.
In addition, the sample data do cover 35 % of all economic activity in the private sector in Denmark.5
If we only look at firms with more than 50 employees, the 878 firms in the FUI+VITU sample and the 1,253 firms in the VITA sample account for a large share of this section of Danish firms as they account for 71 % of the total revenue of this section of the full population of Danish firms. Therefore, the surveys cover a representative sample of this segment of the population of Danish firms.
Interrelation of firm characteristics
The firm characteristics that we center on in this report, i.e. innovation activity, ICT spending, technological change, and productivity are all related to general firm characteristics, such as size, exporter status, industry, educational mix, and size of the capital. For example, ICT spending per employee varies with firm size and is more pronounced among exporters and more in some industries than others.6
Thus, when we move to the formal analysis, we must eliminate the influence of these general firm characteristics (firm size, exporter status etc.) on our estimates of whether a firm is likely to be innovative or not depending on its spending on ICT. The same principle goes for estimates of the impact of ICT driven innovation on productivity growth.
4 The measure is constructed as high-skilled, fulltime-employed labor relative to the number of fulltime employees (employees with at least a bachelor’s degree are classified as “high-skilled”).
5 The sample statistics in Table 4.2 are made up of the effective number of observations in the formal analyses performed in chapter 5. The full sample for 2010 includes about 4-4,500 firms covering 40-50 percent of economic activity (according to total revenue).
6 Some descriptive statistics that show the relationship between ICT expenditure and innovation on the one hand and firm size, exporter status and industry on the other hand are presented in Appendix A.

Descriptive analysis
44
In this chapter, though, we display - and comment on - simple correlations that do not control for the influence of these characteristics in order to keep the exposition simple and to the point.
4.5 Innovation Activities and ICT expenditures
The first of our two main questions addresses whether there is a connection at the firm level between expenditure on ICT and a given innovation activity (product, process, marketing, or organizational). The formal analysis in chapter 4 of the report shows that the answer to this question is “yes”. In this section we informally explore this question based on information obtained from studying relationships between key variables used in the formal analysis.
Figure 4.1 and Figure 4.2 give an overview of innovation activities in the period 2007-2010 of the firms in our sample. Figure 4.1 shows the share of firms involved in a given innovation activity in each of the four years while Figure 4.2 shows the distribution of firms involved in a given number of innovation activities.
In Figure 4.1 we see that across the period 2007-2010, the incidence of two of the four innovation types, namely organizational and marketing innovation is relatively stable. In 2007 approximately 46 % of firms were engaged in organizational innovation and the incidence is at the same level through 2010. The incidence of marketing innovation is also stable at around 38 % during all four years even though there is a slightly lower incidence of around 36 % in 2008.
In contrast, the incidence of product and process innovation changes notably over the period 2007-2010. The incidence of product innovation declines from around 23-24 % in 2007-8 to just below 20 % in 2010 while the incidence of process innovation increases markedly, from around 30 % in 2007 to 38 % in 2010.

Descriptive analysis
45
FIGURE 4.1 SHARE OF FIRMS ENGAGED IN A GIVEN INNOVATION TYPE, 2007-2010
Notes: Based on 4,446 observations.
Source: CEBR estimates using register data and survey data from Statistics Denmark.
Figure 4.2 below shows the average frequency across the period 2007-2010 in the sample with which we observe that a firm engages in a given number of innovation types. The figure shows that, on average, 37.7 % of the firms in our sample do not engage in any of the four innovation types in any given year. 18.8 % of firms engage in one of the four innovation types, 18.1 % engage in two types of innovation, 14.7 % engage in three innovation types, while 10.7 % of the firms engage in all four innovation types. From a purely technical point of view, there is therefore ample scope for increased innovation activity in Danish firms.
2030
4050
%
2007 2008 2009 2010Year
Product innovation Process innovationOrganizational innovation Marketing innovation

Descriptive analysis
46
FIGURE 4.2 PERCENTAGES OF FIRMS ENGAGED IN A GIVEN NUMBER OF
INNOVATION ACTIVITIES, AVERAGE 2007-2010
Notes: Based on 4,446 observations.
Source: CEBR estimates using register data and survey data from Statistics Denmark.
These numbers imply that every year 62 % of the firms in the sample are engaged in at least one of the four innovation activities. We will get back to this fact below.
Now we turn to the relationship between innovation activity and firm ICT expenditure. As discussed above, we expect a positive relationship between ICT expenditures and innovation activity.
Figure 4.3 to Figure 4.6 show firm ICT expenditure per employee separately for each of the four innovation types where we have grouped the firms in the sample into five aggregate industries. With the exception of the industry “Finance, Insurance & Real Estate” (17% of the sample observations), the general picture is that firms which engage in a given innovation activity have higher ICT expenditure per employee than firms which do not. Thus, from simple cross plots of ICT expenditure and innovation activity, the conclusion is clearly that most firms (83 % of the sample according to our industry aggregation) have higher ICT expenditure per employee if they are innovative.
37.7
18.8 18.1
14.7
10.7
010
2030
40
%
0 1 2 3 4

Descriptive analysis
47
FIGURE 4.3 ICT EXPENDITURE AND
PRODUCT INNOVATION
ACROSS INDUSTRIES
FIGURE 4.4 ICT EXPENDITURE AND
MARKETING
INNOVATION ACROSS
INDUSTRIES
Notes: Based on 1,165 observations. Notes: Based on 1,165 observations.
Source: CEBR estimates using register data and survey data from Statistics Denmark.
Source: CEBR estimates using register data and survey data from Statistics Denmark.
FIGURE 4.5 ICT EXPENDITURE AND
PROCESS INNOVATION
ACROSS INDUSTRIES
FIGURE 4.6 ICT EXPENDITURE AND
ORGANIZATIONAL
INNOVATION ACROSS
INDUSTRIES
Notes: Based on 1,165 observations. Notes: Based on 1,165 observations.
Source: CEBR estimates using register data and survey data from Statistics Denmark.
Source: CEBR estimates using register data and survey data from Statistics Denmark.
Until we have performed formal analyses that take into account other reasons as to why firms are innovative, we cannot confirm that there is a general tendency for innovative firms to spend more on ICT per employee than non-innovative firms. As noted above, other reasons that may account for this correlation include firm size (capacity to be innovative), exporter status (necessity to compete on the global market), the presence of skilled labor (well-educated employees are more likely to foster an innovative environment), and last, but not least, in which industry a firm operates as innovation activity differs considerably across industries (see Figure 4.7). Eliminating these effects on the innovation probabilities is therefore important in order
18
3728
4132
51
115
58
72
116
050
100
150
DK
R 1
000
Prim. & Constr.
Manufacturing
Retail & Bus. Service
Fin., Ins., R
eal Est.
Trans., Comm. & Energy
No Yes No Yes No Yes No Yes No Yes
18
30 2935
28
47
59
108
137
52
050
100
150
DK
R 1
000
Prim. & Constr.
Manufacturing
Retail & Bus. Service
Trans., Comm. & Energy
Fin., Ins., R
eal Est.No Yes No Yes No Yes No Yes No Yes
18
28 2836
3239
62
106
133
62
05
01
00
15
0
DK
R 1
00
0
Prim. & Constr.
Manufacturing
Retail & Bus. Service
Trans., Comm. & Energy
Fin., Ins., R
eal Est.No Yes No Yes No Yes No Yes No Yes
15
3026
3731
40
61
90
152
63
050
100
150
DK
R 1
000
Prim. & Constr.
Manufacturing
Retail & Bus. Service
Trans., Comm. & Energy
Fin., Ins., R
eal Est.No Yes No Yes No Yes No Yes No Yes
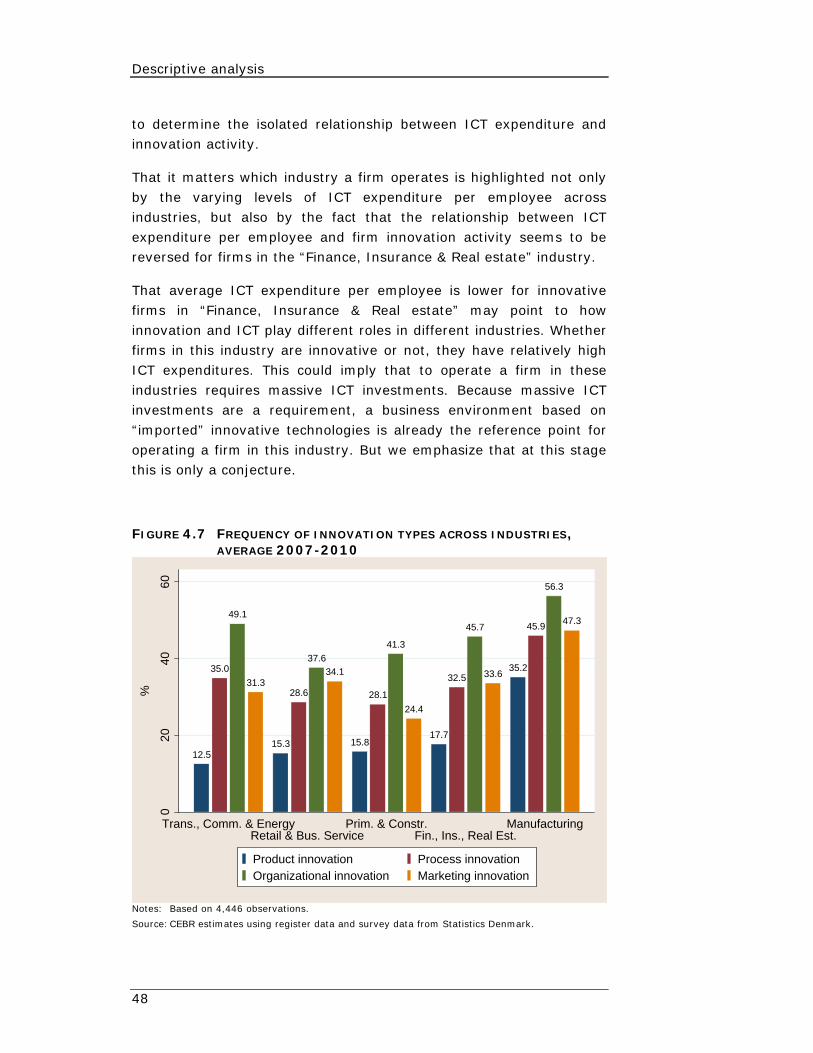
Descriptive analysis
48
to determine the isolated relationship between ICT expenditure and innovation activity.
That it matters which industry a firm operates is highlighted not only by the varying levels of ICT expenditure per employee across industries, but also by the fact that the relationship between ICT expenditure per employee and firm innovation activity seems to be reversed for firms in the “Finance, Insurance & Real estate” industry.
That average ICT expenditure per employee is lower for innovative firms in “Finance, Insurance & Real estate” may point to how innovation and ICT play different roles in different industries. Whether firms in this industry are innovative or not, they have relatively high ICT expenditures. This could imply that to operate a firm in these industries requires massive ICT investments. Because massive ICT investments are a requirement, a business environment based on “imported” innovative technologies is already the reference point for operating a firm in this industry. But we emphasize that at this stage this is only a conjecture.
FIGURE 4.7 FREQUENCY OF INNOVATION TYPES ACROSS INDUSTRIES, AVERAGE 2007-2010
Notes: Based on 4,446 observations.
Source: CEBR estimates using register data and survey data from Statistics Denmark.
12.5
35.0
49.1
31.3
15.3
28.6
37.6
34.1
15.8
28.1
41.3
24.4
17.7
32.5
45.7
33.635.2
45.9
56.3
47.3
020
4060
%
Trans., Comm. & EnergyRetail & Bus. Service
Prim. & Constr.Fin., Ins., Real Est.
Manufacturing
Product innovation Process innovationOrganizational innovation Marketing innovation

Descriptive analysis
49
We noted earlier that in a given year of the sample period 62 % of the firms are engaged in at least one innovation activity. However, if we look at each innovation activity separately, the only case where more than half of the firms are engaged in a particular innovation type is “organizational innovation” in the manufacturing industry (see Figure 4.7). Here 56 % of all manufacturing firms were engaged in organizational innovation. This partly alleviates the concern that only a certain group of firms with specific characteristics are innovative because the majority of firms do actually not have a particular innovation type and only relatively few firms have all types (Figure 4.2).
In fact, looking at Figure 4.2 again, but from a different angle, we note that in a given year 56 % of the firms are not engaged in innovation or are only engaged in one innovation activity while 11.4 % have all four activities.
4.6 Productivity growth
Ultimately, our interest centers on whether ICT driven innovation, technology upgrading, organizational change etc. result in productivity growth within the firm. This section offers some descriptive statistics which provide clues to our two central questions:
Is ICT intensity an important driver of innovation in Danish firms?
Is the interaction between ICT investments and innovation activities important for the productivity of Danish firms?
Based on the hypotheses under investigation our main interest is in data on ICT expenditure, innovation activity and productivity growth. We have therefore constructed a data set with information on firm ICT expenditure per employee in 2007, four possible innovation activities within Danish firms in 2007 (product innovation, process innovation, marketing innovation, and organizational innovation), and average annual productivity growth for each firm over the period 2007-2010.
Combining the survey and register data we can construct a subsample of 781 firms from the full data set used in the previous chapter which we will use for most of the statistical analyses.
ICT-driven innovation and productivity growth
A firm can become more productive – i.e. raise the value of a unit of production relative to the cost of a unit of production - in two basic

Descriptive analysis
50
ways: Through increased demand which allows the firm to charge higher prices for any given number of units of its products or through lower supply costs of any given number of units of its products.
The four innovation activities of the firms that are surveyed in our data can be grouped into two categories which we label Demand innovation and Supply innovation:
Product and Marketing innovation aim to affect customers’ demand for the firms’ output. In economists’ terms, Product and Marketing innovation aim to shift the demand curve that the firm faces outwards, i.e. to increase the demand for any given price that the firm demands for its products. For the purposes of this report, we therefore group Product and Marketing innovation together under the heading “Demand Innovation”.
Process and Organizational innovation aim to affect the efficiency with which the firm is able to satisfy customer’s demand for the firms’ output. Process and Organizational innovation thus aim to shift the supply curve of the firm downwards, i.e. to decrease the cost of supplying any given amount of products to customers. For the purposes of this report, we therefore group Process and Organizational innovation together under the heading “Supply Innovation”.
In this section we look at the connection between innovation and ICT expenditure in 2007 on the one hand and productivity growth over the period 2007-2010 on the other hand. This timing of the observations alleviates concerns about reverse causality from productivity to ICT expenditure and innovation, and thus brings us closer to a causal interpretation of the relationship between innovation, ICT expenditure, and productivity growth.
With respect to the presentation of the results of the analyses, the main idea is to construct two separate groups of firms according to their level of ICT expenditure per employee and then compare these two groups with respect to innovation activity and productivity growth.
We sort the firms according to ICT expenditure per employee and find the median firm with respect to amount of ICT expenditure per employee in 2007, i.e. the firm which had higher ICT expenditure than one half of the firms in the sample and lower ICT expenditure than the other half of the firms in the sample. We then construct two

Descriptive analysis
51
groups of firms: One group with those firms with lower ICT expenditure per employee than the median firm and one group with those firms with higher ICT expenditure per employee than the median firm (the median firm itself is placed in the high ICT expenditure group so that there are 390 firms in the ICT non-intensive group and 391 firms in the ICT intensive group).
We will also use data from a third survey conducted by Statistics Denmark together with register data to construct a data set with 2,840 firms in order to further explore one particular aspect of the ICT, innovation, productivity growth nexus, namely the relationship between a particular type of ICT investment, process and organizational innovation, and productivity growth.
Table 4.3 shows the connection between demand innovation, ICT expenditure per employee and productivity growth. The upper rows of the cells in the left hand side of the table show the distribution of firms according to whether or not they engage in product innovation and whether they have larger than average ICT expenditure per employee. The lower rows indicate the average annual productivity growth among the firms in the group relative to the average annual productivity growth across all firms in the sample.
For example, the table shows that 13 % of the firms in the sample engaged in product innovation in 2007 and were in the top half of firms with respect to ICT expenditure per employee. These firms had, on average, 5.3 percentage points higher annual productivity growth over the period 2007-2010 than the full sample of firms. The table thus shows a stark contrast between firms that engaged in product innovation and had higher than average ICT expenditures and the other firms in the sample as all the three other groups in the table had lower than average annual productivity growth relative to the full sample of firms.

Descriptive analysis
52
TABLE 4.3 DEMAND INNOVATION
Notes: The numbers in the lower row in each cell refers to productivity growth rate for each
segment of the sample of firms relative to the full sample. Thus, firms which engaged inproduct innovation and were in the ICT intensive with respect to ICT expenditure per employee in 2007 had, on average, 5.3 percentage points higher annual productivity growth over the period 2007-2010 than the full sample of firms. Based on 897 observations.
Source: CEBR estimates using register data and survey data from Statistics Denmark.
The contrast between groups of firms is a little less stark in the right hand side of the table which shows the connection between marketing innovation, ICT expenditures, and productivity but it is still very strong. The 23 % of the firms in the sample which engaged in marketing innovation in 2007 and were in the top half of firms with respect to ICT expenditure per employee had, on average, 3.5 percentage points higher annual productivity growth over the period 2007-2010 than the full sample of firms while all the three other groups in the table had lower than average productivity growth relative to the full sample of firms.
Thus, the table clearly indicates that there is a positive connection between demand innovation, ICT expenditures, and productivity growth. This finding will be further scrutinized in the next chapter.
Table 4.4 below focuses on supply innovation. The left hand side of the table groups the firms in our sample according to whether they engaged in process innovation in 2007 and whether they were in the top half of firms with respect to ICT expenditure per employee. The same picture as for product and marketing innovation emerges, namely that firms with higher than median ICT expenditure per employee, engaged in supply innovation, had higher than average annual productivity growth over the period 2007-2010 than other firms in our sample.
11 40 17 34
-0,4 -1,1 -0,9 -1,0
13 36 23 26
5,3 -0,6 3,5 -1,2
yes noyes no
Product innovation Marketing innovation
ICT-expenditure per employee
Productivity growth rate in %
Distribution of answers in %
Bottom 50%
Top 50%

Descriptive analysis
53
TABLE 4.4 SUPPLY INNOVATION
Notes: The numbers in the lower row in each cell refers to productivity growth rate for each
segment of the sample of firms relative to the full sample. I.e. the average productivity growth across all firms in the sample is normalized to 0 and the individual cells show thedeviation from the normalized mean for each subgroup. Thus, firms which engage in process innovation and are in the ICT intensive with respect to ICT expenditure per employee had, on average, 4,6 % higher annual productivity growth than the full sample of firms. Based on 897 observations.
Source: CEBR estimates using register data and survey data from Statistics Denmark.
The table shows that with respect to process innovation the 17 % of firms with higher than median ICT expenditure and process innovation in 2007 had fully 4.6 percentage points higher average annual productivity growth over the period 2007-2010 than average across the sample while the other three groups had lower than average annual productivity growth relative to the full sample of firms.
The table also shows that with respect to organizational innovation, the 26 % of firms with higher than median ICT expenditure and organizational innovation in 2007 had 2.2 percentage points higher average annual productivity growth over the period 2007-2010 than average across the sample while again the other three groups had lower than average annual productivity growth relative to the full sample of firms.
Thus, the clear conclusion from these descriptive statistics is that firms which engaged in innovation and had large ICT expenditures per employee in 2007 also had higher annual productivity growth over the period 2007-2010 than other firms. In the next chapter we will investigate whether this relationship still exists when we control for firm characteristics such as which industry the firm operates in, whether it is an exporter or not, the size of the firm, and the share of high skilled amongst employees in the firm.
14 36 21 30
-0,3 -1,2 -0,9 -1,0
17 32 26 23
4,6 -1,1 2,2 -0,3
ICT-expenditure per employee
Bottom 50%
Top 50%
Distribution of answers in %
Productivity growth rate in % yes no yes no
Process innovation Organ. innovation

Descriptive analysis
54
Technology upgrading, organizational change, and productivity growth
Here, we use information from the VITA survey to investigate a particular aspect of the connection between process innovation, organizational innovation, and productivity growth. In particular, Table 4.5 below shows the distribution of firms which have answered yes to a question whether they have introduced new plants, machinery or equipment that includes new ICT technology in 2007 and the average annual productivity growth of firms across the distribution in 2007-2010.
The numbers in the upper row in each cell show the fraction of firms in the relevant category. The numbers in the lower row show the average annual productivity growth rate deviation, in percentage points, from the overall average productivity growth rate.
The upper half of the first cell in the figure shows that 22 % of the firms in the sample both answered “yes” to a question about whether they had introduced new machines embedding ICT technology in 2007 and a question about whether they had introduced organizational changes in 2007. These firms had, on average, 1.4 percentage points higher annual productivity growth than the average across all firms in the sample over the period 2007-2010.
Similarly, firms that had introduced neither new machinery embedding ICT technology nor organizational changes had, on average, 2.1 percentage points lower annual productivity growth than the average across all firms in the sample over the period 2007-2010. Table 4.5 also shows that the 25.7 % of the firms in the sample that introduced organizational changes had, on average, an annual productivity growth of 0.8 percentage points above the average annual productivity growth in the sample.

Descriptive analysis
55
TABLE 4.5 TECHNOLOGY UPGRADING AND ORGANIZATIONAL
CHANGES
Notes: The numbers in the lower row in each cell indicate productivity growth relative to the average productivity growth across all firms in the sample. I.e. the average productivity growth across all firms in the sample is normalized to 0 and the individual cells show the deviation from the normalized mean for each subgroup. Based on 2,840 observations.
Source: CEBR estimates using register data and survey data from Statistics Denmark.
Thus, Table 4.5 very clearly shows that firms introducing new machines embedding ICT technology in 2007 had the highest average productivity growth rate the following three years, and particularly if the new machines were introduced in conjunction with organizational changes.
The table indicates that the main driver of differences in productivity growth is whether a firm had introduced new machines embedding ICT technology as the average productivity growth rate difference between firms who answered “yes” and “no” to this question is 3.3 percentage points. The average productivity growth rate difference between firms who answered “yes” and “no” to having introduced organizational changes was smaller, 1.1 percentage points.
Once again, we underscore that this result is only indicative as there are other relevant factors that we have not controlled for. However, these indicative results do lend credence to our hypothesis of a connection between ICT-driven innovation and firm productivity growth. A more thorough investigation of this link will be carried out
Organizational changes
22.0 44.3 66.2
1.4% 1.0% 1.1%
3.7 30.0 33.8
-2.9% -2.1% -2.2%
25.7 74.3 100.0
0.8% -0.3% 0%
New machines embedding technology (TECH)
Productivity growth
rate in %
Distribution of answers in %
Total
Total
yes
no
yes no

Descriptive analysis
56
in the next chapter, where we will subject this hypothesis to formal statistical tests.

Quantitative analysis
57
5 Quantitative analysis
This chapter documents the approach used for the analyses of the stated hypotheses, the statistical estimation method, and the results obtained from the formal statistical analyses of the two central questions in this report:
Is ICT intensity an important driver of innovation in Danish firms?
Is the interaction between ICT investments and innovation activities important for the productivity of Danish firms?
5.1 Approach to the analyses
In this chapter we use a two-step procedure to investigate whether we can attribute part of the difference in growth performance between the ICT intensive group of firms and the ICT non-intensive group of firms identified in the previous chapter to differences in the average ICT expenditure per employee and innovation activity amongst them.
The main idea in the statistical analyses is to control for the influence of other firm characteristics that may determine innovation potential and productivity growth in order to isolate the relationship between ICT expenditure, innovation activity, and productivity growth. In addition to the data on the main variables, we therefore have data on firm characteristics that may also influence innovation activity and productivity growth such as firm size, exporter status etc.
Regression models
We apply two types of statistical models to our sample of firm-level data in order to generate answers to the two questions above. These two model types are:
Probability regression models Long difference growth regression models
We apply probability regression models to answer the first question above about the link between ICT expenditure and innovation activities in Danish firms, and we apply growth regression models to answer the second question above about the link between ICT induced innovation and subsequent productivity growth in Danish firm.
The probability regression models come in two varieties, namely single probability models and double probability models. In all growth

Quantitative analysis
58
estimations, on the other hand, we use the same basic regression, only varying the choice of explanatory variables that describe firm innovation. These three types of models are detailed below.
The probability model
First, we investigate whether intensive use of ICT leads to higher potential for engaging in one or more of the four different innovation activities: Product innovation, process innovation, marketing innovation, and organizational innovation.
We utilize a statistical model – a so called probability model - to analyze the relationship between ICT investments and innovation activities. This model estimates a firm’s innovation potential based on observable firm characteristics such as ICT investments, size, education mix of employees etc.
Our outcome variable measuring innovation activity is a zero-one variable that indicates whether a firm is engaged in a specific innovation activity (in which case the indicator variable equals 1) or not (in which case the indicator variable equals 0).
The probability models serve two purposes. One purpose is to directly interpret the estimate of the impact of ICT intensity on innovation activity (i.e. the first of the two questions). The other purpose is to serve as a first stage in a two-stage estimation procedure to find answers to the impact of ICT induced innovation on productivity growth (i.e. the second of the two questions).
First, we separately estimate four probit models, i.e. one for each innovation type using the following specification:
Pr 1| , Φ β
In the model equation, the subscript i refers to a specific firm at time t.
The dependent variable, , is an indicator variable taking on the value zero when a firm answers “no” to the question about whether it is engaged in the specific innovation activity and one if the firm answers “yes”.
The explanatory variable, that we are interested in, is firm ICT intensity (measured as the logarithm of ICT spending per employee and denoted in the model equation).
Quantitative analysis
59
We use firm level control variables (number of employees, educational mix of the employees, exporter status, and capital intensity), summarized in the model equation variable , to isolate the effect of the ICT driven part of firm innovation.
In order to further isolate the effect of the ICT driven part of firm innovation we also control for industry ( ) and time fixed effects ( ). The industry fixed effects control for the fact that firms in different industries in general may have different innovation activity levels while the time fixed effects control for the fact that innovation activity in the sample as a whole may change over time.
Based on the estimated parameters, we can calculate the impact of increasing ICT intensity on a firm’s innovation probability (i.e. so called average partial effects) and predicted probabilities of firm innovation at various levels of ICT intensity.
We refer to the predicted probabilities as ICT induced innovation potential, and we specifically calculate the average innovation potentials for the group of firms below the median and the group of firms above the median. Later on, we use these estimates of firm ICT induced innovation potential in the two-stage estimation procedure.
The bivariate probit model
When we estimate four probit models, one for each innovation type, we treat each of the four innovation types as if they are independent of each other. The results above which are established by analysis of each of the four innovation activities separately can be criticized for not taking into account that if a firm is engaged in one innovation activity it tends to also be engaged in one or more of the other innovation activities. If this is the case, we cannot separate the effects of the individual innovation activities from each other.
We therefore modify our approach slightly in order to account for this possibility of interrelated effects. As detailed in the previous chapter, the four innovation activities of the firms that are surveyed in our data can be grouped into two distinct categories labeled Demand innovation (product and marketing innovation) and Supply innovation (process and organizational innovation)
Based on these considerations we analyze the relationship between ICT expenditure, the two demand innovation activities, and productivity growth together, and the relationship between ICT

Quantitative analysis
60
expenditure, the two supply innovation activities, and productivity growth together.
With two innovation activities under consideration simultaneously, the procedure is in principle the same as for only one innovation activity. But it gets a little bit more involved as firms do not choose between either engaging in a specific innovation activity or not but rather choose between four options. With respect to demand innovation they can choose to engage in:
Both product and marketing innovation Product innovation but not marketing innovation Marketing innovation but not product innovation Neither product innovation nor marketing innovation
We estimate two separate bivariate probit models – one for the two demand innovation activities and one for the two supply innovation activities. The bivariate probit model accommodates the simultaneous choice with respect to two innovation activities and therefore takes into account the pair wise interaction among the innovation activities.
This model has the following specification:
Pr 1, 1| , Φ
In this model equation and are the two types of firm innovation indicators within each of the two main innovation categories (i.e. demand or supply). The control variables are the same as for the single probability model above.
From the estimated parameters of the models we then estimate conditional, predicted probabilities for each of the four possible outcomes for a firm that we listed above.
We refer to predicted probabilities as a firm’s predicted ICT induced innovation potential. We use these estimated firm innovation potentials in our two-stage estimations of the effect of ICT induced innovation on productivity growth.
Growth regression models concerning growth and innovation
We then investigate whether differences in innovation potential leads to differences in productivity growth. In order to analyze the relationship between innovation potential and productivity growth, we utilize another statistical model – a so called growth model - which explains a firm’s productivity growth based on the estimated

Quantitative analysis
61
innovation potential from the first step in the statistical analysis. As for the analyses in the first step, we control for the influence of other observable factors such as the size of the firm’s capital stock and education mix of the employees.
All productivity growth estimations are carried out using a so called long difference regression from 2007-2010 – effectively a cross-sectional analysis. The growth estimations are based on the following growth model equation:
Δ ln VA Δ ln K Δ ln L
,
,
This is a growth regression model, where the dependent variable, Δ ln VA , is the growth rate of firm i between 2007 and 2010 (measured as the difference between the logarithm of the value added of the firm in 2010 and 2007)7, while K is the capital stock, and L is the labor stock (measured as the number of full-time employees).
Educational mix refers to three control variables for three different shares of higher education among the firm’s employees: 1) Technical, health and natural sciences, 2) social sciences, and 3) arts and human sciences. We also control for industry trend differences during the period 2007-2010.
The innovation variable(s) can be the zero-one indicators alone (innovation or not), a combination of the zero-one indicators8 or the innovation potential (predicted probabilities from the probability models).
The two-stage procedure uses estimated innovation potential from the probability models as a proxy for ICT induced innovation in order to estimate the effect of ICT induced innovation on productivity growth, i.e. we use the estimated ICT induced innovation potential for each firm as the explanatory innovation variable(s) in the growth regression model.
7 We transform the three-year long difference growth rates into annualized growth rates, but this
transformation does not compromise the estimated parameters.
8 For example product and marketing are two zero-one variables. When we re-organize firms

Quantitative analysis
62
Technology upgrading, organizational changes, and growth
The survey on firm ICT expenditure covers activities that enhance the technology level of firms, and the survey on innovation activities covers innovation activities on a rather broad level. From the VITA survey we can obtain information on:
Whether the firms in the survey introduced new machines embedding ICT-technology
Whether they made organizational changes.
Thus, these two questions more specifically address issues concerning the firm’s production process itself than the innovation survey where the question in the survey about “process innovation” comprises issues such as logistics, distribution etc. in addition to the production process.
The growth regression model we use to estimate the relationship between firm productivity growth and the introduction of new machines embedding ICT-technology and/or organizational changes is identical to the growth regression model presented above, except that we substitute a new set of variables for the innovation variable(s).
We create this new set of variables from two zero-one indicator variables. The first variable indicates whether a firm introduced new machines or not. The other variable indicates whether a firm made organizational changes or not. From these two, we can create four outcomes variables:
1) Technology upgrading and organizational changes 2) Technology upgrading but no organizational changes 3) Organizational changes but no technology upgrading 4) Neither technology upgrading nor organizational changes
Just as above, we reorganize firms into these outcome categories to circumvent problems with multicollinearity.
5.2 Results
This section presents results from application of our regression models to the data. The results are presented in the following order:
First, we present the results from the probability model estimations on the link between ICT and each innovation activity separately.

Quantitative analysis
63
Second, we move on to growth estimation results linking each innovation activity and productivity growth.
Third, we expand our analysis to the two-stage estimations that utilize the probability model estimates (first stage) in the growth estimations (second stage) in order to estimate how much of the difference in growth performance between the ICT intensive group of firms and the ICT non-intensive group of firms can be attributed to differences in average ICT expenditure per employee and innovation potential.
This chronology is then repeated for the results where we combine the four innovation activities into two pairs, namely demand innovation (product and marketing innovation) on the one hand, and supply innovation (process and organizational innovation) on the other.
Innovation potential and productivity growth
This subsection concentrates on the results of the link between innovation activity and growth.
Table 5.1 presents the results from a regression of average annual firm productivity growth from 2007 to 2010 on zero-one variables indicating whether the firm was engaged in a specific innovation activity in 2007.
The first column shows that firms in our sample that were engaged in product innovation in 2007, on average, had 3.3 percentage points higher annual productivity growth during the period 2007-2010 compared to firms not engaged in product innovation. The estimate is statistically highly significant. Columns 2 to 4 show that firms engaged in the other three innovation activities in 2007 also grew faster, on average, over the period 2007 to 2010, but the point estimates are somewhat lower than for product innovation. These results are in line with other studies of the relationship between innovation and productivity growth (Hall, 2011, page 187).
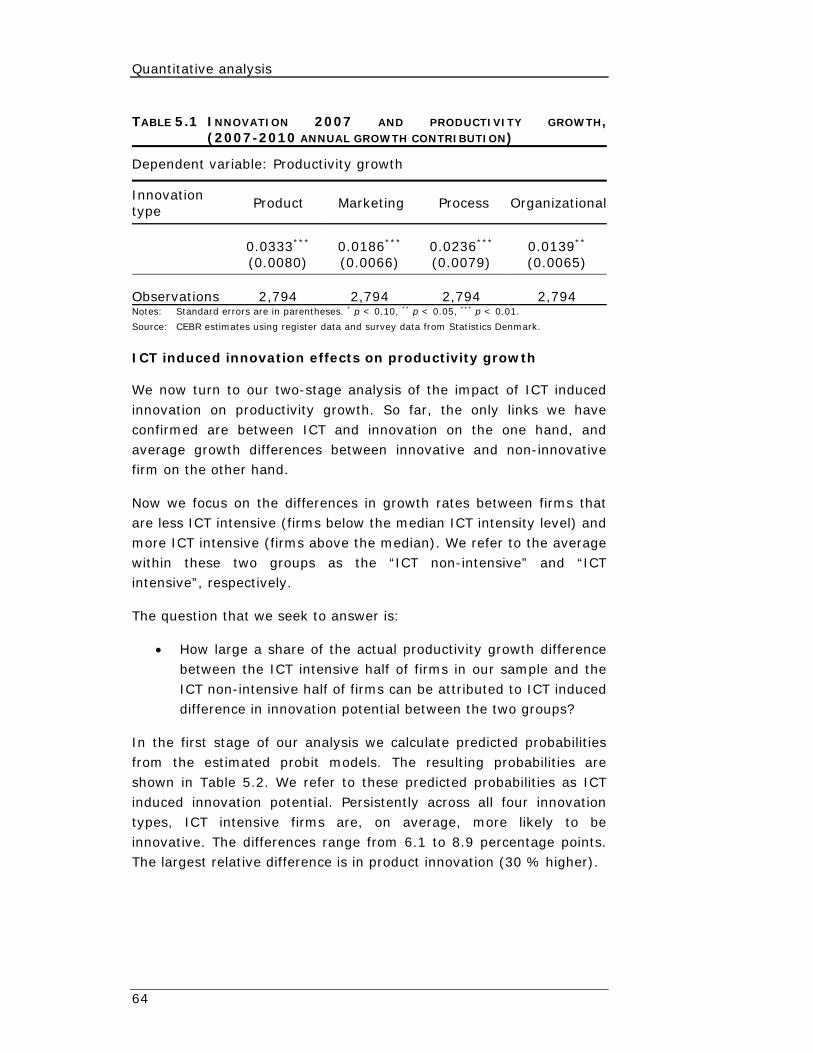
Quantitative analysis
64
TABLE 5.1 INNOVATION 2007 AND PRODUCTIVITY GROWTH,(2007-2010 ANNUAL GROWTH CONTRIBUTION)
Dependent variable: Productivity growth
Innovation type
Product Marketing Process Organizational
0.0333*** (0.0080)
0.0186*** (0.0066)
0.0236*** (0.0079)
0.0139** (0.0065)
Observations 2,794 2,794 2,794 2,794 Notes: Standard errors are in parentheses. * p < 0.10, ** p < 0.05, *** p < 0.01.
Source: CEBR estimates using register data and survey data from Statistics Denmark.
ICT induced innovation effects on productivity growth
We now turn to our two-stage analysis of the impact of ICT induced innovation on productivity growth. So far, the only links we have confirmed are between ICT and innovation on the one hand, and average growth differences between innovative and non-innovative firm on the other hand.
Now we focus on the differences in growth rates between firms that are less ICT intensive (firms below the median ICT intensity level) and more ICT intensive (firms above the median). We refer to the average within these two groups as the “ICT non-intensive” and “ICT intensive”, respectively.
The question that we seek to answer is:
How large a share of the actual productivity growth difference between the ICT intensive half of firms in our sample and the ICT non-intensive half of firms can be attributed to ICT induced difference in innovation potential between the two groups?
In the first stage of our analysis we calculate predicted probabilities from the estimated probit models. The resulting probabilities are shown in Table 5.2. We refer to these predicted probabilities as ICT induced innovation potential. Persistently across all four innovation types, ICT intensive firms are, on average, more likely to be innovative. The differences range from 6.1 to 8.9 percentage points. The largest relative difference is in product innovation (30 % higher).
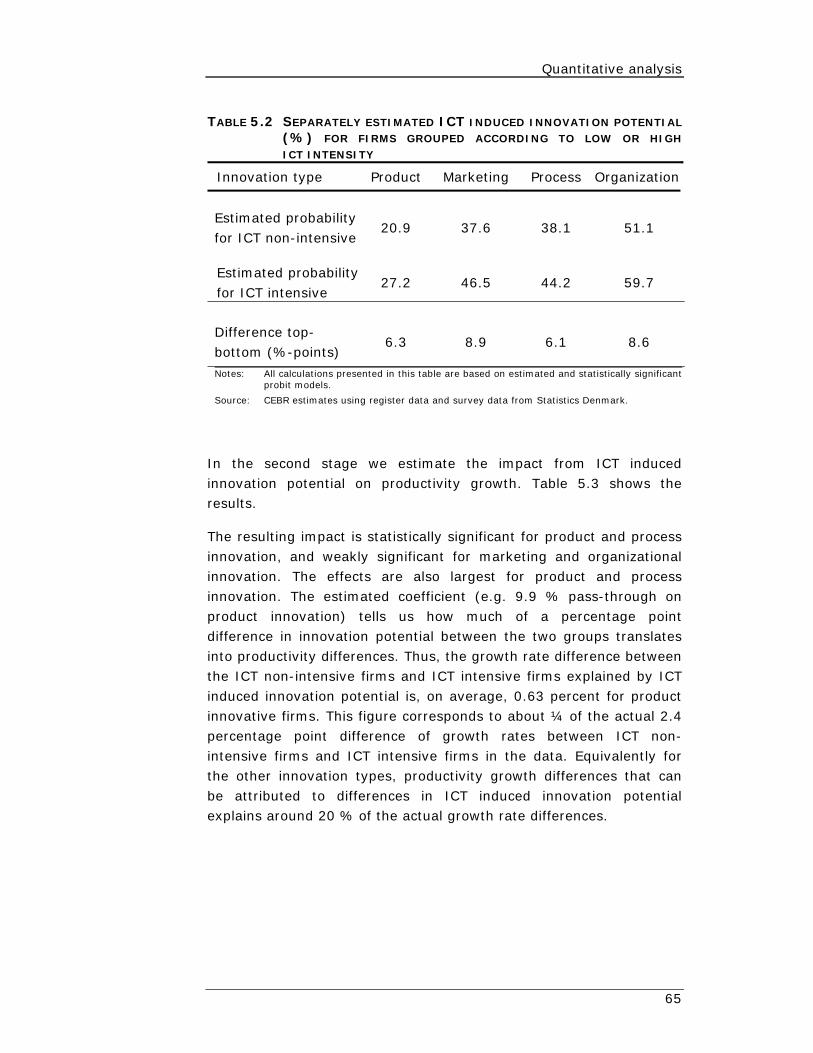
Quantitative analysis
65
TABLE 5.2 SEPARATELY ESTIMATED ICT INDUCED INNOVATION POTENTIAL
(%) FOR FIRMS GROUPED ACCORDING TO LOW OR HIGH ICT INTENSITY
Innovation type Product Marketing Process Organization
Estimated probability for ICT non-intensive
20.9 37.6 38.1 51.1
Estimated probabilityfor ICT intensive
27.2 46.5 44.2 59.7
Difference top-bottom (%-points)
6.3 8.9 6.1 8.6
Notes: All calculations presented in this table are based on estimated and statistically significant probit models.
Source: CEBR estimates using register data and survey data from Statistics Denmark.
In the second stage we estimate the impact from ICT induced innovation potential on productivity growth. Table 5.3 shows the results.
The resulting impact is statistically significant for product and process innovation, and weakly significant for marketing and organizational innovation. The effects are also largest for product and process innovation. The estimated coefficient (e.g. 9.9 % pass-through on product innovation) tells us how much of a percentage point difference in innovation potential between the two groups translates into productivity differences. Thus, the growth rate difference between the ICT non-intensive firms and ICT intensive firms explained by ICT induced innovation potential is, on average, 0.63 percent for product innovative firms. This figure corresponds to about ¼ of the actual 2.4 percentage point difference of growth rates between ICT non-intensive firms and ICT intensive firms in the data. Equivalently for the other innovation types, productivity growth differences that can be attributed to differences in ICT induced innovation potential explains around 20 % of the actual growth rate differences.

Quantitative analysis
66
Table 5.3 PRODUCTIVITY GROWTH RATE DIFFERENCE BETWEEN ICT
INTENSIVE AND ICT NON-INTENSIVE FIRMS BASED ON ICT
INDUCED INNOVATION ACTIVITY
Innovation type Product Marketing Process Organization
Impact of ICT induced innovation potential on firm productivity growth rate
0.099** (.040)
0.060* (.032)
0.072** (0.036)
0.054* (0.029)
Estimated %-points growth rate difference (top-bottom) attributed ICT induced innovation potential
0.63 0.54 0.44 0.46
Unadjusted %-points growth rate difference (top-bottom)
2.4 2.4 2.4 2.4
Share of growth rate explained by ICT induced innovation potential
26.3 % 22.5 % 18.3 % 19.2 %
Notes: Based on a sample of 781 firms. Total sample growth rate is -3.3 percentage points. Growth rates are measured relative to the total sample growth rate. All calculations presented in this table are based on estimated and statistically significant probit (first stage) and growth regression models (second stage).
Source: CEBR estimates using register data and survey data from Statistics Denmark.
ICT expenditures and pair wise innovation activities
Using indicator variables for all four innovation types as explanatory variables in one regression would make the statistical uncertainty about the effect of each innovation type on productivity much larger as the indicator variables for whether a firm is engaged in a specific innovation activity or not are highly correlated. This correlation implies that the likelihood of a firm being engaged in a given innovation activity conditional on the firm being engaged in another innovation activity is very high. The estimates therefore loose much of their statistical significance even though they may still be economically significant.
We therefore take on another approach by estimating the effect of combinations of innovation activities, as discussed earlier in chapter 4, within two main innovation categories (e.g. demand innovation and supply innovation). We specifically create new innovation variables that reorganize firms categorically in a way that eliminates these issues with multicollinearity. Furthermore, these new categories are much easier to interpret.

Quantitative analysis
67
We perform both one-stage (difference between innovative and non-innovative firms) and two-stage (impact of ICT induced innovation) estimations of productivity growth. We perform these two types of estimations separately in the two subsequent subsections.
In the two-stage procedure, we start with bivariate probit models that estimate the relationship between ICT intensity and pair wise innovation potentials. Just as earlier with the single probit models, we calculate firm tendencies to have certain innovation activities. Specifically, we calculate four conditional probabilities. For estimations concerning ICT induced “demand innovation”, the four conditional probabilities are:
Product and marketing innovation Product but not marketing innovation Not product but marketing innovation Neither product nor marketing innovation
Note that these four probability categories match the reorganization of firms into new categories in the following one-stage regressions (see Table 5.4 and Table 5.5).
The procedure described above also applies to the estimations concerning ICT induced “supply innovation”.
We focus on the one-stage regressions in the following subsection, leaving the first-stage calculations of conditional probabilities for now.
Pairwise innovation activities and productivity growth
Table 5.4 shows results for the growth model estimations where we have organized firms according to whether they are engaged in the two types of innovation activities within the category “demand innovation”.
From the table we clearly see the basic growth hierarchy of the sampled firms: Innovative firms grow faster than firms with no innovation activity. Firms that were both product and marketing innovative significantly grew 4.67 percentage points faster than firms that had no innovation activity. The only other group of firms, that significantly grew faster than firms with no innovation activity, was the group of firms with marketing but not product innovation. Product but not marketing innovative firms grew slower than the two groups of firms just mentioned and not significantly faster than firms with no innovation activity.

Quantitative analysis
68
TABLE 5.4 DEMAND INNOVATION AND PRODUCTIVITY GROWTH
(2007-2010 ANNUAL GROWTH RATES DIFFERENCES)
Marketing innovation
Yes No
Product innovation
Yes 4.67*** 1.36
No 2.54*** 0.00
Notes: Growth rates are measured as absolute percentage point differences from the reference group of firms (no product innovation, no marketing innovation). Standard errors are in parentheses. * p < 0.10, ** p < 0.05, *** p < 0.01. The sample is 3,014 observations.
Source: CEBR estimates using register data and survey data from Statistics Denmark.
Table 5.5 shows results for the growth model estimations where we have organized firms according to whether they are engaged in two types of innovation activities within the category “supply innovation”.
Once again, the basic growth hierarchy of the sampled firms is that innovative firms grow faster than firms with no innovation activity. Firms that were both process and organization innovative significantly grew 3.23 percentage points faster than firms that had no innovation activity. The only other group of firms that significantly grew faster than firms with no innovation activity was the group of firms with process but not organizational innovation. Process but not organization innovative firms grew slower than the two groups of firms just mentioned and not significantly faster than firms with no innovation activity.
TABLE 5.5 SUPPLY INNOVATION AND PRODUCTIVITY GROWTH
(2007-2010 ANNUAL GROWTH RATES DIFFERENCES)
Process innovation
Yes No
Organizational innovation
Yes 3.23 *** 0.78
No 2.81* 0.00
Notes: Growth rates are measured as absolute percentage points difference from the referencegroup of firms (no product innovation, no marketing innovation). Standard errors are in parentheses. * p < 0.10, ** p < 0.05, *** p < 0.01. The sample is 3,014 observations.
Source: CEBR estimates using register data and survey data from Statistics Denmark.

Quantitative analysis
69
Pairwise ICT induced innovation effects on productivity growth
We now turn again to our two-stage analysis of the impact of ICT induced innovation on productivity growth. Because we are now treating two binary outcomes that influence each other, we estimate bivariate probit models. As for the analysis of each innovation activity separately, the question that we seek to answer is:
How large a share of the actual productivity growth difference between the ICT intensive half of firms in our sample and the ICT non-intensive half can be attributed to the difference in average ICT expenditure between the two groups?
From the bivariate probit model estimates, we calculate the bottom and top ICT intensive average predicted conditional probabilities for the four possible outcomes from the two indicator variables. The results of these calculations are presented in Table 5.6 and Table 5.8 for “demand innovation” and “supply innovation”, respectively.
Table 5.6 shows that ICT induced innovation potential is markedly higher if an ICT intensive firm has both marketing and product innovation activities compared to another firm that also has these innovation activities, but does not use ICT intensively.
TABLE 5.6 JOINTLY ESTIMATED ICT INDUCED DEMAND INNOVATION
POTENTIAL FOR FIRMS GROUPED ACCORDING TO LOW OR HIGH ICT
INTENSITY
Innovation activities
Product and marketing
Product but not marketing
Marketing but not product
No demand innovation
Estimated probability for ICT non-intensive
16.3 5.9 20.1 56.6
Estimated probability for ICT intensive
22.3 5.9 23.1 47.5
Difference top-bottom (%-points)
6.0 0.1 3.0 -9.1
Notes: Calculations presented in this table are based on an estimated and statistically significant bivariate probit model.
Source: CEBR estimates using register data and survey data from Statistics Denmark.

Quantitative analysis
70
Similar to the estimations with the single probit model, we use the predicted conditional probabilities from the bivariate probit model as explanatory variables in the growth model estimations to proxy for ICT induced innovation tendencies.
The results in Table 5.7 clearly indicate that the combination of product and marketing innovation has a strong (13 % pass-through) and highly significant effect on firm productivity growth. On average this implies that between ICT non-intensive and ICT intensive firms the growth rate difference is 0.78 percentage points. This difference explains 32.5 % of the unadjusted growth rate difference (2.4 percentage points) between the two groups.
Table 5.7 PRODUCTIVITY GROWTH RATE DIFFERENCE BETWEEN ICTINTENSIVE AND ICT NON-INTENSIVE ICT INTENSIVE FIRMS
BASED ON ICT INDUCED DEMAND INNOVATION POTENTIAL
Innovation activities Product
and marketing
Product but not
marketing
Marketing but not product
Impact of ICT induced innovation potential on firm productivity growth rate
0.130*** (0. 046)
-0.171 (0.351)
-0.083 (0.100)
Estimated %-points growth rate difference (top-bottom) attributed ICT induced innovation potential
0.78 -0.01 -0.25
Unadjusted %-points growth rate difference (top-bottom)
2.4 2.4 2.4
Share of growth rate explained by ICT induced innovation potential
32.5 -0.4 -10.4
Notes: Standard errors are in parentheses. * p < 0.10, ** p < 0.05, *** p < 0.01. First stage calculations of ICT induced innovation potential are based on estimated and statistically significant bivariate probit models. “growth rate difference (top-bottom)” refers to the growth rate difference between ICT intensive and ICT non-intensive firms.
Source: CEBR estimates using register data and survey data from Statistics Denmark.
Similarly for supply innovation (Table 5.8), one group of firms stands out. Firms with both process and organizational innovation activities have 6.3 percentage points higher ICT induced innovation potential.

Quantitative analysis
71
TABLE 5.8 JOINTLY ESTIMATED ICT INDUCED SUPPLY INNOVATION
POTENTIAL FOR FIRMS GROUPED ACCORDING TO LOW OR HIGH ICT
INTENSITY
Innovation activities
Process and organization
Process but not organization
Organization but not process
No Supply innovation
Estimated probability for ICT non-intensive ICT intensive firms
21.3 7.6 22.7 48.5
Estimated probability for ICT intensive ICT intensive firms
27.6 7.4 24.9 40.2
Difference top-bottom (%-points)
6.3 -0.2 2.2 -8.3
Notes: Calculations presented in this table are based on an estimated and statistically significant bivariate probit model.
Source: CEBR estimates using register data and survey data from Statistics Denmark.
However, when we turn to the growth model estimations (Table 5.9), these innovation tendencies have no significant impact on firm growth. Therefore, even though the numbers in the last row of Table 5.9 indicate that ICT induced innovation can explain a small part of the actual difference in productivity growth rates between the ICT intensive group and the ICT non-intensive group, these estimates are not statistically different from zero.

Quantitative analysis
72
Table 5.9 PRODUCTIVITY GROWTH RATE DIFFERENCE BETWEEN ICTINTENSIVE AND ICT NON-INTENSIVE ICT INTENSIVE FIRMS
BASED ON ICT INDUCED INNOVATION ACTIVITY WITHIN SUPPLY
INNOVATION
Innovation activities Process and organization
Process but not organization
Organization but not process
Impact of ICT induced innovation potential on firm productivity growth rate
0.055 (0.062)
-0.447 (0. 587)
0.049 (0.189)
Estimated %-points growth rate difference (top-bottom) attributed ICT induced innovation potential
0.35 0.08 0.11
Unadjusted %-points growth rate difference (top-bottom)
2.4 2.4 2.4
Share of growth rate explained by ICT induced innovation potential
14.6 % 3.3 % 4.6 %
Notes: Standard errors are in parentheses. * p < 0.10, ** p < 0.05, *** p < 0.01. First stage calculations of ICT induced innovation potential are based on estimated and statistically significant bivariate probit models. “growth rate difference (top-bottom)” refers to the growth rate difference between ICT intensive and ICT non-intensive firms.
Source: CEBR estimates using register data and survey data from Statistics Denmark.
Technology upgrading, organizational change, and productivity growth
Acknowledging the lacking evidence of impact on productivity growth from ICT induced supply innovation using the FUI-survey on firm innovation activity, we turn to another data source for more specific information on activities related to “supply innovation”.
Using VITA-survey data (see section 4.4), we can center on a specific type of process innovation, namely the part process innovation that concerns a firms’ production activity (rather than, for example, logistics).
Table 5.10 presents the results of a regression of average firm productivity growth over the period 2007-2010 on variables indicating whether there was technological upgrading in the form of investments in new machines embedding ICT-technology, and organizational change, respectively, within the firm in 2007.

Quantitative analysis
73
For the purpose of the regression, we group firms into 4 groups according to whether they answer “yes” or “no” to two questions about implementing technological changes and about implementing organizational changes, respectively. We consider the group of firms which answer “no” to both questions to be the reference group and include 0-1 indicator variables for the other three groups in the regression.
TABLE 5.10 IMPLEMENTATION OF NEW TECHNOLOGY AND PRODUCTIVITY
GROWTH (2007-2010 ANNUAL GROWTH CONTRIBUTION)
Productivity growth
New machines embedding micro-electronic technology accompanied by organizational changes
0.0208*** (0.0063)
Organizational changes only 0.0160
(0.0169)
New machines embedding micro-electronic technology only
0.0095 (0.0058)
Observations 2,840 Notes: Standard errors are in parentheses. * p < 0.10, ** p < 0.05, *** p < 0.01.
Source: CEBR estimates using register data and survey data from Statistics Denmark.
The table shows that firms which implemented new machines embedding ICT technology in 2007 but did not make organizational changes, on average, had about 0.9 percentage points higher annual productivity growth rate over the period 2007-2010 than firms which neither implemented new machines embedding ICT technology nor implemented organizational changes. However, our statistical estimate of 0.9 percentage points higher annual growth is not statistically significant. Firms which only introduced organizational changes, on average, had 1.6 % percentage points higher annual productivity growth rate than the baseline group but this estimate is also not statistically significant.
In contrast, firms introducing both new machines embedding ICT technology and organizational changes in 2007 had, on average, 2.1 percentage points higher annual productivity growth rates over the period 2007-2010 than firms that introduced neither. This estimate is highly statistically and economically significant. The result points to large productivity benefits from suitable investments in production machinery accompanied by organizational adjustments.

Appendiks A
74
Appendiks A Further descriptive statistics
This appendix presents some descriptive statistics about the relationship between firm characteristics and ICT expenditure and innovation activity within firms alluded to in the main body of the text. The main point is to illustrate that ICT expenditure and innovation activities vary substantially across three main firm characteristics, namely size, industry, and exporter status. Thus, it is of paramount importance that these characteristics are taken into account when we do a formal statistical analysis of the relationships between ICT expenditure, innovation activities, and productivity within firms.

Appendiks A
75
ICT expenditure and firm characteristics
Appendix Figure A.1 shows that ICT expenditures per fulltime employee vary significantly across firm size measured in terms of number of employees. With average ICT expenditures in 2010 of approximately 84 thousand DKK, small firms with less than 50 employees spent more than 30 thousand DKK more on ICT per employee than firms with more than 250 employees which, on average, spent 48 thousand DKK on ICT per employee. Medium size firms, i.e. firms with 50 to 250 employees, spent, on average, 39 thousand DKK on ICT per employee in 2010.
APPENDIX FIGURE A.1 ICT EXPENDITURE PER EMPLOYEE ACROSS FIRM
SIZE, 2010
Source: CEBR estimates using register data and survey data from Statistics Denmark.
84.2
38.8
48.0
020
4060
80
DK
R 1
000
<50 employees 50-250 employees >250 employees
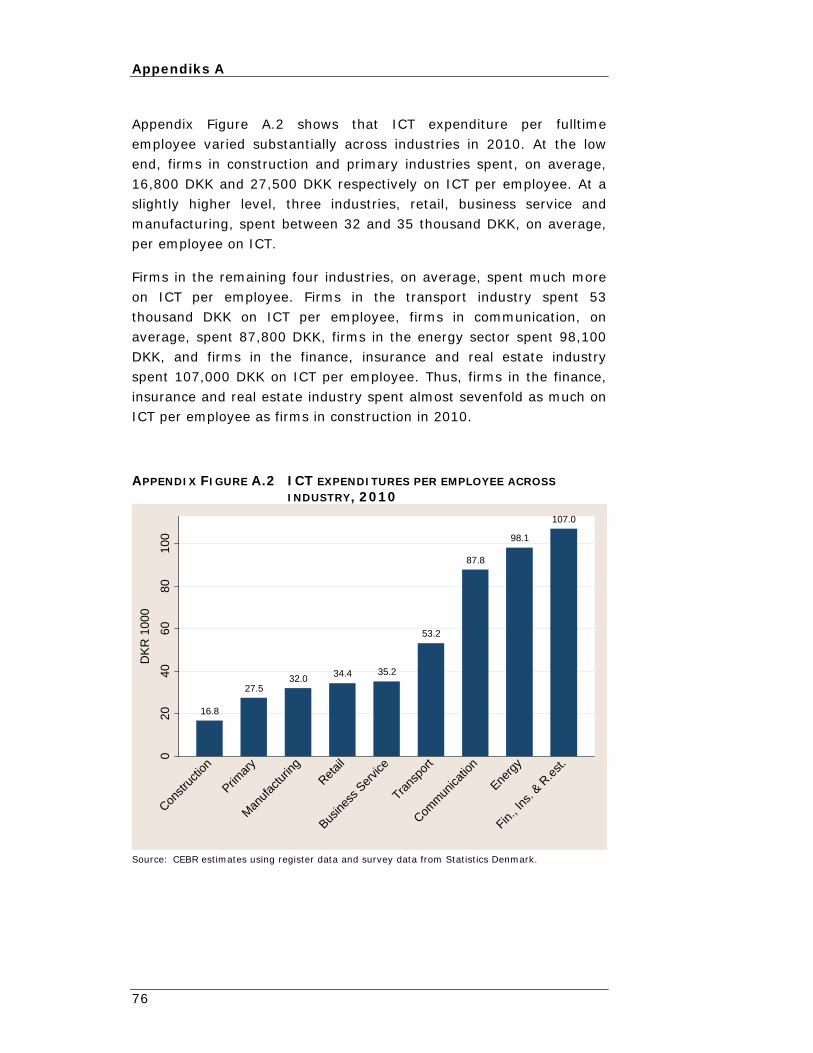
Appendiks A
76
Appendix Figure A.2 shows that ICT expenditure per fulltime employee varied substantially across industries in 2010. At the low end, firms in construction and primary industries spent, on average, 16,800 DKK and 27,500 DKK respectively on ICT per employee. At a slightly higher level, three industries, retail, business service and manufacturing, spent between 32 and 35 thousand DKK, on average, per employee on ICT.
Firms in the remaining four industries, on average, spent much more on ICT per employee. Firms in the transport industry spent 53 thousand DKK on ICT per employee, firms in communication, on average, spent 87,800 DKK, firms in the energy sector spent 98,100 DKK, and firms in the finance, insurance and real estate industry spent 107,000 DKK on ICT per employee. Thus, firms in the finance, insurance and real estate industry spent almost sevenfold as much on ICT per employee as firms in construction in 2010.
APPENDIX FIGURE A.2 ICT EXPENDITURES PER EMPLOYEE ACROSS
INDUSTRY, 2010
Source: CEBR estimates using register data and survey data from Statistics Denmark.
16.8
27.532.0 34.4 35.2
53.2
87.8
98.1
107.0
020
4060
8010
0
DK
R 1
000
Constr
uctio
n
Primar
y
Man
ufac
turin
g
Retail
Busine
ss S
ervic
e
Trans
port
Comm
unica
tion
Energ
y
Fin., I
ns. &
R.e
st.

Appendiks A
77
Appendix Figure A.3 shows that firms, which obtained at least some of their revenue from exports, on average, spent almost twice as much on ICT per employee as non-exporters. While non-exporters, on average, spent 32,800 DKK on ICT per employee exporters, on average, spent 58,000 DKK on ICT per employee in 2010.
APPENDIX FIGURE A.3 ICT EXPENDITURES PER EMPLOYEE ACROSS FIRM
EXPORTER STATUS, 2010
Source: CEBR estimates using register data and survey data from Statistics Denmark.
Innovation activity and firm characteristics
Appendix Figure A.4 shows that the probability of a given firm being engaged in a given type of innovation activity is related to the size of the firm (though as already pointed out in the main text, a positive connection between firm size and affirmative answers to questions on innovative activities does not necessarily imply that large firms are more innovative than small firms with respect to any given innovation activity as larger firms are involved in a wider range of activities and are therefore more likely to be innovative in at least one activity).
For all four innovation types that we look at in this report, the probability that a given firm engages in the specific innovation type is positively related to the size of the firm. For example, while, on average, 19 % of firms with less than 50 employees engaged in product innovation in a given year in the period 2007 to 2010, 20.2 %
32.8
58.0
020
4060
DK
R 1
000
Non-exporters Exporters

Appendiks A
78
of firms with between 50 and 250 employees engaged in product innovation and 32.3 % of firms with more than 250 employees engaged in product innovation.
APPENDIX FIGURE A.4 FREQUENCY OF INNOVATION TYPES ACROSS FIRM
SIZE, AVERAGE 2007-2010
Source: CEBR estimates using register data and survey data from Statistics Denmark.
Appendix Figure A.5 shows that the probability of a given firm being engaged in a given type of innovation activity is related to which industry the firm operates in.
For example, while, on average, 24.4 % of firms in the primary or the construction industry engaged in marketing innovation in a given year in the period 2007 to 2010, 31.3 % of firms in the transportation, the communication, or the energy sector engaged in marketing innovation, 34.1 % of firms in retail or business services engaged in marketing innovation, 33.6 % of firms in finance or real estate engaged in marketing innovation, and 47.3 % of firms in manufacturing engaged in marketing innovation.
16.9
22.1
31.4
27.2
18.1
33.1
44.9
33.2
28.4
44.3
55.9
45.7
020
4060
%
<50 employees 50-250 employees >250 employees
Product innovation Process innovationOrganizational innovation Marketing innovation

Appendiks A
79
APPENDIX FIGURE A.5 FREQUENCY OF INNOVATION TYPES ACROSS
INDUSTRIES, AVERAGE 2007-2010
Source: CEBR estimates using register data and survey data from Statistics Denmark.
Appendix Figure A.6 shows that the probability of a given firm being engaged in a given type of innovation activity is related to whether the firm obtains at least some of its revenue from exports or not.
For all four innovation types that we look at, the probability that a given firm engages in the specific innovation type is positively related to whether the firm is an exporter or not. For example, while on average 37.7 % of non-exporting firms engaged in organizational innovation in a given year in the period 2007 to 2010, 51.2 % of exporting firms engaged in organizational innovation.
12.5
35.0
49.1
31.3
15.3
28.6
37.6
34.1
15.8
28.1
41.3
24.4
17.7
32.5
45.7
33.635.2
45.9
56.3
47.3
020
4060
%
Trans., Comm. & EnergyRetail & Bus. Service
Prim. & Constr.Fin., Ins., Real Est.
Manufacturing
Product innovation Process innovationOrganizational innovation Marketing innovation

Appendiks A
80
APPENDIX FIGURE A.6 FREQUENCY OF INNOVATION TYPES ACROSS
EXPORTER STATUS, AVERAGE 2007-2010
Source: CEBR estimates using register data and survey data from Statistics Denmark.
10.7
27.1
37.7
26.5 27.2
39.7
51.2
42.1
010
2030
4050
%
Non-exporters Exporters
Product innovation Process innovationOrganizational innovation Marketing innovation

References
81
References
Bartel, A., C. Ichniowski and Kathryn Shaw (2007), “How does information technology affect productivity? Plant-level comparisons of product innovation, process improvement, and worker skills”, Quarterly Journal of Economics 122(4), p.1721-1758.
Brynjolfsson, E. (2011), “ICT, innovation and the e-economy” in “Productivity and growth in Europe ICT and the e-economy”, EIB Papers Volume 16 No. 2
Gretton, P., J. Gali and D. Parham (2004), “The Effects of ICTs and Complementary Innovations on Australian Productivity Growth”, in The Economic Impact of ICT: Measurement, Evidence and Implications, OECD Publishing p. 105-130.
Hall, B. (2011), “Innovation and Productivity”, Nordic Economic Policy Review no. 2, p.167-204.
Junge, M., B. Severgnini and A. Sørensen (2012b), “Product-Marketing Innovation, Skills, and Firm Productivity Growth”, CEBR Working Paper.
Koellinger, P. (2005), “Why IT matters- An Empirical Study of Ebusiness Usage, Innovation and Firm Performance”, German Institute for Economic Research Discussion Paper No. 495, DIW Berlin, Berlin.


CENTRE FOR ECONOMIC AND BUSINESS RESEARCH
CEBREN DEL AF COPENHAGEN BUSINESS SCHOOL
Centre for Economic and Business Research
Centre for Economic and Business Research (CEBR) er et uafhængigt forsknings- og
analysecenter på Copenhagen Business School (CBS). CEBR blev etableret i 1999 i
Erhvervsministeriets departement.
I 2005 flyttede CEBR ud på CBS, hvor centret er en integreret men uafhængig enhed
ved Økonomisk Institut.
Centre for Economic and Business Research (CEBR) · Copenhagen Business School · Porcelaenshaven 16A · DK-2000 Frederiksberg
Tlf: +45 3815 3494 · E-mail: [email protected] · www.cebr.dk