
ICLEAC Instability Control of Low Emission Aero-engine ... · PDF fileInstability Control of...
27
1 ICLEAC Instability Control of Low Emission Aero-engine Combustor CONTRACT N° : G4RD-CT2000-0215 PROJECT N° : GRD1-1999-10514 DELIVERABLE NUMBER : D3.4 TITLE : The interaction between the fuel injector spray and an acoustic field, measured at 3 bar M Jermy * , DA Greenhalgh, WG Doherty, M Hussain Department of Automotive, Mechanical and Structures Engineering, School of Engineering, Cranfield University, Cranfield, Beds, MK43 0AL, United Kingdom * Tel +44 1234 754680, Fax +44 1234 750425, [email protected] 1 Abstract Measurements were made of the spray of 5 Rolls-Royce airblast atomisers and one Turbomeca LP module. The measurements were made at 3 bar, non-combusting, in a 7 bar optically accessed sprays rig at Cranfield. The airflow through the injectors was modulated at 12, 100 and 200Hz with a siren. Planar Laser Induced Fluorescence and Laser Sheet Dropsizing images of the spray were taken at several phases in the air perturbation cycle. The images were calibrated to yield air-fuel ratio (AFR) and Sauter Mean Diameter (SMD) maps. Spray transfer functions, which describe the temporal response of the AFR and SMD to the airflow modulation, were extracted. The strength of response of each injector to the airflow modulation and the quality of fit of the sinusoidal transfer function correlate with the combustion instability amplitude observed in combustor tests. This means that these cheap non-combusting spray measurements can be used to predict which injectors are likely to encourage the strongest and the weakest combustion instability. Images of the spray without airflow perturbation, at several pressures and pressure drops, yield the cone angle/pressure drop relationship requested by UCAM to allow the use of the spray transfer functions in CFD simulations of unstable combustors. Correlations were sought between the injector design parameters and the amplitude of instabilities observed in combustion tests. The results suggest that that to achieve low rumble amplitude the injector should be designed with a short prefilmer, a low fuel flow number, and a high angle between the dome vane and the nozzle outlet plane. Vane angle is less important than the prefilmer and flow number. Date of issue : 20 th February 2004 Project funded by the European Community under the ‘Competitive and Sustainable Growth’ Programme (1998-2003)
-
Upload
truongdieu -
Category
Documents
-
view
216 -
download
2
Transcript of ICLEAC Instability Control of Low Emission Aero-engine ... · PDF fileInstability Control of...

1
ICLEAC Instability Control of Low Emission Aero-engine Combustor
CONTRACT N° : G4RD-CT2000-0215
PROJECT N° : GRD1-1999-10514
DELIVERABLE NUMBER : D3.4
TITLE : The interaction between the fuel injector spray and an acoustic field, measured at 3 bar
M Jermy*, DA Greenhalgh, WG Doherty, M Hussain
Department of Automotive, Mechanical and Structures Engineering, School of Engineering, Cranfield University, Cranfield, Beds, MK43 0AL, United Kingdom
*Tel +44 1234 754680, Fax +44 1234 750425, [email protected]
1 Abstract Measurements were made of the spray of 5 Rolls-Royce airblast atomisers and one Turbomeca LP module. The measurements were made at 3 bar, non-combusting, in a 7 bar optically accessed sprays rig at Cranfield. The airflow through the injectors was modulated at 12, 100 and 200Hz with a siren. Planar Laser Induced Fluorescence and Laser Sheet Dropsizing images of the spray were taken at several phases in the air perturbation cycle. The images were calibrated to yield air-fuel ratio (AFR) and Sauter Mean Diameter (SMD) maps. Spray transfer functions, which describe the temporal response of the AFR and SMD to the airflow modulation, were extracted. The strength of response of each injector to the airflow modulation and the quality of fit of the sinusoidal transfer function correlate with the combustion instability amplitude observed in combustor tests. This means that these cheap non-combusting spray measurements can be used to predict which injectors are likely to encourage the strongest and the weakest combustion instability. Images of the spray without airflow perturbation, at several pressures and pressure drops, yield the cone angle/pressure drop relationship requested by UCAM to allow the use of the spray transfer functions in CFD simulations of unstable combustors. Correlations were sought between the injector design parameters and the amplitude of instabilities observed in combustion tests. The results suggest that that to achieve low rumble amplitude the injector should be designed with a short prefilmer, a low fuel flow number, and a high angle between the dome vane and the nozzle outlet plane. Vane angle is less important than the prefilmer and flow number.
Date of issue : 20th February 2004
Project funded by the European Community under the ‘Competitive and Sustainable Growth’ Programme (1998-2003)

2
Project ICLEAC-Deliverable 3.4 ‘Report high-pressure results’ for Task 3 ‘Measurement of the Spray Transfer Function’, Workpackage 3 ‘Measurement of Transfer Functions’, Workpackage Co-ordinator Rolls-Royce Deutschland 20th February 2004 The interaction between the fuel injector spray and an acoustic field, measured at 3 bar M Jermy*, DA Greenhalgh, WG Doherty, M Hussain Department of Automotive, Mechanical and Structures Engineering, School of Engineering, Cranfield University, Cranfield, Beds, MK43 0AL, United Kingdom *Tel +44 1234 754680, Fax +44 1234 750425, [email protected] 2 Contents 1 Abstract page 1 2 Contents 2 3 Introduction 2 4 Transfer function measurements at 3 bar 3 4.1 Equipment and method 3 4.1.1 Rig 3 4.1.2 Optical techniques 4 4.1.3 Optics 4 4.1.4 Calibrator for LSD and LVF 5 4.1.5 Fuel 5 4.1.6 Injector hardware 5 4.1.7 Operating conditions 5 4.1.8 Method 6 4.1.9 Data processing 6 4.2 Results- Images 7 4.3 Results- Transfer functions 9 4.4 Results- Cone angle correlations 15 4.5 Discussion and conclusions from transfer function measurement at 3 bar 19 5 Relation of the results to the previous 1-bar work reported in D3.03 20 6 Correlations between injection geometry and rumble, and recommendations for the design of rumble-resistant injectors 22 6.1 Introduction 22 6.2 Method 22 6.3 Discussion 25 6.4 Conclusions and design recommendations 26 7 Overall conclusions 26 8 Acknowledgements 27 9 References 27 3 Introduction This task is concerned with investigating the role of the fuel injector in encouraging or inhibiting combustion oscillation. The following extract from Annex 1 of the ICLEAC contract is a brief description of the work: Workpackage 3, Task 3: Spray Transfer Function Responsible partners: Cranfield University (29man months) and Rolls-Royce (0.5 man months) “An existing fuel injection rig with optical access will be modified to provide an oscillating inlet pressure. The spray behaviour will be investigated using existing instruments for a variety of fuel injectors of know combustion instability characteristics. Following initial tests

3
at atmospheric conditions the rig will be modified for operation up to 3 bar and tests performed at elevated pressures. Correlations will be sought between pressure oscillation- spray behaviour and sensitivity to combustion instability.” This report describes the construction of a new sprays rig capable of pressures up to 7 bar with oscillating inlet pressure, the instrumentation, the measurements at 3 bar carried out on fuel injectors provided by Rolls-Royce and Turbomeca, and the transfer functions extracted from the measurements. This report also describes an analysis of the geometry of the five RR injectors and correlation of the geometry with susceptibility to rumble. Recommendations for the design of injectors insensitive to rumble are made. 4 Transfer function measurements at 3 bar 4.1 Equipment and method 4.1.1 Rig The sprays rig (Fig. 1) is a cylinder approx. 2.5m long and 0.7m diameter with it’s axis vertical. It consists of three steel sections connected by bolted flanges. The upper section contains the air inlet, the airbox raise/lower mechanism, the siren and the airbox. It also contains instrumentation feed-throughs for air temperature, air pressure, pressure drop across the injector, a fast pressure transducer on the airbox to detect the oscillating component of pressure, and a sensor to detect the rotational position of the siren. The middle section contains windows for optical diagnostics. These are fitted with air purge systems to keep them clear of droplets. The lower section is a free space for the spray to form. It has an exhaust and a drain to carry off the sprayed fuel. The air enters the rig through a control valve and passes into a vertical pipe that can be raised or lowered. The pipe carries the air into the rig. On the lower end of the pipe is the siren, beneath which is the airbox. The whole siren and airbox assembly can thus be rotated, raised or lowered to bring the spray into the field of view of the camera. The airbox ensures an even air pressure distribution over the upstream side of the atomiser. The inlet and exhaust air valves, the fuel supply, and the camera and laser are remotely controlled from the control room. The rig can reach a maximum pressure and temperature of 7 bar, 200oC and the compressors can provide an air flow up to 2 kgs-1. The design and construction of the siren is described in Deliverable 3.03. Table 1 gives the siren performance at 3 bar. In the engine, the acoustic perturbation is applied from downstream rather than upstream as in the rig used here. However in both cases it causes a cyclic change in pressure drop across the injector, and hence in air velocity through the injector.

4
Figure 1: 7 bar sprays rig
Freq/Hz Amplitude/Pa
Phase/deg (lag of pressure peak after siren timing mark)
12 5674 86100 2533 108200 1266 288
Table 1: Siren performance at 3 bar. 4.1.2 Optical techniques Planar Laser Induced Fluorescence (LIF) and Laser Sheet Dropsizing (LSD) techniques were used to measure the air-fuel ratio (AFR) and Sauter Mean Diameter (SMD) of the spray as a function of air perturbation phase and position in the spray. The techniques are described in D3.03, Kelman et al (2000), Le Gal et al (1999), Greenhalgh and Jermy (2002) and Jermy and Greenhalgh (2000) with an uncertainty analysis in the latter. LSD can give information on the SMD in regions of such high spray density that PDA is incapable of producing reliable measurements. 4.1.3 Optics The beam from a 248nm KrF Lambda Physik CompEx 110 excimer laser was formed into a sheet ≈50mm high and 1mm thick which passed through the centreline of the spray. Each

5
pulse was 100mJ. The light scattered by the droplets was collected by a Princeton Instruments ‘ICCD’ intensified CCD camera. The intensifier gate width was 200ns. The camera had a Nikon 105mm UV lens at f/4.5. A four-mirror system projected both a LIF and a Mie image on to the camera chip, side by side and simultaneously. The Mie image was filtered with a 248nm band pass filter and the LIF with a Schott BG filter. An OD 1.0 neutral density filter was added to the Mie path to balance the Mie and LIF intensities Both laser and camera were triggered by the siren rotational sensor via a delay generator. 4.1.4 Calibrator for LSD and LVF The LIF and LSD images can be calibrated to yield fully quantitative values of AFR and SMD in each pixel. The calibration is done by taking images of a droplet field with known SMD and AFR. The known droplet field is the stream of droplets from a Berglund-Liu type vibrating orifice monodisperse droplet generator. This generates a stream of droplets all of the same size and spacing. The size and spacing are measured with a travelling microscope and with a Phase Doppler Anemometer (PDA). There is some uncertainty over the AFR calibration as the attenuation of the light as it passes from the light sheet, through the spray to the camera, has not been accurately corrected. Since this data was taken a more exact correction procedure has been established. 4.1.5 Fuel The fuel was Exxsol D-80, a hydrocarbon mixture treated to remove any aromatics, which might fluoresce. To this is added 0.012gl-1 m-terphenyl which fluoresces efficiently when illuminated at 248nm. This concentration is chosen according to the principles laid out in Jermy and Greenhalgh (2000). 4.1.6 Injector hardware Five airblast atomisers were provided by Rolls-Royce Derby. In rig tests, these five showed markedly different propensities to rumble. They have three concentric axial air swirlers with the fuel gallery lying between the innermost and middle swirler. They share a common outer form, being designed for the same combustor. They are identified by the last five digits of their part numbers, and their air passage effective areas and flow numbers are shown in table 2. They were fitted with a miniflare.
Part number Effective area/mm2 Fuel flow number/gal hr-1 psi-1/2
71257 230 4.25 73630 250 4.25 73686 202 3.61 73030 202 4.25 73685 180 3.61
Table 2: Characteristics of the five Rolls-Royce airblast atomisers tested. Turbomeca provided an LPP module. It had one swirling and one non swirling air stream, a plain jet atomiser and a mixing tube, and an effective area of ≈140mm2 P modules. 4.1.7 Operating conditions The rig cannot reach the temperatures of the engine, so the rig operating conditions are determined from the engine conditions according to scaling laws which preserve the most important influences on the fuel droplet behaviour (Jermy, Hussain and Greenhalgh 2003). Engine operating conditions for the Rolls-Royce injectors were 317kPa absolute, 380K, 7.62-11.00 AFR at injector. The scaling process used here attempts to preserve the average air velocity through the injector (which strongly influences the acoustic impedance) and the patternation or spatial distribution of the fuel droplets. For the RR atomisers this was done by making the air velocity and the air/fuel momentum flux ratio identical in rig and engine. Of the various

6
scaling laws described in Jermy, Hussain and Greenhalgh (2003) this gives the best match between engine and rig values of air Reynolds’ and Mach numbers, which determine the air streamlines, and the best achievable match between the engine and rig droplet Stokes’ number, which determines the degree to which the droplets follow these streamlines. It is impossible to get a perfect match on all these parameters in a low cost, low temperature rig. The rig operating conditions are given in Table 3. For the Turbomeca injector there were no specified engine operating conditions. The pressure drop was set so that the air velocity in the throat of the injector was 100ms-1 and the AFR set to 25 as advised by Turbomeca. The geometric centreline of the injector lies in the image plane: this may not coincide perfectly with the aerodynamic centreline.
Injector
Pabsolute (bar) (upstream of injector)
Pgauge (bar) ∆P/P (5.07%)
Flow Rate (litres/min)
Flow Rate (g/s)
Air temperature/K
Rolls-Royce airblast 2.49 1.49 0.126 0.46 6.18
316
Turbomeca module 3.00 2.00 0.175 0.16 2.15
316
Table 3: Rig operating conditions used. 4.1.8 Method Data was taken for each of five RR atomisers and the one TM atomiser at siren frequencies of 12, 100 and 200Hz. At each frequency, images were acquired at 16 phases of the air perturbation cycle separated by 22.5o. 200 images were taken at each phase at each frequency for each atomiser: 100 with the injector at one rotational position and 100 with the injector rotated about it’s axis through 180o. To be able use the measured transfer functions in calculations of combustor behaviour, UCAM requested information on the variation of cone angle with airbox pressure and injector air pressure drop. For this reason images of the injector were taken with the siren turned off, at a range of airbox pressures and injector air pressure drops. Details are given in section 4.4. 4.1.9 Data processing The 100 images at each phase and rotational angle were averaged and the background subtracted. The frames were split into separate Mie and LIF images. It is common to take images of the background with the air flowing but the fuel off. This was not done. Previous experience with high spray density airblast fuel injectors suggests that background subtraction introduces additional errors. The intensity contributed by the background structures (airbox face, rig walls etc.) when the fuel is flowing is significantly different to that with the fuel off. With fuel flowing, scattered light from the spray is the chief illumination source for the background, but this is clearly not the case with fuel off. For both Mie and LIF, the averaged images at 0o and 180o rotational angle were combined according to the process of Talley et al (1996). This eliminates the error due to attenuation of the light sheet as it passes through the spray and is scattered by the droplets. During the process the intensity of each row is multiplied by a factor. Small noise related variations in this factor introduce apparent horizontal streaks into the image. The variations are not as severe as they appear as the eye and brain seeks and accentuates patterns and assigns excessive weight to the streakiness. The pixel values of the LIF image are calibrated and converted to AFR final pixel values are 100xAFR). The uncalibrated LIF image is divided by the Mie image and multiplied by a calibration constant to give the SMD image (final pixel values are SMD in microns). Transfer functions are extracted from the images. Further details are in Section 4.3.

7
4.2 Results- Images A sequence of sample images for injector 73630 at 200Hz is given in Figures 1 and 2 and for the Turbomeca module in Figures 3 and 4. Phases shown are relative to the siren timing signal. The images are in false colour with hot colours indicating high AFR or SMD. The injector is at the bottom of the image spraying upwards. The spray is roughly but not perfectly symmetrical and shows a recirculation zone. The height of each frame is 88mm and the width 62mm. The oscillation of AFR and SMD values is visible but not striking as the amplitude of the fluctuation is a small fraction of the DC values. The full set of images are available to all ICLEAC partners.
Figure 1: sequence of AFR images from injector 73630 at 200Hz.

8
Figure 2: sequence of SMD images from injector 73630 at 200Hz.
Figure 3: sequence of AFR images for the Turbomeca module at 200Hz.

9
Figure 4: sequence of SMD images for the Turbomeca module at 200Hz.
4.3 Results- Transfer functions Figures 5 and 6 show the regions on the image at which the AFR or SMD is measured for the extraction of transfer functions. The regions are: one in the centre of the recirculation zone, one near the prefilmer exit, and two on the centreline: one at the same downstream distance as the recirculation zone, and one near the downstream limit of the spray. This last region lies partly outside the masked region in the SMD image giving in some cases null results. Each region is square, 10 pixels by 10 pixels.

10
Figure 5: AFR and SMD images showing the points at which the AFR and SMD values are
extracted to determine the transfer functions- injector 73630
Figure 6: AFR and SMD images showing the points at which the AFR and SMD values are
extracted to determine the transfer functions- Turbomeca module For each region, the intensity at each phase, averaged over the 100 pixels, is extracted giving a time series of AFR or SMD values. The average over all phases, i.e. the DC component, is

11
subtracted to leave the fluctuating or AC component only. The pressure-history in the airbox has non sinusoidal features indicating the presence of harmonics. Since the transfer function assumes sinusoidal behaviour i.e. that the siren has no harmonics, this AC component is filtered to remove the harmonics by taking a moving window average (window of width 90o). A sine function is fitted to the filtered AC component. Finally a sine function (Eq. 1) is fitted to the filtered data.
)sin(~~ φθ += APY Eq.1 The amplitude A and phase φ of the sine function are recorded. The transfer function takes the form shown in Eq. 2
)sin(~ φω ++= tAPYY Eq. 2 Y is the spray property, either AFR or SMD in microns, at the particular point in the spray, at time t. Y~ is the fluctuating andY is the mean value of Y, P~ is the fluctuating component of the airbox pressure in Pa, A is the amplitude or coupling constant in AFR/Pa or microns/Pa, θ the phase of the siren in the AFR or SMD/phase relationship ω is the air perturbation frequency and φ the phase lag of the peak in Y with respect to the peak in air pressure. Examples of AC components and fitted sine functions are shown in Fig. 7. The variable adjusted to achieved a fit are AC amplitude and phase. The phase shown is that relative to the siren timing mark. A factor relating to quality of fit is calculated. This is R2/AC2 which is the sum of deviations squared over the AC amplitude squared. Where the fit is poor, for example if the AC component is noisy or poorly sinusoidal, this is large. This indicates the fluctuations are not coherent with and perhaps not due to the siren perturbation.
Figure 7: Example AFR and SMD time series and fitted sine functions
The transfer function consists of the DC component Y , the AC amplitude divided by the amplitude of the air pressure fluctuation in the airbox, A, and phase φ. The transfer functions are shown in Tables 4-7. The phase shown is that relative to the airbox pressure peak rather than relative to the siren timing mark. Also shown is the ratio YA / which shows the relative size of the AC to the DC component and the fit quality indicator R2/AC2. Where the tabulated phase is greater than 360o, 360o can be subtracted.

12
Centre of recirc zone
71257 Y-bar (DC amp.)
A (AC amp./Pressure Amp.)
Phase (φ) A/Y-bar R^2/AC^2
AFR, 12Hz 3.17 1.66E-05 191 5.22E-06 2.42AFR, 100Hz 4.09 5.92E-05 358 1.45E-05 10.82AFR, 200Hz 3.83 8.69E-05 433 2.27E-05 5.64SMD, 12Hz 19.89 1.34E-04 341 6.73E-06 2.44SMD, 100Hz 15.51 1.74E-04 193 1.12E-05 15.81SMD, 200Hz 15.61 2.53E-04 638 1.62E-05 4.62
73630 AFR, 12Hz 2.68 9.94E-06 406 3.71E-06 3.35AFR, 100Hz 2.79 2.05E-05 433 7.36E-06 2.58AFR, 200Hz 2.46 1.03E-04 428 4.17E-05 2.35SMD, 12Hz 20.37 7.40E-05 196 3.63E-06 1.35SMD, 100Hz 20.43 1.74E-04 263 8.50E-06 4.99SMD, 200Hz 21.48 7.11E-04 483 3.31E-05 4.05
73030 AFR, 12Hz 4.31 3.31E-05 401 7.68E-06 0.41AFR, 100Hz 4.78 2.60E-05 318 5.43E-06 4.89AFR, 200Hz 4.64 5.61E-05 513 1.21E-05 4.07SMD, 12Hz 17.06 9.87E-05 151 5.79E-06 0.95SMD, 100Hz 14.35 1.74E-04 118 1.21E-05 1.28SMD, 200Hz 15.23 1.42E-04 628 9.34E-06 4.51
73685 AFR, 12Hz 3.29 1.90E-05 136 5.79E-06 7.87AFR, 100Hz 3.62 4.46E-05 388 1.23E-05 12.40AFR, 200Hz 3.23 7.11E-06 378 2.20E-06 118.49SMD, 12Hz 18.61 1.23E-04 276 6.63E-06 2.82SMD, 100Hz 16.62 1.58E-04 238 9.50E-06 15.50SMD, 200Hz 19.39 5.85E-04 553 3.01E-05 2.74
73686 AFR, 12Hz 2.86 7.46E-06 321 2.61E-06 2.45AFR, 100Hz 2.90 2.60E-05 303 8.97E-06 1.21AFR, 200Hz 4.33 1.04E-04 483 2.41E-05 1.37SMD, 12Hz 27.18 1.41E-04 101 5.19E-06 0.14SMD, 100Hz 27.32 3.95E-04 133 1.44E-05 1.25SMD, 200Hz 18.53 2.53E-04 313 1.36E-05 3.49Turbomeca AFR, 12Hz 10.91 7.05E-05 91 6.46E-06 2.64AFR, 100Hz 10.12 3.16E-04 338 3.12E-05 1.02AFR, 200Hz 8.54 7.42E-04 533 8.70E-05 1.82SMD, 12Hz 10.07 1.23E-04 276 1.23E-05 1.96SMD, 100Hz 9.83 2.37E-04 143 2.41E-05 2.39SMD, 200Hz 10.31 3.48E-04 328 3.37E-05 6.67
Table 4: Transfer functions for region in centre of recirculation zone

13
Near prefilmer exit
71257 Y-bar (DC amp.)
A (AC amp./Pressure Amp.)
Phase (φ) A/Y-bar R^2/AC^2
AFR, 12Hz 8.33 1.16E-04 186 1.39E-05 1.31AFR, 100Hz 10.49 2.23E-04 358 2.12E-05 3.51AFR, 200Hz 9.16 2.23E-04 443 2.43E-05 5.47SMD, 12Hz 26.54 1.23E-04 331 4.65E-06 2.73SMD, 100Hz 20.85 3.55E-04 188 1.70E-05 6.00SMD, 200Hz 22.06 3.16E-04 628 1.43E-05 3.37
73630 AFR, 12Hz 5.30 4.14E-05 401 7.81E-06 1.37AFR, 100Hz 5.76 3.71E-05 368 6.44E-06 14.74AFR, 200Hz 4.60 1.86E-04 418 4.03E-05 1.73SMD, 12Hz 36.24 2.82E-04 201 7.78E-06 1.21SMD, 100Hz 35.75 4.74E-04 238 1.33E-05 3.92SMD, 200Hz 42.19 1.03E-03 573 2.43E-05 7.06
73030 AFR, 12Hz 6.43 2.91E-05 436 4.52E-06 4.87AFR, 100Hz 8.84 2.23E-04 323 2.52E-05 1.95AFR, 200Hz 8.60 1.67E-04 453 1.94E-05 4.65SMD, 12Hz 35.50 1.06E-04 241 2.98E-06 1.40SMD, 100Hz 31.49 1.58E-04 428 5.01E-06 8.58SMD, 200Hz 30.34 2.53E-04 288 8.33E-06 1.08
73685 AFR, 12Hz 6.44 1.76E-05 131 2.74E-06 43.13AFR, 100Hz 6.94 1.21E-04 448 1.74E-05 21.15AFR, 200Hz 5.65 1.58E-04 368 2.79E-05 3.18SMD, 12Hz 39.52 7.93E-05 291 2.01E-06 6.23SMD, 100Hz 35.81 1.58E-04 188 4.41E-06 6.55SMD, 200Hz 35.65 2.76E-04 598 7.75E-06 15.15
73686 AFR, 12Hz 5.88 8.28E-06 281 1.41E-06 11.06AFR, 100Hz 6.20 3.71E-05 263 5.98E-06 2.24AFR, 200Hz 9.25 2.76E-04 463 2.99E-05 2.29SMD, 12Hz 31.66 8.81E-05 421 2.78E-06 2.29SMD, 100Hz 30.97 3.55E-04 128 1.15E-05 1.61SMD, 200Hz 20.31 1.26E-03 288 6.22E-05 1.13Turbomeca AFR, 12Hz 4.05 4.58E-05 96 1.13E-05 2.30AFR, 100Hz 3.31 6.32E-05 358 1.91E-05 12.95AFR, 200Hz 2.86 2.05E-04 558 7.17E-05 2.88SMD, 12Hz 23.79 3.52E-05 301 1.48E-06 25.92SMD, 100Hz 23.28 3.95E-04 438 1.70E-05 2.24SMD, 200Hz 25.63 5.53E-04 353 2.16E-05 11.56
Table 5: Transfer functions for region near prefilmer exit

14
Centreline at recirc. zone height
71257 Y-bar (DC amp.)
A (AC amp./Pressure Amp.)
Phase (φ) A/Y-bar R^2/AC^2
AFR, 12Hz 5.45 3.31E-05 186 6.08E-06 1.31AFR, 100Hz 7.14 1.11E-04 373 1.56E-05 7.05AFR, 200Hz 6.35 1.26E-04 448 1.99E-05 3.86SMD, 12Hz 18.91 1.41E-04 351 7.46E-06 2.40SMD, 100Hz 15.20 1.18E-04 208 7.79E-06 32.37SMD, 200Hz 15.61 2.05E-04 633 1.32E-05 5.39
73630 AFR, 12Hz 3.86 1.66E-05 386 4.29E-06 1.48AFR, 100Hz 4.09 2.78E-05 443 6.80E-06 2.76AFR, 200Hz 3.48 1.86E-04 433 5.34E-05 1.40SMD, 12Hz 18.71 8.81E-05 206 4.71E-06 1.35SMD, 100Hz 18.08 1.97E-04 233 1.09E-05 4.60SMD, 200Hz 19.43 6.32E-04 493 3.25E-05 3.64
73030 AFR, 12Hz 4.77 2.91E-05 411 6.09E-06 2.15AFR, 100Hz 5.49 2.61E-05 313 4.75E-06 11.68AFR, 200Hz 5.35 7.42E-05 493 1.39E-05 2.33SMD, 12Hz 18.07 8.81E-05 171 4.88E-06 0.72SMD, 100Hz 15.49 9.47E-05 153 6.12E-06 1.39SMD, 200Hz 16.10 7.90E-05 393 4.91E-06 10.41
73685 AFR, 12Hz 4.00 1.66E-05 156 4.14E-06 7.63AFR, 100Hz 4.63 3.71E-05 393 8.02E-06 15.67AFR, 200Hz 4.06 8.14E-05 518 2.00E-05 3.33SMD, 12Hz 18.62 1.23E-04 306 6.62E-06 3.48SMD, 100Hz 16.08 1.58E-04 213 9.82E-06 13.47SMD, 200Hz 17.19 9.48E-05 588 5.51E-06 13.52
73686 AFR, 12Hz 4.76 1.24E-05 271 2.61E-06 5.28AFR, 100Hz 4.87 4.64E-05 273 9.52E-06 1.93AFR, 200Hz 7.34 7.42E-05 478 1.01E-05 3.81SMD, 12Hz 22.79 8.81E-05 91 3.87E-06 1.54SMD, 100Hz 22.93 3.55E-04 123 1.55E-05 1.13SMD, 200Hz 16.52 6.32E-05 593 3.83E-06 15.42Turbomeca AFR, 12Hz 19.21 9.11E-05 391 4.74E-06 18.43AFR, 100Hz 18.57 2.78E-04 368 1.50E-05 12.21AFR, 200Hz 17.41 1.67E-03 543 9.62E-05 1.82SMD, 12Hz 8.52 3.52E-04 216 4.14E-05 1.21SMD, 100Hz 6.05 1.11E-03 243 1.83E-04 0.40SMD, 200Hz 2.67 2.05E-03 383 7.70E-04 3.56
Table 6: Transfer functions for region on centreline, at recirculation zone height

15
Centreline at downstream edge
71257 Y-bar (DC amp.)
A (AC amp./Pressure Amp.)
Phase (φ) A/Y-bar R^2/AC^2
AFR, 12Hz 11.52 7.84E-05 186 6.81E-06 7.40AFR, 100Hz 17.94 4.45E-04 353 2.48E-05 4.05AFR, 200Hz 16.20 4.74E-04 418 2.93E-05 6.03SMD, 12Hz 13.07 6.34E-05 261 4.85E-06 23.62SMD, 100Hz 4.93 6.71E-04 163 1.36E-04 2.63SMD, 200Hz 7.03 6.32E-04 613 8.99E-05 5.41
73630 AFR, 12Hz 15.27 1.66E-04 346 1.08E-05 2.81AFR, 100Hz 15.93 2.78E-04 388 1.75E-05 15.02AFR, 200Hz 11.97 1.75E-03 438 1.46E-04 1.01SMD, 12Hz 4.54 1.06E-04 151 2.33E-05 10.68SMD, 100Hz 6.08 2.37E-04 113 3.90E-05 14.50SMD, 200Hz 9.76 3.32E-03 628 3.40E-04 0.43
73030 AFR, 12Hz 11.85 6.63E-05 371 5.59E-06 4.11AFR, 100Hz 21.56 7.42E-04 288 3.44E-05 3.50AFR, 200Hz 18.56 9.48E-04 463 5.11E-05 1.87SMD, 12Hz 0.50 0.00E+00 86 0.00E+00 #DIV/0! SMD, 100Hz 0.50 0.00E+00 108 0.00E+00 #DIV/0! SMD, 200Hz 0.50 0.00E+00 288 0.00E+00 #DIV/0!
73685 AFR, 12Hz 13.31 1.66E-04 146 1.24E-05 5.18AFR, 100Hz 25.52 1.97E-03 408 7.74E-05 5.36AFR, 200Hz 13.62 1.30E-03 373 9.57E-05 2.63SMD, 12Hz 0.50 0.00E+00 86 0.00E+00 #DIV/0! SMD, 100Hz 0.50 0.00E+00 108 0.00E+00 #DIV/0! SMD, 200Hz 0.50 0.00E+00 288 0.00E+00 #DIV/0!
73686 AFR, 12Hz 8.87 9.11E-05 216 1.03E-05 0.68AFR, 100Hz 12.65 1.21E-04 313 9.55E-06 4.64AFR, 200Hz 25.69 2.61E-03 458 1.01E-04 1.58SMD, 12Hz 21.49 2.29E-04 431 1.07E-05 5.15SMD, 100Hz 14.21 1.58E-04 403 1.11E-05 72.11SMD, 200Hz 0.52 0.00E+00 288 0.00E+00 #DIV/0! Turbomeca AFR, 12Hz 137.39 3.88E-03 386 2.82E-05 1.28AFR, 100Hz 139.47 1.18E-02 173 8.49E-05 7.12AFR, 200Hz 91.22 1.74E-02 383 1.91E-04 4.51SMD, 12Hz 1.76 4.23E-05 231 2.40E-05 5.60SMD, 100Hz 0.61 3.55E-05 133 5.85E-05 0.94SMD, 200Hz 1.13 2.76E-04 363 2.44E-04 2.27
Table 7: Transfer functions for region on centreline, at downstream edge of spray

16
4.4 Results- cone angle correlations To be able use the measured transfer functions in calculations of combustor behaviour, UCAM requested information on the variation of cone angle with airbox pressure and injector air pressure drop. For this reason images of the injector were taken with the siren turned off, at a range of airbox pressures and injector air pressure drops. The conditions are given in Tables 8-13. The fuel flows were 0.46l/min (6.2gs-1) for all five Rolls-Royce injectors and 0.16l/min (2.1gs-1) for the Turbomeca module. The LIF images were selected and processed to correct for attenuation of the laser sheet. Strictly this requires two images with the laser propagating in opposite directions: since only one image was taken at each conditions, the image was duplicated and mirrored to provide the second image for the correction routine, yielding a symmetric corrected image. Figures 8 and 9 show the corrected images for injector 71257 and the Turbomeca module. Definitions of cone angle vary. The images will be supplied to UCAM so that the end used can apply their preferred definition of cone angle. A simple definition has been applied to yield the cone angle values given in Tables 8-13. A line is drawn from the prefilmer exit to the contour on one side of the LIF image at 50% of maximum intensity. The line touches the 50% contour but does not cross it at any point i.e. it is a tangent to the 50% contour. The cone angle is defined to be twice the angle between this line and the vertical axis. The uncertainty in cone angle determined this way is +/- 10 degrees.
Figure 8: Images for extraction of cone angle for injector 71257

17
Figure 9: Images for extraction of cone angle for Turbomeca module

18
71257 Pairbox/bar, gauge ∆P/bar
Cone angle/degrees
Condition 0 1.45 0.121 1301 1.74 0.065 1202 1.76 0.075 1253 no no 4 1.68 0.004 1305 1.41 0.223 1106 0.66 0.669 7 0.69 0.397 908 no no 9 0.08 0.960 90
10 0.09 0.380 105Table 8: Conditions and measured cone angle for cone angle images for injector 71257
73630 Pairbox/bar, gauge ∆P/bar
Cone angle/degrees
Condition 0 1.44 0.126 130.0001 1.76 0.066 130.0002 1.76 0.076 135.0003 1.60 0.140 135.0004 1.68 0.002 100.0005 1.50 0.223 125.0006 0.60 0.816 65.0007 0.60 0.382 90.0008 0.60 0.066 125.0009 0.06 1.000 20.000
10 0.06 0.400 80.000Table 9: Conditions and measured cone angle for cone angle images for injector 73630
73030 Pairbox/bar, gauge ∆P/bar
Cone angle/degrees
Condition 0 1.45 0.126 1151 1.76 0.066 1202 1.76 0.077 1203 1.60 0.140 1204 1.72 0.002 305 1.47 0.230 1106 0.58 0.824 7 0.63 0.391 8 0.62 0.069 1109 0.06 1.000 100
10 0.04 0.427 Table 10: Conditions and measured cone angle for cone angle images for injector 73030

19
73685 Pairbox/bar, gauge ∆P/bar
Cone angle/degrees
Condition 0 1.48 0.127 110.0001 1.76 0.068 120.0002 1.77 0.076 120.0003 1.60 0.140 125.0004 1.73 0.003 50.0005 1.45 0.222 125.0006 0.63 0.745 7 0.61 0.382 100.0008 0.60 0.064 125.0009 0.06 0.995
10 0.06 0.402 Table 11: Conditions and measured cone angle for cone angle images for injector 73685
73686 Pairbox/bar, gauge ∆P/bar
Cone angle/degrees
Condition 0 1.45 0.126 1101 1.76 0.066 1202 1.79 0.073 1203 1.57 0.141 1104 1.58 0.002 505 1.47 0.225 1256 0.59 0.808 7 0.62 0.406 8 0.62 0.071 1159 0.06 0.991 90
10 0.04 0.427 100Table 12: Conditions and measured cone angle for cone angle images for injector 73686
Turbomeca Pairbox/bar, gauge ∆P/bar
Cone angle/degrees
Condition 0 2.00 1.810 651 2.10 2.600 652 2.19 0.020 3 2.27 0.175 754 2.42 0.173 605 0.55 0.161 606 1.50 0.173 60
Table 13: Conditions and measured cone angle for cone angle images for the Turbomeca module
4.5 Discussion and conclusions from transfer function measurement at 3 bar Both AFR and SMD show siren-driven fluctuations. These are both potential candidates for the feedback mechanism necessary to sustain combustion oscillation since the SMD affects the rate of release of fuel as vapour. The phase lag varies from injector to injector. There is no detectable oscillation in cone angle at the pressure amplitudes used in these tests. The phase is the same in every region i.e. the same phase holds throughout the spray- this is not surprising as the acoustic wavelengths are several times larger than the extent of the spray. For a given region, the phase of the AFR and SMD fluctuations is different, typically by 140-220o difference between the phase lags of SMD and AFR. A peak in air pressure will produce a peak in AFR and a trough in SMD as the air velocity and hence shear force peaks.

20
The amplitude of the fluctuations is greatest near the prefilmer exit, less on the centreline of the spray or in the recirculation zone. The values of A are frequency sensitive- tending to be greater at 200Hz than 12Hz. In other words there is more fluctuation in AFR or SMD per unit amplitude of air oscillation at the higher frequencies. The injector may have a natural frequency at which it responds most strongly to air pressure fluctuations, and this may influence the frequency of combustion oscillation. However the natural frequency of the combustion chamber, and flow and mixing field effects, will also have a strong effect on the frequency of combustion oscillation. There are some poor fits, as indicated by the values of R2/AC2, indicating that the fluctuations seen are not coherent with the siren, and may be unrelated to the siren. Poor fits are particularly common for injector 73685, which exhibited the weakest rumble in combustion tests. The region at the downstream edge of the spray lies partly and in some cases fully outside the masked region in the SMD image. This gives rise to zero AC amplitudes when fully outside, and when partly outside, to artificially high AC amplitudes and poor fits, as the spray moves in and out of the region during the oscillation. The DC component and the phase vary from injector to injector, naturally, due to the differences in design and flow field. The DC component varies with frequency indicating that the oscillation may affect the DC as well as the AC structure of the spray.
A/Y-bar summed over all freqs, both SMD and AFR
R^2/AC^2 summed over all freqs, both SMD and AFR
Injector Rumble amplitude/Pa
Centre of recirc. zone
Near prefilmer exit
Centreline at recirc. zone height
Centre of recirc. zone
Near prefilmer exit
Centreline at recirc. zone height
71257 9235.28 7.65E-05 9.55E-05 7.00E-05 41.7 22.4 52.4 73630 8270.4 9.80E-05 1.00E-04 1.13E-04 18.7 30.0 15.2 73030 8270.4 5.24E-05 6.54E-05 4.06E-05 16.1 22.5 28.7 73685 344.6 6.66E-05 6.23E-05 5.42E-05 159.8 95.4 57.1 73686 1378.4 6.89E-05 1.14E-04 4.54E-05 9.9 20.6 29.1
Table 14: Correlation of transfer function amplitudes and fit quality with combustion rumble
amplitudes Table 14 shows the relation between transfer function variables and rumble amplitudes measured in a combustor at 3 bar, 84AFR and 380K YA / is the ratio of the amplitude of the fluctuating component (per unit pressure amplitude) of AFR or SMD to the DC component, and is summed over all three frequencies and over the AFR and SMD transfer functions. R2/AC2, the fit quality function, is high when the fit of the sinusoidal transfer function to the measured data is poor. The correlation between transfer function amplitude and rumble is not perfect, as the test excludes several combustion related processes that contribute to rumble. However YA / is consistently high for the injector with strongest rumble, (71257) indicating a strong coherent response to the siren, and the fit quality parameter is consistently high for the injector with lowest rumble amplitude (73685) due to it’s non-sinusoidal, non-coherent response to the siren. This suggests tests of this type can be used identify those injectors most and least likely to encourage rumble before any expensive combustion test. Note that the rumble amplitudes are sensitive to combustor inlet air temperature. Note also that the rig test reveals injector-related instability feedback mechanisms but does not include combustion, combustor walls, or combustor and flowfield related mechanisms such as combustion chamber natural frequency, stretch factor and vortex shedding effects. However the prediction of the best and worst injector is promising and suggests that the relatively inexpensive non-combusting test used here may be used to test a selection of injectors and

21
select those that are least likely to amplify combustion instability, before any (order of magnitude more expensive) combustion test is carried out. 5 Relation of the results to the previous 1-bar work reported in D3.03 The 1 bar PLIF and LSD imaging results support the observation made on the 3 bar results above. No fluctuation in cone angle was apparent, but a cyclic variation in fuel concentration and SMD was seen. The phase difference between the concentration and SMD cycles was the same as in the 3 bar data. Phase was constant over each image. Additionally at 1bar, the prefilmers of two devices were imaged with a high speed camera and borescope. This yielded an interesting result on the behaviour of the fuel at the prefilmer. Full details are in D3.03. The two devices were labelled Device A, which had exhibited strong rumble in combustion tests, and Device B, which did not, even when operated under identical conditions. The high speed camera image sequences were analysed as follows. The time series of intensity of light scattered by fuel on prefilmer were Fourier transformed to reveal the spectrum of fluctuations (Figure 10). In these spectra, there were peaks near the siren frequency, and these peaks may be stronger for Device A, but there were peaks of similar intensities at non-siren frequencies also. The next stage of analysis integrated the magnitude of the Fourier transform over the range 2-500Hz. These integrated magnitudes relate to the amount of or energy contained in the fluctuations. Excluding data at <2Hz excludes the d.c. or non-fluctuating component. The integrated intensities are plotted against siren frequency in Fig. 11.
Figure 10: Spectra of light scattered by fuel on prefilmers of Device A and B
Figure 11: Integrated magnitudes of spectra in Figure 10 versus siren frequency
Both devices exhibited some fluctuation. Device B shows level of fluctuation that is constant across a wide range of frequencies, increasing slowly at >200Hz. Device A however shows a

22
clear maximum in the level of fluctuation, around 200-300Hz i.e. in the range of frequencies taken by the self excited instabilities observed in combustion tests. PDA measurements on these injectors showed fluctuations in SMD coherent with the siren, and that the amplitude for Device A was stronger than for Device B. This suggests that the events at the prefilmer have an important role in determining whether a given injection device will be stable or susceptible to combustion instability when incorporated into the whole combustion system. Acoustic perturbation at the prefilmer may for susceptible devices result in fluctuations in the fuel structures on the prefilmer. Less susceptible devices may exhibit weaker coupling between the acoustic wave and the prefilmer fuel fluctuations. These may result in fluctuations in the fuel-air-ratio and/or dropsize, providing a feedback mechanism to allow self excited instabilities to grow. While the driving acoustic wave excites fluctuations at a wide range of frequencies at the prefilmer, the frequencies that are amplified by the whole thermo-acoustic cycle will be partly selected by the acoustics of the combustion chamber. Further, these results suggest that the strength of the acoustic/prefilmer coupling depends on the geometry of the prefilmer and the surrounding air passages. The susceptibility of the whole combustion system to instability may be strongly influenced by subtle aspects of the design of the fuel injector. 6 Correlations between injection geometry and rumble, and recommendations for the design of rumble-resistant injectors 6.1 Introduction As part of Task 3 WP3 we have studied five Rolls-Royce airblast injectors, all designed for the same combustor. In engine tests, despite using the same combustor and operating conditions, different injectors gave differing intensities of rumble. Clearly the design of the injector affects the susceptibility of the combustor to rumble. We searched for correlations between the rumble intensity with aspects of the design geometry of the injectors. On the basis of the correlations found, we can make recommendations which may help the design of injectors that do not cause rumble. 6.2 Method The five injectors are identified by their part numbers: 71257, 73630, 73030, 73685 and 73686. All are prefilming airblast injectors with three concentric air swirlers denoted, in order of increasing radius, inner, outer and dome. The prefilmer and fuel gallery lies between the inner and outer swirlers. Common to all five injectors was the outer package dimensions, the inner and outer radii of the swirlers and the fuel gallery, and the vane angle in the inner swirler. The following characteristics were different for each injector and were measured: Prefilmer length (axial length exposed to air from inner swirler) Effective area of air passages (geometric area X discharge coefficient) UK fuel flow number (UK gallons/hour/√psi) Overall flow number Angle of vanes in each swirler (the angle between the vane and the plane of the outlet- the plane that lies perpendicular to the axis of the nozzle) These measurements are given in Table 15.
Part number
prefilmer length/mm
effective area/mm2
UK flow number
Overall flow number
outer swirler vane angle/degrees
dome swirler vane angle/degrees
71257 2.08 230 4.25 6.07 60 42 73630 1.72 250 4.25 4.71 52 52 73686 1.38 202 3.61 3.88 72 54 73030 2.02 202 4.25 4.71 52 52

23
73685 1.26 180 3.61 3.88 57 55 Table 15: Measurements of injector geometry
The rumble intensities were measured at a range of operating conditions in engine tests at Rolls-Royce plc. For full details please contact Dr M Macquisten. The operating conditions for which the rumble was most intense and the difference between their injectors were most marked were: combustor pressure 40 psi absolute, overall combustor AFR 84, combustor inlet temperature 350K and 380K. The rumble amplitudes for these pressures are given in Table 16.
Part number
40psi 84AFRcomb 350K
40psi 84AFRcomb 380K
71257 1.34 0.96 73630 1.2 0.95 73686 0.2 0.05 73030 1.2 0.3 73685 0.05 0
Table 16: Rumble amplitudes in psi To quantify the correlation between the rumble amplitude and the injector geometry, Spearman’s correlation coefficient was calculated. Spearman’s coefficient is a measure of how well correlated two sets of variables (x1,x2,….,xn) and (y1,y2,….,yn) are and is defined in Eq. 3
−
−
−
∑∑
∑
==
=
2
1
22
1
2
1
11
1
yyn
xxn
yxyxn
n
ii
n
ii
n
iii
Eq. 3
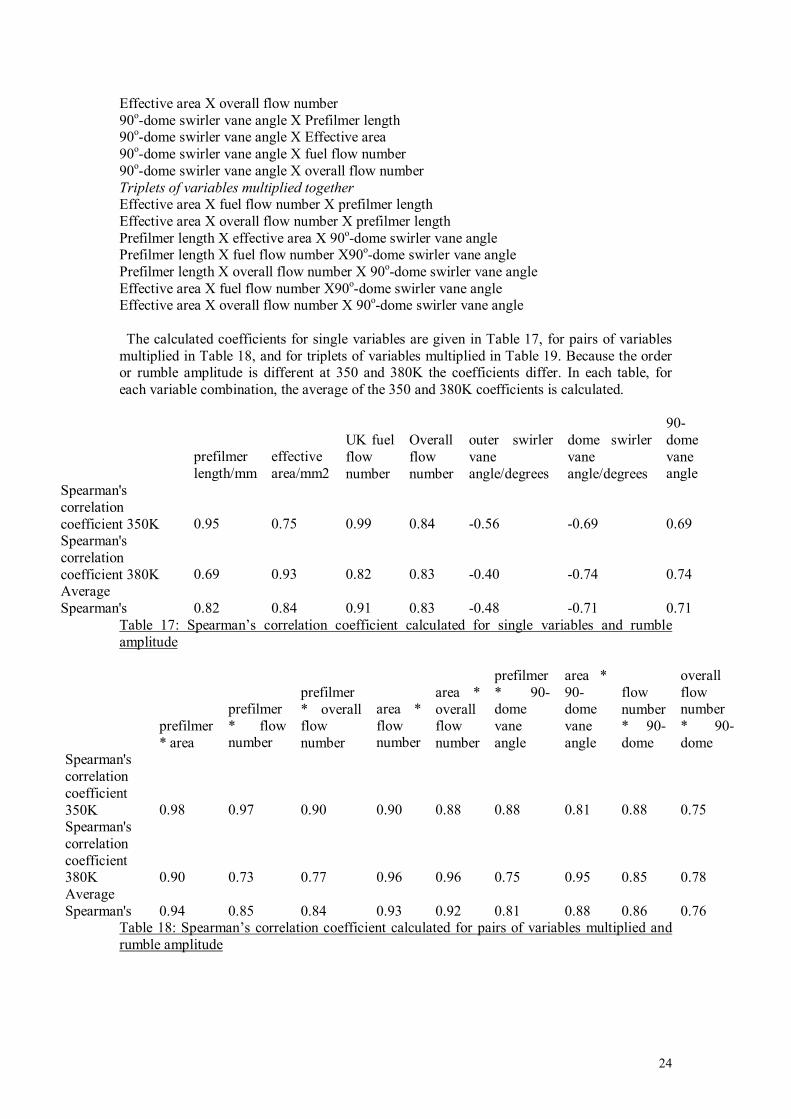
where x is the mean of (x1,x2,….,xn). Spearman’s coefficient takes a value of 1 for a perfectly linear correlation, a value of -1 for a linear anti-correlation (i.e. one variable increases as the other decreases) and zero for no correlation at all. Note we are calculating the correlation of the variables themselves (the rumble amplitude in psi and the measurements e.g. prefilmer length in mm) not the rank or order of the variables, as is more common. Since the flow and combustion physics is complex we do not expect a perfectly linear correlation between rumble intensity and any other variable so we do not expect to find values of 1 or -1. However, the higher the coefficient, the more strongly the variable is correlated to rumble amplitude. The Spearman’s coefficient was calculated for the rumble intensities at 350K or 380K and each of the following variables and combinations of variables multiplied together: Single variables Prefilmer length Effective area Fuel flow number Overall flow number Outer swirler vane angle Dome swirler vane angle 90o-dome swirler vane angle Pairs of variables multiplied together Prefilmer length X effective area Prefilmer length X fuel flow number Prefilmer length X overall flow number Effective area X fuel flow number
24
Effective area X overall flow number 90o-dome swirler vane angle X Prefilmer length 90o-dome swirler vane angle X Effective area 90o-dome swirler vane angle X fuel flow number 90o-dome swirler vane angle X overall flow number Triplets of variables multiplied together Effective area X fuel flow number X prefilmer length Effective area X overall flow number X prefilmer length Prefilmer length X effective area X 90o-dome swirler vane angle Prefilmer length X fuel flow number X90o-dome swirler vane angle Prefilmer length X overall flow number X 90o-dome swirler vane angle Effective area X fuel flow number X90o-dome swirler vane angle Effective area X overall flow number X 90o-dome swirler vane angle The calculated coefficients for single variables are given in Table 17, for pairs of variables multiplied in Table 18, and for triplets of variables multiplied in Table 19. Because the order or rumble amplitude is different at 350 and 380K the coefficients differ. In each table, for each variable combination, the average of the 350 and 380K coefficients is calculated.
prefilmer length/mm
effective area/mm2
UK fuel flow number
Overall flow number
outer swirler vane angle/degrees
dome swirler vane angle/degrees
90- dome vane angle
Spearman's correlation coefficient 350K 0.95 0.75 0.99 0.84 -0.56 -0.69 0.69 Spearman's correlation coefficient 380K 0.69 0.93 0.82 0.83 -0.40 -0.74 0.74 Average Spearman's 0.82 0.84 0.91 0.83 -0.48 -0.71 0.71
Table 17: Spearman’s correlation coefficient calculated for single variables and rumble amplitude
prefilmer * area
prefilmer * flow number
prefilmer * overall flow number
area * flow number
area * overall flow number
prefilmer * 90- dome vane angle
area * 90- dome vane angle
flow number * 90- dome
overall flow number * 90- dome
Spearman's correlation coefficient 350K 0.98 0.97 0.90 0.90 0.88 0.88 0.81 0.88 0.75 Spearman's correlation coefficient 380K 0.90 0.73 0.77 0.96 0.96 0.75 0.95 0.85 0.78 Average Spearman's 0.94 0.85 0.84 0.93 0.92 0.81 0.88 0.86 0.76
Table 18: Spearman’s correlation coefficient calculated for pairs of variables multiplied and rumble amplitude

25
area * flow number * prefilmer
area * overall flow number * prefilmer
prefilmer * area * 90- dome vane angle
prefilmer * flow number * 90- dome vane angle
prefilmer * overall flow number * 90- dome vane angle
area * flow number * 90- dome vane angle
area * overall flow number * 90- dome vane angle
Spearman's correlation coefficient 350K 0.99 0.92 0.91 0.91 0.82 0.90 0.80 Spearman's correlation coefficient 380K 0.89 0.88 0.88 0.78 0.76 0.96 0.89 Average Spearman's 0.94 0.90 0.90 0.85 0.79 0.93 0.85
Table 19: Spearman’s correlation coefficient calculated for triplets of variables multiplied and rumble amplitude 6.3 Discussion Prefilmer length, effective area, fuel and overall flow number correlate well with rumble amplitude. Outer swirler vane angle shows a weak anticorrelation. Note the outer swirler has a small cross sectional area compared to the inner and dome swirlers and is less important to the operation of the injector. Dome swirler vane angle shows a reasonably strong anticorrelation. 900-dome swirler vane angle therefore shows positive correlation of the same magnitude. The strongest correlation to any of the single variables is to fuel flow number with a coefficient of 0.91. There is a stronger correlation to some of the pairs of variables multiplied- the strongest is to the prefilmer length X effective area with a coefficient of 0.94, the next strongest to effective area X fuel flow number at 0.93. There are correlations of the same strength to some of the triplets of variables multiplied, with the strongest being to effective area X fuel flow number X prefilmer length at 0.94 and the next strongest to effective area X fuel flow number X 90o- dome vane angle at 0.93. It appears that the variables most strongly linked to rumble amplitude are fuel flow rate, prefilmer length and effective area. Dome swirler vane angle may have an effect though it is less marked than the other three factors. In this study the air passages adjacent to the prefilmer i.e. inner and outer swirlers were not found to have an effect. However all five injectors have the same inner swirler, and the outer swirler has a small cross sectional area and will only provide a small fraction of the air flow. Therefore no firm conclusion can be drawn on the role of the inner and outer air passages. In the engine tests the fuel flow rate and combustor pressure drop are the same for each injector. Therefore the injector AFR will increase with the injector effective area. The effect of area on rumble amplitude may simply be one of leaning out the AFR in the flame zone. In any case when a lean injector is to be designed it must by definition have a large effective area. Therefore this is of little use in reducing the susceptibility to rumble. The effect of fuel flow number, prefilmer length and dome vane angle are more interesting for the designer. Care must be taken that, since we have a small dataset (only 5 injectors) the apparent correlation of these variable with rumble amplitude is not due to an accidental correlation of flow number and prefilmer length with effective area and hence AFR. To check this the correlation between these variables and effective area is examined by calculating Spearman’s correlation coefficient. The value for correlation between prefilmer length and effective area is 0.54 indicating a weak correlation but not enough to explain a coefficient of 0.82 between prefilmer length and rumble amplitude. The value for fuel flow number and effective area is 0.73 indicating a stronger correlation- but again not enough to explain a

26
correlation coefficient of 0.91 between fuel flow number and rumble amplitude. Note that the probability of chance correlation between fuel flow number and anything else is high, since over the five injectors there are only two different values of fuel flow number. The value for correlation between 90o-dome vane angle and effective area is 0.51, again not enough to explain the correlation between 90o-dome vane angle and rumble amplitude. The effect of flow number might be explained by the restricted metering passages damping out oscillations in fuel flow rate, or by mixing effects due to the velocity of the fuel as it leaves the prefilmer. Larger flow number requires larger metering slots and for the same fuel flow rate or power setting, lower fuel exit velocity and momentum. The effect of the prefilmer is in line with a study of two injectors of a design different to those studied above (ICLEAC Deliverable 3.3) which suggested that rumble amplitude in combustion tests was linked to fluctuations in the fuel on the prefilmer in the same band of frequencies as the rumble. The prefilmer will have an effect on the atomisation of fuel and its transfer into the air stream. Differences in prefilmer design affect the time for which the fuel is exposed to air pressure or velocity fluctuations in the combustion chamber. Its subsequent trajectory and mixing will be affected by the atomisation and release at the prefilmer, and by the air passage design. Mixing will also be affected by the fuel momentum at the prefilmer, determined in part by the size of the metering slots and the flow number. 6.4 Conclusions and design recommendations For the injectors studied, the aspects of injector design which correlate most strongly with the rumble amplitude are: fuel flow number, prefilmer length, dome swirler vane angle and effective area. The influence of effective area is explained simply since at a fixed pressure drop, flame zone AFR and hence flame stability is directly related to effective area. The effect of the prefilmer is in line with a study of two injectors of a design different to those studied above (Deliverable 3.03) which suggested that rumble amplitude in combustion tests was linked to fluctuations in the fuel on the prefilmer. This study suggests that to achieve low rumble amplitude the injector should be designed with a short prefilmer, a low fuel flow number, and a high angle between the dome vane and the nozzle outlet plane. Vane angle is less important than the prefilmer and flow number. The set of injectors studied is small and contained no variations in inner swirler vane angle. 7 Overall conclusions A new optically accessed sprays rig with a maximum pressure of 7 bar has been constructed. The response of five airblast injectors and one lean module to an acoustic perturbation on the injector airflow has been measured at 3 bar. When operated in the same combustor at the same conditions, the five airblast injectors all exhibited different rumble amplitudes. Spray transfer functions, which describe the oscillatory response of the AFR and SMD at several points in the spray to the acoustic perturbation, have been measured. The relationship between cone angle and injector pressure drop has also been measured. The conclusions from the measurements agree with the previously reported 1 bar work The results show a cyclic change in AFR and in SMD, coherent with the applied acoustic perturbation. Fluctuations in AFR and SMD offer candidates for the feedback mechanism required to sustain self-excited combustion instability. The amplitude and phase of the cyclic change varies from injector to injector and are frequency sensitive. The amplitudes and quality of fit correlate, though not perfectly, with the rumble amplitude measured in combustion tests, and can be used to predict the best (smallest rumble amplitude) and worst (highest amplitude) injectors. That the correlation is not perfect is due to the fact that the spray rig does not simulate all aspects of combustor behaviour. For example it does not include combustor walls, dilution flows, stretch factor or vortex shedding effects. Also, there are feedback mechanisms related to the chamber natural frequency and flow and mixing fields which do not involve the injector. Nevertheless these spray rig tests are a useful way to break down the problem into

27
parts for detailed study. Also, the correlation between measured transfer function amplitudes and quality of fit shows that the inexpensive non-combusting rig tests used here can be used to identify those injectors likely to cause strong susceptibility to or amplify rumble in the combustor, before any (order of magnitude more expensive) combustion tests are carried out. The injector behaviour revealed by these tests, and the interaction of injector aerodynamics and acoustic excitation, are worthy of further investigation. The relationship between injector design and observed rumble amplitudes was investigated for the five airblast injectors. The aspects of injector design which correlate most strongly with the rumble amplitude are: fuel flow number, prefilmer length, dome swirler vane angle and effective area. The influence of effective area is explained simply since at a fixed pressure drop, flame zone AFR and hence flame stability is directly related to effective area. The importance of the prefilmer agrees with a study of two injectors of a design different to those studied above which suggested that rumble amplitude in combustion tests was linked to fluctuations in the fuel on the prefilmer. The strength of the acoustic/spray coupling may depend on the geometry of the prefilmer and the surrounding air passages. Although the set of injectors studied is small and contained no variations in inner swirler vane angle, this study suggests that to achieve low rumble amplitude the injector should be designed with a short prefilmer, a low fuel flow number, and a high angle between the dome vane and the nozzle outlet plane. Vane angle is less important than the prefilmer and flow number. 8 Acknowledgements We would like to thank Brian Scully, Dick Kennewell and Bob Wilson for technical assistance, and the CEC and all partners in ICLEAC for support. 9 References Deliverable 3.03 of ICLEAC, Jermy M, Doherty WG and Greenhalgh DA “The interaction between the fuel injector spray and an acoustic field, measured at low pressure”, 15th March 2002 Greenhalgh DA and Jermy M ‘Laser Diagnostics for droplet measurements for the study of fuel injection and mixing in gas turbines and i.c. engines’, Chap. 15 in ‘Applied Combustion Diagnostics’ eds. K. Kohse-Hoeinghaus and J. Jeffries, Taylor and Francis, in press 2002 Jermy MC and Greenhalgh DA, 2000, 'Planar dropsizing by elastic and fluorescence scattering in sprays too dense for phase Doppler measurement', Appl Phys B 71 703-710 Jermy MC, Hussain M and Greenhalgh DA, “Operating liquid-fuel airblast injectors in low pressure test rigs: strategies for scaling down the flow conditions” Measurement Science and Technology, 2003, vol. 14, no. 7, pp. 1151-1158(8) Kelman JB, Sherwood G, O’Young F, Berckmüller M, Jermy MC, Masri AR and Greenhalgh DA, (2000) ‘Pulsed laser imaging in practical combustion systems from 2D to 4D’, in Optical Diagnostics for Industrial Applications, Ed. NA Halliwell, Proceedings of the SPIE Vol. 4076 pp55-65 Le Gal P, Farrugia N and Greenhalgh DA, (1999) 'Laser Sheet Dropsizing of dense sprays' Opt. Laser. Technol. 31 75-83 Tally DG, Verdieck JF, Lee SW, McDonell VG and Samuelsen GS, ‘Accounting for laser sheet extinction in applying PLLIF to sprays’, AIAA 96-0469 (1996)