ICBA-IAEA - Training on water management and use of crop simulation model- richard soppe, icba
34
Concepts of water productivity for irrigated saline lands Water Management and use of crop simulation models AquaCrop 2-13 October 2016 Richard Soppe
-
Upload
icba-ag4tomorrow -
Category
Education
-
view
83 -
download
0
Transcript of ICBA-IAEA - Training on water management and use of crop simulation model- richard soppe, icba

Concepts of water productivity
for irrigated saline lands
Water Management and use of crop simulation models AquaCrop
2-13 October 2016
Richard Soppe

• Innovation
• Partnership
• Impact
Outline
- crop water productivity
- economical water productivity
- water delivery efficiency
- irrigation efficiency
- other efficiencies

Crop water productivity
-The production of biomass, or yield, per unit water consumed
-Thus not related to irrigation water delivery, but related to
the consumed water Evaporation + Transpiration
- Can be related to total biomass production, or to actual yield.
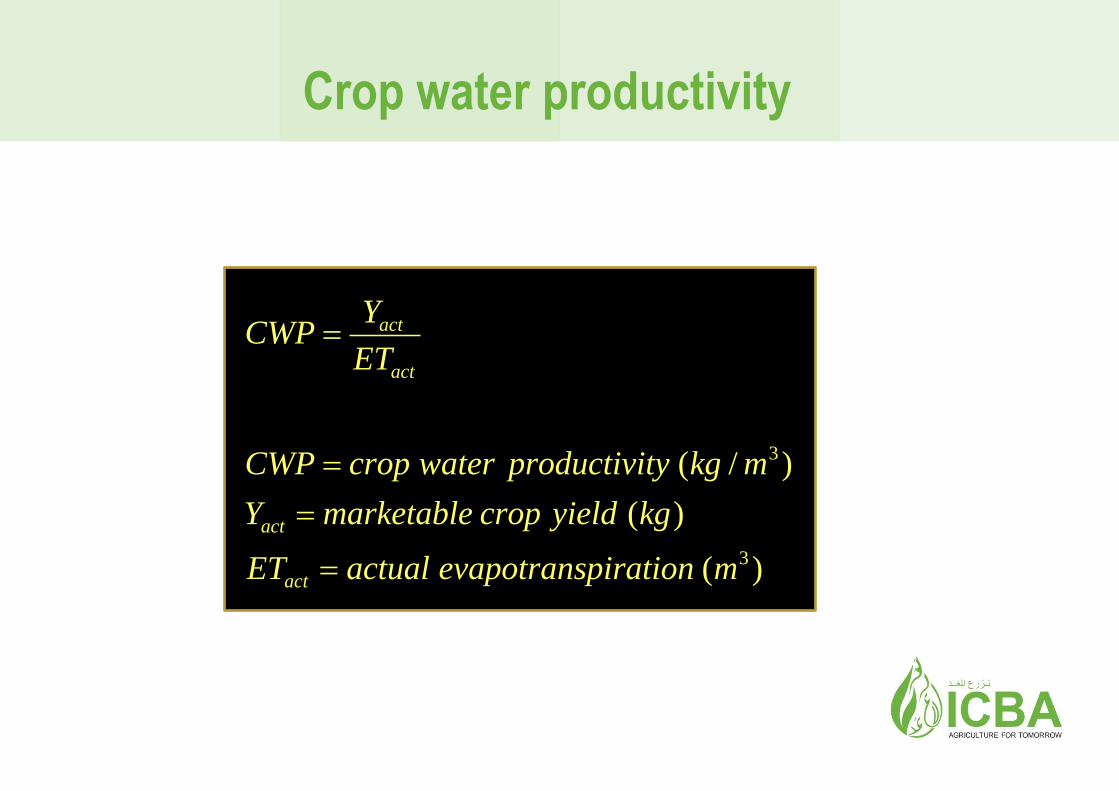
Crop water productivity
)(
)(
)/(
3
3
mpirationevapotransactualET
kgyieldcropmarketableY
mkgtyproductiviwatercropCWP
ET
YCWP
act
act
act
act

Wheat - example

Economic water productivity
-The value of production (income – cost) per
unit water consumed

Remote sensing based

Economic water productivity
0 1 2 3 4 5CWP Fresh Banana (kg/m3)
0
0.01
0.02
0.03
norm
alized n
um
ber
of
pix
els
(-)
-3 -2 -1 0 1 2 3Economic cwp (R/m3)
0
0.005
0.01
0.015
0.02
0.025
norm
alized n
um
ber
of
pix
els
(-)
400 800 1200 1600ETa (mm)
0
0.004
0.008
0.012
0.016
0.02
norm
alized n
um
ber
of
pix
els
(-)
400 800 1200 1600ETa (mm)
0
0.004
0.008
0.012
0.016
0.02
norm
alized n
um
ber
of
pix
els
(-)
340 740 1140ETa (mm)
Areas with lowest
bio-physical cwp
first out of prod
Areas with lowest
economic cwp
first out of prod
Quota per hectare
targets largest per
hectare users first
Use is reduced
proportionally, i.e.
in an equal way
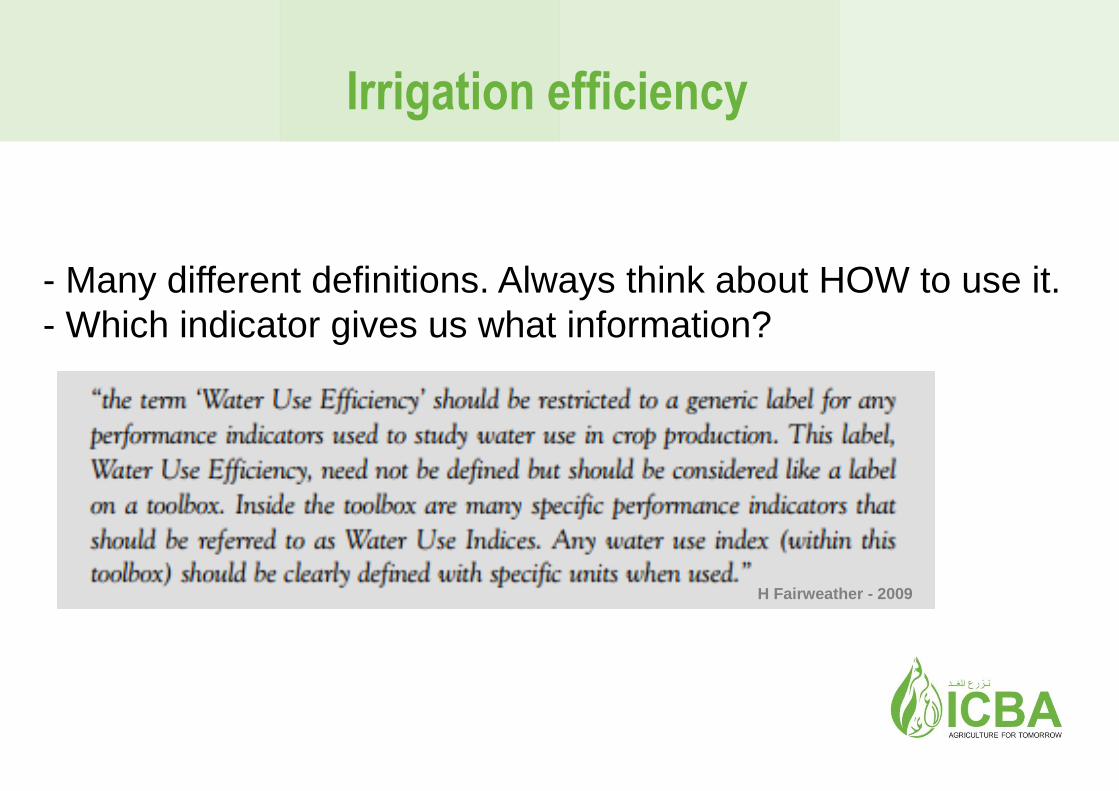
Irrigation efficiency
- Many different definitions. Always think about HOW to use it.
- Which indicator gives us what information?
H Fairweather - 2009

Soil and water balance, water flow in
saturated and unsaturated soil, infiltration
rates, hydraulic conductivity
Water Management and use of crop simulation models AquaCrop
2-13 October 2016
Richard Soppe

Water fluxes in an irrigated field
7

Salt accumulation as a result of evaporation

Water fluxes transporting salts
1. Irrigation sources
2. Deep percolation
3. Drainage out of the field
4. Internal drainage from the root zone
5. Regional groundwater to the drain
6. Groundwater upflow into the root zone
7. Evapotranspiration of water and salt transport to soil surface

Daily salt load into and out of
the San Joaquin Valley
Salinity at a regional scale

Water and salt balance
I x ECi
P
ET
Root
zone
Watertable
R* (= R - G) x ECe

Schematic Lysimeter
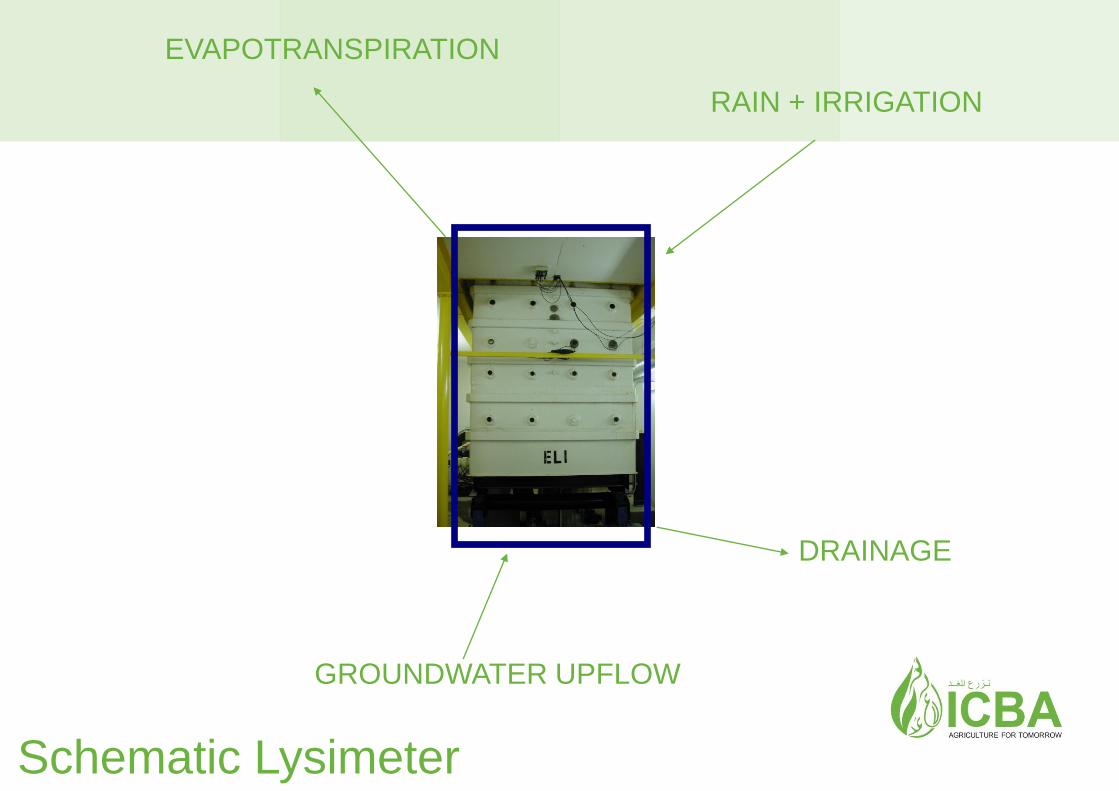
Schematic Lysimeter
RAIN + IRRIGATION
GROUNDWATER UPFLOW
DRAINAGE
EVAPOTRANSPIRATION
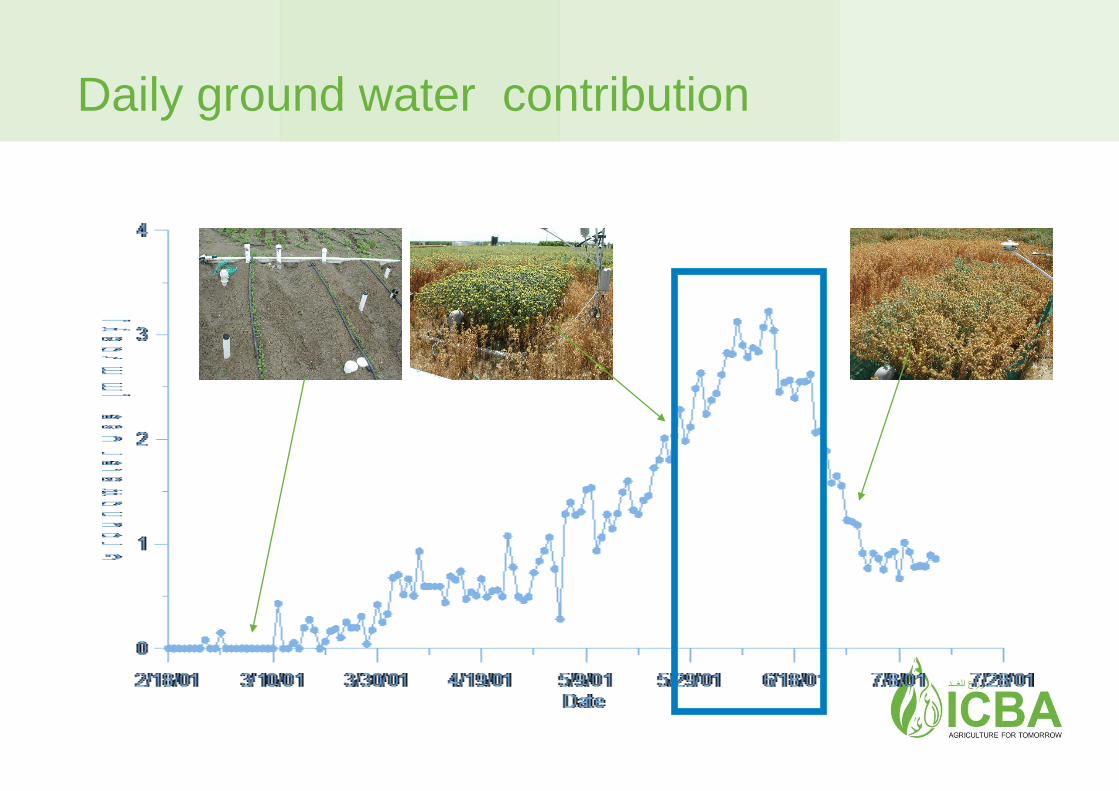
Daily ground water contribution

Soil Water Sensors
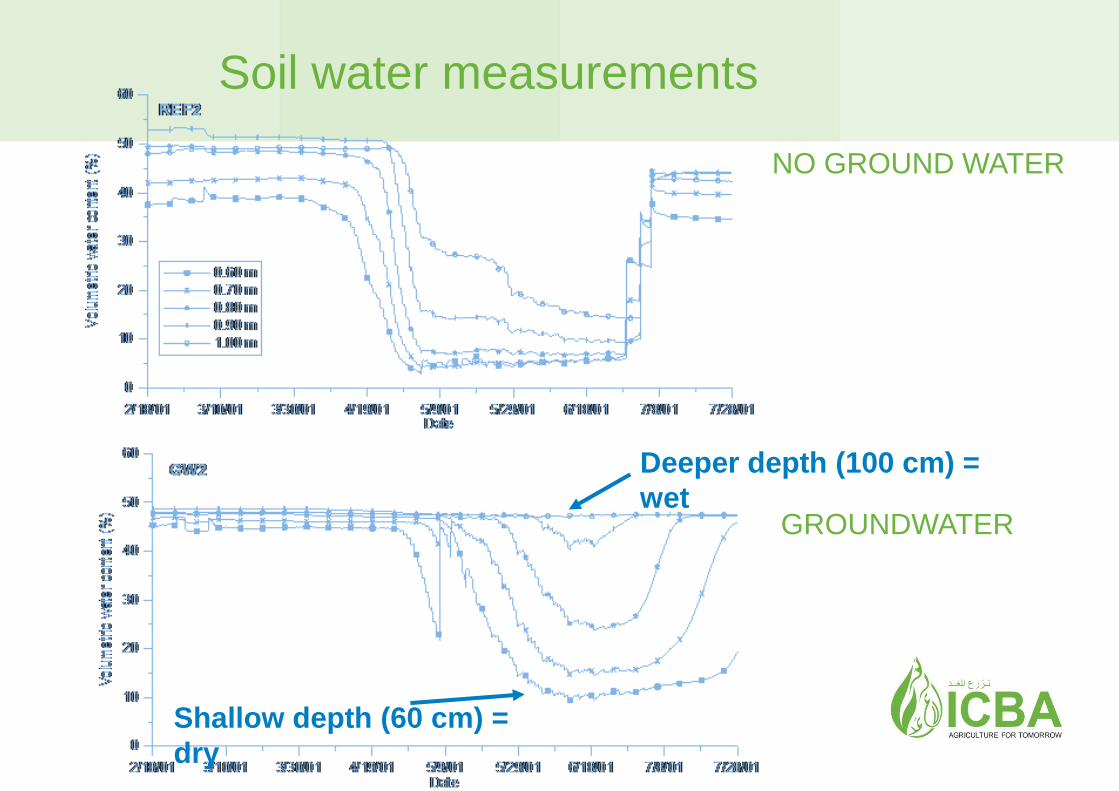
Soil water measurements
NO GROUND WATER
GROUNDWATER
Shallow depth (60 cm) =
dry
Deeper depth (100 cm) =
wet
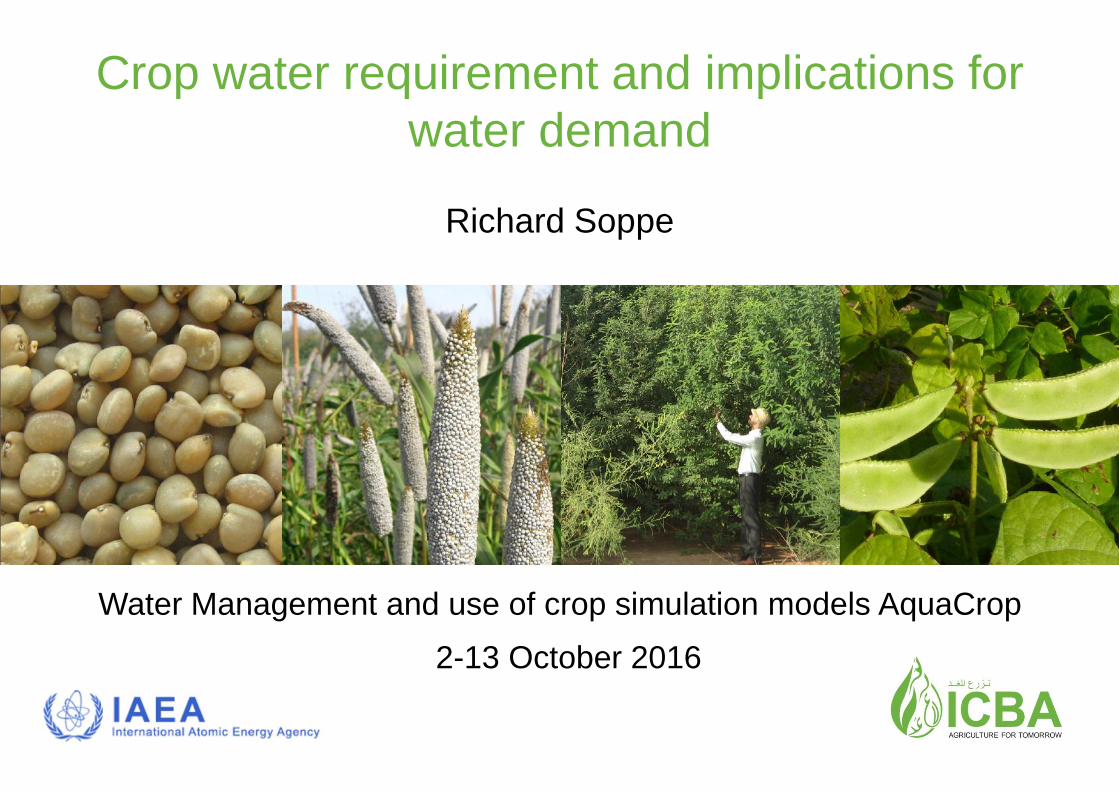
Crop water requirement and implications for
water demand
Water Management and use of crop simulation models AquaCrop
2-13 October 2016
Richard Soppe

• Innovation
• Partnership
• Impact
Outline
- Crop water requirement
Evapotranspiration…
Crop coefficients
Reality
- Water demand implications

• Innovation
• Partnership
• Impact
Evapotranspiration
PAGE 6
FAO 56

Reference evapotranspiration equation
a
s
a
aspan
r
r
r
eecGR
E
1
ceresisairbulkr
ceresissurfacebulkr
tconscpsycometri
densityairmean
airofheatspecificc
airofdeficitpressurevaporee
fluxheatSoilG
radiationNetR
iprelationshetemperaturpressurevaporsatofslope
fluxheatlatentE
a
s
a
p
as
n
tan
tan
tan
PAGE 19
FAO 56

Reference evapotranspiration - measurements
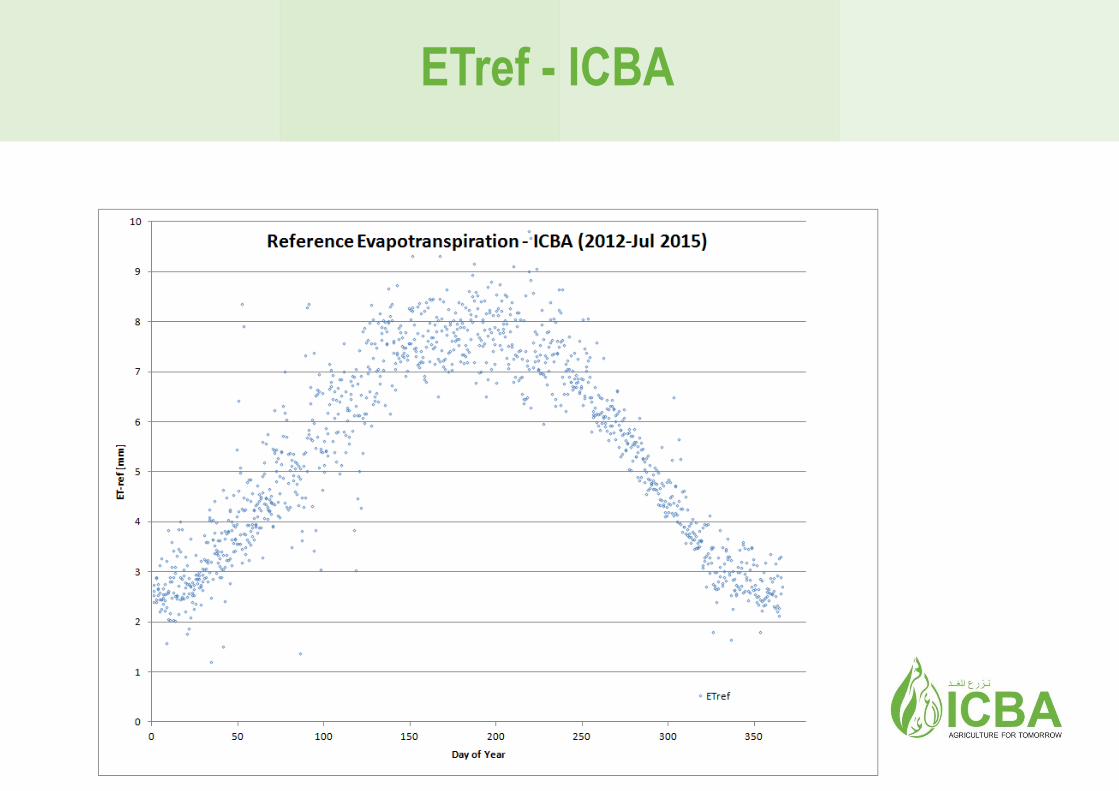
ETref - ICBA

Evapotranspiration calculations
Water Management and use of crop simulation models AquaCrop
2-13 October 2016
Richard Soppe

ET ref – daily time step
PAGE 24
][tanhom
][
][
][
][22
][2
][
][
34.01
273
900408.0
1
1
1
12
12
2
2
CkPatconsetricpsyc
CkPacurvepressurevapourslope
KPapressurevapouractuale
KPapressurevapoursaturatione
smheightmatspeedwindu
CheightmatetemperaturairT
daymMJdensityfluxheatsoilG
daymMJsurfacecroptheatradiationnetR
u
eeuT
GR
ET
a
s
n
asn
O

Calculation exercise – input parameters
PAGE 67
Dubai, 9 Oct 2016
35
25
30
30
1.8
30
0.243
0.067
1.612
0.692
0.191
5.529

Calculation exercise - vpd
PAGE 67
35
25
5.623
3.168
4.486
75
25
2.376
1.406
1.891
2.594

Calculation exercise – radiation
PAGE 6825.10
283Oct
0.8
35
25
1.891
30.8
20.0223.12
0.86615.4244.21
38.7541.480.147
0.866 0.8194.9910.4
10.44.25

Calculation exercise – ETref
PAGE 68
0.692*4.25=2.94
0.191*5.529*2.594=2.74
5.7

Calculation exercise – ETref
http://extension.uidaho.edu/kimberly/2015/06/ref-et-reference-evapotranspiration-calculator/

A unique Center of Excellence
looking at Agriculture for Tomorrow
Thank youFor more information and ICBA publications visit
www.biosaline.org
International Center for Biosaline Agriculture (ICBA) is an international, non-profit organization that aims to strengthen agricultural productivity in
marginal and saline environments through identifying, testing and facilitating access to sustainable solutions for food, nutrition and income security.