IBISWorld Industry Report 71395 Bowling Centers in...
33
IBISWorld Industry Report 71395 Bowling Centers in the US October 2014 Stephen Hoopes Gutter ball: When tournament play loses popularity, the industry takes a tumble 2 About this Industry 2 Industry Definition 2 Main Activities 2 Similar Industries 3 Additional Resources 4 Industry at a Glance 5 Industry Performance 5 Executive Summary 5 Key External Drivers 7 Current Performance 9 Industry Outlook 11 Industry Life Cycle 13 Products & Markets 13 Supply Chain 13 Products & Services 14 Demand Determinants 15 Major Markets 16 International Trade 17 Business Locations 19 Competitive Landscape 19 Market Share Concentration 19 Key Success Factors 20 Cost Structure Benchmarks 22 Basis of Competition 22 Barriers to Entry 23 Industry Globalization 24 Major Companies 24 Bowlmor AMF 27 Operating Conditions 27 Capital Intensity 28 Technology & Systems 28 Revenue Volatility 29 Regulation & Policy 30 Industry Assistance 31 Key Statistics 31 Industry Data 31 Annual Change 31 Key Ratios 32 Jargon & Glossary www.ibisworld.com | 1-800-330-3772 | info @ ibisworld.com
Transcript of IBISWorld Industry Report 71395 Bowling Centers in...
WWW.IBISWORLD.COM Bowling Centers in the US October 2014 1
IBISWorld Industry Report 71395Bowling Centers in the USOctober 2014 Stephen Hoopes
Gutter ball: When tournament play loses popularity, the industry takes a tumble
2 About this Industry2 Industry Definition
2 Main Activities
2 Similar Industries
3 Additional Resources
4 Industry at a Glance
5 Industry Performance5 Executive Summary
5 Key External Drivers
7 Current Performance
9 Industry Outlook
11 Industry Life Cycle
13 Products & Markets13 Supply Chain
13 Products & Services
14 Demand Determinants
15 Major Markets
16 International Trade
17 Business Locations
19 Competitive Landscape19 Market Share Concentration
19 Key Success Factors
20 Cost Structure Benchmarks
22 Basis of Competition
22 Barriers to Entry
23 Industry Globalization
24 Major Companies24 Bowlmor AMF
27 Operating Conditions27 Capital Intensity
28 Technology & Systems
28 Revenue Volatility
29 Regulation & Policy
30 Industry Assistance
31 Key Statistics31 Industry Data
31 Annual Change
31 Key Ratios
32 Jargon & Glossary
www.ibisworld.com | 1-800-330-3772 | [email protected]

WWW.IBISWORLD.COM Bowling Centers in the US October 2014 2
Operators in this industry primarily operate bowling centers. Establishments also often sell food and beverages.
The primary activities of this industry are
Providing open play bowling
Providing league play bowling
Renting bowling shoes
Selling food, alcoholic beverages and non-alcoholic beverages
Providing laser tag, miniature golf and other games
Selling bowling supplies in pro shops
71311 Amusement Parks in the USCompanies in this industry operate mechanical rides, water rides, games, shows, themed exhibits, refreshment stands and other attractions.
71312 Arcade, Food & Entertainment Complexes in the USCompanies in this industry operate video game arcades and game-focused family entertainment centers.
71399 Golf Driving Ranges & Family Fun Centers in the USCompanies in this industry provide recreational and amusement services through a variety of establishments, including golf driving ranges, miniature golf centers and a range of others.
NN003 Video Games in the USCompanies in this industry retail gaming consoles and games and develop and manufacture consoles, games and accessories.
Industry Definition
Main Activities
Similar Industries
About this Industry
The major products and services in this industry are
Bar/lounge
Bowling – league play
Bowling – open play
Laser tag
Restaurant
Shoe rental
Snack bar
Other

WWW.IBISWORLD.COM Bowling Centers in the US October 2014 3
About this Industry
IBISWorld writes over 700 US industry reports, which are updated up to four times a year. To see all reports, go to www.ibisworld.com
Additional Resources For additional information on this industry
www.bpaa.com Bowling Proprietors’ Association of America
www.bowl.com United States Bowling Congress
www.worldbowling.org World Bowling

WWW.IBISWORLD.COM Bowling Centers in the US October 2014 4
Uni
ts
5.4
5.0
5.1
5.2
5.3
2006 08 10 12 14 16 18Year
Time spent on leisure and sports
SOURCE: WWW.IBISWORLD.COM
% c
hang
e
10
−10
−5
0
5
2006 08 10 12 14 16 18Year
Revenue Employment
Revenue vs. employment growth
Products and services segmentation (2014)
17.8%Bowling – open play
11.1%Snack bar
15.8%Bowling – league play
7.0%Laser tag
4.2%Shoe rental
15.1%Other14.8%
Bar/lounge
14.2%Restaurant
SOURCE: WWW.IBISWORLD.COM
Key Statistics Snapshot
Industry at a GlanceBowling Centers in 2014
Industry Structure Life Cycle Stage Decline
Revenue Volatility Low
Capital Intensity Medium
Industry Assistance Low
Concentration Level Low
Regulation Level Light
Technology Change Low
Barriers to Entry Medium
Industry Globalization Low
Competition Level High
Revenue
$3.3bnProfit
$62.2mWages
$1.0bnBusinesses
3,480
Annual Growth 14-19
-0.3%Annual Growth 09-14
-0.9%
Key External DriversExternal competition for the Bowling Alleys industryPer capita disposable incomeTime spent on leisure and sportsUrban population
Market ShareBowlmor AMF 18.3%
p. 24
p. 5
FOR ADDITIONAL STATISTICS AND TIME SERIES SEE THE APPENDIX ON PAGE 31
SOURCE: WWW.IBISWORLD.COM

WWW.IBISWORLD.COM Bowling Centers in the US October 2014 5
Key External Drivers External competition for the Bowling Alleys industryBowling centers have experienced lower demand levels due to the mounting array of alternative entertainment options, particularly in-home options such as video game consoles and mobile devices. As these sources of entertainment become more prevalent, fewer consumers are likely to forgo the convenience of
staying at home to travel to bowling centers. External competition for the Bowling Alleys industry is expected to increase in 2014, posing a potential threat to the industry.
Per capita disposable incomeIncreased household disposable income leads to greater expenditure on leisure activities, including trips to bowling
Executive Summary
The Bowling Centers industry is switching lanes. While the industry has been declining for years, shifting downstream markets and slowly evolving service offerings indicate that opportunities exist for firms willing to shake up the traditional business model. Even so, the recession crippled demand levels for recreation firms, including bowling centers. Reduced disposable incomes led to reductions in discretionary spending; importantly, in-home entertainment was typically chosen over trips to venues such as bowling centers. Over the five years to
2014, revenue for the industry is anticipated to fall at an annualized rate of 0.9% to reach $3.3 billion; this decline includes an expected 0.9% revenue drop in 2014 alone.
League bowlers, who once represented the major market for industry operators, now account for only an estimated 42.0% of traditional bowling revenue, with shoe rental and open-play bowlers representing the remaining 58.0%. In order to attract this growing market of casual bowlers, bowling centers have increasingly become multi-use facilities that include a variety of other recreation
activities, from laser tag to high-end restaurants. The industry is transitioning toward firms that either cater to families with children or to young adults interested in upscale restaurants and a bar atmosphere.
However, in both cases, bowling centers are becoming larger. Merger and acquisition activity and loftier establishments have each contributed to the industry’s rising market share concentration; however, failing enterprises that are located in areas lacking suitable client bases are largely to blame. The great majority of an average bowling center’s revenue is derived from consumers living within 13 miles of its establishment. Therefore, new entrants are predominately choosing to locate in urban areas with sizeable potential client bases.
Industry revenue is anticipated to continue its slide over the next five years, declining at an annualized rate of 0.3% to $3.2 billion in 2019. Firms that strive to diversify their service offerings will temper the industry’s decline. Economic recovery, which will bring higher disposable incomes and lower unemployment rates, is also expected to help the industry. Yet, competing sources of entertainment will continue to siphon away entertainment budgets. Firms that emphasize the social aspects of bowling centers are expected to have the most success combating the draw of digital and in-home entertainment.
Industry PerformanceExecutive Summary | Key External Drivers | Current Performance Industry Outlook | Life Cycle Stage
Revenue declines will slow as firms evolve their offerings to attract a wider range of customers
WWW.IBISWORLD.COM Bowling Centers in the US October 2014 6
Industry Performance
Key External Driverscontinued
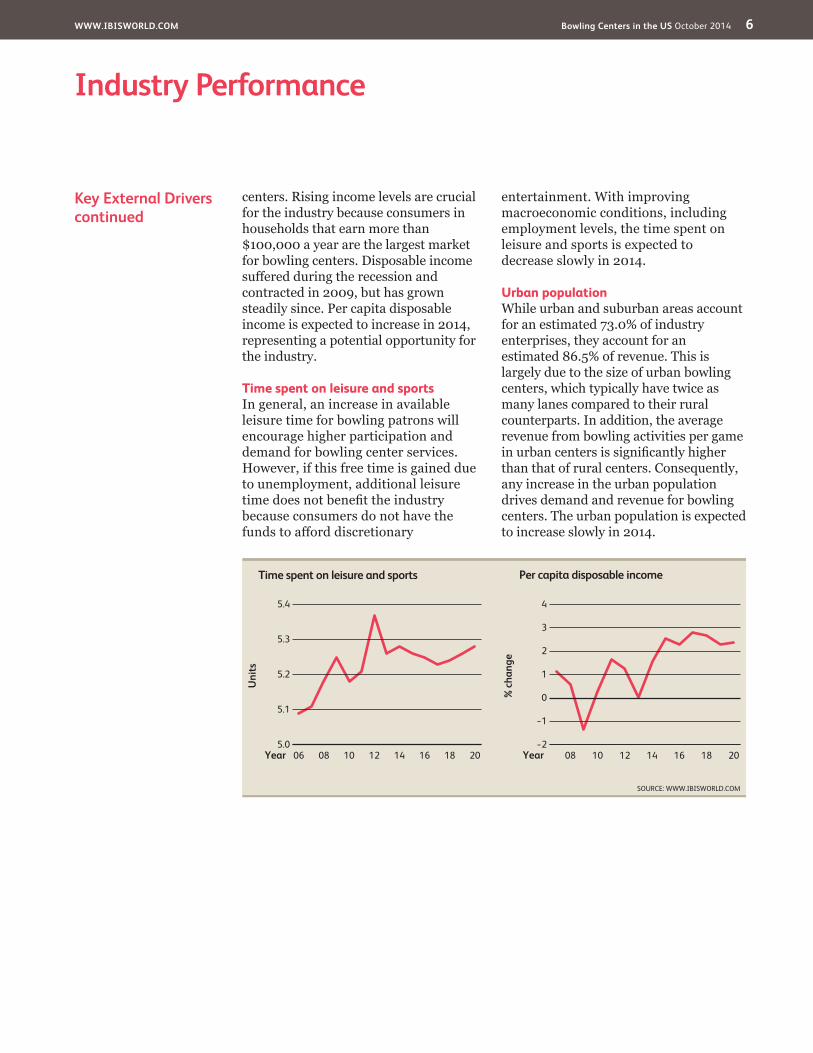
centers. Rising income levels are crucial for the industry because consumers in households that earn more than $100,000 a year are the largest market for bowling centers. Disposable income suffered during the recession and contracted in 2009, but has grown steadily since. Per capita disposable income is expected to increase in 2014, representing a potential opportunity for the industry.
Time spent on leisure and sportsIn general, an increase in available leisure time for bowling patrons will encourage higher participation and demand for bowling center services. However, if this free time is gained due to unemployment, additional leisure time does not benefit the industry because consumers do not have the funds to afford discretionary
entertainment. With improving macroeconomic conditions, including employment levels, the time spent on leisure and sports is expected to decrease slowly in 2014.
Urban populationWhile urban and suburban areas account for an estimated 73.0% of industry enterprises, they account for an estimated 86.5% of revenue. This is largely due to the size of urban bowling centers, which typically have twice as many lanes compared to their rural counterparts. In addition, the average revenue from bowling activities per game in urban centers is significantly higher than that of rural centers. Consequently, any increase in the urban population drives demand and revenue for bowling centers. The urban population is expected to increase slowly in 2014.
% c
hang
e
4
−2
−1
0
1
2
3
2008 10 12 14 16 18Year
Per capita disposable income
SOURCE: WWW.IBISWORLD.COM
Uni
ts
5.4
5.0
5.1
5.2
5.3
2006 08 10 12 14 16 18Year
Time spent on leisure and sports

WWW.IBISWORLD.COM Bowling Centers in the US October 2014 7
Industry Performance
An industry in the gutter
During the recession, a rash of poor economic factors caused industry revenue to plummet. Sharp increases in unemployment caused per capita disposable income to drop 1.3% in 2009, crippling spending on discretionary entertainment including trips to local bowling centers. While the declining number of league bowlers had been causing the industry to contract slowly prior to the recession, the economic downturn’s impact on consumers’ budgets led to three consecutive years of falling revenue and severe declines in industry enterprise and establishment figures.
Additionally, while increases in the time spent on leisure and sports typically represent a boon for industry operators, if this new leisure time is caused by job loss, industry revenue does not benefit.
The recession also exacerbated a longer-term consumer preference change toward in-home rather than out-of-home entertainment. While lower incomes reduced consumers’ ability to purchase electronics or video games, when forced to choose between in-home or mobile options such as high-speed internet and out-of-home recreation like trips to bowling centers or movie
Current Performance
Sparked by declining demand levels, shifts in downstream clientele and mounting external competition, the Bowling Centers industry has entered a period of fundamental transition. Traditionally, bowling center patrons were predominantly league players; as a result, bowling alleys were (and largely remain) small and locally focused, with loyal customer bases composed of frequent bowlers. However, as competing sources of in-home entertainment like high-definition TV, video game consoles and the internet have caused consumer tastes to shift away from location-based entertainment (LBE), demand for the Bowling Centers industry has structurally declined.
Furthermore, sharp deterioration in league participation rates and the rise of the casual bowler have deeply altered the industry’s market. Consequently, the Bowling Centers industry has begun to diverge into two types of establishments: those that still cater to league players and offer a no-frills, bowling-centric experience, and those that view bowling as one part of an LBE spectrum that also includes restaurants and bars, laser tag, indoor playgrounds
and other venues under one roof. While these newer models have found success over the five-year period, their growth has not fully healed the industry’s wounds because traditional bowling centers without a range of ancillary services remain more common. Revenue for the industry is therefore expected to decline at an annualized rate of 0.9% to $3.3 billion over the five years to 2014. Moreover, increasingly potent external competition is anticipated to cause revenue to decline 0.9% in 2014 alone.
% c
hang
e
10
−10
−5
0
5
2006 08 10 12 14 16 18Year
Industry revenue
SOURCE: WWW.IBISWORLD.COM
WWW.IBISWORLD.COM Bowling Centers in the US October 2014 8
Industry Performance
An industry in the guttercontinued
theaters, more individuals chose the former. While revenue for the Video Games industry (IBISWorld report NN003) also contracted during the
recession, these declines were largely due to a shift toward free mobile or used console games, rather than any kind of gain for bowling centers.
Bigger is better The largest firm, Bowlmor AMF (a result of a recent merger between AMF Bowling Worldwide Inc. and Strike Holdings LLC, and the acquisition of Brunswick Corporation’s bowling centers business), has a national reach and brand recognition, and has expanded its model to include bowling complexes with multiple offerings. In 2008, the first Brunswick Zone XL opened and featured 36 bowling lanes, laser tag, billiards, an
arcade room, a restaurant and a sports bar. However, these large facilities skew the share of industry revenue accounted for by each product and service offering. Consequently, according to the BPAA, while 63.0% of bowling centers derive the majority of their revenue from traditional bowling activities, bowling and shoe rental are only anticipated to account for 37.8% of total industry revenue in 2014. The sale of alcoholic beverages, food and
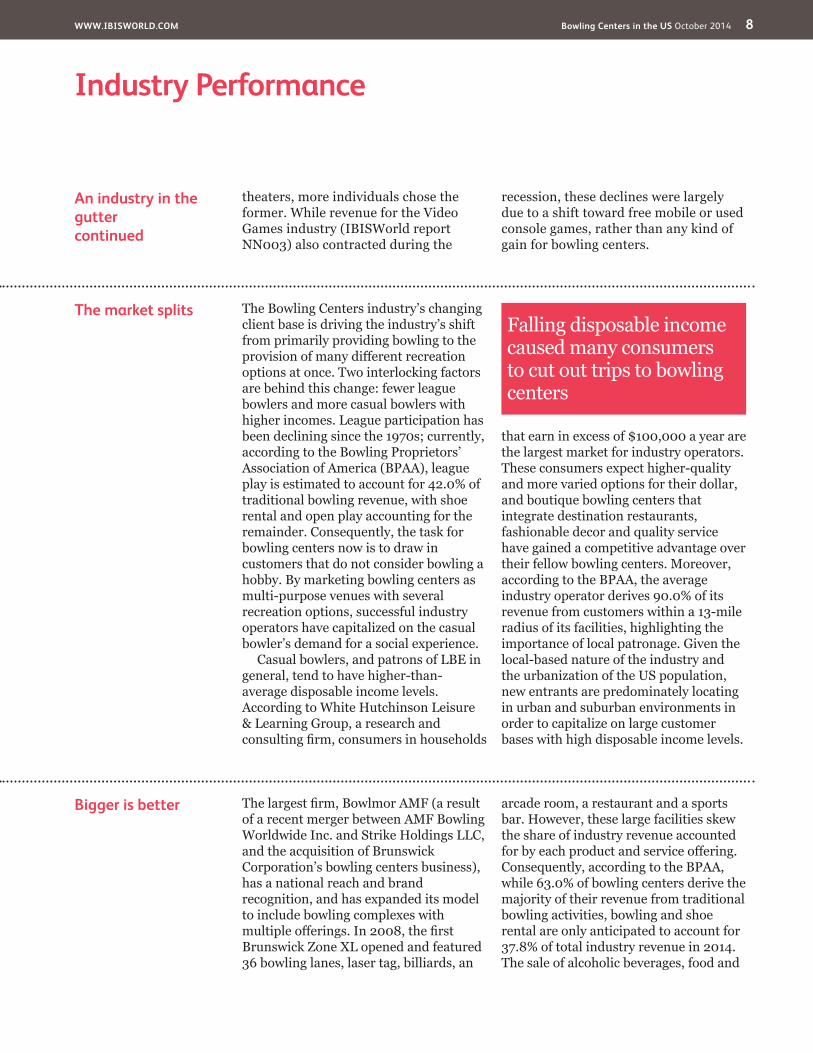
The market splits The Bowling Centers industry’s changing client base is driving the industry’s shift from primarily providing bowling to the provision of many different recreation options at once. Two interlocking factors are behind this change: fewer league bowlers and more casual bowlers with higher incomes. League participation has been declining since the 1970s; currently, according to the Bowling Proprietors’ Association of America (BPAA), league play is estimated to account for 42.0% of traditional bowling revenue, with shoe rental and open play accounting for the remainder. Consequently, the task for bowling centers now is to draw in customers that do not consider bowling a hobby. By marketing bowling centers as multi-purpose venues with several recreation options, successful industry operators have capitalized on the casual bowler’s demand for a social experience.
Casual bowlers, and patrons of LBE in general, tend to have higher-than-average disposable income levels. According to White Hutchinson Leisure & Learning Group, a research and consulting firm, consumers in households
that earn in excess of $100,000 a year are the largest market for industry operators. These consumers expect higher-quality and more varied options for their dollar, and boutique bowling centers that integrate destination restaurants, fashionable decor and quality service have gained a competitive advantage over their fellow bowling centers. Moreover, according to the BPAA, the average industry operator derives 90.0% of its revenue from customers within a 13-mile radius of its facilities, highlighting the importance of local patronage. Given the local-based nature of the industry and the urbanization of the US population, new entrants are predominately locating in urban and suburban environments in order to capitalize on large customer bases with high disposable income levels.
Falling disposable income caused many consumers to cut out trips to bowling centers
WWW.IBISWORLD.COM Bowling Centers in the US October 2014 9
Industry Performance
Bigger is bettercontinued
nonalcoholic beverages and ancillary offerings, such as laser tag, miniature golf, bumper cars, arcade games and a range of others, now combine to account for the majority of industry revenue.
In addition to a transition in the industry’s customer base, falling enterprise numbers also reflect the industry’s thin margins; in 2014, the industry’s average profit margin is expected to reach only 1.9% of revenue, slightly better than the 1.5% average
margin in 2009. Most operators run only one establishment, and in the face of falling demand and revenue during the recession, many firms were forced to close down. Consequently, the number of industry enterprises is expected to decline at an annualized rate of 1.3% over the five-year period to reach 3,480 companies in 2014. Similarly, industry employment is anticipated to fall at an annualized rate of 1.6% over the same period, reaching 72,158 individuals in 2014.
Industry Outlook
The pains accompanying transition are forecast to continue for the Bowling Centers industry over the five years to 2019. In terms of both revenue and enterprises, the industry is anticipated to continue shrinking; however, these contractions are forecast to slow. Fewer new hybrid centers will be opened than traditional centers will close, and the industry will eventually settle to support a
much smaller number of family-centric bowling complexes and upscale, adult-focused boutiques. The trends presented over the past five years, including falling league participation rates, are largely expected to continue, further cementing casual, higher-income bowlers as the market to attract. Industry revenue is forecast to fall at an annualized rate of 0.3% to $3.2 billion over the five years to 2019.
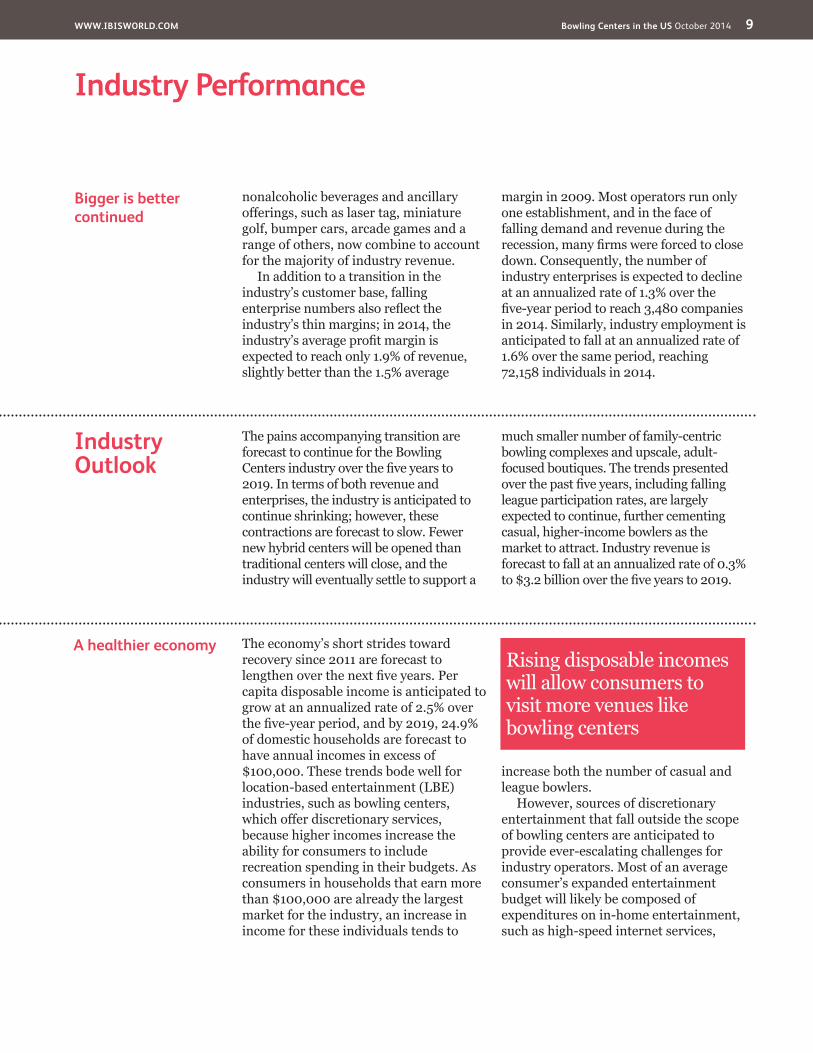
A healthier economy The economy’s short strides toward recovery since 2011 are forecast to lengthen over the next five years. Per capita disposable income is anticipated to grow at an annualized rate of 2.5% over the five-year period, and by 2019, 24.9% of domestic households are forecast to have annual incomes in excess of $100,000. These trends bode well for location-based entertainment (LBE) industries, such as bowling centers, which offer discretionary services, because higher incomes increase the ability for consumers to include recreation spending in their budgets. As consumers in households that earn more than $100,000 are already the largest market for the industry, an increase in income for these individuals tends to
increase both the number of casual and league bowlers.
However, sources of discretionary entertainment that fall outside the scope of bowling centers are anticipated to provide ever-escalating challenges for industry operators. Most of an average consumer’s expanded entertainment budget will likely be composed of expenditures on in-home entertainment, such as high-speed internet services,
Rising disposable incomes will allow consumers to visit more venues like bowling centers

WWW.IBISWORLD.COM Bowling Centers in the US October 2014 10
Industry Performance
A healthier economycontinued
video on demand and video game consoles. The next generation of consoles is expected to better incorporate gesture controls, allowing games to more closely mimic the motions of sports, including bowling. Nevertheless, wealthier
consumers tend to spend more on out-of-home entertainment than in-home entertainment, according to White Hutchinson Leisure and Learning Group, and this trend is fortunately anticipated to continue over the five years to 2019.
The future of bowling Bowling centers are anticipated to continue to shift toward multi-use facilities that incorporate a range of activities with a social focus. Technological change with respect to the game of bowling is anticipated to remain low over the five years to 2019, with the largest changes coming from alternative service offerings. League bowling is expected to continue falling slowly, and the most successful firms will be those willing to invest in an upscale image in order to draw casual, high-income guests. As a result, the majority of new entrants are anticipated to deliver a range of ancillary services in urban environments in order to maximize their potential customer bases. Bowling as an individual activity will increasingly be replicated on home game consoles, but the social experience afforded by well-designed, high-quality centers will remain the industry’s best defense against competition from digital entertainment. Dining and a night-club-like atmosphere, in particular, will become even more essential to the industry’s success. Consumers looking for a night out that includes more than just dinner will likely see bowling centers with a destination restaurant as an attractive option.
As the industry continues to divide into bowling lounges and bar-restaurants geared toward young adults
and family centers targeting consumers with children, smaller centers not in proximity to these markets are forecast to close. As a result, the number of industry establishments is forecast to decline at an annualized rate of 1.2% over the five-year period to reach 3,832 in 2019, as single-location operators fold and major companies let go of unprofitable establishments that lack a casual bowler market. Employment, however, is anticipated to decline at a lower annualized rate of 0.7% over the same period, reaching 69,692 individuals in 2019, as the increasing average size of bowling centers causes the number of employees per establishment to rise over the period. Moreover, these larger firms, which sell high-margin items such as alcoholic beverages, are the primary reason for the forecast stability in the industry’s profitability. As a result, the average profit margin for the industry is anticipated to remain at 1.9% of revenue in 2019.
Large, more profitable multi-use bowling centers will thrive while small traditional centers close
WWW.IBISWORLD.COM Bowling Centers in the US October 2014 11
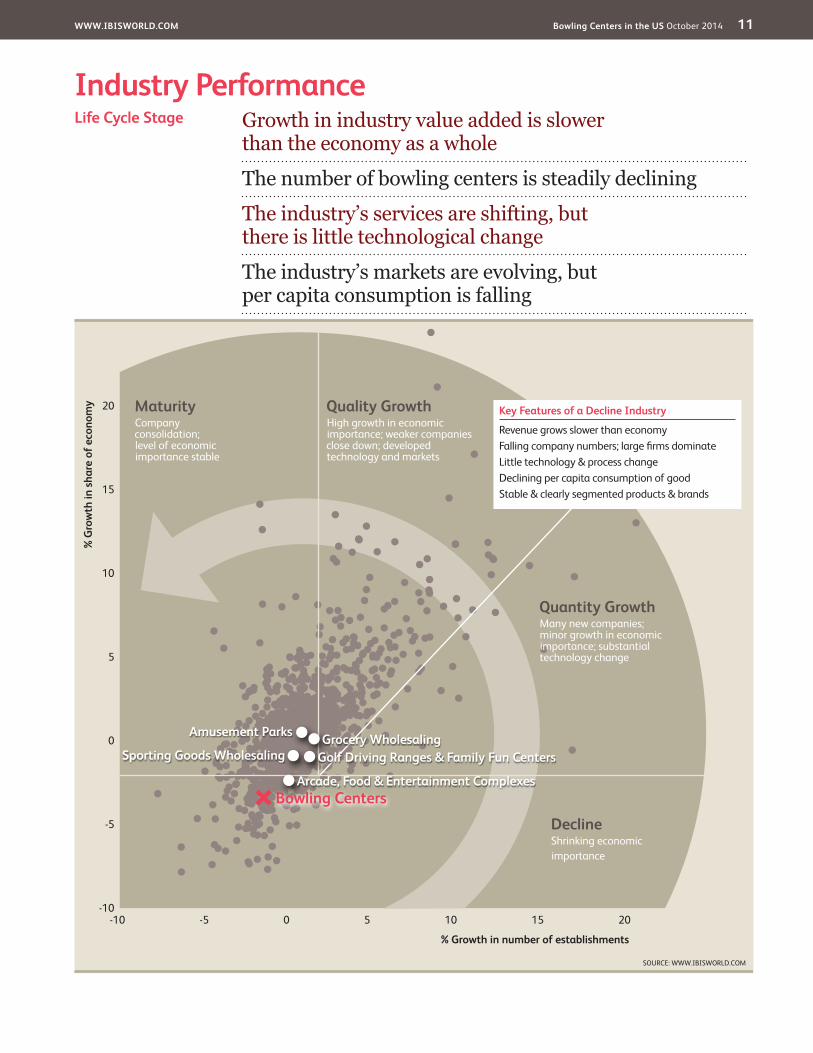
Industry PerformanceGrowth in industry value added is slower than the economy as a wholeThe number of bowling centers is steadily decliningThe industry’s services are shifting, but there is little technological changeThe industry’s markets are evolving, but per capita consumption is falling
Life Cycle Stage
SOURCE: WWW.IBISWORLD.COM
20
15
10
5
0
-5
-10
% G
row
th in
sha
re o
f eco
nom
y
% Growth in number of establishments
-10 -5 0 5 10 15 20
DeclineShrinking economicimportance
Quality GrowthHigh growth in economic importance; weaker companies close down; developed technology and markets
MaturityCompany consolidation;level of economic importance stable
Quantity GrowthMany new companies; minor growth in economic importance; substantial technology change
Key Features of a Decline Industry
Revenue grows slower than economyFalling company numbers; large fi rms dominateLittle technology & process changeDeclining per capita consumption of goodStable & clearly segmented products & brands
Amusement Parks
Sporting Goods Wholesaling
Arcade, Food & Entertainment Complexes
Grocery WholesalingGolf Driving Ranges & Family Fun Centers
Bowling Centers
WWW.IBISWORLD.COM Bowling Centers in the US October 2014 12
Industry Performance
Industry Life Cycle The Bowling Centers industry is in the decline stage of its economic life cycle; this stage is characterized by a slow decline in the number of enterprises and little technological change. Industry value added (IVA), which measures an industry’s contribution to the overall economy, is expected to decrease at an annualized rate of 1.0% during the 10 years to 2019. In contrast, US GDP is projected to grow at an annualized rate of 2.5% during the same period. These figures signify that the industry’s share of the US economy is slowly declining.
While the industry’s target market has been shifting away from serious bowlers and toward casual, higher-income consumers for decades, the industry has been relatively slow to alter its focus. Bereft of high league participation, once the industry’s greatest source of revenue, many single-location firms have closed down. The number of industry enterprises is forecast to fall at an annualized rate of 1.3% during the 10 years to 2019. While
the creation of hybrid bowling centers and merger and acquisition activity are causing the industry’s market share concentration to increase, the contracting number of companies is more the result of failing operators.
Moreover, despite the changing structure of the typical bowling center, there has been almost no industry-specific technological change in recent decades. Mechanical pinsetters and electronic scoring systems were first introduced in the 1930s and 1970s, respectively. According to the Bowling Proprietors’ Association of America, 99.0% of bowling centers have lane bumpers, while 95.0% have automatic scoring systems. While more companies in the industry have added modern amenities and technology like full bars and wireless internet access, the nature of bowling has remained largely unchanged for quite some time. This lack of technological change is strongly indicative of a declining industry.
This industry is Declining

WWW.IBISWORLD.COM Bowling Centers in the US October 2014 13
Products & Services
According to the Bowling Proprietors’ Association of America (BPAA), 63.0% of bowling centers derive the majority of their revenue from bowling activities. Alternatively, 28.0% derive the majority of their revenue from non-bowling related activities, while the remaining 9.0% derive an equal amount of revenue from bowling and non-bowling activities. However, larger industry operators that provide a range of entertainment options skew the share of industry revenue accounted for by each product and
service offering. Consequently, on average, traditional bowling activities are anticipated to account for only 37.8% of total industry revenue in 2014.
Bowling activitiesMore specifically, open play bowling and league play bowling are anticipated to account for 17.8% and 15.8% of total industry revenue respectively, while shoe rental is expected to account for the remaining 4.2%. Traditional bowling activities generally comprise the purchase
Products & MarketsSupply Chain | Products & Services | Demand Determinants Major Markets | International Trade | Business Locations
KEY BUYING INDUSTRIES
9901 Consumers in the US Given the service-based nature of the industry, consumers are the ultimate market for bowling centers.
KEY SELLING INDUSTRIES
42391 Sporting Goods Wholesaling in the US Wholesalers from this industry supply equipment, including pins and shoes, to bowling alley operators.
42441 Grocery Wholesaling in the US This industry supplies food and beverages for resale to customers.
42445 Confectionery Wholesaling in the US This industry supplies snacks to bowling centers with food and drink facilities.
45421 Vending Machine Operators in the US This industry supplies drinks and snacks via vending machines in bowling centers.
Supply Chain
Products and services segmentation (2014)
Total $3.3bn
17.8%Bowling – open play
11.1%Snack bar
15.8%Bowling – league play
7.0%Laser tag
4.2%Shoe rental
15.1%Other14.8%
Bar/lounge
14.2%Restaurant
SOURCE: WWW.IBISWORLD.COM
WWW.IBISWORLD.COM Bowling Centers in the US October 2014 14
Products & Markets
DemandDeterminants
Demand for the Bowling Centers industry is impacted by household disposable income, consumers’ leisure time, population trends and competition from other sources of entertainment.
The Bowling Centers industry provides discretionary entertainment services; consequently, revenue depends heavily on the room consumers can save in their budgets for non-essential spending. Other
macroeconomic indicators, particularly the unemployment rate and tax rates, impact per capita disposable income. However, the amount of time individuals have to spend on leisure activities is positively impacted by unemployment. During the recession, with more consumers out of work, individuals had more free time to spend on leisure and sports. However, increased leisure time does not
Products & Servicescontinued
of games or rounds of bowling and include the use of a center’s bowling balls, lanes, scoring system and shoes. While customers use bowling centers primarily for their traditional offerings, the trend toward integration with other entertainment options, including restaurants and laser tag facilities, has caused this product segment to shrink as a share of revenue over the five-year period. As the number of serious bowlers (i.e. bowlers who compete in leagues) has fallen, the industry has shifted its focus toward catering to casual bowlers; these bowlers are more likely to take advantage of services or activities that historically played a smaller role for bowling centers.
Alcoholic beverage salesRevenue from bars and lounges, which includes the sale of alcoholic beverages, accounts for the second-largest product group for the industry. In 2014, these sources are anticipated to account for 14.8% of total industry revenue. Bowlmor Lanes, which is now part of Bowlmor AMF, cultivates a nightclub or bar-like atmosphere in its bowling centers in an attempt to draw in a younger, more affluent customer base; the success of this model over the five-year period has encouraged other firms to open or expand drink menus. Consequently, revenue from bars and lounges has increased over the five-year period and is
anticipated to rise further over the five years to 2019.
Food and non-alcoholic beverage salesAs the Bowling Centers industry has evolved into a mixed-use entertainment industry, meal service has become an increasingly essential source of revenue for industry operators. In 2014, revenue from restaurants is anticipated to account for 14.2% of total industry revenue, while snack bar sales are expected to account for 11.1% of total industry revenue. With a shrinking number of league bowlers and a rising number of open-play bowlers visiting centers, savvy operators have integrated and advertised full-service restaurants to attract consumers with high disposable income levels and more varied entertainment needs.
Laser tag and other revenue sourcesAncillary gaming services are anticipated to account for a large portion of industry revenue in 2014. Laser tag, miniature golf and bumper cars are expected to account for 7.0%, 3.1% and 2.2% of total industry revenue, respectively. Similarly, arcade games and billiard tables are expected to account for 1.9% and 0.8% of industry revenue, respectively. Moreover, revenue from pro shops is anticipated to account for 1.4% of total sales, and other gaming offerings largely account for the remaining revenue for bowling centers.
WWW.IBISWORLD.COM Bowling Centers in the US October 2014 15
Products & Markets
Major Markets
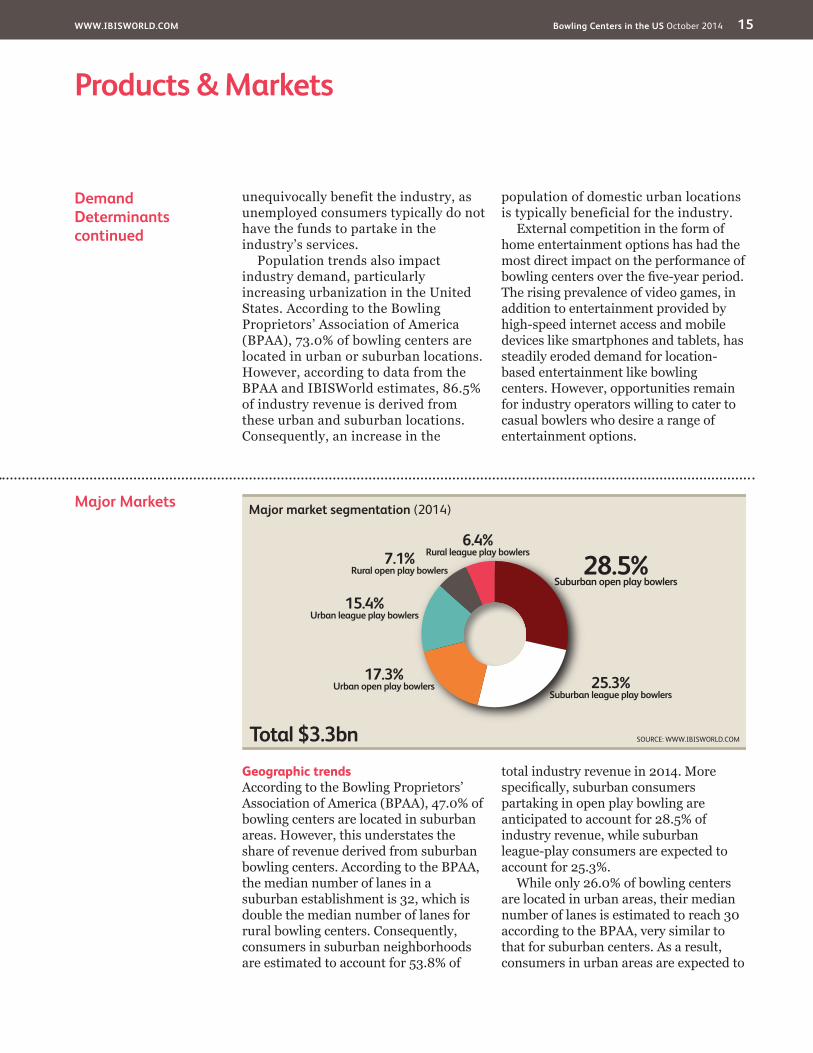
Geographic trendsAccording to the Bowling Proprietors’ Association of America (BPAA), 47.0% of bowling centers are located in suburban areas. However, this understates the share of revenue derived from suburban bowling centers. According to the BPAA, the median number of lanes in a suburban establishment is 32, which is double the median number of lanes for rural bowling centers. Consequently, consumers in suburban neighborhoods are estimated to account for 53.8% of
total industry revenue in 2014. More specifically, suburban consumers partaking in open play bowling are anticipated to account for 28.5% of industry revenue, while suburban league-play consumers are expected to account for 25.3%.
While only 26.0% of bowling centers are located in urban areas, their median number of lanes is estimated to reach 30 according to the BPAA, very similar to that for suburban centers. As a result, consumers in urban areas are expected to
DemandDeterminantscontinued
unequivocally benefit the industry, as unemployed consumers typically do not have the funds to partake in the industry’s services.
Population trends also impact industry demand, particularly increasing urbanization in the United States. According to the Bowling Proprietors’ Association of America (BPAA), 73.0% of bowling centers are located in urban or suburban locations. However, according to data from the BPAA and IBISWorld estimates, 86.5% of industry revenue is derived from these urban and suburban locations. Consequently, an increase in the
population of domestic urban locations is typically beneficial for the industry.
External competition in the form of home entertainment options has had the most direct impact on the performance of bowling centers over the five-year period. The rising prevalence of video games, in addition to entertainment provided by high-speed internet access and mobile devices like smartphones and tablets, has steadily eroded demand for location-based entertainment like bowling centers. However, opportunities remain for industry operators willing to cater to casual bowlers who desire a range of entertainment options.
Major market segmentation (2014)
Total $3.3bn
28.5%Suburban open play bowlers
6.4%Rural league play bowlers
25.3%Suburban league play bowlers
17.3%Urban open play bowlers
15.4%Urban league play bowlers
7.1%Rural open play bowlers
SOURCE: WWW.IBISWORLD.COM

WWW.IBISWORLD.COM Bowling Centers in the US October 2014 16
Products & Markets
International Trade The Bowling Centers industry is service-based; therefore, exports and imports are not applicable for the industry. While bowling equipment is traded
internationally, these transactions are largely included in the Athletic and Sporting Goods Manufacturing industry (IBISWorld report 33992a).
Major Marketscontinued
account for 32.7% of total industry revenue in 2014. More specifically, urban open-play bowlers and league-play bowlers are anticipated to account for 17.3% and 15.4% of total industry revenue, respectively.
Alternatively, while rural areas account for 27.0% of bowling centers, the median number of lanes for an establishment in a rural neighborhood is only 16 according to the BPAA. Consequently, rural consumers are only anticipated to account for 13.5% of total industry revenue in 2014, with open play and league play rural bowlers accounting for 7.1% and 6.4% of industry revenue, respectively. With the increasing urbanization of the domestic population, the share of revenue from urban consumers has increased the fastest over the five-year period. Alternatively, suburban consumers as a share of
revenue have increased more slowly and rural consumers as a share of revenue have decreased from 2009 to 2014.
Household income and age trendsAccording to White Hutchinson Leisure & Learning Group (WHLLC), a research and consulting firm, the demand for bowling services is positively correlated with household income. Consumers in households that earn more than $100,000 a year are the largest market for bowling centers, followed by households that earn between $50,000 and $74,999 annually and then households that earn between $75,000 and $99,999 annually. In addition, data from WHLLC indicates that the largest market for consumers are individuals aged 25 to 34, with individuals above the age of 55 accounting for a relatively small share of all bowlers.

WWW.IBISWORLD.COM Bowling Centers in the US October 2014 17
Products & Markets
Business Locations 2014
MO3.1
West
West
West
Rocky Mountains Plains
Southwest
Southeast
New England
VT0.3
MA2.2
RI0.3
NJ1.9
DE0.3
NH0.4
CT0.9
MD1.4
DC0.1
1
5
3
7
2
6
4
8 9
Additional States (as marked on map)
AZ1.2
CA5.1
NV0.3
OR1.6
WA1.9
MT1.0
NE1.7
MN3.8
IA3.1
OH6.4 VA
1.7
FL3.2
KS1.8
CO1.8
UT0.8
ID0.9
TX3.9
OK1.1
NC1.8
AK0.2
WY0.5
TN1.3
KY1.1
GA1.5
IL5.7
ME0.7
ND0.6
WI6.2 MI
6.3 PA5.2
WV0.9
SD1.0
NM0.4
AR0.9
MS0.7
AL0.9
SC0.8
LA0.7
HI0.2
IN3.4
NY6.8 5
67
8
321
4
9
SOURCE: WWW.IBISWORLD.COM
Mid- Atlantic
Establishments (%)
Less than 3% 3% to less than 10% 10% to less than 20% 20% or more
Great Lakes
WWW.IBISWORLD.COM Bowling Centers in the US October 2014 18
Products & Markets
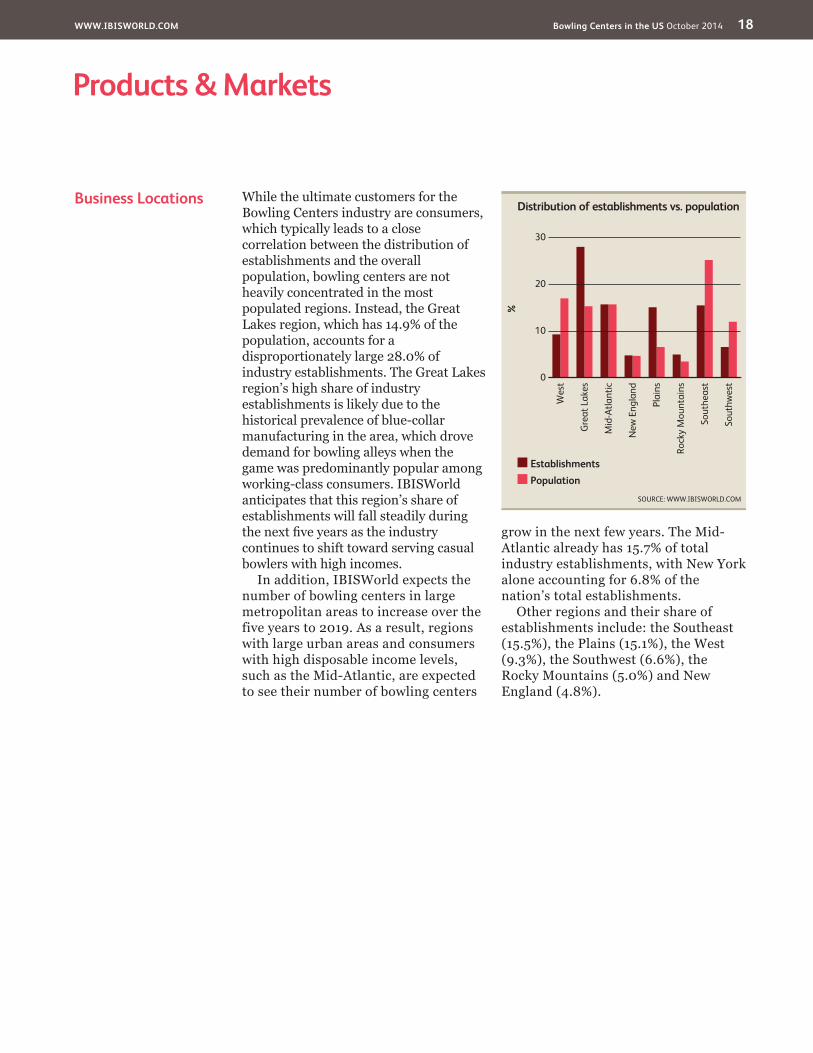
Business Locations While the ultimate customers for the Bowling Centers industry are consumers, which typically leads to a close correlation between the distribution of establishments and the overall population, bowling centers are not heavily concentrated in the most populated regions. Instead, the Great Lakes region, which has 14.9% of the population, accounts for a disproportionately large 28.0% of industry establishments. The Great Lakes region’s high share of industry establishments is likely due to the historical prevalence of blue-collar manufacturing in the area, which drove demand for bowling alleys when the game was predominantly popular among working-class consumers. IBISWorld anticipates that this region’s share of establishments will fall steadily during the next five years as the industry continues to shift toward serving casual bowlers with high incomes.
In addition, IBISWorld expects the number of bowling centers in large metropolitan areas to increase over the five years to 2019. As a result, regions with large urban areas and consumers with high disposable income levels, such as the Mid-Atlantic, are expected to see their number of bowling centers
grow in the next few years. The Mid-Atlantic already has 15.7% of total industry establishments, with New York alone accounting for 6.8% of the nation’s total establishments.
Other regions and their share of establishments include: the Southeast (15.5%), the Plains (15.1%), the West (9.3%), the Southwest (6.6%), the Rocky Mountains (5.0%) and New England (4.8%).
%
30
0
10
20
Sout
hwes
t
Wes
t
Gre
at L
akes
Mid
-Atla
ntic
New
Eng
land
Plai
ns
Rock
y M
ount
ains
Sout
heas
t
EstablishmentsPopulation
Distribution of establishments vs. population
SOURCE: WWW.IBISWORLD.COM

WWW.IBISWORLD.COM Bowling Centers in the US October 2014 19
Key Success Factors Ability to attract local support/patronageFor bowling centers with very high league participation, attracting the support of local teams is essential.
Carrying out all necessary maintenance to keep facilities in good conditionMaintaining clean facilities and making routine equipment upgrades are necessary to generate repeat customers.
Access to a multiskilled and flexible workforceGiven the weekly and seasonal nature
of demand, access to a flexible, casual workforce helps operators contain wage costs.
Proximity to key marketsFirms must be located near residential areas to compete with the convenience advantage held by home entertainment options.
Understanding the industry’s marketThe market for bowling centers has shifted toward casual, higher-income consumers. Catering to this market, rather than traditional league players, taps into the industry’s current source of demand.
Market Share Concentration
Market share concentration within the Bowling Centers industry is low, with the top two enterprises accounting for an estimated 21.4% of total industry revenue in 2014. However, the level of concentration within the industry has increased in recent years. The merger between AMF Bowling Worldwide and Strike Holdings LLC, and subsequent acquisition of Brunswick’s bowling centers, has served to boost the industry’s market share concentration over the period. In addition, the industry is shifting toward larger bowling centers that offer a wider range of services and activities for casual bowlers. Consequently, the creation of these loftier spaces serves to increase industry market share concentration as well. Yet, the exit of unprofitable firms largely explains the industry’s trend toward concentration.
Large firms employing 100 or more individuals are still rare in the industry
and this trend is anticipated to continue over the next five years; in 2014, just 1.7% of industry enterprises are estimated to require 100 or more employees. The size of a bowling center is largely dependent upon the kinds of activities it provides and its location. For example, according to the Bowling Proprietors’ Association of America, the median number of lanes for both urban and suburban centers exceeds 30, almost double the median number for rural centers.
Competitive LandscapeMarket Share Concentration | Key Success Factors | Cost Structure Benchmarks Basis of Competition | Barriers to Entry | Industry Globalization
Companies by employment sizeNo. of employees Share (%)
0 to 4 26.45 to 9 18.810 to 19 26.020 to 99 27.1100 to 499 1.4500+ 0.3
SOURCE: US CENSUS BUREAU COUNTY BUSINESS PATTERNS
Level Concentration in this industry is Low
IBISWorld identifies 250 Key Success Factors for a business. The most important for this industry are:

WWW.IBISWORLD.COM Bowling Centers in the US October 2014 20
Competitive Landscape
Cost Structure Benchmarks
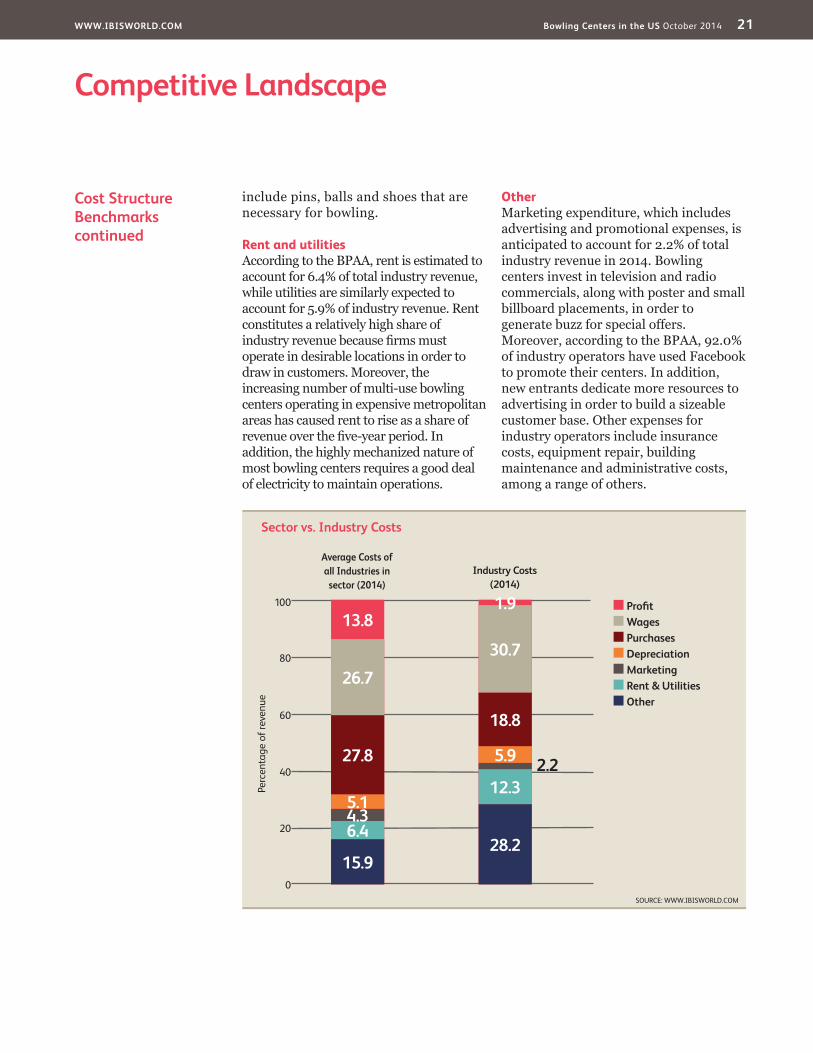
ProfitIndustry profit, defined as earnings before interest and taxes, is expected to increase slightly during the five years to 2014, rising from 1.5% of revenue in 2009 to an estimated 1.9% in 2014. Profitability varies widely in the Bowling Centers industry and is largely dependent upon enterprise size. The bowling process is largely automated or handled by the customer, which tempers labor costs to a certain degree. However, intense price competition with respect to cheaper and more convenient substitute entertainment options, such as home video game consoles, coupled with declining overall demand for bowling has kept margins very thin for the average firm.
Yet, larger firms with a wider reach and name recognition have been better able to withstand falling demand; for example, despite declining revenue over the five-year period, previous major player Brunswick’s profit margins increased to an estimated 7.9% of revenue in 2014, up sharply from 0.9% in 2009. During the recession, crippling drops in revenue led many firms to close down. The industry’s average margin turned negative in 2010 as many small operators were unable to alter prices or reduce costs at a rapid enough pace. Rebounding revenue and cost-cutting measures in 2011 returned the industry to profitability; however, margins are not expected to return to their pre-recession peak of 3.4% over the five years to 2019 due to mounting external competition.
Wages and depreciationIn 2014, wages are anticipated to account for 30.7% of industry revenue, declining from 31.6% of revenue in 2009. Employees generally work on a part-time basis and serve a myriad of functions from cleaning and maintenance to working cash registers and organizing
events and parties. An estimated 71.2% of industry enterprises employ less than 20 individuals. According to the latest available information from the Bowling Proprietors’ Association of America (BPAA), in 2012, the median staff size for urban and suburban establishments reached 10 and 12 employees, respectively, with larger establishments skewing the average number of employees upward slightly.
Given these relatively small employment figures, the Bowling Centers industry is fairly capital intensive. A game of bowling is largely performed without any assistance from employees, which tempers the industry’s reliance on labor. Consequently, depreciation represents a large expense for bowling centers; in 2014, depreciation is anticipated to reach 5.9% of industry revenue, representing a decline from 7.0% in 2009. Equipment for the industry includes lane bumpers and automatic scoring systems, among a range of other automated machinery. As industry operators continue to grow in size and invest in machinery to run operations, wages as a share of revenue is anticipated to decline over the five years to 2019, while depreciation is forecast to increase.
PurchasesPurchases represent the second largest expense for industry operators, accounting for an estimated 18.8% of industry revenue in 2014. According to the BPAA, cost of sales accounts for 16.2% of industry revenue, while supplies account for the remaining 2.6%. Cost of sales include expenditures on food, beverages, alcohol and merchandise that will eventually be sold to consumers. Supplies include all items that are required to operate a bowling center, including office supplies. As a result, supplies also
WWW.IBISWORLD.COM Bowling Centers in the US October 2014 21
Competitive Landscape
Cost Structure Benchmarkscontinued
include pins, balls and shoes that are necessary for bowling.
Rent and utilitiesAccording to the BPAA, rent is estimated to account for 6.4% of total industry revenue, while utilities are similarly expected to account for 5.9% of industry revenue. Rent constitutes a relatively high share of industry revenue because firms must operate in desirable locations in order to draw in customers. Moreover, the increasing number of multi-use bowling centers operating in expensive metropolitan areas has caused rent to rise as a share of revenue over the five-year period. In addition, the highly mechanized nature of most bowling centers requires a good deal of electricity to maintain operations.
OtherMarketing expenditure, which includes advertising and promotional expenses, is anticipated to account for 2.2% of total industry revenue in 2014. Bowling centers invest in television and radio commercials, along with poster and small billboard placements, in order to generate buzz for special offers. Moreover, according to the BPAA, 92.0% of industry operators have used Facebook to promote their centers. In addition, new entrants dedicate more resources to advertising in order to build a sizeable customer base. Other expenses for industry operators include insurance costs, equipment repair, building maintenance and administrative costs, among a range of others.
Sector vs. Industry Costs
■ Profi t■ Wages■ Purchases■ Depreciation■ Marketing■ Rent & Utilities■ Other
Average Costs of all Industries in sector (2014)
Industry Costs (2014)
0
20
40
60
Perc
enta
ge o
f rev
enue
80
100
13.8
15.9
6.44.35.1
27.8
26.7
1.9
28.2
12.32.25.9
18.8
30.7
SOURCE: WWW.IBISWORLD.COM

WWW.IBISWORLD.COM Bowling Centers in the US October 2014 22
Competitive Landscape
Barriers to Entry The largest barrier to entry for the Bowling Centers industry is the initial capital investment required to start operations. These expenses include the facility itself and equipment purchases,
including pinsetters, score monitors, consoles and bowling ball return systems, among a range of other expenses. 46.0% of respondents to a survey conducted by the Bowling
Basis of Competition Internal competitionCompetition within the Bowling Centers industry is primarily based on location and range of services, and, to a lesser extent, prices and facility quality. Bowling alleys must be conveniently located near a sizeable customer base with sufficient time and disposable income to pursue out-of-home entertainment. According to White Hutchinson Leisure & Learning Group, a research and consulting firm, while leisure time for households in the highest income bracket has been declining in recent years, their spending on away-from-home entertainment has increased. Consequently, competitive bowling alleys situated near consumers in the top income quintile have an advantage in attracting casual bowlers.
Location is especially important because the majority of an operator’s revenue comes from its local market. The Bowling Proprietors’ Association of America asked industry operators to determine their market area, or the radius that they draw 90.0% of their customers from. The average response was a radius of 13 miles, indicating that the ability to attract local patronage is crucial for bowling centers.
Similarly, offering a wider range of services than traditional 10-pin bowling gives operators a diversified revenue stream and can help to bring in casual bowlers with varied entertainment interests. As the popularity of bowling, measured in terms of per capita consumption, has fallen, forward-looking operators have recognized that the industry’s current market desires a
selection of activities, from restaurants to laser tag, beyond league or competitive bowling. As a result, firms that offer the widest array of activities continue to steal market share away from their traditional counterparts. Additionally, the quality and cleanliness of facilities is more important for firms seeking to attract casual bowlers that have a range of other recreational options. Alternatively, for firms catering to league play, low pricing and retaining a loyal base of dedicated bowlers are essential.
External competitionCompetition from other sources of recreation and entertainment has been increasingly detrimental to the industry’s revenue. The growing popularity of home and mobile games and content has cut into demand for a number of recreation-based industries, including the Bowling Centers industry. While there is no direct substitute for bowling in person, some console games replicate the sport. The Nintendo Wii, for example, uses motion sensors to let the consumer play a number of sports, including bowling, virtually. The trend toward widening bowling centers’ offerings beyond traditional bowling has somewhat mitigated the impact of external competition; however, many consumers continue to prefer in-home options to recreation that requires travel. As newer consoles with more realistic graphics are released, and additional mobile games and devices become cheaper, external competition for the industry is anticipated to increase.
Level & Trend Competition in this industry is High and the trend is Increasing

WWW.IBISWORLD.COM Bowling Centers in the US October 2014 23
Competitive Landscape
Industry Globalization
Given its service-based nature, the Bowling Centers industry is exclusively domestic in operation, and foreign companies own very few bowling centers in the United States. Most bowling centers are locally owned and service their immediate locale. Moreover, according to the Bowling Proprietors’ Association of America, as an operator’s center size increases, its
market area (where it draws 90.0% of its customers) tends to decrease, further highlighting the importance of local markets to this industry. However, some industry operators, including Bowlmor AMF and Lucky Strike, do operate centers overseas. Yet, the industry’s level of globalization is anticipated to remain low over the five years to 2019.
Barriers to Entrycontinued
Proprietors’ Association of America have received financing from a local bank or financial institution in the past two years. Alternatively, national and private financing provided significantly less funds to industry operators in recent years. While 39.0% of respondents stated that they did not require financing in the past two years, 4.0% indicated that they were not able to obtain financing in that period. The inability to garner sufficient capital to cover facility and equipment purchases represents the most substantial barrier to entry for potential operators.
However, the industry is very fragmented, and operators that are able to locate in a market with a large number of casual and high-income bowlers are typically able to recoup their initial costs quickly. Yet, finding a location that fits these characteristics, and is sufficiently far away from competitors, has become
increasingly difficult. While the industry’s dominant player, Bowlmor AMF, enjoys a recognizable brand and national reach, bowling is largely a local activity, and new entrants that offer better facilities and wider selection can be successful. Furthermore, there is little regulation pertaining specifically to the industry, and licensing requirements are largely related to food and beverage service, rather than bowling activities.
Barriers to Entry checklist Level
Competition HighConcentration LowLife Cycle Stage DeclineCapital Intensity MediumTechnology Change LowRegulation & Policy LightIndustry Assistance Low
SOURCE: WWW.IBISWORLD.COM
Level & Trend Globalization in this industry is Low and the trend is Steady
Level & Trend Barriers to Entry in this industry are Medium and Increasing

WWW.IBISWORLD.COM Bowling Centers in the US October 2014 24
Player Performance AMF Bowling Worldwide Inc. filed for bankruptcy in November 2012 and has since reorganized. In July 2013, AMF Bowling Worldwide Inc. completed its merger with Strike Holdings LLC, commonly known as Bowlmor; the combined venture took the name Bowlmor AMF. The new company is jointly owned by Bowlmor and some of AMF Bowling Worldwide’s lenders, including Cerberus Capital Management and Credit Suisse. In September 2014, Bowlmor AMF announced that it had completed its acquisition of Brunswick Corporation’s bowling center business, previously the second largest player in the industry. The merger with AMF and acquisition of Brunswick’s bowling operations created the largest operator of bowling centers in the world, as the company now employs an estimated 9,000 individuals throughout its 340 establishments.
Headquartered in Mechanicsville, VA, AMF Bowling Worldwide was already the largest industry operator prior to its merger. The chain offers league and casual bowling, usually with an arcade game room, billiards and a limited-item food and beverage menu. In addition, the company’s establishments typically sell bowling balls, equipment and accessories. The company owns a 50.0% share of QubicaAMF Worldwide, a joint venture between the company and Italian manufacturer Qubica, which sells bowling center equipment such as refurbished pinsetters, automatic
scoring systems and modern lounge furniture. The joint company also offers consulting and management services for new and remodeled bowling centers.
Headquartered in Lake Forest, IL, Brunswick Corporation is a global designer, manufacturer and marketer of recreational products, including marine engines, boats, fitness equipment and bowling and billiards equipment. Prior to its acquisition, the company’s bowling & billiards segment was the most applicable to the Bowling Centers industry. Despite the company’s efforts to upgrade its establishments to fully-modernized bowling centers that also offer family entertainment services and activities, its industry-specific revenue has fallen consistently in recent years, with a particularly pronounced drop in revenue in 2009.
Bowlmor Lanes, prior to the merger with AMF and acquisition of Brunswick, operated a relatively small number of high-end bowling centers in New York, California, Florida, Maryland, Georgia and Texas. In 1997, its first location, the original Bowlmor establishment near Union Square in New York City was renovated into a luxury bowling center with nightclub-like features designed to cater to an affluent, younger market. The company’s rapid success and fashionable aesthetic has led to frequent celebrity appearances, further publicizing the chain. In 2010, the company opened its largest location, a 90,000-square-foot center in Times Square.
Major CompaniesBowlmor AMF | Other Companies
81.7%Other
Bowlmor AMF 18.3%SOURCE: WWW.IBISWORLD.COM
Major players(Market share)
Bowlmor AMF Market share: 18.3% Industry Brand Names Bowlmor Centers Bowlero Centers AMF Centers Brunswick Zones

WWW.IBISWORLD.COM Bowling Centers in the US October 2014 25
Major Companies
Other Companies The Bowling Centers industry is highly fragmented and operates with a low level of market share concentration. In 2014, an estimated 3,480 enterprises operate in the industry, with only a few accounting for more than 1.0% of the market. Despite substantial merger and acquisition activity in recent years, including the merger of AMF Bowling Worldwide Inc. and Strike Holdings LLC, the industry is anticipated to continue to operate with a low level of market share concentration over the five years to 2019.
Lucky Strike Entertainment LLC Estimated market share: 3.1%Headquartered in Sherman Oaks, CA, Lucky Strike operates bowling centers,
restaurants and lounge facilities. The company has locations in 12 states, the District of Columbia and Canada. Founded in 2003, the company opened its first location in Hollywood in the same year. Currently, the company operates 20 locations, many of which have full-service bars, party spaces and a range of food and entertainment options.
One of the company’s newest locations in San Francisco features 12 bowling lanes, a 40-foot bar, billiards tables and a bowling system produced by Qubica AMF that reduces power consumption by an estimated 60.0%. In 2014, Lucky Strike’s industry- specific revenue is anticipated to reach $102.7 million, giving the company a
Player Performancecontinued
Financial performanceAs a private company, Bowlmor AMF does not publicly release financial data. However, IBISWorld estimates that the company’s US revenue has increased at an annualized rate of 12.2% to $600.0 million over the five years to 2014. AMF Bowling Worldwide has struggled under the weight of heavy debt in recent years. For example, in 2011, Standard & Poor’s downgraded the company’s corporate credit rating, indicating less confidence in
the firm’s ability to make loan payments. Like the industry as a whole, AMF Bowling Worldwide has experienced falling revenue as bowling league popularity declined and the popularity of other forms of entertainment has risen. However, the increasing number of Bowlmor establishments and the acquisition of Brunswick’s bowling operations has allowed revenue for the joint company to far outpace its competitors over the five-year period.
Bowlmor AMF (US bowling operations) – fi nancial performance*
YearRevenue
($ million) (% change)Employees
(People) (% change)
2009 338.1 -6.5 7,321 -4.0
2010 324.2 -4.1 7,028 -4.0
2011 332.0 2.4 7,014 -0.2
2012 338.6 2.0 7,000 -0.2
2013 436.8 29.0 7,279 4.0
2014** 600.0 37.4 9,000 23.6
*Estimates; **Includes projected revenue from Brunswick acquisitionSOURCE: IBISWORLD

WWW.IBISWORLD.COM Bowling Centers in the US October 2014 26
Major Companies
Other Companiescontinued
market share of 3.1%. Over the five-year period, Lucky Strike has outperformed its competitors, largely due to a rapid
increase in its establishments that offer first-class amenities and feature new technologies.
WWW.IBISWORLD.COM Bowling Centers in the US October 2014 27
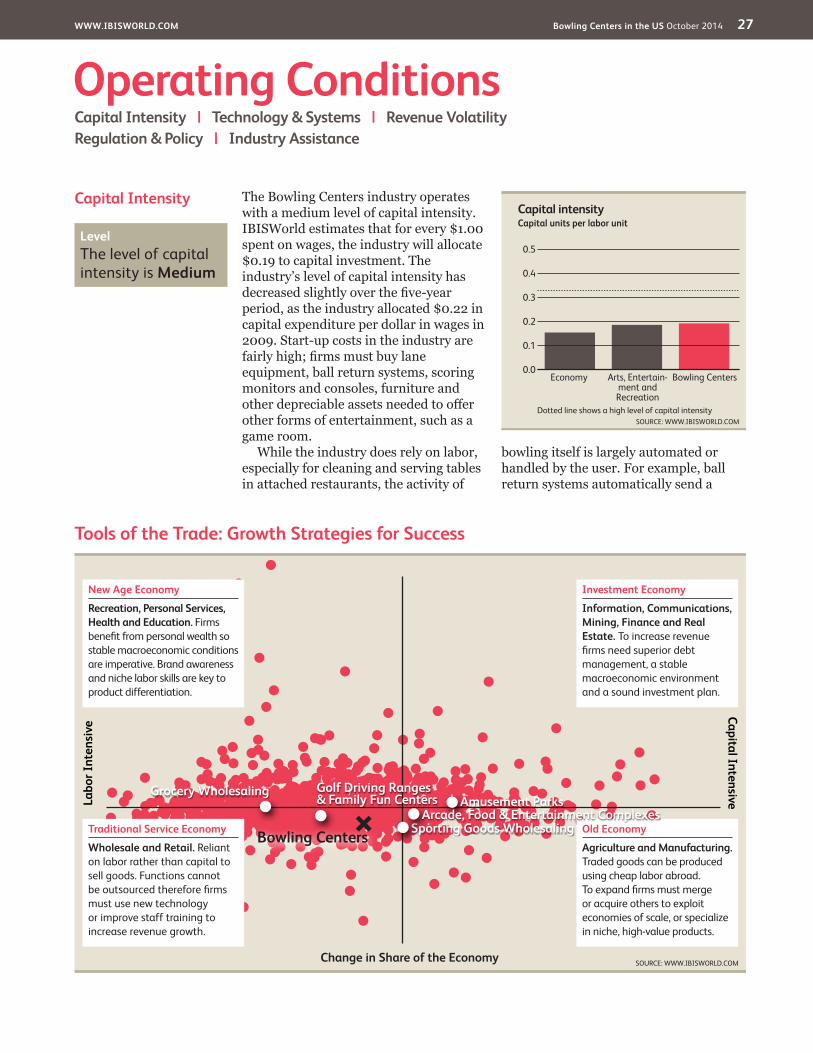
Capital Intensity The Bowling Centers industry operates with a medium level of capital intensity. IBISWorld estimates that for every $1.00 spent on wages, the industry will allocate $0.19 to capital investment. The industry’s level of capital intensity has decreased slightly over the five-year period, as the industry allocated $0.22 in capital expenditure per dollar in wages in 2009. Start-up costs in the industry are fairly high; firms must buy lane equipment, ball return systems, scoring monitors and consoles, furniture and other depreciable assets needed to offer other forms of entertainment, such as a game room.
While the industry does rely on labor, especially for cleaning and serving tables in attached restaurants, the activity of
bowling itself is largely automated or handled by the user. For example, ball return systems automatically send a
Operating ConditionsCapital Intensity | Technology & Systems | Revenue VolatilityRegulation & Policy | Industry Assistance
Tools of the Trade: Growth Strategies for Success
SOURCE: WWW.IBISWORLD.COM
Labo
r Int
ensi
veCapital Intensive
Change in Share of the Economy
New Age Economy
Recreation, Personal Services, Health and Education. Firms benefi t from personal wealth so stable macroeconomic conditions are imperative. Brand awareness and niche labor skills are key to product differentiation.
Traditional Service Economy
Wholesale and Retail. Reliant on labor rather than capital to sell goods. Functions cannot be outsourced therefore fi rms must use new technology or improve staff training to increase revenue growth.
Old Economy
Agriculture and Manufacturing. Traded goods can be produced using cheap labor abroad. To expand fi rms must merge or acquire others to exploit economies of scale, or specialize in niche, high-value products.
Investment Economy
Information, Communications, Mining, Finance and Real Estate. To increase revenue fi rms need superior debt management, a stable macroeconomic environment and a sound investment plan.
Amusement Parks
Sporting Goods WholesalingArcade, Food & Entertainment Complexes
Grocery Wholesaling Golf Driving Ranges & Family Fun Centers
Bowling Centers
Capital intensity
0.5
0.0
0.1
0.2
0.3
0.4
SOURCE: WWW.IBISWORLD.COMDotted line shows a high level of capital intensity
Capital units per labor unit
Bowling CentersArts, Entertain-ment and Recreation
Economy
Level The level of capital intensity is Medium
WWW.IBISWORLD.COM Bowling Centers in the US October 2014 28
Operating Conditions
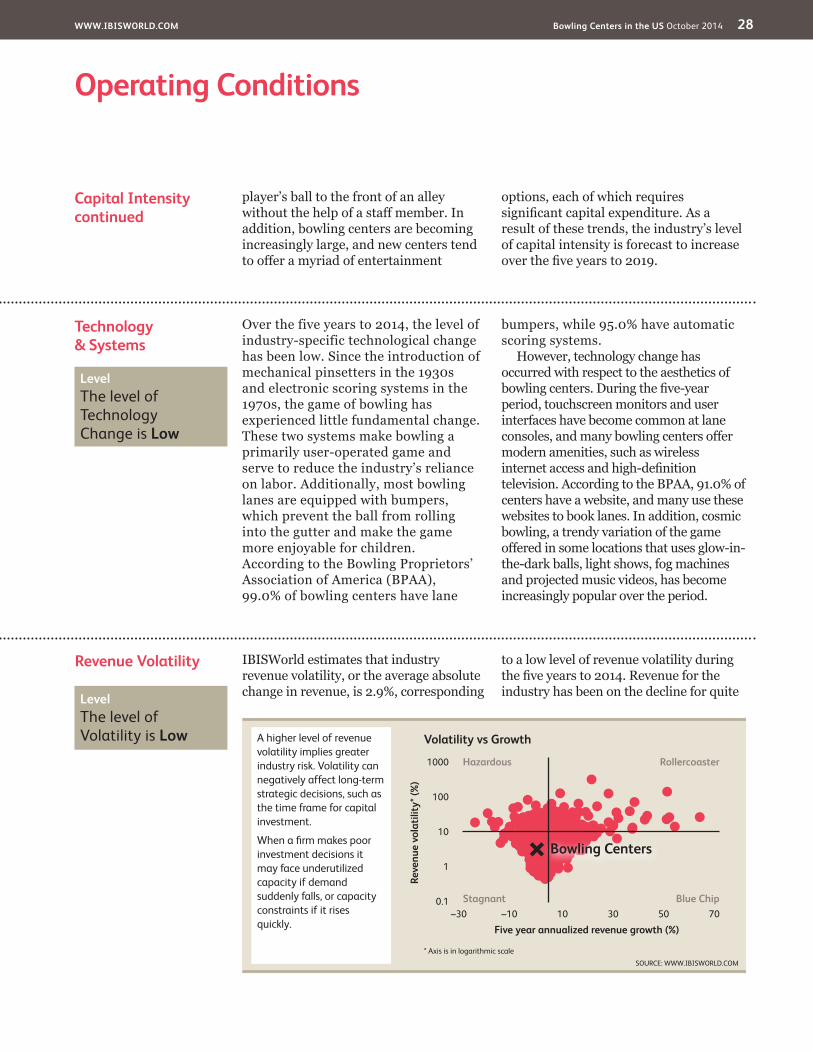
Revenue Volatility IBISWorld estimates that industry revenue volatility, or the average absolute change in revenue, is 2.9%, corresponding
to a low level of revenue volatility during the five years to 2014. Revenue for the industry has been on the decline for quite
Technology& Systems
Over the five years to 2014, the level of industry-specific technological change has been low. Since the introduction of mechanical pinsetters in the 1930s and electronic scoring systems in the 1970s, the game of bowling has experienced little fundamental change. These two systems make bowling a primarily user-operated game and serve to reduce the industry’s reliance on labor. Additionally, most bowling lanes are equipped with bumpers, which prevent the ball from rolling into the gutter and make the game more enjoyable for children. According to the Bowling Proprietors’ Association of America (BPAA), 99.0% of bowling centers have lane
bumpers, while 95.0% have automatic scoring systems.
However, technology change has occurred with respect to the aesthetics of bowling centers. During the five-year period, touchscreen monitors and user interfaces have become common at lane consoles, and many bowling centers offer modern amenities, such as wireless internet access and high-definition television. According to the BPAA, 91.0% of centers have a website, and many use these websites to book lanes. In addition, cosmic bowling, a trendy variation of the game offered in some locations that uses glow-in-the-dark balls, light shows, fog machines and projected music videos, has become increasingly popular over the period.
Capital Intensitycontinued
player’s ball to the front of an alley without the help of a staff member. In addition, bowling centers are becoming increasingly large, and new centers tend to offer a myriad of entertainment
options, each of which requires significant capital expenditure. As a result of these trends, the industry’s level of capital intensity is forecast to increase over the five years to 2019.
Level The level of Technology Change is Low
SOURCE: WWW.IBISWORLD.COM
Volatility vs Growth
Reve
nue
vola
tility
* (%
)
1000
100
10
1
0.1
Five year annualized revenue growth (%)–30 –10 10 30 50 70
Hazardous
Stagnant
Rollercoaster
Blue Chip
* Axis is in logarithmic scale
Bowling Centers
A higher level of revenue volatility implies greater industry risk. Volatility can negatively affect long-term strategic decisions, such as the time frame for capital investment.
When a fi rm makes poor investment decisions it may face underutilized capacity if demand suddenly falls, or capacity constraints if it rises quickly.
Level The level of Volatility is Low

WWW.IBISWORLD.COM Bowling Centers in the US October 2014 29
Operating Conditions
Regulation & Policy The Bowling Centers industry is subject to a light and steady level of regulation. Each firm in the industry is subject to general regulation from federal, state and local governments. In addition, each center is subject to licensing and regulation by a number of governmental authorities, which may include alcoholic beverage control, health and safety and fire agencies in the state, county or municipality in which the center is located. Firms must comply with required town planning, zoning and development regulations in relation to the location and building of amusement arcades. Firms are also subject to the Fair Labor Standards Act, which governs such matters as minimum wages, overtime and other working conditions, along with the Americans with Disabilities Act, which mandates that locations be accessible to consumers that use wheelchairs or other assistive equipment.
Each center is required to obtain a license from a state authority and, in certain locations, from county and municipal authorities, if it sells alcoholic beverages on the premises. Typically, licenses must be renewed annually and may be revoked or suspended at any time. Alcoholic beverage regulations relate to numerous aspects of the daily
operations of each complex, including the minimum age of patrons and employees, hours of operation, advertising, wholesale purchasing, inventory control and handling and storing and dispensing alcoholic drinks. In addition to alcohol, according to the Bowling Proprietors’ Association of America, 96.0% of domestic bowling centers are subject to smoking laws.
Moreover, a state-based sales, use or consumption tax applies in most states and can vary from 0.0% to 7.0%, with most in the range of 6.0% to 6.5%. In some areas, a separate city or county tax may also apply. This tax is added to the selling price of all foods for immediate consumption, whether on an eat-in or take-out basis. There may be some local state exemptions, such as on ice-cream or iced milk sold for take-out. Sales of food and beverages by vending machines may also be taxed, at a level generally between 3.0% and 5.0% of the retail price. There may also be a sales tax between 3.0% and 6.0% on any pro-shop sales. Additionally, some states have implemented a tax on commercial leases and annual license fees on restaurant operations may also apply. Other states, such as Hawaii, have taxes on the gross sales proceeds of amusement and entertainment venues.
Revenue Volatilitycontinued
some time, largely due to heightened external competition. However, bowling centers also demonstrate the ability to bounce back after periods of slipping sales. For example, in 2011, after three consecutive years of declining performance, rising per capita disposable
income levels and time spent on leisure and sports caused revenue to return to growth. Yet, over the five years to 2019, revenue volatility is anticipated to temper further as the industry’s performance is anticipated to consistently suffer from mounting competition.
Level & Trend The level of Regulation is Light and the trend is Steady

WWW.IBISWORLD.COM Bowling Centers in the US October 2014 30
Operating Conditions
Industry Assistance The Bowling Centers industry receives no direct government assistance in the form of tariffs or subsidies. However, industry associations like the Bowling Proprietors’ Association of America organize bowling center operators, provide industry data and research and lobby for the industry. League and tournament play is organized
by the United States Bowling Congress; however, this group is not an association for industry operators. In addition, World Bowling promotes the development of bowling internationally and establishes rules for the uniform practice of bowling throughout the world, among other tasks.
Level & Trend The level of Industry Assistance is Low and the trend is Steady

WWW.IBISWORLD.COM Bowling Centers in the US October 2014 31
Key StatisticsRevenue
($m)
Industry Value Added
($m)Establish-
ments Enterprises Employment Exports ImportsWages ($m)
Domestic Demand
Urban Population
(%)2005 3,843.3 1,498.5 4,666 4,003 82,479 -- -- 1,121.9 N/A 79.82006 3,570.5 1,478.5 4,615 3,944 81,257 -- -- 1,153.5 N/A 80.02007 3,826.2 1,503.9 4,571 3,899 80,453 -- -- 1,121.3 N/A 80.22008 3,681.2 1,446.2 4,492 3,820 81,323 -- -- 1,126.0 N/A 80.42009 3,416.6 1,368.4 4,349 3,713 78,058 -- -- 1,078.0 N/A 80.52010 3,354.4 1,245.6 4,297 3,684 74,913 -- -- 1,040.9 N/A 80.72011 3,389.1 1,268.1 4,256 3,645 74,928 -- -- 1,044.4 N/A 80.82012 3,404.2 1,286.6 4,222 3,613 74,848 -- -- 1,044.9 N/A 80.92013 3,301.1 1,270.7 4,119 3,526 72,869 -- -- 1,013.3 N/A 81.12014 3,271.2 1,257.8 4,067 3,480 72,158 -- -- 1,002.6 N/A 81.22015 3,261.8 1,254.5 4,012 3,430 71,571 -- -- 995.2 N/A 81.32016 3,248.7 1,249.5 3,970 3,393 71,119 -- -- 989.0 N/A 81.52017 3,244.2 1,248.1 3,920 3,347 70,637 -- -- 983.2 N/A 81.62018 3,226.4 1,241.4 3,878 3,310 70,131 -- -- 976.0 N/A 81.72019 3,222.8 1,240.2 3,832 3,267 69,692 -- -- 970.8 N/A 81.8Sector Rank 17/33 19/33 15/33 17/33 12/33 N/A N/A 16/33 N/A N/AEconomy Rank 904/1305 845/1305 564/1304 528/1304 438/1305 N/A N/A 755/1305 N/A N/A
IVA/Revenue (%)
Imports/Demand
(%)
Exports/Revenue
(%)
Revenue per Employee
($’000)Wages/Revenue
(%)Employees
per Est.Average Wage
($)
Share of the Economy
(%)2005 38.99 N/A N/A 46.60 29.19 17.68 13,602.25 0.012006 41.41 N/A N/A 43.94 32.31 17.61 14,195.70 0.012007 39.31 N/A N/A 47.56 29.31 17.60 13,937.33 0.012008 39.29 N/A N/A 45.27 30.59 18.10 13,846.02 0.012009 40.05 N/A N/A 43.77 31.55 17.95 13,810.24 0.012010 37.13 N/A N/A 44.78 31.03 17.43 13,894.78 0.012011 37.42 N/A N/A 45.23 30.82 17.61 13,938.71 0.012012 37.79 N/A N/A 45.48 30.69 17.73 13,960.29 0.012013 38.49 N/A N/A 45.30 30.70 17.69 13,905.78 0.012014 38.45 N/A N/A 45.33 30.65 17.74 13,894.51 0.012015 38.46 N/A N/A 45.57 30.51 17.84 13,905.07 0.012016 38.46 N/A N/A 45.68 30.44 17.91 13,906.27 0.012017 38.47 N/A N/A 45.93 30.31 18.02 13,919.05 0.012018 38.48 N/A N/A 46.01 30.25 18.08 13,916.81 0.012019 38.48 N/A N/A 46.24 30.12 18.19 13,929.86 0.01Sector Rank 26/33 N/A N/A 27/33 13/33 10/33 27/33 19/33Economy Rank 519/1305 N/A N/A 1236/1305 337/1305 539/1304 1238/1305 845/1305
Figures are inflation-adjusted 2014 dollars. Rank refers to 2014 data.
Revenue (%)
Industry Value Added
(%)
Establish-ments
(%)Enterprises
(%)Employment
(%)Exports
(%)Imports
(%)Wages
(%)
Domestic Demand
(%)
Urban Population
(%)2006 -7.1 -1.3 -1.1 -1.5 -1.5 N/A N/A 2.8 N/A 0.32007 7.2 1.7 -1.0 -1.1 -1.0 N/A N/A -2.8 N/A 0.32008 -3.8 -3.8 -1.7 -2.0 1.1 N/A N/A 0.4 N/A 0.22009 -7.2 -5.4 -3.2 -2.8 -4.0 N/A N/A -4.3 N/A 0.12010 -1.8 -9.0 -1.2 -0.8 -4.0 N/A N/A -3.4 N/A 0.22011 1.0 1.8 -1.0 -1.1 0.0 N/A N/A 0.3 N/A 0.12012 0.4 1.5 -0.8 -0.9 -0.1 N/A N/A 0.0 N/A 0.12013 -3.0 -1.2 -2.4 -2.4 -2.6 N/A N/A -3.0 N/A 0.22014 -0.9 -1.0 -1.3 -1.3 -1.0 N/A N/A -1.1 N/A 0.12015 -0.3 -0.3 -1.4 -1.4 -0.8 N/A N/A -0.7 N/A 0.12016 -0.4 -0.4 -1.0 -1.1 -0.6 N/A N/A -0.6 N/A 0.22017 -0.1 -0.1 -1.3 -1.4 -0.7 N/A N/A -0.6 N/A 0.12018 -0.5 -0.5 -1.1 -1.1 -0.7 N/A N/A -0.7 N/A 0.1
2019 -0.1 -0.1 -1.2 -1.3 -0.6 N/A N/A -0.5 N/A 0.1Sector Rank 31/33 31/33 31/33 30/33 31/33 N/A N/A 31/33 N/A N/AEconomy Rank 1148/1305 1094/1305 1123/1304 1098/1304 1113/1305 N/A N/A 1097/1305 N/A N/A
Annual Change
Key Ratios
Industry Data
SOURCE: WWW.IBISWORLD.COM

WWW.IBISWORLD.COM Bowling Centers in the US October 2014 32
Jargon & Glossary
BARRIERS TO ENTRY High barriers to entry mean that new companies struggle to enter an industry, while low barriers mean it is easy for new companies to enter an industry.
CAPITAL INTENSITY Compares the amount of money spent on capital (plant, machinery and equipment) with that spent on labor. IBISWorld uses the ratio of depreciation to wages as a proxy for capital intensity. High capital intensity is more than $0.333 of capital to $1 of labor; medium is $0.125 to $0.333 of capital to $1 of labor; low is less than $0.125 of capital for every $1 of labor.
CONSTANT PRICES The dollar figures in the Key Statistics table, including forecasts, are adjusted for inflation using the current year (i.e. year published) as the base year. This removes the impact of changes in the purchasing power of the dollar, leaving only the “real” growth or decline in industry metrics. The inflation adjustments in IBISWorld’s reports are made using the US Bureau of Economic Analysis’ implicit GDP price deflator.
DOMESTIC DEMAND Spending on industry goods and services within the United States, regardless of their country of origin. It is derived by adding imports to industry revenue, and then subtracting exports.
EMPLOYMENT The number of permanent, part-time, temporary and seasonal employees, working proprietors, partners, managers and executives within the industry.
ENTERPRISE A division that is separately managed and keeps management accounts. Each enterprise consists of one or more establishments that are under common ownership or control.
ESTABLISHMENT The smallest type of accounting unit within an enterprise, an establishment is a single physical location where business is conducted or where services or industrial operations are performed. Multiple establishments under common control make up an enterprise.
EXPORTS Total value of industry goods and services sold by US companies to customers abroad.
IMPORTS Total value of industry goods and services brought in from foreign countries to be sold in the United States.
INDUSTRY CONCENTRATION An indicator of the dominance of the top four players in an industry. Concentration is considered high if the top players account for more than 70% of industry revenue. Medium is 40% to 70% of industry revenue. Low is less than 40%.
INDUSTRY REVENUE The total sales of industry goods and services (exclusive of excise and sales tax); subsidies on production; all other operating income from outside the firm (such as commission income, repair and service income, and rent, leasing and hiring income); and capital work done by rental or lease. Receipts from interest royalties, dividends and the sale of fixed tangible assets are excluded.
INDUSTRY VALUE ADDED (IVA) The market value of goods and services produced by the industry minus the cost of goods and services used in production. IVA is also described as the industry’s contribution to GDP, or profit plus wages and depreciation.
INTERNATIONAL TRADE The level of international trade is determined by ratios of exports to revenue and imports to domestic demand. For exports/revenue: low is less than 5%, medium is 5% to 20%, and high is more than 20%. Imports/domestic demand: low is less than 5%, medium is 5% to 35%, and high is more than 35%.
LIFE CYCLE All industries go through periods of growth, maturity and decline. IBISWorld determines an industry’s life cycle by considering its growth rate (measured by IVA) compared with GDP; the growth rate of the number of establishments; the amount of change the industry’s products are undergoing; the rate of technological change; and the level of customer acceptance of industry products and services.
NONEMPLOYING ESTABLISHMENT Businesses with no paid employment or payroll, also known as nonemployers. These are mostly set up by self-employed individuals.
PROFIT IBISWorld uses earnings before interest and tax (EBIT) as an indicator of a company’s profitability. It is calculated as revenue minus expenses, excluding interest and tax.
VOLATILITY The level of volatility is determined by averaging the absolute change in revenue in each of the past five years. Volatility levels: very high is more than ±20%; high volatility is ±10% to ±20%; moderate volatility is ±3% to ±10%; and low volatility is less than ±3%.
WAGES The gross total wages and salaries of all employees in the industry. The cost of benefits is also included in this figure.
Industry Jargon
IBISWorld Glossary
COSMIC BOWLING Conventional bowling that is accompanied by music and light shows.
FAMILY FUN CENTER An establishment that offers a variety of activities that cater to the entire family.
PINSETTER A device that automatically sets up and spots bowling pins on the bowling alley.

Disclaimer
This product has been supplied by IBISWorld Inc. (‘IBISWorld’) solely for use by its authorized licensees strictly in accordance with their license agreements with IBISWorld. IBISWorld makes no representation to any other person with regard to the completeness or accuracy of the data or information contained herein, and it accepts no responsibility and disclaims all liability (save for liability which cannot be lawfully disclaimed) for loss or damage whatsoever suffered or incurred by any other person resulting from
the use of, or reliance upon, the data or information contained herein. Copyright in this publication is owned by IBISWorld Inc. The publication is sold on the basis that the purchaser agrees not to copy the material contained within it for other than the purchasers own purposes. In the event that the purchaser uses or quotes from the material in this publication – in papers, reports, or opinions prepared for any other person – it is agreed that it will be sourced to: IBISWorld Inc.
At IBISWorld we know that industry intelligence is more than assembling factsIt is combining data with analysis to answer the questions that successful businesses askIdentify high growth, emerging & shrinking marketsArm yourself with the latest industry intelligenceAssess competitive threats from existing & new entrantsBenchmark your performance against the competitionMake speedy market-ready, profit-maximizing decisions
Who is IBISWorld?We are strategists, analysts, researchers, and marketers. We provide answers to information-hungry, time-poor businesses. Our goal is to provide real world answers that matter to your business in our 700 US industry reports. When tough strategic, budget, sales and marketing decisions need to be made, our suite of Industry and Risk intelligence products give you deeply-researched answers quickly.
IBISWorld MembershipIBISWorld offers tailored membership packages to meet your needs.
Copyright 2014 IBISWorld Inc
www.ibisworld.com | 1-800-330-3772 | [email protected]