IBISWorld Industry Report 23822b Plumbers in the US
37
IBISWorld Industry Report 23822b Plumbers in the US December 2019 Kevin Kennedy Increased suction: Growth of downstream construction markets will boost demand 2 About this Industry 2 Industry Definition 2 Main Activities 2 Similar Industries 3 Additional Resources 4 Industry at a Glance 5 Industry Performance 5 Executive Summary 5 Key External Drivers 7 Current Performance 10 Industry Outlook 12 Industry Life Cycle 14 Products and Markets 14 Supply Chain 14 Products and Services 15 Demand Determinants 16 Major Markets 18 International Trade 19 Business Locations 22 Competitive Landscape 22 Market Share Concentration 22 Key Success Factors 22 Cost Structure Benchmarks 24 Basis of Competition 25 Barriers to Entry 25 Industry Globalization 26 Major Companies 26 Emcor Group Inc. 27 Tutor Perini Corp 27 Roto-Rooter Plumbing and Water Cleanup Service 28 Comfort Systems USA Inc. 29 Operating Conditions 29 Capital Intensity 30 Technology and Systems 30 Revenue Volatility 31 Regulation and Policy 32 Industry Assistance 33 Key Statistics 33 Industry Data 33 Annual Change 33 Key Ratios 34 Industry Financial Ratios 35 Jargon & Glossary www.ibisworld.com | 1-800-330-3772 | info @ ibisworld.com
Transcript of IBISWorld Industry Report 23822b Plumbers in the US
WWW.IBISWORLD.COM Plumbers in the US December 2019 1
IBISWorld Industry Report 23822bPlumbers in the USDecember 2019 Kevin Kennedy
Increased suction: Growth of downstream construction markets will boost demand
2 About this Industry2 Industry Definition
2 Main Activities
2 Similar Industries
3 Additional Resources
4 Industry at a Glance
5 Industry Performance5 Executive Summary
5 Key External Drivers
7 Current Performance
10 Industry Outlook
12 Industry Life Cycle
14 Products and Markets14 Supply Chain
14 Products and Services
15 Demand Determinants
16 Major Markets
18 International Trade
19 Business Locations
22 Competitive Landscape22 Market Share Concentration
22 Key Success Factors
22 Cost Structure Benchmarks
24 Basis of Competition
25 Barriers to Entry
25 Industry Globalization
26 Major Companies26 Emcor Group Inc.
27 Tutor Perini Corp
27 Roto-Rooter Plumbing and Water Cleanup Service
28 Comfort Systems USA Inc.
29 Operating Conditions29 Capital Intensity
30 Technology and Systems
30 Revenue Volatility
31 Regulation and Policy
32 Industry Assistance
33 Key Statistics33 Industry Data
33 Annual Change
33 Key Ratios
34 Industry Financial Ratios
35 Jargon & Glossary
www.ibisworld.com | 1-800-330-3772 | [email protected]
WWW.IBISWORLD.COM Plumbers in the US December 2019 2
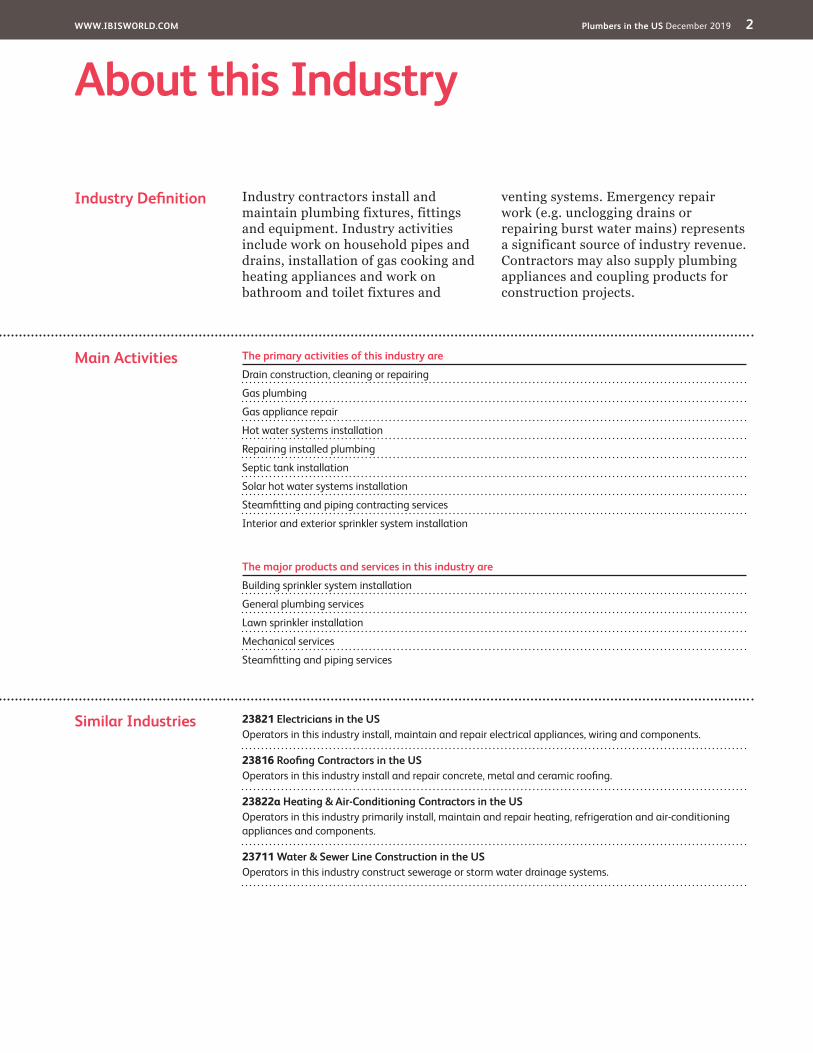
Industry contractors install and maintain plumbing fixtures, fittings and equipment. Industry activities include work on household pipes and drains, installation of gas cooking and heating appliances and work on bathroom and toilet fixtures and
venting systems. Emergency repair work (e.g. unclogging drains or repairing burst water mains) represents a significant source of industry revenue. Contractors may also supply plumbing appliances and coupling products for construction projects.
The primary activities of this industry are
Drain construction, cleaning or repairing
Gas plumbing
Gas appliance repair
Hot water systems installation
Repairing installed plumbing
Septic tank installation
Solar hot water systems installation
Steamfitting and piping contracting services
Interior and exterior sprinkler system installation
23821 Electricians in the USOperators in this industry install, maintain and repair electrical appliances, wiring and components.
23816 Roofing Contractors in the USOperators in this industry install and repair concrete, metal and ceramic roofing.
23822a Heating & Air-Conditioning Contractors in the USOperators in this industry primarily install, maintain and repair heating, refrigeration and air-conditioning appliances and components.
23711 Water & Sewer Line Construction in the USOperators in this industry construct sewerage or storm water drainage systems.
Industry Definition
Main Activities
Similar Industries
About this Industry
The major products and services in this industry are
Building sprinkler system installation
General plumbing services
Lawn sprinkler installation
Mechanical services
Steamfitting and piping services
WWW.IBISWORLD.COM Plumbers in the US December 2019 3
About this Industry
For additional information on this industry
www.mcaa.org Mechanical Contractors Association of America
www.nahb.org National Association of Home Builders
www.pmmag.com Plumbing & Mechanical Magazine
www.phccweb.org Plumbing-Heating-Cooling Contractors Association
Additional Resources
IBISWorld writes over 1000 US industry reports, which are updated up to four times a year. To see all reports, go to www.ibisworld.com

WWW.IBISWORLD.COM Plumbers in the US December 2019 4
% c
hang
e
12
-6
-3
0
3
6
9
2614 16 18 20 22 24Year
Value of private nonresidential construction
SOURCE: WWW.IBISWORLD.COM
% c
hang
e
8
-8
-4
0
4
2511 13 15 17 19 21 23Year
Revenue Employment
Revenue vs. employment growth
Products and services segmentation (2019)
47.9%General plumbing services
38.2%Mechanical services
6.7%Building sprinkler system installation
5.6%Steamfitting and piping services
1.6%Lawn sprinkler installation
Key Statistics Snapshot
Industry at a GlancePlumbers in 2019
Industry Structure Life Cycle Stage Mature
Revenue Volatility Low
Capital Intensity Low
Industry Assistance Low
Concentration Level Low
Regulation Level Medium
Technology Change Low
Barriers to Entry Medium
Industry Globalization Low
Competition Level High
Revenue
$112.7bnProfit
$6.3bnWages
$27.9bnBusinesses
117,803
Annual Growth 19–24
1.1%Annual Growth 14–19
2.2%
Key External DriversValue of private nonresidential constructionValue of residential constructionHousing startsPer capita disposable income30-year conventional mortgage ratePrivate spending on home improvements
Market ShareThere are no major players in this industry
p. 26
p. 5
FOR ADDITIONAL STATISTICS AND TIME SERIES SEE THE APPENDIX ON PAGE 33
SOURCE: WWW.IBISWORLD.COM
WWW.IBISWORLD.COM Plumbers in the US December 2019 5
Key External Drivers Value of private nonresidential constructionThis industry is sensitive to the cyclical fluctuations of investment in nonresidential and commercial construction. An increase in the value of private nonresidential construction raises demand for plumbing work done in retail stores, office buildings, factories and other structures. The value of private nonresidential construction is expected to slightly decrease in 2019, posing a
potential threat for the industry. The decline can be partly attributed to an adjacent decrease in corporate profitability, putting pressure on company budgets and potentially postponing industry relevant installations or maintenance.
Value of residential constructionThe industry derives about one-third of its revenue from the residential market, which demands plumbing services for the
Executive Summary The Plumbers industry has experienced moderate growth over the five years to 2019, where total revenue increased an annualized 2.2% to reach $112.7 billion. This increasing demand includes an annual decline of 0.1% in 2019 alone. Industry demand is influenced by both construction trends and the propensity for consumers to purchase industry services. As a result, trends in residential and commercial construction projects as well as levels of disposable income directly affect industry performance. Over the past five years, positive growth in both the value of private
nonresidential construction along with private spending on home improvement helped to bolster industry demand. Similarly, as a result of favorable economic conditions, levels of per capita disposable income have grown steadily between 2014 and 2019, enabling more consumers to allocate income toward new system purchases and repair work.
Industry revenue experienced its strongest growth in 2017 and 2018, increasing 4.9% and 3.4%, respectively. This demand spike came largely from
similar growth in housing starts, private spending on home improvements and the value of private nonresidential construction. Further, industry profitability increased during the period as declines in key input commodity prices decreased purchase expense contribution to average industry revenue. As a result, industry profit, measured as earnings before interest and taxes, increased over the five years to 2019. Purchase expenses declined largely, following a sustained decrease in the price of plastic and resin, a key input in industry products such as polyvinyl chloride (PVC) piping.
Over the five years to 2024, the Plumbers industry is expected to sustain revenue growth, although at a decelerated rate compared with the current period. Industry revenue is expected to increase at an annualized rate of 1.1% totaling $118.8 billion during the five-year period. This lagging demand results from similar deceleration in key construction markets such as private residential construction. Additionally, with threats of recession looming over the outlook period, consumers and businesses may be reluctant to allocate residual income toward industry services, as large-scale projects may have substantial time horizons to full completion. Overall, industry demand is expected to sustain growth.
Industry PerformanceExecutive Summary | Key External Drivers | Current Performance Industry Outlook | Life Cycle Stage
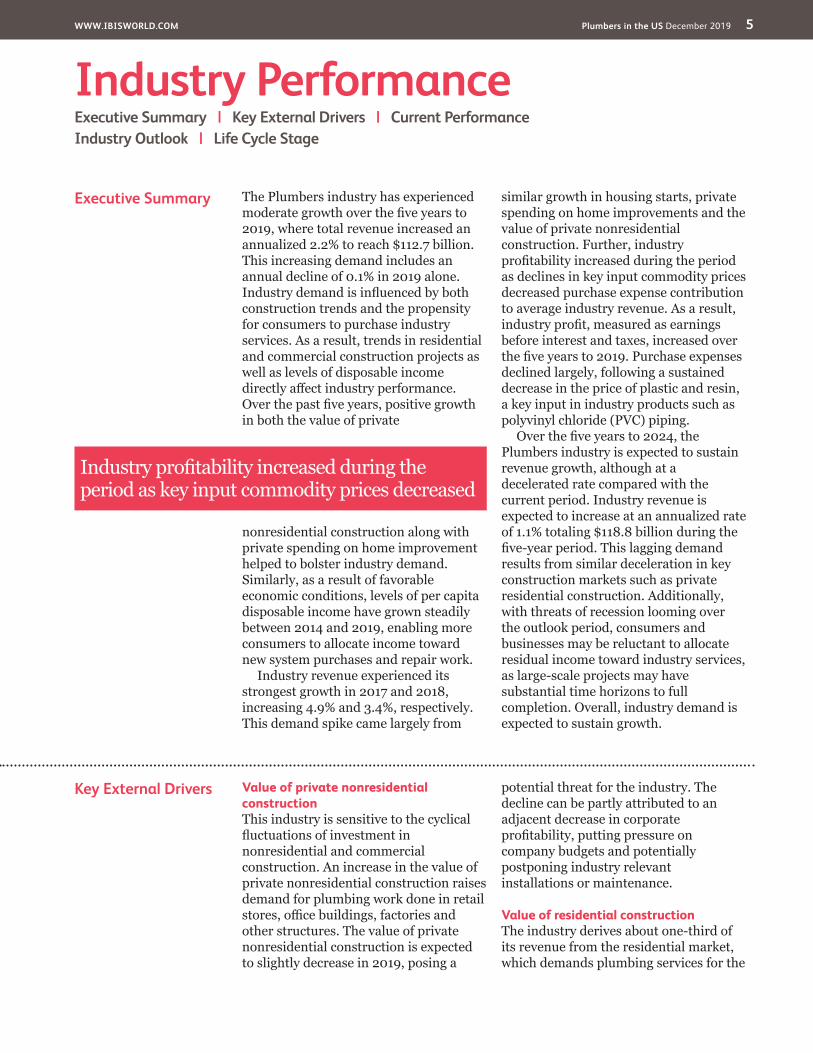
Industry profitability increased during the period as key input commodity prices decreased
WWW.IBISWORLD.COM Plumbers in the US December 2019 6
Industry Performance
Key External Driverscontinued
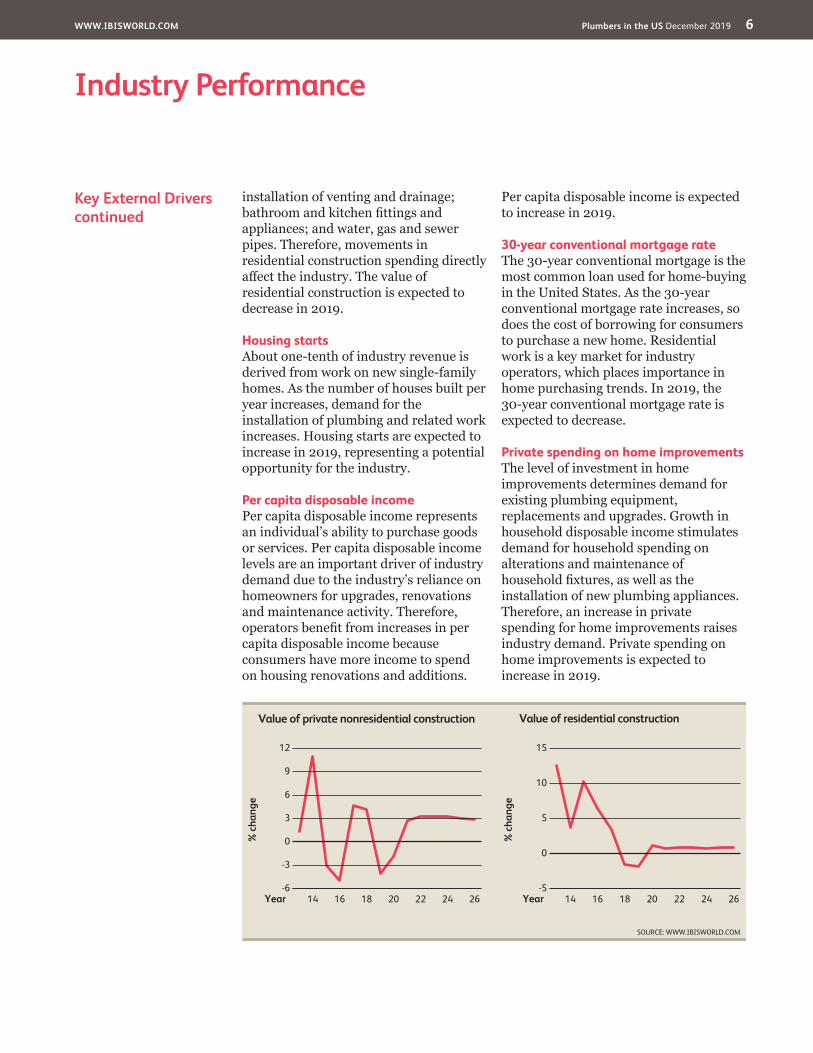
installation of venting and drainage; bathroom and kitchen fittings and appliances; and water, gas and sewer pipes. Therefore, movements in residential construction spending directly affect the industry. The value of residential construction is expected to decrease in 2019.
Housing startsAbout one-tenth of industry revenue is derived from work on new single-family homes. As the number of houses built per year increases, demand for the installation of plumbing and related work increases. Housing starts are expected to increase in 2019, representing a potential opportunity for the industry.
Per capita disposable incomePer capita disposable income represents an individual’s ability to purchase goods or services. Per capita disposable income levels are an important driver of industry demand due to the industry’s reliance on homeowners for upgrades, renovations and maintenance activity. Therefore, operators benefit from increases in per capita disposable income because consumers have more income to spend on housing renovations and additions.
Per capita disposable income is expected to increase in 2019.
30-year conventional mortgage rateThe 30-year conventional mortgage is the most common loan used for home-buying in the United States. As the 30-year conventional mortgage rate increases, so does the cost of borrowing for consumers to purchase a new home. Residential work is a key market for industry operators, which places importance in home purchasing trends. In 2019, the 30-year conventional mortgage rate is expected to decrease.
Private spending on home improvementsThe level of investment in home improvements determines demand for existing plumbing equipment, replacements and upgrades. Growth in household disposable income stimulates demand for household spending on alterations and maintenance of household fixtures, as well as the installation of new plumbing appliances. Therefore, an increase in private spending for home improvements raises industry demand. Private spending on home improvements is expected to increase in 2019.
% c
hang
e
15
-5
0
5
10
2614 16 18 20 22 24Year
Value of residential construction
SOURCE: WWW.IBISWORLD.COM
% c
hang
e
12
-6
-3
0
3
6
9
2614 16 18 20 22 24Year
Value of private nonresidential construction
WWW.IBISWORLD.COM Plumbers in the US December 2019 7
Industry Performance
Current Performance
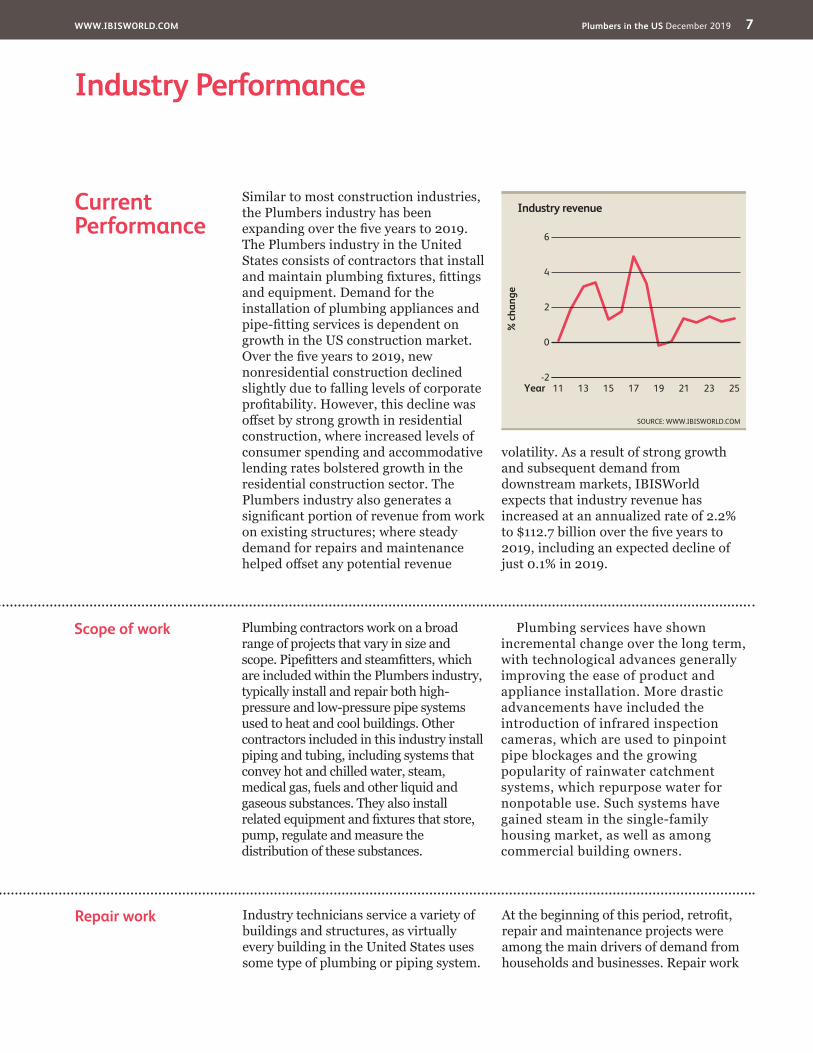
Similar to most construction industries, the Plumbers industry has been expanding over the five years to 2019. The Plumbers industry in the United States consists of contractors that install and maintain plumbing fixtures, fittings and equipment. Demand for the installation of plumbing appliances and pipe-fitting services is dependent on growth in the US construction market. Over the five years to 2019, new nonresidential construction declined slightly due to falling levels of corporate profitability. However, this decline was offset by strong growth in residential construction, where increased levels of consumer spending and accommodative lending rates bolstered growth in the residential construction sector. The Plumbers industry also generates a significant portion of revenue from work on existing structures; where steady demand for repairs and maintenance helped offset any potential revenue
volatility. As a result of strong growth and subsequent demand from downstream markets, IBISWorld expects that industry revenue has increased at an annualized rate of 2.2% to $112.7 billion over the five years to 2019, including an expected decline of just 0.1% in 2019.
Scope of work Plumbing contractors work on a broad range of projects that vary in size and scope. Pipefitters and steamfitters, which are included within the Plumbers industry, typically install and repair both high-pressure and low-pressure pipe systems used to heat and cool buildings. Other contractors included in this industry install piping and tubing, including systems that convey hot and chilled water, steam, medical gas, fuels and other liquid and gaseous substances. They also install related equipment and fixtures that store, pump, regulate and measure the distribution of these substances.
Plumbing services have shown incremental change over the long term, with technological advances generally improving the ease of product and appliance installation. More drastic advancements have included the introduction of infrared inspection cameras, which are used to pinpoint pipe blockages and the growing popularity of rainwater catchment systems, which repurpose water for nonpotable use. Such systems have gained steam in the single-family housing market, as well as among commercial building owners.
% c
hang
e
6
-2
0
2
4
2511 13 15 17 19 21 23Year
Industry revenue
SOURCE: WWW.IBISWORLD.COM
Repair work Industry technicians service a variety of buildings and structures, as virtually every building in the United States uses some type of plumbing or piping system.
At the beginning of this period, retrofit, repair and maintenance projects were among the main drivers of demand from households and businesses. Repair work
WWW.IBISWORLD.COM Plumbers in the US December 2019 8
Industry Performance
Repair workcontinued
is typically more resistant to economic fluctuations, as keeping plumbing systems in working order is considered essential for a household’s quality of life. Therefore, revenue from repairs and maintenance is steady and provided industry operators with a stable source of income, even when the housing market was experiencing heightened volatility.
Regular maintenance work is also often undertaken on a fixed-period contract basis for commercial customers (e.g. supermarkets and warehouses) and
on an irregular basis in the residential market or by referral from gas marketing agents or other tradespeople. Demand for maintenance activity can also vary on a seasonal basis as temperatures move into extremes, leading to a greater prevalence of broken or frozen pipes, as well as equipment failures. Maintenance and repair work done for existing buildings in residential and commercial markets combines to account for more than 50.0% of revenue in 2019.
New construction lifting demand
Although the US economy has been steadily expanding over the current period, corporate profitability has declined at an annualized rate of 1.7% over the five years to 2019. Declining profit could halt commercial real estate developments and, possibly, force companies to postpone certain maintenance or repair orders to salvage corporate budgets. However, the emergence of new businesses, which has increased by an annualized 1.3% over the current period, could offset this downside.
The housing construction market’s expansion in recent years has resulted in gradual growth in demand for construction contractors across the board, including plumbers. As the US economy recovered and disposable income increased, demand for new houses picked up, leading to increased property values; this rebound revitalized new residential construction, greatly increasing demand for plumbing contractors that specialize in the residential market.
The industry derives more than one-tenth of its revenue from installation work on new housing, including single-family homes and multifamily buildings, such as apartment structures. Over the five years to 2019, the number of housing
starts increased at an annualized rate of 4.2%, including an increase of 8.5% in 2014, 10.8% in 2015. Furthermore, the value of residential construction increased during the five-year period at an annualized rate of 3.2%. This downstream market expansion increased the available work for plumbers and reduced price-based competition as the number of available plumbing contracts grew.
In addition, US households have experienced an improvement in disposable income, facilitating an increase in private spending on home improvements. IBISWorld estimates that over the five years to 2019, private spending on home improvements has increased at an annualized rate of 5.4%. Together, these factors have increased demand for plumbing contractors, especially for higher-margin projects, causing industry employment to rise at an annualized rate of 3.4% over the five years to 2019, reaching 513,422 workers.
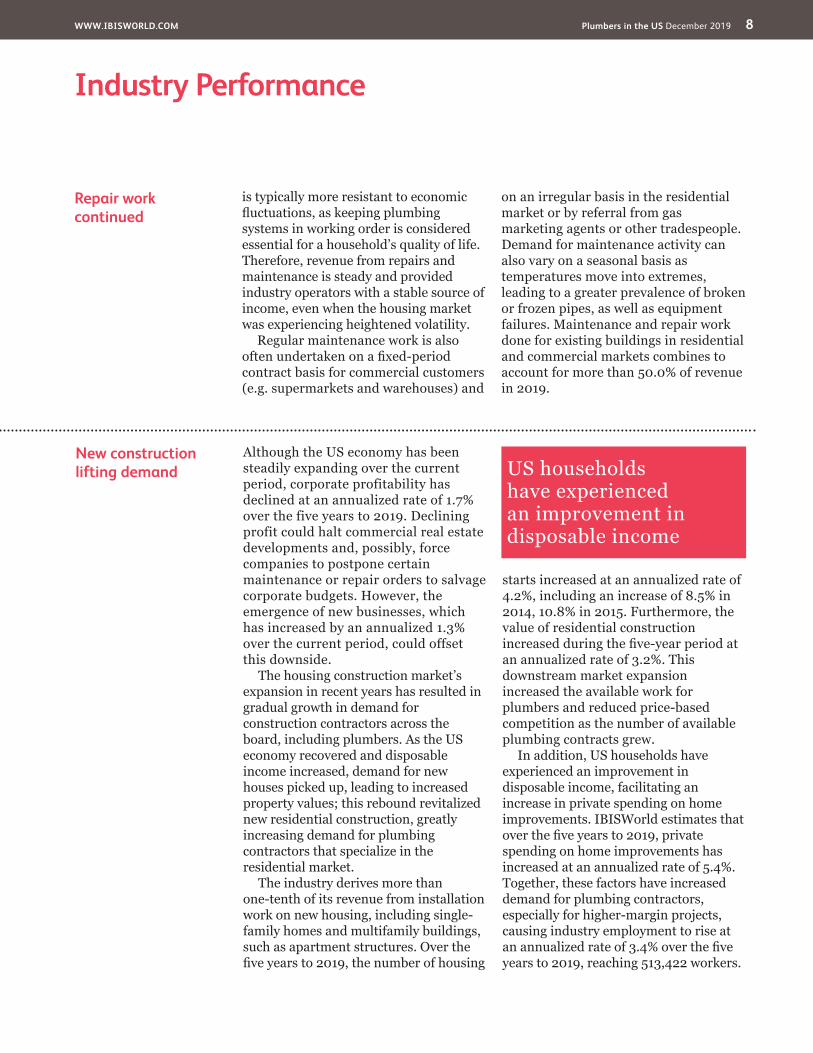
US households have experienced an improvement in disposable income
WWW.IBISWORLD.COM Plumbers in the US December 2019 9
Industry Performance
Industry structure and profitability
As a result of growth in downstream client markets raising demand for industry services, the number of industry operators is expected to grow at an annualized rate of 1.0% over the five years to 2019, reaching 117,803. The majority of industry operators are small companies that specialize in specific regions or markets. Therefore, the Plumbers industry relies heavily on skilled in-house employees to conduct installation, maintenance and repair services.
Strengthening economic conditions and an increase in demand for plumbing services over the five years to 2019 has led to a rise in the number of plumbing contractors and industry jobs. As US
construction markets improved, plumbing contractors have been able to increase prices. Fortunately, purchase costs for industry operators have decreased during the period. Thus, IBISWorld expects average industry profit (measured as earnings before interest and taxes) to reach 5.6% of revenue in 2019, an increase from 4.6% in 2014.
As US construction markets improved, plumbing contractors have been able to increase prices
WWW.IBISWORLD.COM Plumbers in the US December 2019 10
Industry Performance
Downstream demand The residential market is anticipated to grow at a slow pace throughout the coming five-year period, returning close to its prerecessionary levels. Over the five years to 2024, the value of residential construction is expected to increase at an annualized rate of 0.5%. Demand for new houses is expected to spill into the market over the next few years, fueling housing starts, which are projected to increase at an annualized rate of 1.5% during the same five-year period. A vibrant housing market is expected to particularly benefit small-scale plumbers that rely on subcontractor work for projects of relatively small size, such as home construction and residential repair work. In particular, a market that appears promising for industry maintenance and repair services is the multifamily residential market, consisting of condominiums and rental units, where contracts with property managers can also guarantee regular work.
Demand from the nonresidential sector is forecast to grow at a slightly slower rate than over the past five years, but will still demonstrate healthy growth.
Growing consumer spending, anchored by rising incomes and falling unemployment, will encourage many businesses to expand. As corporate profit continues to rise, growth in nonresidential construction is forecast to accelerate; as a result, the value of private nonresidential construction is projected to increase at an annualized rate of 3.0% over the five years to 2024. This is primarily the result of companies having a surplus of cash that can be used to reinvest in their business by expanding their operations. As businesses increase their capacity, they will increase their demand for plumbing installation services. In tandem, plumbers will also be called on to fill long-term maintenance contracts and renovate existing structures’ plumbing systems to reflect the increasingly ecofriendly priorities of the business world.
The residential market is anticipated to grow at a slow pace
Industry Outlook
Demand for plumbing services is projected to continue growing over the five years to 2024. IBISWorld expects the Plumbers industry to benefit from accelerating downstream building markets in both the residential and commercial sectors. Expanding investments into residential and nonresidential construction, along with higher per capita disposable income
enabling consumers to trade up to newer plumbing technologies (including ecofriendly and Energy Star-certified products), are projected to benefit industry operators. With such favorable demand conditions, IBISWorld anticipates that industry revenue will grow at an annualized rate of 1.1% to $118.8 billion over the five years to 2024.
WWW.IBISWORLD.COM Plumbers in the US December 2019 11
Industry Performance
Expanding profit margins
Over the five years to 2024, improving demand is expected to encourage new operators, including nonemployers and larger contractor companies, to enter the industry. Consequently, the number of plumbing service enterprises is expected to rise at an annualized rate of 1.3% to 125,799 over the five years to 2024. Similarly, the number of industry employees is expected to rise at an annualized rate of 1.4% to 551,483 workers over the five years to 2024. Much of this growth will be a result of independent contractors finding increasing work in the single-family housing market. The industry’s largest companies will benefit from the trend toward customization among commercial clients, which are expected to seek out efficient and
automated systems designed for their particular structures, which command higher installment fees. Additionally, across the industry’s spectrum, operators will be better able to raise prices due to favorable economic conditions among downstream clients. Subsequently, IBISWorld expects industry profit, measured as earnings before interest and taxes, will remain steady at 5.6% of revenue by 2024 due to more-favorable pricing.
Going green As a whole, the industry is forecast to expand through providing environmentally friendly plumbing services. An emphasis on energy and water management will lead to the replacement of older plumbing and heating systems. The Plumbing-Heating-Cooling Contractors Association, which has over 3,500 members, trains plumbers to install and modify plumbing appliances and piping to conserve water. Its initial objective is to encourage the installation of water-saving toilet systems
in new and existing premises. The American Rainwater Catchment Systems Association accredits plumbers and contractors that are able to design, build and install rainwater and graywater recycling systems for commercial and residential structures. As businesses and families become more concerned about water usage and conservation and as droughts remain an issue for some parts of the country, green services are forecast to become a more essential segment of the industry’s offerings.
Improving demand is expected to encourage new operators to enter the industry
WWW.IBISWORLD.COM Plumbers in the US December 2019 12
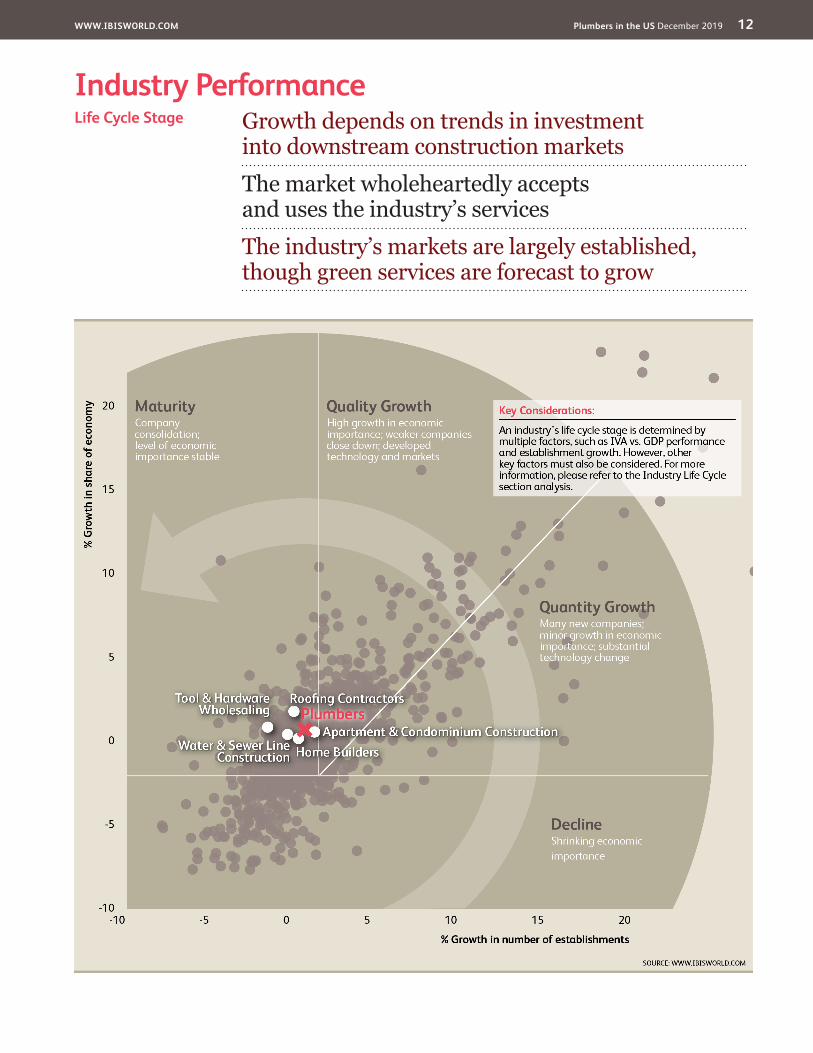
Industry PerformanceGrowth depends on trends in investment into downstream construction markets
The market wholeheartedly accepts and uses the industry’s services
The industry’s markets are largely established, though green services are forecast to grow
Life Cycle Stage

WWW.IBISWORLD.COM Plumbers in the US December 2019 13
Industry Performance
Industry Life Cycle The Plumbers industry is in the mature stage of its life cycle, with demand generally driven by movements in downstream new construction markets, as well as ongoing maintenance and repair activity. Industry value added, which measures the industry’s contribution to the overall economy, is expected to grow at an annualized rate of 2.9% over the 10 years to 2024. In contrast, US GDP is expected to grow at an annualized rate of 2.1% during the same period. A stronger contribution to the economy is typically indicative of a growing industry; however, this industry also has mature characteristics that outweigh those growth factors in the long term.
The Plumbers industry has complete market acceptance as all houses and buildings require plumbing services to operate effectively. Representing more than 3,500 plumbing contractors, the Plumbing-Heating-Cooling Contractors Association is the oldest trade association and was founded in 1883. This makes it one of the earliest formed trade associations within the United States, as well as illustrating the industry’s market
acceptance. In addition, the industry is characterized by high levels of local competition, in which several contractors or small businesses compete for projects in a narrow regional market. Though rapidly increasing demand due to rebounding construction markets is anticipated to bring strong revenue growth over the next five years, these opposing factors are expected to keep the industry in a mature phase for the near future.
Though this rate of value-added growth usually describes an industry in the growth phase of its life cycle, the Plumbers industry’s relatively minor technological advances characterize it as mature. In fact, plumbing work relies heavily on skilled manual labor rather than technological knowledge and there is little labor-saving equipment fundamentally changing the nature of the industry. An avenue of growth for the industry though lies in providing green plumbing services, such as rainwater catchment, solar heating technologies and water conservation systems; however, this development is not anticipated to fundamentally alter the industry.
This industry is Mature
WWW.IBISWORLD.COM Plumbers in the US December 2019 14
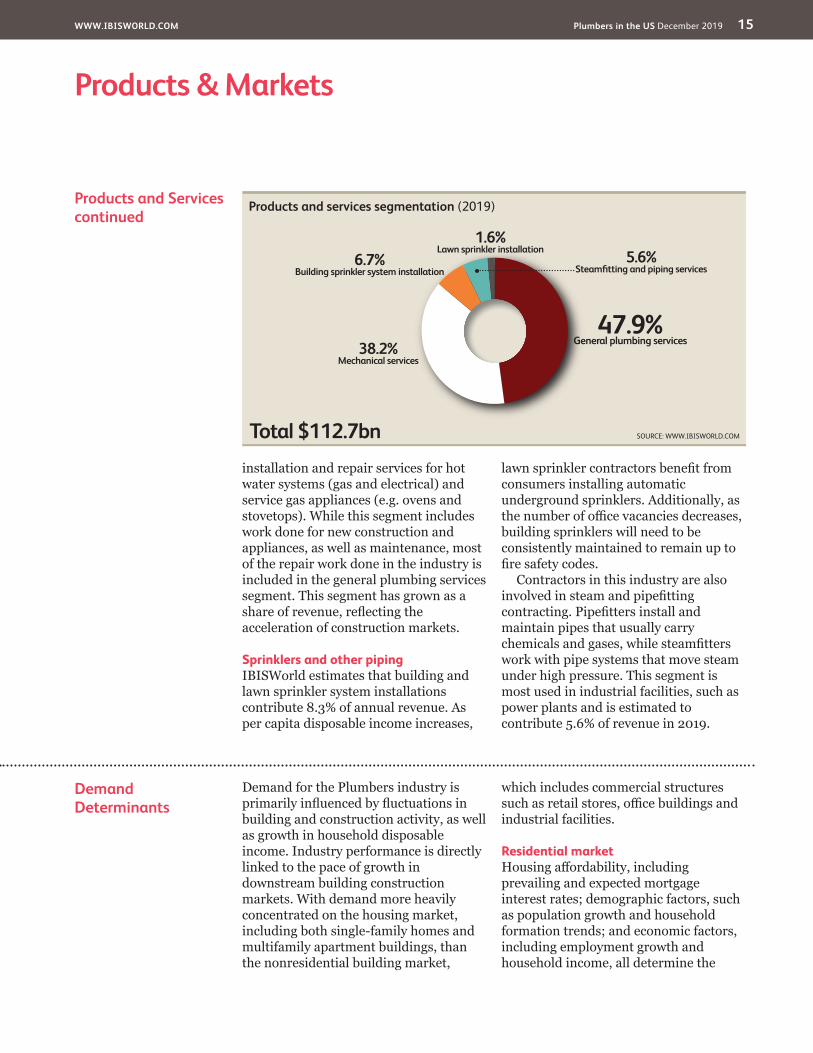
Products and Services General plumbing contractorsGeneral plumbing services contribute 47.9% of Plumbers industry revenue in 2019. These services include the installation, repair and maintenance of water distribution pipes and appliances, water heaters, garbage disposals, bathroom and kitchen sinks, water pipes and other plumbing. These services may also include sewer and drain cleaning and copper repiping. This product segment has grown as a share of revenue over the past five years because it largely includes essential repair services that cannot be delayed, even in an economic downturn. As services associated with new construction, such as connecting a building to main lines and installing appliances, declined, repair and
maintenance activities contributed a higher share of revenue.
Mechanical contractorsMechanical services contribute an estimated 38.2% of revenue in 2019. Mechanical contracting services consist primarily of the installation of mechanical and process piping and tubing. These include main lines that convey hot and cold water, steam, medical gas, fuels and other liquids and gases, as well as the installation of related equipment and fixtures that store, pump, regulate and measure the distribution of these substances. Industry contractors connect households, commercial and industrial buildings to gas mains, detect and repair burst pipes, provide
Products & MarketsSupply Chain | Products and Services | Demand Determinants Major Markets | International Trade | Business Locations
KEY BUYING INDUSTRIES
23611a Home Builders in the US This industry demands installation of plumbing fittings on housing construction projects.
23611b Apartment & Condominium Construction in the US This industry demands installation of plumbing on multifamily housing construction projects.
23621 Industrial Building Construction in the US This industry demands installation of plumbing fittings on newly constructed manufacturing and industrial buildings.
23622a Commercial Building Construction in the US This industry demands installation of plumbing fittings on newly constructed commercial buildings.
23622b Municipal Building Construction in the US This industry demands installation of plumbing fittings on newly constructed institutional and public buildings, principally hospitals and schools.
23721 Land Development in the US This industry demands installation of water and gas pipes and other plumbing infrastructure (sprinklers) on land being prepared for housing and non-residential developments.
KEY SELLING INDUSTRIES
23821 Electricians in the US This industry provides wiring services to plumbing contractors.
42371 Tool & Hardware Wholesaling in the US This industry supplies construction materials (adhesives, sealants and piping) and rudimentary tools.
42372 Plumbing & Heating Supplies Wholesaling in the US This industry supplies necessary plumbing, electrical, gas and oil appliances for installation and repair by plumbers.
Supply Chain
WWW.IBISWORLD.COM Plumbers in the US December 2019 15
Products & Markets
Demand Determinants
Demand for the Plumbers industry is primarily influenced by fluctuations in building and construction activity, as well as growth in household disposable income. Industry performance is directly linked to the pace of growth in downstream building construction markets. With demand more heavily concentrated on the housing market, including both single-family homes and multifamily apartment buildings, than the nonresidential building market,
which includes commercial structures such as retail stores, office buildings and industrial facilities.
Residential marketHousing affordability, including prevailing and expected mortgage interest rates; demographic factors, such as population growth and household formation trends; and economic factors, including employment growth and household income, all determine the
Products and Servicescontinued
installation and repair services for hot water systems (gas and electrical) and service gas appliances (e.g. ovens and stovetops). While this segment includes work done for new construction and appliances, as well as maintenance, most of the repair work done in the industry is included in the general plumbing services segment. This segment has grown as a share of revenue, reflecting the acceleration of construction markets.
Sprinklers and other pipingIBISWorld estimates that building and lawn sprinkler system installations contribute 8.3% of annual revenue. As per capita disposable income increases,
lawn sprinkler contractors benefit from consumers installing automatic underground sprinklers. Additionally, as the number of office vacancies decreases, building sprinklers will need to be consistently maintained to remain up to fire safety codes.
Contractors in this industry are also involved in steam and pipefitting contracting. Pipefitters install and maintain pipes that usually carry chemicals and gases, while steamfitters work with pipe systems that move steam under high pressure. This segment is most used in industrial facilities, such as power plants and is estimated to contribute 5.6% of revenue in 2019.
Products and services segmentation (2019)
Total $112.7bn
47.9%General plumbing services38.2%
Mechanical services
6.7%Building sprinkler system installation
5.6%Steamfitting and piping services
1.6%Lawn sprinkler installation
SOURCE: WWW.IBISWORLD.COM
WWW.IBISWORLD.COM Plumbers in the US December 2019 16
Products & Markets
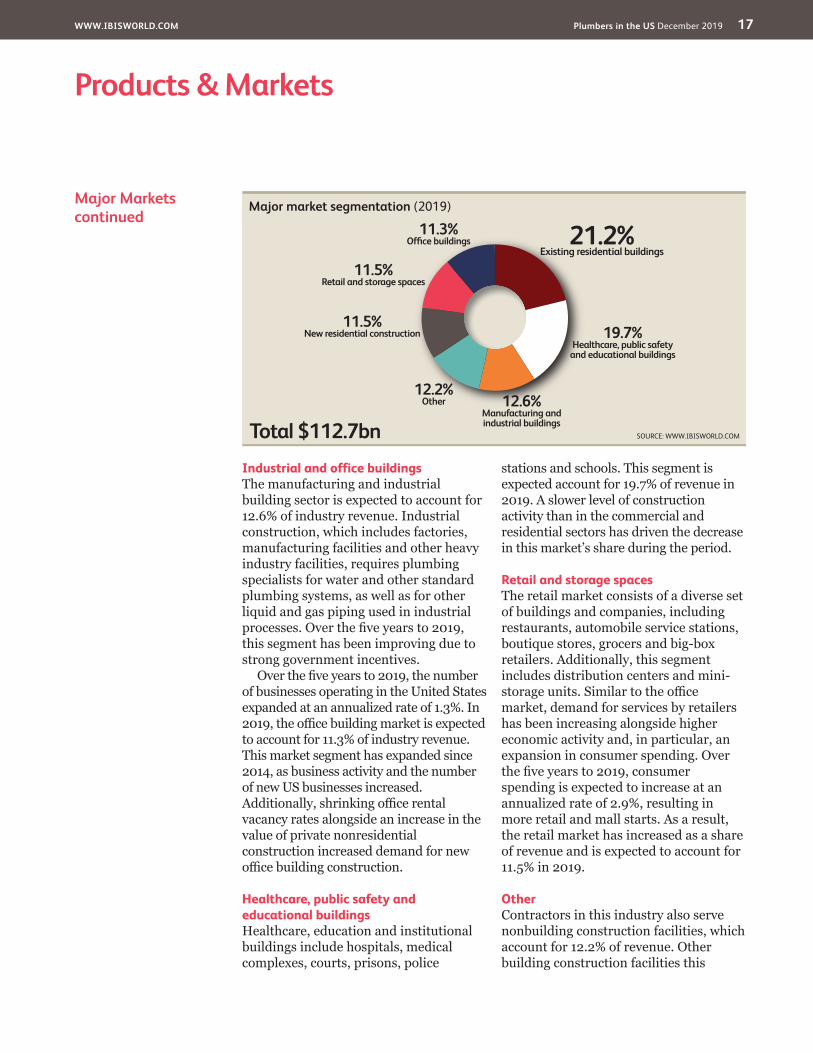
Major Markets Residential buildingsThe residential market includes work done for new construction (11.5% of revenue) and existing structures (21.2%), which typically involves repair and maintenance work or renovation of already-installed plumbing systems. The overall residential market spans both single-family homes (i.e. the housing market) and multifamily structures such as apartment buildings. Demand from the housing market for the Plumbers industry depends on consumers’ disposable incomes, which dictate the extent to which they can renovate or upgrade bathrooms and kitchens in existing homes and the number of housing starts, as new home construction requires specialized
plumbing contractors to install piping for utilities and appliances. The housing market’s rebound and widening over the past five years increased this market’s share of industry revenue over this period. Multifamily residential work has been a particularly important demand driver because building managers often establish long-term maintenance contracts with plumbers, which steadies operators’ work pipeline and stabilizes revenue. On the whole, work on new residential buildings has grown as a share of revenue in the past five years because plumbing maintenance work is essential to quality of life and customer service; therefore, home builders and businesses are not able to avoid such work.
Demand Determinantscontinued
need for new residential construction. As the number of new residential properties rises, the pool of potential customers for the industry grows. Although the market for repairs of existing plumbing fixtures is fairly stable because access to water and functioning plumbing is essential to consumers’ quality of life, employment and household income levels also determine the level of investment into renovation or upgrade work that requires the use of a plumber. When income levels are low, Americans tend to cut back on discretionary spending, including on home renovation projects. The rebound in new housing construction alongside the recovery in household spending on home improvements has significantly increased demand for plumbers.
Nonresidential marketIn the nonresidential building markets, the overall health of the business sector and the level of consumer spending directly determine the need for new offices, retail centers, warehouses and other buildings that require plumbing installations. Investment into healthcare,
education and other institutional buildings is largely driven by population growth and government spending. Corporate profit levels also influence the scope of spending on renovation plumbing activity.
Constant demandMaintenance activity or repair of existing properties across all markets generates about 60.0% of industry revenue and is often undertaken on a fixed-period contract basis for commercial customers (e.g. supermarkets and warehouses) and on an irregular basis in the residential market or by referral from gas marketing agents or others. Demand for maintenance activity varies on a seasonal basis because temperature shifts into extreme cold or heat typically lead to a greater number of burst or frozen pipes or other equipment failures. The emergence of long-term plumbing maintenance contracts has been a notable trend over the past decade and helped stabilize the industry revenue base against major fluctuations in building activity.
WWW.IBISWORLD.COM Plumbers in the US December 2019 17
Products & Markets
Major Marketscontinued
Industrial and office buildingsThe manufacturing and industrial building sector is expected to account for 12.6% of industry revenue. Industrial construction, which includes factories, manufacturing facilities and other heavy industry facilities, requires plumbing specialists for water and other standard plumbing systems, as well as for other liquid and gas piping used in industrial processes. Over the five years to 2019, this segment has been improving due to strong government incentives.
Over the five years to 2019, the number of businesses operating in the United States expanded at an annualized rate of 1.3%. In 2019, the office building market is expected to account for 11.3% of industry revenue. This market segment has expanded since 2014, as business activity and the number of new US businesses increased. Additionally, shrinking office rental vacancy rates alongside an increase in the value of private nonresidential construction increased demand for new office building construction.
Healthcare, public safety and educational buildingsHealthcare, education and institutional buildings include hospitals, medical complexes, courts, prisons, police
stations and schools. This segment is expected account for 19.7% of revenue in 2019. A slower level of construction activity than in the commercial and residential sectors has driven the decrease in this market’s share during the period.
Retail and storage spacesThe retail market consists of a diverse set of buildings and companies, including restaurants, automobile service stations, boutique stores, grocers and big-box retailers. Additionally, this segment includes distribution centers and mini-storage units. Similar to the office market, demand for services by retailers has been increasing alongside higher economic activity and, in particular, an expansion in consumer spending. Over the five years to 2019, consumer spending is expected to increase at an annualized rate of 2.9%, resulting in more retail and mall starts. As a result, the retail market has increased as a share of revenue and is expected to account for 11.5% in 2019.
OtherContractors in this industry also serve nonbuilding construction facilities, which account for 12.2% of revenue. Other building construction facilities this
Major market segmentation (2019)
Total $112.7bn
21.2%Existing residential buildings
11.5%Retail and storage spaces
19.7%Healthcare, public safety
and educational buildings
11.3%Office buildings
12.6%Manufacturing andindustrial buildings
12.2%Other
11.5%New residential construction
SOURCE: WWW.IBISWORLD.COM
WWW.IBISWORLD.COM Plumbers in the US December 2019 18
Products & Markets
International Trade The Plumbers industry is service-oriented and there is no international trade within this industry as goods are not passed from one country to another. The majority of industry participants are small or medium-sized operators, but there are some multinational companies that offer plumbing services
in a wide variety of markets, including industrial, municipal, multifamily and commercial. A small number of large operators provide industry-services across North America, primarily in Canada. For more information on international trends, see the Globalization section.
Major Marketscontinued
industry serves include religious buildings, social and recreational buildings, as well as hotels and motels.
WWW.IBISWORLD.COM Plumbers in the US December 2019 19
Products & Markets
Business Locations 2019
MO1.8
West
West
West
Rocky Mountains Plains
Southwest
Southeast
New England
VT0.3
MA2.9
RI0.4
NJ3.5
DE0.3
NH0.6
CT1.3
MD2.0
DC0.0
1
5
3
7
2
6
4
8 9
Additional States (as marked on map)
AZ2.0
CA9.9
NV0.8
OR1.2
WA2.0
MT0.6
NE0.8
MN1.8
IA1.1
OH3.0 VA
2.6
FL7.6
KS1.0
CO2.3
UT1.1
ID0.7
TX7.3
OK1.5
NC3.4
AK0.3
WY0.3
TN1.6
KY1.2
GA2.7
IL4.1
ME0.6
ND0.4
WI1.9 MI
2.6 PA3.9
WV0.4
SD0.4
NM0.7
AR1.0
MS0.7
AL1.4
SC1.6
LA1.4
HI0.4
IN1.9
NY6.9 5
67
8
321
4
9
SOURCE: WWW.IBISWORLD.COM
Mid- Atlantic
Establishments (%)
Less than 3% 3% to less than 10% 10% to less than 20% 20% or more
Great Lakes
WWW.IBISWORLD.COM Plumbers in the US December 2019 20
Products & Markets
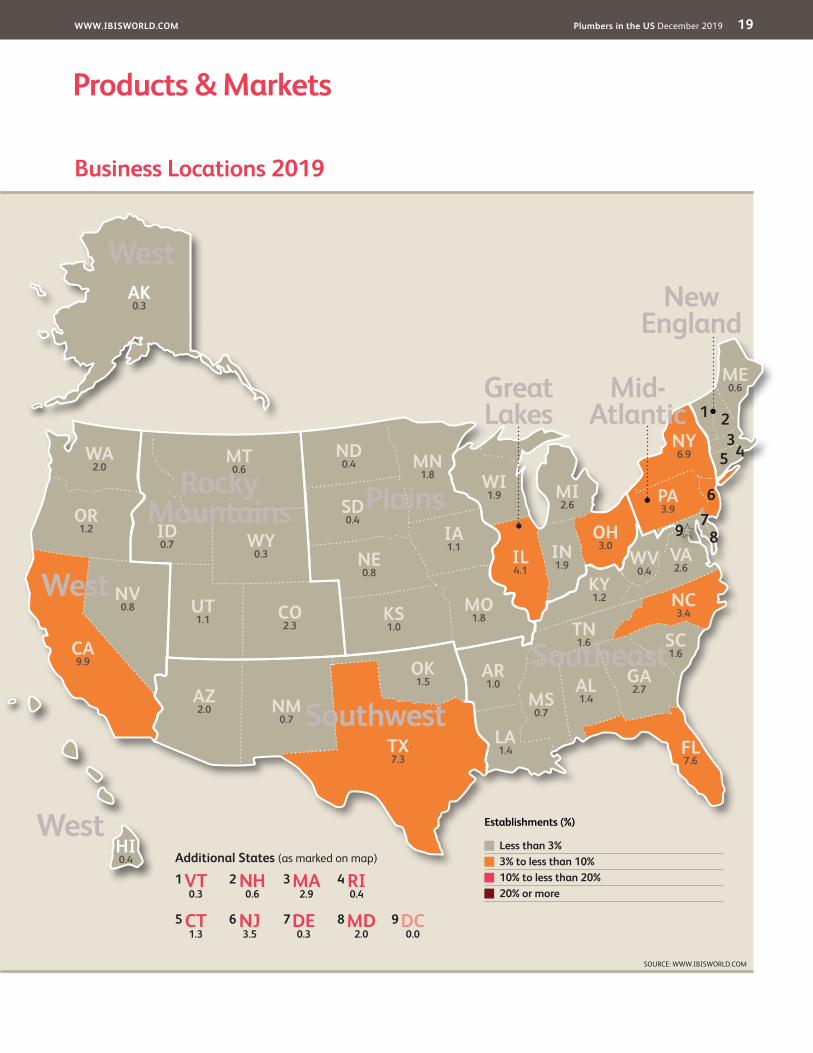
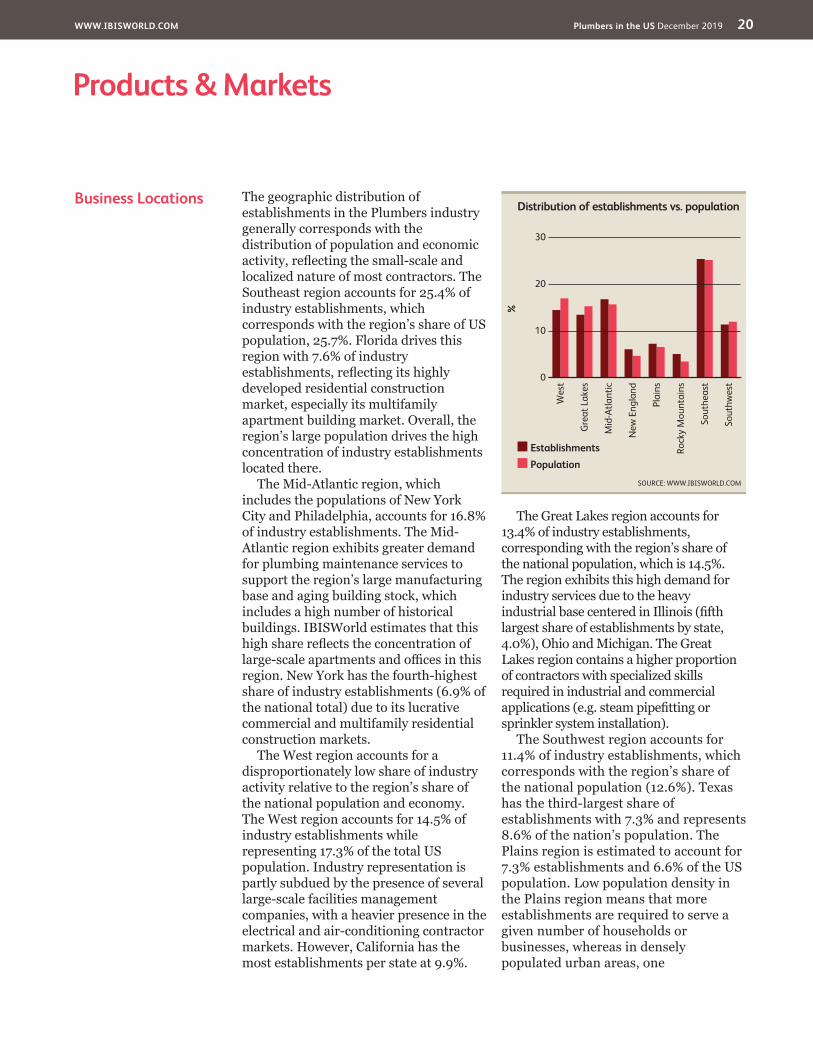
Business Locations The geographic distribution of establishments in the Plumbers industry generally corresponds with the distribution of population and economic activity, reflecting the small-scale and localized nature of most contractors. The Southeast region accounts for 25.4% of industry establishments, which corresponds with the region’s share of US population, 25.7%. Florida drives this region with 7.6% of industry establishments, reflecting its highly developed residential construction market, especially its multifamily apartment building market. Overall, the region’s large population drives the high concentration of industry establishments located there.
The Mid-Atlantic region, which includes the populations of New York City and Philadelphia, accounts for 16.8% of industry establishments. The Mid-Atlantic region exhibits greater demand for plumbing maintenance services to support the region’s large manufacturing base and aging building stock, which includes a high number of historical buildings. IBISWorld estimates that this high share reflects the concentration of large-scale apartments and offices in this region. New York has the fourth-highest share of industry establishments (6.9% of the national total) due to its lucrative commercial and multifamily residential construction markets.
The West region accounts for a disproportionately low share of industry activity relative to the region’s share of the national population and economy. The West region accounts for 14.5% of industry establishments while representing 17.3% of the total US population. Industry representation is partly subdued by the presence of several large-scale facilities management companies, with a heavier presence in the electrical and air-conditioning contractor markets. However, California has the most establishments per state at 9.9%.
The Great Lakes region accounts for 13.4% of industry establishments, corresponding with the region’s share of the national population, which is 14.5%. The region exhibits this high demand for industry services due to the heavy industrial base centered in Illinois (fifth largest share of establishments by state, 4.0%), Ohio and Michigan. The Great Lakes region contains a higher proportion of contractors with specialized skills required in industrial and commercial applications (e.g. steam pipefitting or sprinkler system installation).
The Southwest region accounts for 11.4% of industry establishments, which corresponds with the region’s share of the national population (12.6%). Texas has the third-largest share of establishments with 7.3% and represents 8.6% of the nation’s population. The Plains region is estimated to account for 7.3% establishments and 6.6% of the US population. Low population density in the Plains region means that more establishments are required to serve a given number of households or businesses, whereas in densely populated urban areas, one
%
30
0
10
20
Sout
hwes
t
Wes
t
Gre
at L
akes
Mid
-Atla
ntic
New
Eng
land
Plai
ns
Rock
y M
ount
ains
Sout
heas
t
EstablishmentsPopulation
Distribution of establishments vs. population
SOURCE: WWW.IBISWORLD.COM

WWW.IBISWORLD.COM Plumbers in the US December 2019 21
Products & Markets
Business Locationscontinued
establishment can serve more consumers in a smaller locale.
The New England and Rocky Mountains regions’ share of industry establishments (6.1% and 5.0%,
respectively) exceeds their combined share of the US population. Harsh winters common to these regions mean consistent piping repair work for industry operators located there.
WWW.IBISWORLD.COM Plumbers in the US December 2019 22
Cost Structure Benchmarks
The Plumbers industry is service-oriented and includes operators that install, maintain and repair pipes. Similar to most contractor industries, it requires a low level of capital investment and most costs pertain to labor. A majority of industry operators are nonemployers, although larger companies are able to take advantage of economies of scale, operate across different regions and generally earn higher profit than smaller players.
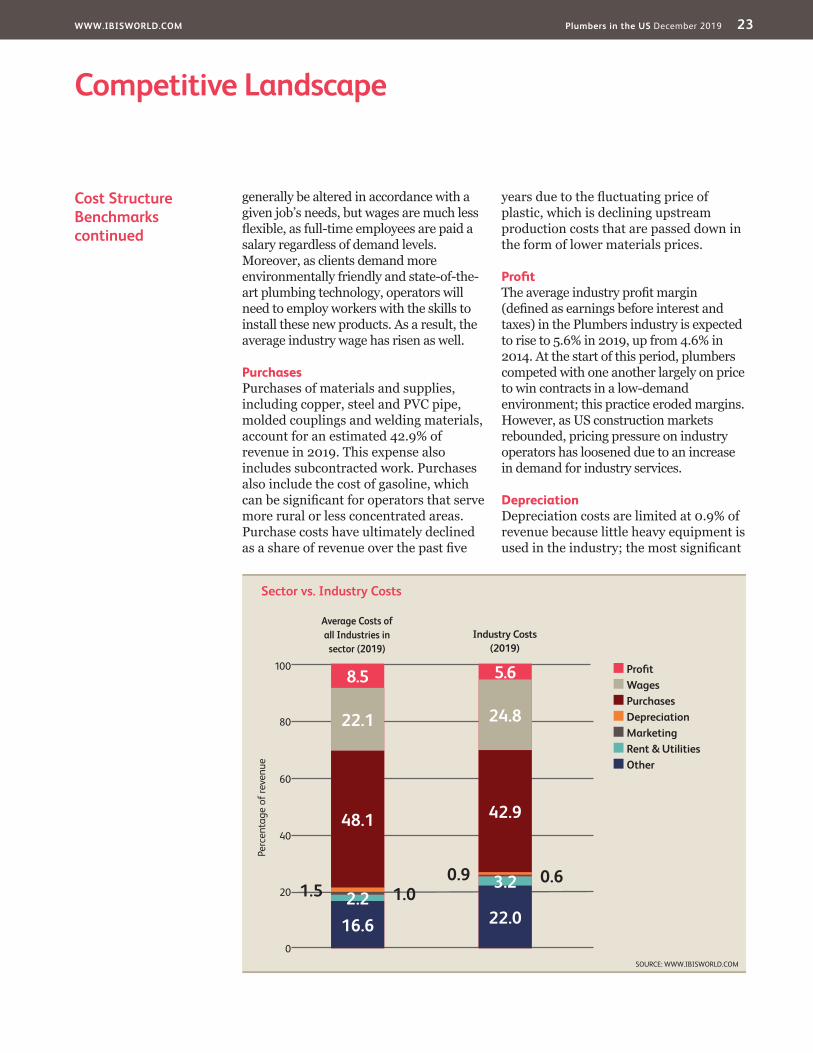
WagesThe industry is highly labor-intensive; plumbing is primarily a learned skill that cannot be replaced by automated machinery or technology. IBISWorld estimates that total wages are expected to account for 24.8% of industry revenue in 2019, up from 22.6% in 2014. Like most of the service sector, the industry relies most heavily on the skills and knowledge of its technicians. Purchase costs can
Key Success Factors Having a good reputationContractors need to establish a reputation for quality, timeliness, price and fiscal accountability within their target markets (regional or market segments) as a significant number of new contracts are secured through referrals.
Holding on to maintenance contractsSuccess in the industry requires the ability to contest and retain ongoing maintenance contracts, providing a stable revenue base.
Ability to compete on tenderOperators must have the capacity to contest and hold ongoing maintenance
contracts to generate a stable revenue base. Larger operators must also be able to compete for contracts in lucrative commercial building markets.
Ability to vary services to suit different needsThe capacity to supply total facilities management enhances the prospects of success in this industry.
Ability to accommodate environmental requirementsIndustry operators must have the capacity to adapt to market demand for environmentally friendly construction techniques that ensure water and energy efficiency.
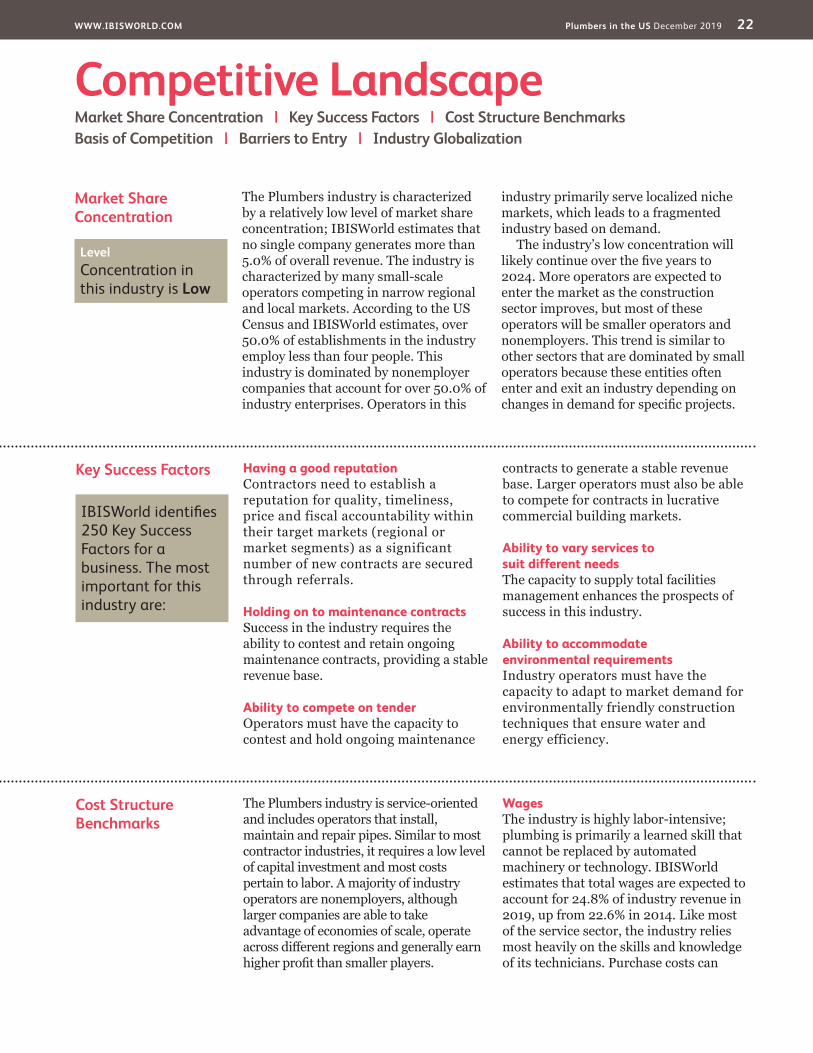
Market Share Concentration
The Plumbers industry is characterized by a relatively low level of market share concentration; IBISWorld estimates that no single company generates more than 5.0% of overall revenue. The industry is characterized by many small-scale operators competing in narrow regional and local markets. According to the US Census and IBISWorld estimates, over 50.0% of establishments in the industry employ less than four people. This industry is dominated by nonemployer companies that account for over 50.0% of industry enterprises. Operators in this
industry primarily serve localized niche markets, which leads to a fragmented industry based on demand.
The industry’s low concentration will likely continue over the five years to 2024. More operators are expected to enter the market as the construction sector improves, but most of these operators will be smaller operators and nonemployers. This trend is similar to other sectors that are dominated by small operators because these entities often enter and exit an industry depending on changes in demand for specific projects.
Competitive LandscapeMarket Share Concentration | Key Success Factors | Cost Structure Benchmarks Basis of Competition | Barriers to Entry | Industry Globalization
Level Concentration in this industry is Low
IBISWorld identifies 250 Key Success Factors for a business. The most important for this industry are:
WWW.IBISWORLD.COM Plumbers in the US December 2019 23
Competitive Landscape
Cost Structure Benchmarkscontinued
generally be altered in accordance with a given job’s needs, but wages are much less flexible, as full-time employees are paid a salary regardless of demand levels. Moreover, as clients demand more environmentally friendly and state-of-the-art plumbing technology, operators will need to employ workers with the skills to install these new products. As a result, the average industry wage has risen as well.
PurchasesPurchases of materials and supplies, including copper, steel and PVC pipe, molded couplings and welding materials, account for an estimated 42.9% of revenue in 2019. This expense also includes subcontracted work. Purchases also include the cost of gasoline, which can be significant for operators that serve more rural or less concentrated areas. Purchase costs have ultimately declined as a share of revenue over the past five
years due to the fluctuating price of plastic, which is declining upstream production costs that are passed down in the form of lower materials prices.
ProfitThe average industry profit margin (defined as earnings before interest and taxes) in the Plumbers industry is expected to rise to 5.6% in 2019, up from 4.6% in 2014. At the start of this period, plumbers competed with one another largely on price to win contracts in a low-demand environment; this practice eroded margins. However, as US construction markets rebounded, pricing pressure on industry operators has loosened due to an increase in demand for industry services.
DepreciationDepreciation costs are limited at 0.9% of revenue because little heavy equipment is used in the industry; the most significant
Sector vs. Industry Costs
n Profi tn Wagesn Purchasesn Depreciationn Marketingn Rent & Utilitiesn Other
Average Costs of all Industries in sector (2019)
Industry Costs (2019)
0
20
40
60
Perc
enta
ge o
f rev
enue
80
100
SOURCE: WWW.IBISWORLD.COM
8.5 5.6
22.0
3.2 0.60.9
42.9
24.8
16.62.2 1.01.5
48.1
22.1
WWW.IBISWORLD.COM Plumbers in the US December 2019 24
Competitive Landscape
Basis of Competition The basis for competition in the Plumbers industry varies depending on the type of service provided and the scale of a company’s operation. Overall, the industry is characterized by a high degree of competition among many small-scale contractors that compete for a share of relatively narrow regional markets. Competition has been heightened by the emergence of large-scale facilities management companies that offer plumbing, heating, ventilation and air conditioning, mechanical and electrical services. These operators have the capacity to compete on a national scale.
The principal basis for competition in this industry is an established reputation for delivering satisfactory service. Contractors often maintain pricing structures at close to the market average and product differentiation is based on quality of workmanship, timeliness, cleanliness and building a rapport with customers. Such relationships enable companies to win long-term maintenance contracts for larger commercial or residential clients, which can stabilize a plumbing contractor’s income.
Large players in this industry market services using a variety of methods, including professional tendering for projects, developing relationships with equipment suppliers and project developers, establishing a reputation and capacity to undertake large-scale or technologically advanced contracts and general advertising in local newspapers and on the internet. Word of mouth referrals are often an important marketing method for local contractors. Similarly, networking with consultants, developers and operators in other trades can prove vital in providing intelligence about upcoming contracts.
An emerging area of product differentiation is on the basis of environmental awareness through the Leadership in Energy and Environmental Design accreditation initiative developed by the US Green Building Council. This and similar initiatives seek to train industry operators in skills and knowledge of environmental considerations for construction, most notably the use of water efficiency techniques and products.
Cost Structure Benchmarkscontinued
depreciable asset most plumbers acquire is a van or truck.
MarketingMarketing costs are generally low in the industry (estimated at 0.6% of revenue) since most work is gained through recommendations and relationships with general contractors.
RentRent costs are low for the industry (accounting for 1.5% of revenue) because the majority of activity takes place at the worksite and plumbers typically require only small office and storage spaces.
UtilitiesUtility costs are relatively high in this industry, accounting for 1.7% of industry revenue. Utility costs can be significant for industry operators, depending on the price of energy inputs they use for their services.
OtherOther costs include licensing fees, legal bills, equipment repair and maintenance, insurance and general administrative costs, which combine to account for 22.0% of revenue. As minor portions of revenue, these cost segments have remained steady over the past five years.
Level & Trend Competition in this industry is High and the trend is Increasing
WWW.IBISWORLD.COM Plumbers in the US December 2019 25
Competitive Landscape
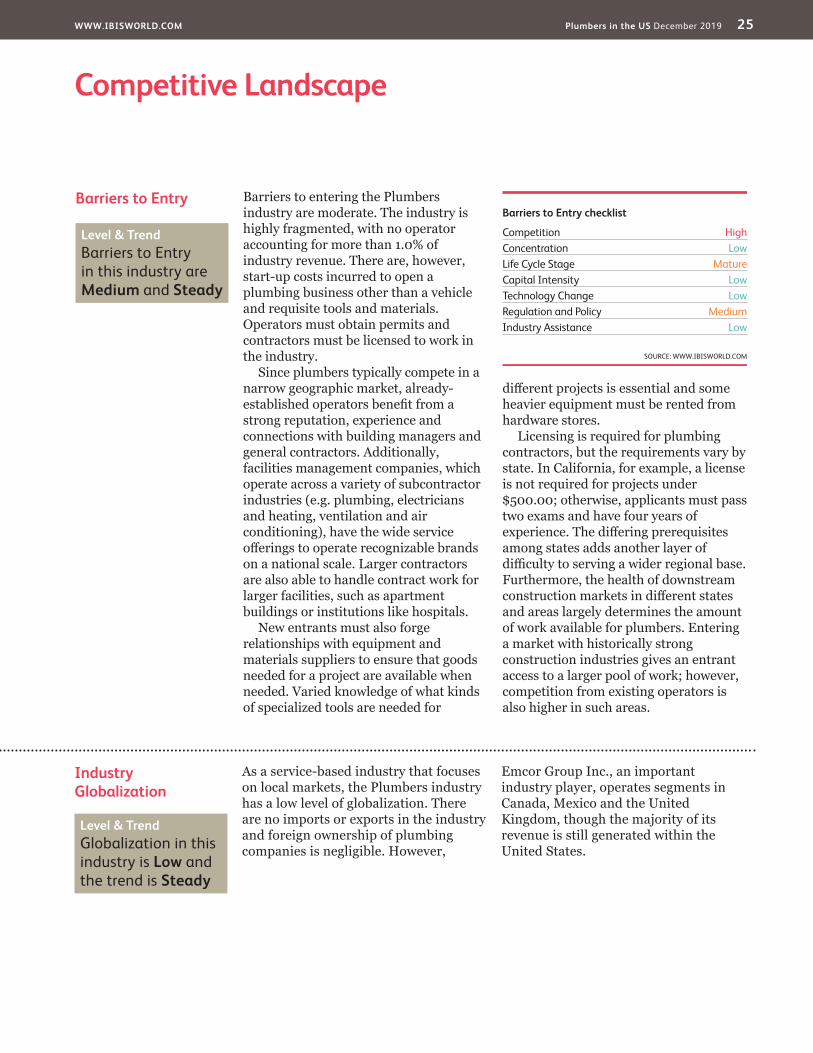
Barriers to Entry Barriers to entering the Plumbers industry are moderate. The industry is highly fragmented, with no operator accounting for more than 1.0% of industry revenue. There are, however, start-up costs incurred to open a plumbing business other than a vehicle and requisite tools and materials. Operators must obtain permits and contractors must be licensed to work in the industry.
Since plumbers typically compete in a narrow geographic market, already-established operators benefit from a strong reputation, experience and connections with building managers and general contractors. Additionally, facilities management companies, which operate across a variety of subcontractor industries (e.g. plumbing, electricians and heating, ventilation and air conditioning), have the wide service offerings to operate recognizable brands on a national scale. Larger contractors are also able to handle contract work for larger facilities, such as apartment buildings or institutions like hospitals.
New entrants must also forge relationships with equipment and materials suppliers to ensure that goods needed for a project are available when needed. Varied knowledge of what kinds of specialized tools are needed for
different projects is essential and some heavier equipment must be rented from hardware stores.
Licensing is required for plumbing contractors, but the requirements vary by state. In California, for example, a license is not required for projects under $500.00; otherwise, applicants must pass two exams and have four years of experience. The differing prerequisites among states adds another layer of difficulty to serving a wider regional base. Furthermore, the health of downstream construction markets in different states and areas largely determines the amount of work available for plumbers. Entering a market with historically strong construction industries gives an entrant access to a larger pool of work; however, competition from existing operators is also higher in such areas.
Barriers to Entry checklist
Competition HighConcentration LowLife Cycle Stage MatureCapital Intensity LowTechnology Change LowRegulation and Policy MediumIndustry Assistance Low
SOURCE: WWW.IBISWORLD.COM
Level & Trend Barriers to Entry in this industry are Medium and Steady
Industry Globalization
As a service-based industry that focuses on local markets, the Plumbers industry has a low level of globalization. There are no imports or exports in the industry and foreign ownership of plumbing companies is negligible. However,
Emcor Group Inc., an important industry player, operates segments in Canada, Mexico and the United Kingdom, though the majority of its revenue is still generated within the United States.
Level & Trend Globalization in this industry is Low and the trend is Steady
WWW.IBISWORLD.COM Plumbers in the US December 2019 26
Other Company Performance
Emcor Group Inc. (Emcor) provides mechanical and electrical construction, energy infrastructure and end-to-end facilities services to biotech, healthcare, entertainment, hospitality, government, education, commercial, transportation, technology, financial services and manufacturing and industrial clients. Over the past five years, Emcor operated in the United States, Canada and the United Kingdom (though UK construction operations ceased in 2014), as well as via joint ventures in the United Arab Emirates. It is headquartered in Norwalk, CT, employing about 33,000 people worldwide. The company generates about 96.0% of its revenue in the United States and reported overall revenue of $8.1 billion in 2018.
Emcor’s revenue for plumbing is reported in the company’s US mechanical construction and facilities services segment, which also includes heating, ventilation, air-conditioning and fire protection services. The US mechanical construction and facilities services segment is Emcor’s largest segment and contributes 35.0% of the company’s total revenue. The company also participates in the Plumbers industry through its Norristown, PA-based subsidiary USM Services Holdings Inc. (USM). USM is a provider of facilities maintenance services, including interior and exterior services and electrical, mechanical and plumbing services. IBISWorld estimates Emcor’s revenue from plumbing services to total $686.8 million in 2019.
Other Companies The Plumbers industry is highly fragmented, composed of many small-scale companies operating in geographically limited markets. The majority of establishments in this industry have fewer than 10 employees and are nonemployers (i.e. sole proprietors or owner-operators). Many plumbers are subcontracted by prime contractors in construction markets for specialty plumbing work on projects. Consequently, the industry has no true major players because these operators do not generate enough income from industry-specific tasks to account for more than 5.0% of total industry revenue. However, some large-scale facilities management companies operate in the industry through
plumbing or mechanical work segments and have the resources to generate more industry revenue.
Most manufacturers of plumbing equipment rely on industry operators to install and service these devices, but some manufacturing companies, such as Lennox International, also operate service divisions. Similarly, the industry contends with general contractors that specialize in home building (IBISWorld report 23611a), apartment and condominium construction (23611b), commercial construction (23622a) and municipal construction (23622b). Generally, these industries use plumbers and mechanical contractors to install piping and plumbing equipment but occasionally use in-house workers to conduct such services.
Major CompaniesThere are no Major Players in this industry | Other Companies
Emcor Group Inc. Market Share: 0.6%
WWW.IBISWORLD.COM Plumbers in the US December 2019 27
Major Companies
Other Company Performance
Tutor Perini Corporation (Tutor Perini) is a leading construction company founded in 1894, which offers general contracting, construction management and various other building services. The company, which employs more than 8,200 people, is broken down into three operating segments: civil; building; and specialty services. The specialty services segment is further broken down into six operating units, three of which include industry-relevant plumbing services. The company is also the largest specialty contractor provider in the New York region, but its contractors also can be found all over the United States. Most of the company’s revenue comes from government contracts. IBISWorld estimates that in 2019, Tutor Perini’s industry-specific revenue from plumbing contractors will decline to reach $430.1 million in
revenue in 2019, down from $503 million in 2018.
The decline is largely attributed to an impairment charge of $379.9 million during the first half of 2019, due to write downs on its reporting units, where each unit’s carrying value fell below a predetermined fair market value. This decline was exacerbated by a credit downgrade by Moody’s Investor Services in May, 2019, from Ba1 (substantial credit risk) to B1 (high credit risk), pushing Tutor Perini father down the speculative grade credit scale. According to Moody’s, the downgrade was a result of frequently inconsistent free cash flow generation and the company’s inability to collect on major receivable accounts. This downgrade may deter investors from Tutor Perini, leaving access to working capital all the more challenging.
Tutor Perini Corp Market Share: 0.4%
Other Company Performance
Founded in 1970 and headquartered in Cincinnati, Chemed Corporation is a publicly traded company that operates Vitas Healthcare Corporation, a provider of end-of-life care and Roto-Rooter Plumbing and Water Cleanup Service (Roto-Rooter), one of the largest providers of plumbing and drain-cleaning services in North America. The company employs an estimated 15,000 people across its segments. Roto-Rooter was founded in 1935 and was sold to Chemed Corporation in 1980. Roto-Rooter offers plumbing and drain-cleaning services for residential and commercial customers through 110 company-owned branches and independent contractors and about 500 franchisees. Master
franchise operations have been established in Japan, the Philippines, Mexico, the United Kingdom, Hong Kong and Indonesia. In 2018, Chemed Corporation’s Roto-Rooter segment reached $585.1 million.
The plumbing company is benefitting from healthier downstream construction markets; as this upward trend in residential and nonresidential markets is expected to continue over the next five years. Further, the company aims to continue expanding its network of franchises into unpenetrated regional markets across the United States. As a result of healthier end markets and expansion, IBISWorld expects the company’s industry-specific segment to reach $639.6 million in 2019.
Roto-Rooter Plumbing and Water Cleanup Service Market Share: 0.6%
WWW.IBISWORLD.COM Plumbers in the US December 2019 28
Major Companies
Other Compnay Performance
Comfort Systems USA Inc. (Comfort Systems) went public in 1997 and is a leading plumbing and mechanical company employing about 9,900 people. The publicly listed company operates 94 locations across 85 cities in the United States. In 2018, the company achieved $2.2 billion in total company revenue. Within its plumbing segment, installation services accounted for 38.0% of revenue, while 62.0% of the segment’s revenue can be attributable to maintenance, repair and replacement services. Over the past
five years, Comfort Systems has steadily increased its market share through strategic acquisitions. In April 2014, Comfort Systems acquired Dyna Ten Corporation, a leading mechanical contractor operating in Texas and in February 2016, the company acquired companies from ShoffnerKalthoff MES Inc. that operate in the Southeast and Mid-Atlantic regions of the country. IBISWorld anticipates that in 2019, the company will generate $389.3 million in plumbing-related revenue.
Comfort Systems USA Inc. Market Share: 0.3%
WWW.IBISWORLD.COM Plumbers in the US December 2019 29
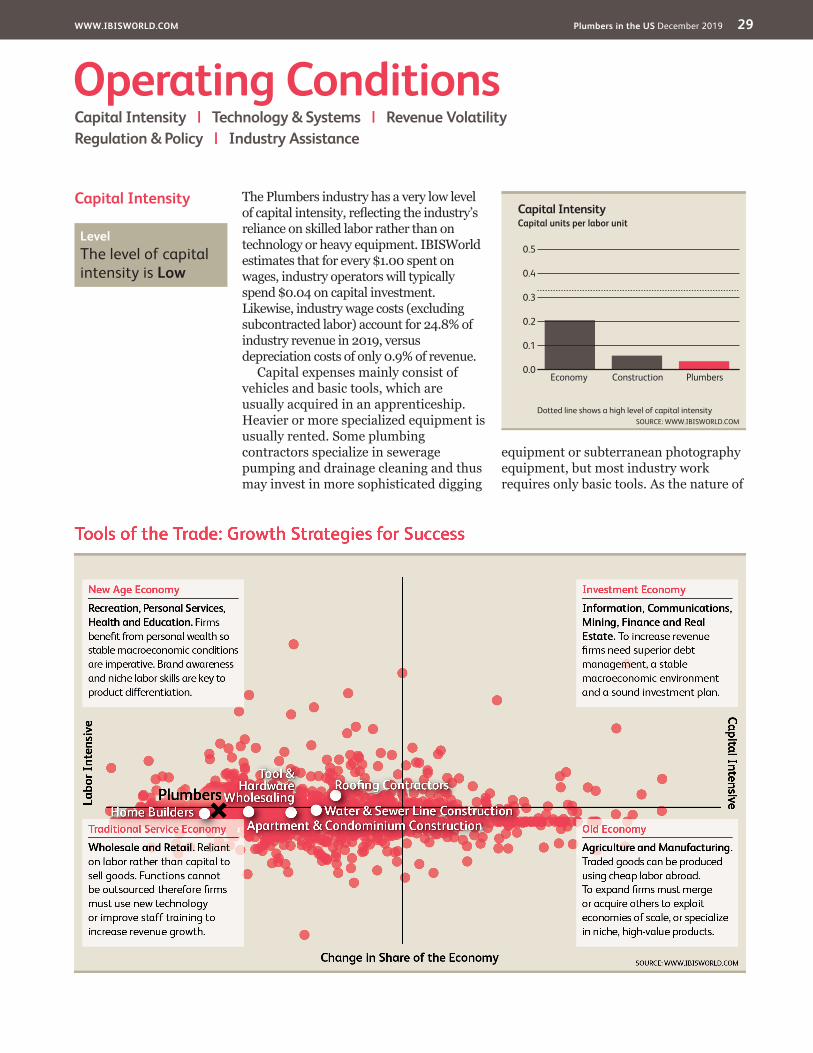
Capital Intensity The Plumbers industry has a very low level of capital intensity, reflecting the industry’s reliance on skilled labor rather than on technology or heavy equipment. IBISWorld estimates that for every $1.00 spent on wages, industry operators will typically spend $0.04 on capital investment. Likewise, industry wage costs (excluding subcontracted labor) account for 24.8% of industry revenue in 2019, versus depreciation costs of only 0.9% of revenue.
Capital expenses mainly consist of vehicles and basic tools, which are usually acquired in an apprenticeship. Heavier or more specialized equipment is usually rented. Some plumbing contractors specialize in sewerage pumping and drainage cleaning and thus may invest in more sophisticated digging
equipment or subterranean photography equipment, but most industry work requires only basic tools. As the nature of
Operating ConditionsCapital Intensity | Technology & Systems | Revenue VolatilityRegulation & Policy | Industry Assistance
Capital Intensity
0.5
0.0
0.1
0.2
0.3
0.4
SOURCE: WWW.IBISWORLD.COMDotted line shows a high level of capital intensity
Capital units per labor unit
PlumbersConstructionEconomy
Level The level of capital intensity is Low
WWW.IBISWORLD.COM Plumbers in the US December 2019 30
Operating Conditions
Revenue Volatility The Plumbers industry has been characterized by a low level of revenue volatility over the five years to 2019. In this time, revenue has grown by as much as 3.4% in 2014 (due to a significant boost in the value of private nonresidential construction) and only fell 0.1% in 2019 (as mortgage rates and home improvement spending worsened).
Plumbers and mechanical contractors provide services for a variety of markets and industries, as nearly every building uses some type of piping or indoor plumbing system. Subsequently, the
industry is affected by the cyclical fluctuations of overall US construction markets. However, volatility is typically kept in check by long-term maintenance contracts for large facilities and overall demand for pipe and drain repair, which consumers and businesses are usually unable to delay. Additionally, an expansion across all US construction markets over the five years to 2024 is expected to provide a stable source of demand for industry services, thereby keeping revenue volatility low.
Technology and Systems
The Plumbers industry has a low level of technological change. In 2019, traditional materials for constructing drainage, sewerage and guttering, such as ceramic, steel or copper pipes, will continue to be replaced by more flexible and economical materials such as concrete, PVC plastic and aluminum. This shift, though, is nearing the end of its cycle. Plumbing work relies heavily on skilled manual labor rather than technological knowledge and there is little laborsaving equipment fundamentally changing the nature of the industry. Some new technology is enabling plumbers to more accurately determine the cause of a clogged pipe or other issue; for example, plumbing inspection cameras that are attached to flexible cables use infrared light to detect the exact composition and location of obstructions in pipes. Additionally, administration and marketing technology, such as online
referral and booking services, is becoming more common in the industry.
Service differentiation on the basis of environmental awareness is a growing, though still minor, form of competition in the industry. The trend toward water conservation, in particular, is rapidly becoming a leading driver in the evolution of plumbing materials, pumps and mechanical technology. Rainwater preservation systems are becoming a key area of growth for niche plumbing operators that service the nonresidential market. Such systems capture and reuse rainwater for non-potable uses, such as flushing toilets and recycle graywater (water left over from laundry, dishwashing or bathing) for use as landscape irrigation or other non-potable uses. In fact, the American Rainwater Catchment Systems Association provides accreditation to plumbing companies that are able to design and install such systems.
Capital Intensitycontinued
industry work remains focused on employees’ skills and knowledge, capital intensity is forecast to remain very low over the five years to 2024.
Level The level of technology change is Low
Level The level of volatility is Low

WWW.IBISWORLD.COM Plumbers in the US December 2019 31
Operating Conditions
Regulation and Policy Contractors in the Plumbing industry are subject to various federal, state and local laws and regulations. Although there are no uniform national licensing requirements, most states and communities require plumbers to be licensed. Licensing typically requires that operators have two to five years of experience and pass an examination that tests their knowledge of the trade and local plumbing codes. In many cases, industry-based apprenticeship training is mandatory to obtain qualifications. State and local governments actively regulate this industry, as plumbing activities can directly affect public health. Improper plumbing can contaminate drinking water or lead to the escape of toxic gases into an indoor environment.
Industry operators must also comply with local zoning ordinances, laws and regulations relating to consumer protection and laws and regulations relating to worker safety and protection of human health. Failure to comply with the applicable regulations could result in substantial fines or the revocation of operating permits. In addition, many state regulations require that at least one employee of the business be a licensed
master plumber. Local regulations also determine the number and level of license holders that must be present on a construction site during the installation of plumbing and mechanical systems. Some jurisdictions require contracting companies to obtain a building permit for each plumbing or mechanical project.
Standards and regulationContractors are also subject to laws and regulations governing the remediation of contaminated soil and groundwater. These regulations are administered by the US Environmental Protection Agency and various state and local governmental agencies. The federal government’s Comprehensive Environmental Response, Compensation and Liability Act (CERCLA), widely known as Superfund, can impose strict liabilities on past and present owners or operators of facilities and transportation that release hazardous substances. Many states have adopted statutes that are often stricter than CERCLA. Therefore, the technical requirements of environmental legislation are complex and stringent, which adds to the compliance costs for contractors.
Revenue Volatilitycontinued
Level & Trend The level of Regulation is Medium and the trend is Steady
WWW.IBISWORLD.COM Plumbers in the US December 2019 32
Operating Conditions
Industry Assistance There is no formal protection for local contractors against foreign competition, as tariff protection does not apply to service-based industries. However, the Plumbers industry is protected by the stringent qualifications and licensing prerequisites needed to operate in each individual state. These requirements create a barrier to entry for companies attempting to enter the industry. In addition, the federal government along with municipalities provide indirect industry assistance through government contracts.
Several industry associations also lend assistance to plumbing contractors by advocating on behalf of their interests. The Plumbing-Heating-Cooling Contractors Association, for example, established the
framework for the industry’s first apprenticeship system. It also champions the cause of safe, adequate sanitation to state legislatures; encourages the invention of better plumbing appliances and fixtures; and spearheads education programs to keep pace with technological change. In addition, the International Association of Plumbing and Mechanical Officials sets requirements for the installation and maintenance of industry systems. The American Rainwater Catchment Systems Association accredits plumbers and plumbing companies able to design and install rainwater and graywater recycling systems. The group also offers resources for consumers and businesses on the benefits of installing green plumbing systems.
Regulation and Policycontinued
Installation and maintenance services are also subject to a wide range of industry-based standards approved by the American National Standards Institute. Moreover, the International Association of Plumbing and Mechanical
Officials produces and disseminates the Uniform Plumbing Code, which covers plumbing requirements and installation standards for water piping, indirect waste systems, gas piping, DVW systems and water heaters.
Level & Trend The level of Industry Assistance is Low and the trend is Steady
WWW.IBISWORLD.COM Plumbers in the US December 2019 33
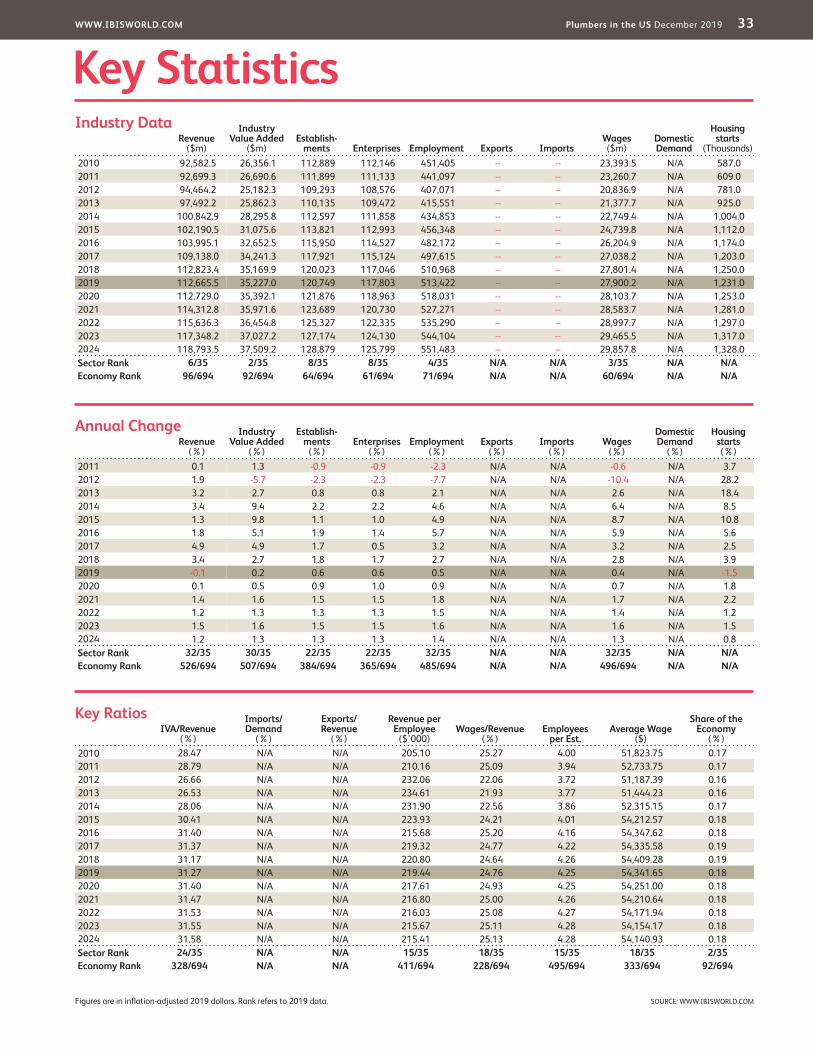
Key StatisticsRevenue
($m)
Industry Value Added
($m)Establish-
ments Enterprises Employment Exports ImportsWages ($m)
Domestic Demand
Housing starts
(Thousands)2010 92,582.5 26,356.1 112,889 112,146 451,405 -- -- 23,393.5 N/A 587.02011 92,699.3 26,690.6 111,899 111,133 441,097 -- -- 23,260.7 N/A 609.02012 94,464.2 25,182.3 109,293 108,576 407,071 -- -- 20,836.9 N/A 781.02013 97,492.2 25,862.3 110,135 109,472 415,551 -- -- 21,377.7 N/A 925.02014 100,842.9 28,295.8 112,597 111,858 434,853 -- -- 22,749.4 N/A 1,004.02015 102,190.5 31,075.6 113,821 112,993 456,348 -- -- 24,739.8 N/A 1,112.02016 103,995.1 32,652.5 115,950 114,527 482,172 -- -- 26,204.9 N/A 1,174.02017 109,138.0 34,241.3 117,921 115,124 497,615 -- -- 27,038.2 N/A 1,203.02018 112,823.4 35,169.9 120,023 117,046 510,968 -- -- 27,801.4 N/A 1,250.02019 112,665.5 35,227.0 120,749 117,803 513,422 -- -- 27,900.2 N/A 1,231.02020 112,729.0 35,392.1 121,876 118,963 518,031 -- -- 28,103.7 N/A 1,253.02021 114,312.8 35,971.6 123,689 120,730 527,271 -- -- 28,583.7 N/A 1,281.02022 115,636.3 36,454.8 125,327 122,335 535,290 -- -- 28,997.7 N/A 1,297.02023 117,348.2 37,027.2 127,174 124,130 544,104 -- -- 29,465.5 N/A 1,317.02024 118,793.5 37,509.2 128,879 125,799 551,483 -- -- 29,857.8 N/A 1,328.0Sector Rank 6/35 2/35 8/35 8/35 4/35 N/A N/A 3/35 N/A N/AEconomy Rank 96/694 92/694 64/694 61/694 71/694 N/A N/A 60/694 N/A N/A
IVA/Revenue (%)
Imports/Demand
(%)
Exports/Revenue
(%)
Revenue per Employee
($’000)Wages/Revenue
(%)Employees
per Est.Average Wage
($)
Share of the Economy
(%)2010 28.47 N/A N/A 205.10 25.27 4.00 51,823.75 0.172011 28.79 N/A N/A 210.16 25.09 3.94 52,733.75 0.172012 26.66 N/A N/A 232.06 22.06 3.72 51,187.39 0.162013 26.53 N/A N/A 234.61 21.93 3.77 51,444.23 0.162014 28.06 N/A N/A 231.90 22.56 3.86 52,315.15 0.172015 30.41 N/A N/A 223.93 24.21 4.01 54,212.57 0.182016 31.40 N/A N/A 215.68 25.20 4.16 54,347.62 0.182017 31.37 N/A N/A 219.32 24.77 4.22 54,335.58 0.192018 31.17 N/A N/A 220.80 24.64 4.26 54,409.28 0.192019 31.27 N/A N/A 219.44 24.76 4.25 54,341.65 0.182020 31.40 N/A N/A 217.61 24.93 4.25 54,251.00 0.182021 31.47 N/A N/A 216.80 25.00 4.26 54,210.64 0.182022 31.53 N/A N/A 216.03 25.08 4.27 54,171.94 0.182023 31.55 N/A N/A 215.67 25.11 4.28 54,154.17 0.182024 31.58 N/A N/A 215.41 25.13 4.28 54,140.93 0.18Sector Rank 24/35 N/A N/A 15/35 18/35 15/35 18/35 2/35Economy Rank 328/694 N/A N/A 411/694 228/694 495/694 333/694 92/694
Figures are in inflation-adjusted 2019 dollars. Rank refers to 2019 data.
Revenue (%)
Industry Value Added
(%)
Establish-ments
(%)Enterprises
(%)Employment
(%)Exports
(%)Imports
(%)Wages
(%)
Domestic Demand
(%)
Housing starts (%)
2011 0.1 1.3 -0.9 -0.9 -2.3 N/A N/A -0.6 N/A 3.72012 1.9 -5.7 -2.3 -2.3 -7.7 N/A N/A -10.4 N/A 28.22013 3.2 2.7 0.8 0.8 2.1 N/A N/A 2.6 N/A 18.42014 3.4 9.4 2.2 2.2 4.6 N/A N/A 6.4 N/A 8.52015 1.3 9.8 1.1 1.0 4.9 N/A N/A 8.7 N/A 10.82016 1.8 5.1 1.9 1.4 5.7 N/A N/A 5.9 N/A 5.62017 4.9 4.9 1.7 0.5 3.2 N/A N/A 3.2 N/A 2.52018 3.4 2.7 1.8 1.7 2.7 N/A N/A 2.8 N/A 3.92019 -0.1 0.2 0.6 0.6 0.5 N/A N/A 0.4 N/A -1.52020 0.1 0.5 0.9 1.0 0.9 N/A N/A 0.7 N/A 1.82021 1.4 1.6 1.5 1.5 1.8 N/A N/A 1.7 N/A 2.22022 1.2 1.3 1.3 1.3 1.5 N/A N/A 1.4 N/A 1.22023 1.5 1.6 1.5 1.5 1.6 N/A N/A 1.6 N/A 1.52024 1.2 1.3 1.3 1.3 1.4 N/A N/A 1.3 N/A 0.8Sector Rank 32/35 30/35 22/35 22/35 32/35 N/A N/A 32/35 N/A N/AEconomy Rank 526/694 507/694 384/694 365/694 485/694 N/A N/A 496/694 N/A N/A
Annual Change
Key Ratios
Industry Data
SOURCE: WWW.IBISWORLD.COM
WWW.IBISWORLD.COM Plumbers in the US December 2019 34
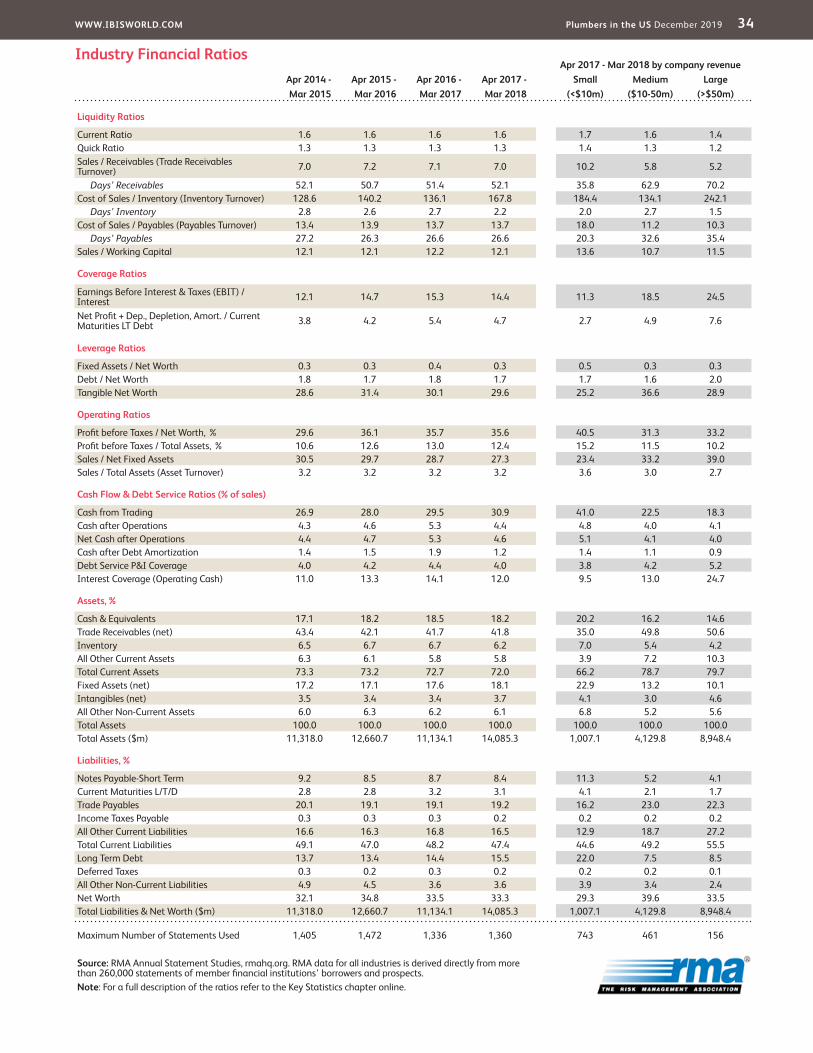
Apr 2017 - Mar 2018 by company revenueApr 2014 - Apr 2015 - Apr 2016 - Apr 2017 - Small Medium LargeMar 2015 Mar 2016 Mar 2017 Mar 2018 (<$10m) ($10-50m) (>$50m)
Liquidity Ratios
Current Ratio 1.6 1.6 1.6 1.6 1.7 1.6 1.4Quick Ratio 1.3 1.3 1.3 1.3 1.4 1.3 1.2Sales / Receivables (Trade Receivables Turnover) 7.0 7.2 7.1 7.0 10.2 5.8 5.2
Days’ Receivables 52.1 50.7 51.4 52.1 35.8 62.9 70.2Cost of Sales / Inventory (Inventory Turnover) 128.6 140.2 136.1 167.8 184.4 134.1 242.1
Days’ Inventory 2.8 2.6 2.7 2.2 2.0 2.7 1.5Cost of Sales / Payables (Payables Turnover) 13.4 13.9 13.7 13.7 18.0 11.2 10.3
Days’ Payables 27.2 26.3 26.6 26.6 20.3 32.6 35.4Sales / Working Capital 12.1 12.1 12.2 12.1 13.6 10.7 11.5
Coverage Ratios
Earnings Before Interest & Taxes (EBIT) / Interest 12.1 14.7 15.3 14.4 11.3 18.5 24.5
Net Profit + Dep., Depletion, Amort. / Current Maturities LT Debt 3.8 4.2 5.4 4.7 2.7 4.9 7.6
Leverage Ratios
Fixed Assets / Net Worth 0.3 0.3 0.4 0.3 0.5 0.3 0.3Debt / Net Worth 1.8 1.7 1.8 1.7 1.7 1.6 2.0Tangible Net Worth 28.6 31.4 30.1 29.6 25.2 36.6 28.9
Operating Ratios
Profit before Taxes / Net Worth, % 29.6 36.1 35.7 35.6 40.5 31.3 33.2Profit before Taxes / Total Assets, % 10.6 12.6 13.0 12.4 15.2 11.5 10.2Sales / Net Fixed Assets 30.5 29.7 28.7 27.3 23.4 33.2 39.0Sales / Total Assets (Asset Turnover) 3.2 3.2 3.2 3.2 3.6 3.0 2.7
Cash Flow & Debt Service Ratios (% of sales)
Cash from Trading 26.9 28.0 29.5 30.9 41.0 22.5 18.3Cash after Operations 4.3 4.6 5.3 4.4 4.8 4.0 4.1Net Cash after Operations 4.4 4.7 5.3 4.6 5.1 4.1 4.0Cash after Debt Amortization 1.4 1.5 1.9 1.2 1.4 1.1 0.9Debt Service P&I Coverage 4.0 4.2 4.4 4.0 3.8 4.2 5.2Interest Coverage (Operating Cash) 11.0 13.3 14.1 12.0 9.5 13.0 24.7
Assets, %
Cash & Equivalents 17.1 18.2 18.5 18.2 20.2 16.2 14.6Trade Receivables (net) 43.4 42.1 41.7 41.8 35.0 49.8 50.6Inventory 6.5 6.7 6.7 6.2 7.0 5.4 4.2All Other Current Assets 6.3 6.1 5.8 5.8 3.9 7.2 10.3Total Current Assets 73.3 73.2 72.7 72.0 66.2 78.7 79.7Fixed Assets (net) 17.2 17.1 17.6 18.1 22.9 13.2 10.1Intangibles (net) 3.5 3.4 3.4 3.7 4.1 3.0 4.6All Other Non-Current Assets 6.0 6.3 6.2 6.1 6.8 5.2 5.6Total Assets 100.0 100.0 100.0 100.0 100.0 100.0 100.0Total Assets ($m) 11,318.0 12,660.7 11,134.1 14,085.3 1,007.1 4,129.8 8,948.4
Liabilities, %
Notes Payable-Short Term 9.2 8.5 8.7 8.4 11.3 5.2 4.1Current Maturities L/T/D 2.8 2.8 3.2 3.1 4.1 2.1 1.7Trade Payables 20.1 19.1 19.1 19.2 16.2 23.0 22.3Income Taxes Payable 0.3 0.3 0.3 0.2 0.2 0.2 0.2All Other Current Liabilities 16.6 16.3 16.8 16.5 12.9 18.7 27.2Total Current Liabilities 49.1 47.0 48.2 47.4 44.6 49.2 55.5Long Term Debt 13.7 13.4 14.4 15.5 22.0 7.5 8.5Deferred Taxes 0.3 0.2 0.3 0.2 0.2 0.2 0.1All Other Non-Current Liabilities 4.9 4.5 3.6 3.6 3.9 3.4 2.4Net Worth 32.1 34.8 33.5 33.3 29.3 39.6 33.5Total Liabilities & Net Worth ($m) 11,318.0 12,660.7 11,134.1 14,085.3 1,007.1 4,129.8 8,948.4
Maximum Number of Statements Used 1,405 1,472 1,336 1,360 743 461 156
Industry Financial Ratios
Source: RMA Annual Statement Studies, rmahq.org. RMA data for all industries is derived directly from more than 260,000 statements of member financial institutions’ borrowers and prospects.Note: For a full description of the ratios refer to the Key Statistics chapter online.

WWW.IBISWORLD.COM Plumbers in the US December 2019 35
Jargon & Glossary
BARRIERS TO ENTRY High barriers to entry mean that new companies struggle to enter an industry, while low barriers mean it is easy for new companies to enter an industry.
CAPITAL INTENSITY Compares the amount of money spent on capital (plant, machinery and equipment) with that spent on labor. IBISWorld uses the ratio of depreciation to wages as a proxy for capital intensity. High capital intensity is more than $0.333 of capital to $1 of labor; medium is $0.125 to $0.333 of capital to $1 of labor; low is less than $0.125 of capital for every $1 of labor.
CONSTANT PRICES The dollar figures in the Key Statistics table, including forecasts, are adjusted for inflation using the current year (i.e. year published) as the base year. This removes the impact of changes in the purchasing power of the dollar, leaving only the “real” growth or decline in industry metrics. The inflation adjustments in IBISWorld’s reports are made using the US Bureau of Economic Analysis’ implicit GDP price deflator.
DOMESTIC DEMAND Spending on industry goods and services within the United States, regardless of their country of origin. It is derived by adding imports to industry revenue, and then subtracting exports.
EMPLOYMENT The number of permanent, part-time, temporary and seasonal employees, working proprietors, partners, managers and executives within the industry.
ENTERPRISE A division that is separately managed and keeps management accounts. Each enterprise consists of one or more establishments that are under common ownership or control.
ESTABLISHMENT The smallest type of accounting unit within an enterprise, an establishment is a single physical location where business is conducted or where services or industrial operations are performed. Multiple establishments under common control make up an enterprise.
EXPORTS Total value of industry goods and services sold by US companies to customers abroad.
IMPORTS Total value of industry goods and services brought in from foreign countries to be sold in the United States.
INDUSTRY CONCENTRATION An indicator of the dominance of the top four players in an industry. Concentration is considered high if the top players account for more than 70% of industry revenue. Medium is 40% to 70% of industry revenue. Low is less than 40%.
INDUSTRY REVENUE The total sales of industry goods and services (exclusive of excise and sales tax); subsidies on production; all other operating income from outside the firm (such as commission income, repair and service income, and rent, leasing and hiring income); and capital work done by rental or lease. Receipts from interest royalties, dividends and the sale of fixed tangible assets are excluded.
INDUSTRY VALUE ADDED (IVA) The market value of goods and services produced by the industry minus the cost of goods and services used in production. IVA is also described as the industry’s contribution to GDP, or profit plus wages and depreciation.
INTERNATIONAL TRADE The level of international trade is determined by ratios of exports to revenue and imports to domestic demand. For exports/revenue: low is less than 5%, medium is 5% to 20%, and high is more than 20%. Imports/domestic demand: low is less than 5%, medium is 5% to 35%, and high is more than 35%.
LIFE CYCLE All industries go through periods of growth, maturity and decline. IBISWorld determines an industry’s life cycle by considering its growth rate (measured by IVA) compared with GDP; the growth rate of the number of establishments; the amount of change the industry’s products are undergoing; the rate of technological change; and the level of customer acceptance of industry products and services.
NONEMPLOYING ESTABLISHMENT Businesses with no paid employment or payroll, also known as nonemployers. These are mostly set up by self-employed individuals.
PROFIT IBISWorld uses earnings before interest and tax (EBIT) as an indicator of a company’s profitability. It is calculated as revenue minus expenses, excluding interest and tax.
Industry Jargon
IBISWorld Glossary
HYDRONIC Describes the use of water as the heat transfer in heating and cooling systems.
LEADERSHIP IN ENERGY AND ENVIRONMENTAL DESIGN An environmental building certificate program that was established under the US Green Building Council and certifies buildings that meet energy-efficiency and green requirements.
NONEMPLOYER An establishment without payroll employees, typically a sole proprietorship or partnership.
NONPOTABLE Describes water that has not been treated, examined or approved by authorities as safe for consumption.
PLUMBING FIXTURE An apparatus for the distribution, storage and flushing of water and waste, designed for the end user (e.g. toilets, showers, sinks and more).
STEAMFITTING The installation and maintenance of equipment for ventilating, heating or refrigerating.

WWW.IBISWORLD.COM Plumbers in the US December 2019 36
Jargon & Glossary
VOLATILITY The level of volatility is determined by averaging the absolute change in revenue in each of the past five years. Volatility levels: very high is more than ±20%; high volatility is ±10% to ±20%; moderate volatility is ±3% to ±10%; and low volatility is less than ±3%.
WAGES The gross total wages and salaries of all employees in the industry. The cost of benefits is also included in this figure.
IBISWorld Glossary continued

Disclaimer
This product has been supplied by IBISWorld Inc. (‘IBISWorld’) solely for use by its authorized licenses strictly in accordance with their license agreements with IBISWorld. IBISWorld makes no representation to any other person with regard to the completeness or accuracy of the data or information contained herein, and it accepts no responsibility and disclaims all liability (save for liability which cannot be lawfully disclaimed) for loss or damage whatsoever suffered or incurred by any other person resulting from the use
of, or reliance upon, the data or information contained herein. Copyright in this publication is owned by IBISWorld Inc. The publication is sold on the basis that the purchaser agrees not to copy the material contained within it for other than the purchasers own purposes. In the event that the purchaser uses or quotes from the material in this publication – in papers, reports, or opinions prepared for any other person – it is agreed that it will be sourced to: IBISWorld Inc.
At IBISWorld we know that industry intelligence is more than assembling factsIt is combining data with analysis to answer the questions that successful businesses askIdentify high growth, emerging & shrinking marketsArm yourself with the latest industry intelligenceAssess competitive threats from existing & new entrantsBenchmark your performance against the competitionMake speedy market-ready, profit-maximizing decisions
Who is IBISWorld?We are strategists, analysts, researchers, and marketers. We provide answers to information-hungry, time-poor businesses. Our goal is to provide real world answers that matter to your business in our 700 US industry reports. When tough strategic, budget, sales and marketing decisions need to be made, our suite of Industry and Risk intelligence products give you deeply-researched answers quickly.
IBISWorld MembershipIBISWorld offers tailored membership packages to meet your needs.
Copyright 2019 IBISWorld Inc
www.ibisworld.com | 1-800-330-3772 | [email protected]