Iberian Regulated Energy Networks
34
Iberian Regulated Iberian Regulated Iberian Regulated Iberian Regulated Energy Networks Energy Networks Energy Networks Energy Networks Energy Networks Energy Networks Energy Networks Energy Networks António António António António Martins Martins Martins Martins da da da da C C Co o os s st t ta a a Board Member Board Member Board Member Board Member EDP Investor Day EDP Investor Day EDP Investor Day EDP Investor Day May 20 May 20 May 20 May 20 th th th th , 2010 , 2010 , 2010 , 2010
Transcript of Iberian Regulated Energy Networks

Iberian Regulated Iberian Regulated Iberian Regulated Iberian Regulated Energy NetworksEnergy NetworksEnergy NetworksEnergy NetworksEnergy NetworksEnergy NetworksEnergy NetworksEnergy Networks
AntónioAntónioAntónioAntónio Martins Martins Martins Martins dadadada CCCCoooossssttttaaaa Board MemberBoard MemberBoard MemberBoard Member
EDP Investor DayEDP Investor DayEDP Investor DayEDP Investor DayMay 20May 20May 20May 20thththth, 2010, 2010, 2010, 2010

EDP Energy Regulated Networks Iberia: EDP Energy Regulated Networks Iberia: EDP Energy Regulated Networks Iberia: EDP Energy Regulated Networks Iberia: Geographical footprintGeographical footprintGeographical footprintGeographical footprint
Geographical Presence 2010E Regulated Revenues(1)
3%
13%8%
Gas Portugal
Gas Spain
Electricity Spain
Electricity
Gas
Electricity & Gas
Basque CountryAsturias
Oportonorth coast
Cantábria
Distribution of electricity in Portugal represents more than 2/3 of the portfolio in all metrics
Diversified portfolio Portugal/Spain, Electricity/Gas
2010 regulated revenues set by regulators: ~€1.7bn
75%
Electricity Portugal
(1) Electricity Portugal: €1.3bn in accordance with ERSE’s consumption forecast; Gas Portugal: regulated revenues set for the year going from Jul-09 to Jun-10; Electricity Spain: regulated revenues exclude €7m from transmission activity which has to be sold to REE before July 3rd, 2010.
60
north coast
Murcia

EDP Energy Regulated Networks Iberia:EDP Energy Regulated Networks Iberia:EDP Energy Regulated Networks Iberia:EDP Energy Regulated Networks Iberia:2009 Highlights2009 Highlights2009 Highlights2009 Highlights
EDP Sol. Comerciais
EDP Distribuição
EDP Serv. Universal HC Explotación Redes
HC Distribución Naturgas EnergiaEDP Gás Distribuição
100% 100% 72% 63.5%
EDP Gás Serv. Univ.
( ) % Weight on Total Regulated Networks Iberia
HC Ultimo Recurso
Regulated Networks Iberia Owned by EDP
61
Portugal Gas Distribution
Portugal Last Resource Supplier
Spain Gas Distribution
Spain Gas Transmission
Portugal Electricity Distribution
Portugal Last Resource Supplier
Spain Electricity Distribution
Spain Last Resource Supplier(2)
Underlying
Activities
EBITDA 2009 (€m)
GWh(3)
# Clients connected (th)
590 (69%)
46,146 (68%)
6,120 (77%)
104 (12%)
9,131 (13%)
645 (8%)
21 (2%)
6,133 (5%)
221(3%)
137 (16%)
18,968 (14%)
964 (12%) (1)
(1) Nb. of Clients Connected include the contribution of regulated assets acquired from Gas Natural. These assets started being consolidated at P&L level only in Jan-2010. (2) As of April 2009, Last Resource Supply activity was transferred to our liberalised activities in Spain. (3) Weight calculated considering Electricity Equivalent GWh.

Electricity distribution Portugal has a clear and stable Electricity distribution Portugal has a clear and stable Electricity distribution Portugal has a clear and stable Electricity distribution Portugal has a clear and stable regulatory framework: regulatory metrics for 2009regulatory framework: regulatory metrics for 2009regulatory framework: regulatory metrics for 2009regulatory framework: regulatory metrics for 2009----2011201120112011
2009 2010 (1) 2011 E
Regulated Asset Base
Return on RAB & Working
10 Year Portuguese Government Bond Yield + 400bp
Working Capital: €146m(2)
Electricity Distribution Regulated Asset Base: €2.8 bn
€121m
62
& Working Capital
Cost Base
Regulated Gross Margin
Negative Gap on Costs: €77m (c9%)(3)
Efficiency factor: 3.5% on controllable costs per MWh
GDP Deflator Update:+ 1.5%
8.55% 8.39%
€1.32bn €1.30bn €1.30bn
(1) In accordance with 2010 tariffs set by the Portuguese regulator ERSE (assuming 45.1TWh of electricity consumption for 2010). (2) Real 2009 Working Capital for
EDP Serviço Universal came below ERSE’s assumption of €255m. (3) Weight over total PT GAAP costs presented to ERSE for 2009 Tariff Review.

Electricity Distribution Portugal: Revenues with low Electricity Distribution Portugal: Revenues with low Electricity Distribution Portugal: Revenues with low Electricity Distribution Portugal: Revenues with low sensitivity to energy consumption and economic cyclesensitivity to energy consumption and economic cyclesensitivity to energy consumption and economic cyclesensitivity to energy consumption and economic cycle
Variable RevenuesDepends on GWh distributed in Non-low Voltage(1) (mostly industrial)
~30%
~10% - 5% YoY
Variable RevenuesDepends on GWh distributed in Low Voltage(2) (mostly residential)
+ 3% YoY
€1,321m2009 Demand
Electricity Distribution Portugal: Breakdown of 2009 Regulated Revenues (3)
+ 6% YoY
+ 1% YoY
1Q10 Demand
(1) Non-low Voltage: Very High Voltage + High Voltage + Medium Voltage (mostly industrial clients) (2) Low Voltage: Special Low Voltage + Low Voltage (mostly residential clients). (3) Including Last Resource Supply Activity in Fixed Revenues (do not depend on Volumes distributed; depend on number of clients) (4) Assuming flat demand vs. 2008 (46.5 TWh).
Decline in electricity demand in 2009 had an immaterial impact of -€7m at EBITDA level (4)
2009
~60%Fixed RevenuesNo impact from electricity consumption
63

2.62.4 2.4 2.6 2.5
Electricity Distribution Portugal: Electricity Distribution Portugal: Electricity Distribution Portugal: Electricity Distribution Portugal: Efficiency improvementsEfficiency improvementsEfficiency improvementsEfficiency improvements
Opex(3)/km of Network(‘000€/km)
CAGR 2005-2009
-2%
New regulatory targets on customer service quality
Network Capex(1) & Equivalent Interruption Time(2)
(€m; min.)
385
Expansion Service Quality Other EIT (Internal)
80
180
150
Average
2005 2006 2007 2008 2009
64(1) EDP Distribuição’s Capex in accordance with PT GAAP; (2) Equivalent Interruption Time internal to EDP Distribuição (regarding interruptions originated at EDP Distribuição’s network); (3) Supplies and Services + Personnel Costs + Costs with Social Benefits (excluding HR Restructuring costs)
Opex/km efficiency ratio improved by an average of 2% p.a.
between 2005 and 2009
93
2000 2002 2004 2006 2008
2000-2009: Internal EIT improved 76% in line with European Benchmarks
Strong investments for service quality improvement: Current ~€150m per year on a total of €300m per year

Electricity Distribution Spain: New Return on RAB system Electricity Distribution Spain: New Return on RAB system Electricity Distribution Spain: New Return on RAB system Electricity Distribution Spain: New Return on RAB system will improve visibility of returns on new investmentswill improve visibility of returns on new investmentswill improve visibility of returns on new investmentswill improve visibility of returns on new investments
4-year regulatory periods (2009-2012)
Remuneration for the 1st year Annual Updates
Inflation
Until 2008: Stable regulated revenues updated annually, but no clear Return on RAB system
New Return on RAB framework: 2009 was the 1st transition year; final settings expected in 2010
Provisional Regulated Revenues 2010: €146m(1)
Return on Regulated Asset Base
+Costs Base
65
Inflation
+Activity Increase
(recognized increase of asset base & costs)
+Quality of Service Incentive
+Losses Reduction Incentives
No material impact expected on regulated revenues on past investments
Regulatory stability for new investments and encourages quality improvement and loss reduction
(1) Excluding €7m from Transmission Activity which has to be disposed off until Jul-2010.

Gas Distribution and Transmission Iberia: Gas Distribution and Transmission Iberia: Gas Distribution and Transmission Iberia: Gas Distribution and Transmission Iberia: Limited impact expected from future reviewsLimited impact expected from future reviewsLimited impact expected from future reviewsLimited impact expected from future reviews
Gas Spain
Regulated Revenues updated annually
(inflation, efficiency factor Distribution
Return on asset base
+ Costs Base
Transmission
Gas Portugal
Distribution
Supply
Supply margin (return on working capital)
+
Return on asset base(concession assets revaluation)
+Costs Base
66
and demand)
Possible change to Return on Assets Base methodology in 2011
Expected limited impact on regulated revenues
2010 Regulated Revenues: €218m
Cost Base
Current regulation preserves value of initial concession contracts
Low gas penetration (22%)(1) = high volume growthStrong growth of regulated revenues explained by stable unit
tariffs per MWh & asset revaluation to reflect conditions
of initial concession contract
Jun09-Jul10 Regulated Revenues: €51m
(1) EDP Gás penetration rate in its concession area.

Assets acquired from Gas Natural in DecAssets acquired from Gas Natural in DecAssets acquired from Gas Natural in DecAssets acquired from Gas Natural in Dec----09:09:09:09:Reinforcement of #2 position in gas distribution in SpainReinforcement of #2 position in gas distribution in SpainReinforcement of #2 position in gas distribution in SpainReinforcement of #2 position in gas distribution in SpainGeographical fit with EDP’s assets(€m)
EBITDA of assets acquired from Gas Natural(€m)
11
Acquisition assumptions
67
Fast integration of assets acquired: Strong synergies, economies of scale
1Q10 operating performance already above assumptions made in acquisition
1Q10 1Q10 Forecast
Gas distribution assets acquired
EDP gas distribution assets prior to transaction
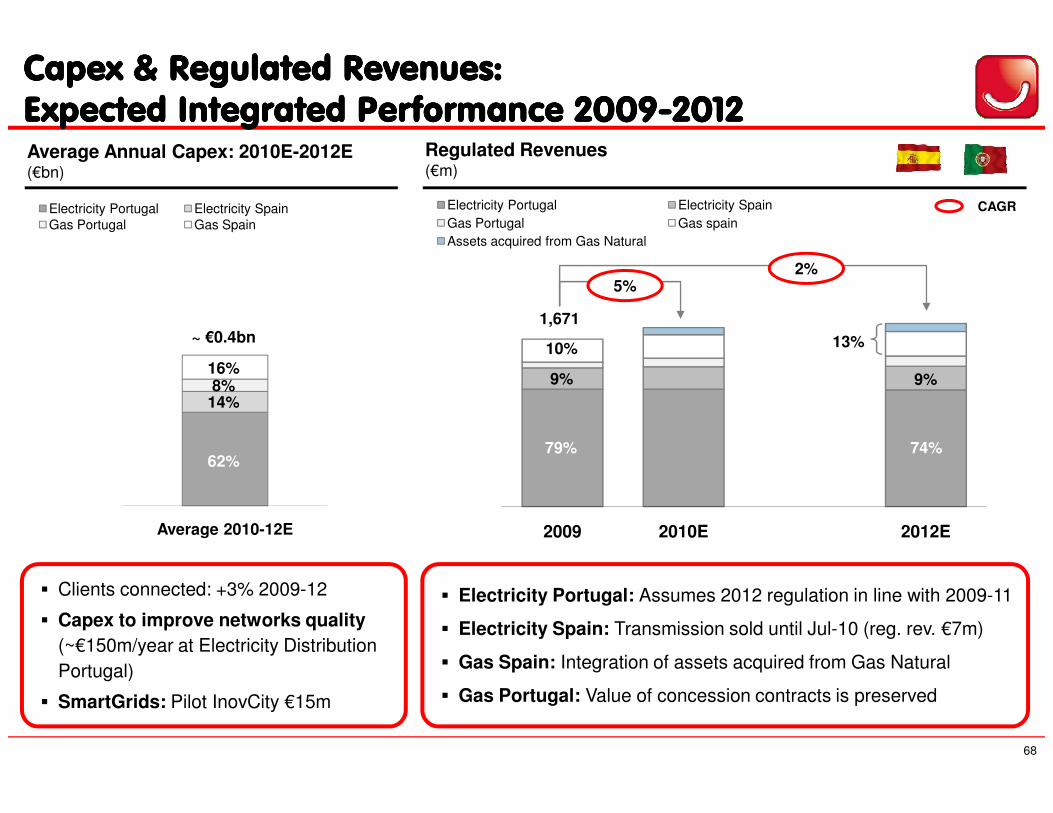
Capex & Regulated Revenues:Capex & Regulated Revenues:Capex & Regulated Revenues:Capex & Regulated Revenues:Expected Integrated Performance 2009Expected Integrated Performance 2009Expected Integrated Performance 2009Expected Integrated Performance 2009----2012201220122012
Regulated Revenues(€m)
Electricity Portugal Electricity Spain
Gas Portugal Gas spain
Assets acquired from Gas Natural
1,671
2%5%
CAGR
Average Annual Capex: 2010E-2012E(€bn)
Electricity Portugal Electricity SpainGas Portugal Gas Spain
~ €0.4bn
16%8%
14%
9% 9%
10% 13%
68
� Electricity Portugal: Assumes 2012 regulation in line with 2009-11
� Electricity Spain: Transmission sold until Jul-10 (reg. rev. €7m)
� Gas Spain: Integration of assets acquired from Gas Natural
� Gas Portugal: Value of concession contracts is preserved
2009 2010E 2012E
� Clients connected: +3% 2009-12
� Capex to improve networks quality (~€150m/year at Electricity Distribution
Portugal)
� SmartGrids: Pilot InovCity €15m
Average 2010-12E
14%
79%62%
74%
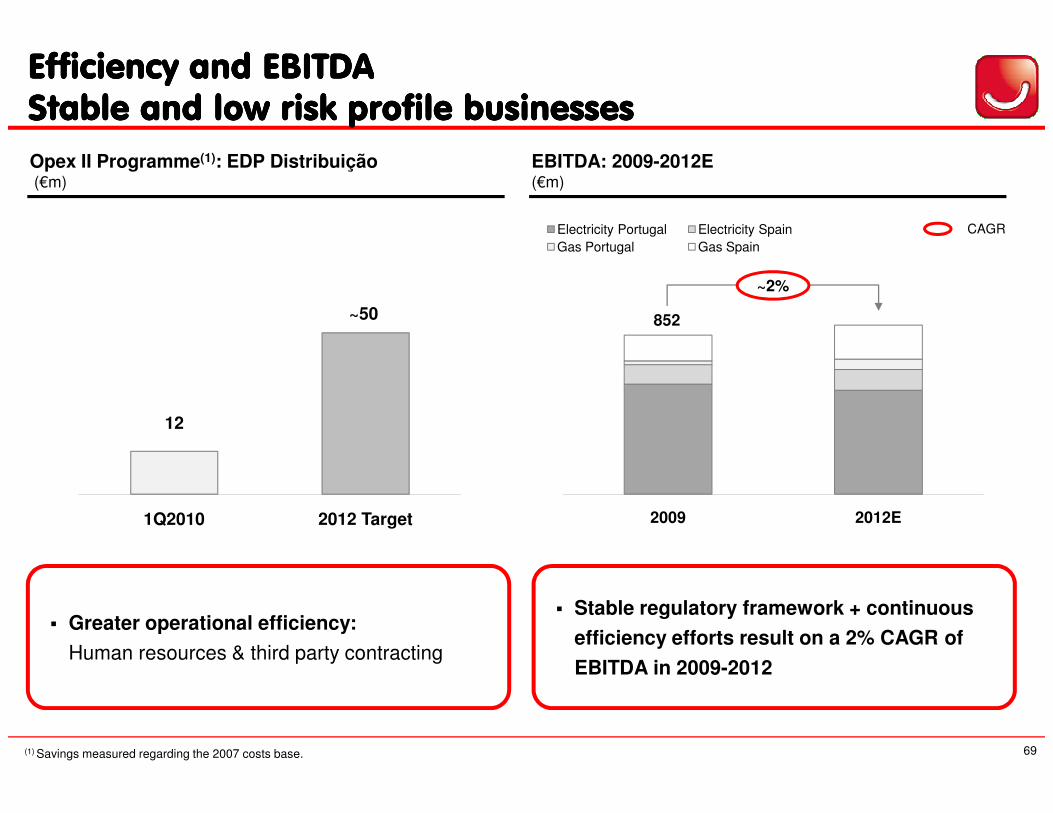
Efficiency and EBITDAEfficiency and EBITDAEfficiency and EBITDAEfficiency and EBITDAStable and low risk profile businessesStable and low risk profile businessesStable and low risk profile businessesStable and low risk profile businesses
Opex II Programme(1): EDP Distribuição(€m)
Electricity Portugal Electricity Spain
Gas Portugal Gas Spain
852
~2%
CAGR
EBITDA: 2009-2012E(€m)
~50
69
� Stable regulatory framework + continuous
efficiency efforts result on a 2% CAGR of
EBITDA in 2009-2012
� Greater operational efficiency:
Human resources & third party contracting
2009 2012E
12
1Q2010 2012 Target
(1) Savings measured regarding the 2007 costs base.

ConclusionsConclusionsConclusionsConclusions
Capex 2010E-2012E: average of €0.4bn/yearFocus on service quality improvements; network expansion
Stable regulatory environment; Good visibility on regulated revenues: ~€1.7bn for 2010Energy distributed volumes: low impact on regulated revenues from changes in energy demand
70
Stable regulatory environment providing good visibility on returns
Strong focus on efficiency improvementOpex II program: current achievements above targets
Energy Regulated Networks EBITDA 2009-12: ~2% CAGR

Energy SupplyEnergy SupplyEnergy SupplyEnergy SupplyShortShortShortShort----medium Term medium Term medium Term medium Term
ChallengesChallengesChallengesChallengesChallengesChallengesChallengesChallenges
Jorge Cruz de Jorge Cruz de Jorge Cruz de Jorge Cruz de MoraisMoraisMoraisMoraisBoard MemberBoard MemberBoard MemberBoard Member
EDP Investor DayEDP Investor DayEDP Investor DayEDP Investor DayMay 20May 20May 20May 20thththth, 2010, 2010, 2010, 2010

EDP Commercial Platforms in Iberian Electricity and Gas:EDP Commercial Platforms in Iberian Electricity and Gas:EDP Commercial Platforms in Iberian Electricity and Gas:EDP Commercial Platforms in Iberian Electricity and Gas:
Energy Supply Iberia
EDP Serv. Univ.
EDP Comercial HC Energia
HC Ultimo RecursoNE Suministro SUREDP Gás Serv. Univ.
EDP Gás.Com NE Suministro
EDP Soluções Comerciais
72
EDP has 7 million electricity clients and 1 million gas clients, of which 0.5 million are dual fuel clients
Gas Suppliers Portugal
Last Resource and Liberalized
Gas Suppliers Spain
Last resource and Liberalized
Electricity Suppliers Portugal
Last Resource and Liberalized
Electricity Suppliers Spain
Last Resource and Liberalized
Underlying
Activities
GWh
# Clients (th)
43,154
6,102
16,060
949
3,264
215
21,261
833(1)
Note: 2009 Data.
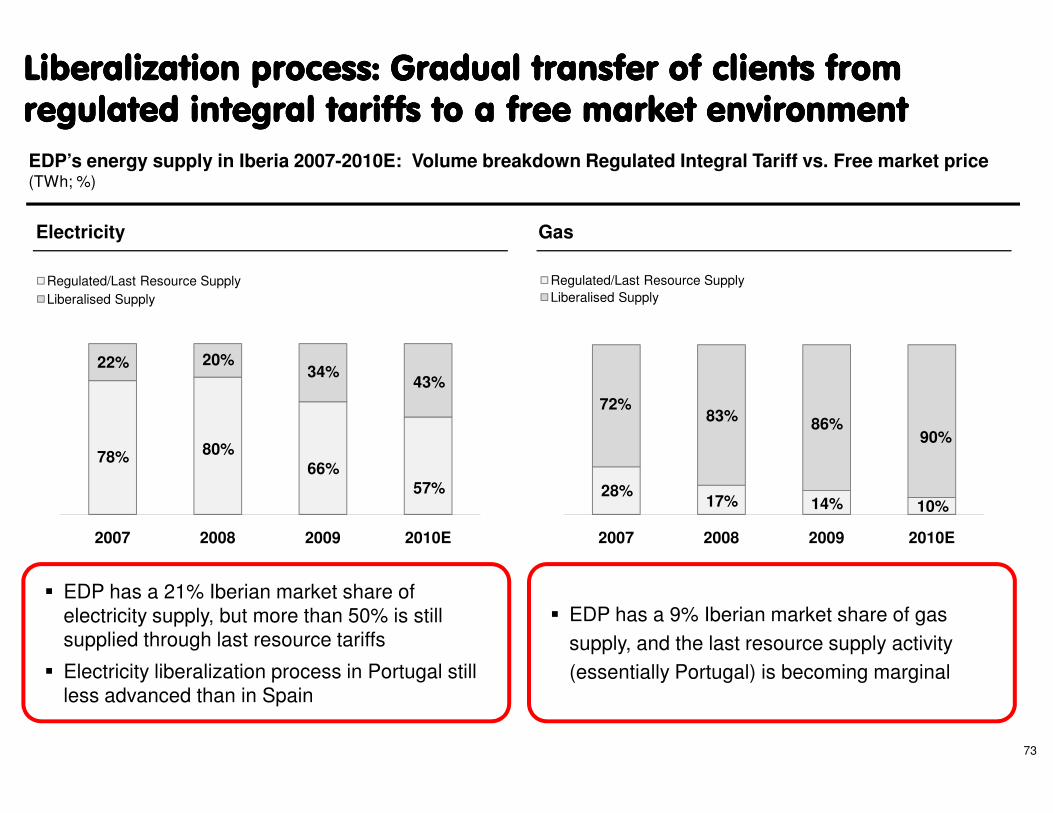
Liberalization process: Gradual transfer of clients from Liberalization process: Gradual transfer of clients from Liberalization process: Gradual transfer of clients from Liberalization process: Gradual transfer of clients from regulated integral tariffs to a free market environmentregulated integral tariffs to a free market environmentregulated integral tariffs to a free market environmentregulated integral tariffs to a free market environment
EDP’s energy supply in Iberia 2007-2010E: Volume breakdown Regulated Integral Tariff vs. Free market price(TWh; %)
Electricity Gas
Regulated/Last Resource Supply
Liberalised Supply
22% 20%34%
43%
Regulated/Last Resource Supply
Liberalised Supply
72%83%
73
2007 2008 2009 2010E
66%57%
78% 80%
2007 2008 2009 2010E
72%83% 86%
90%
14% 10%28%
17%
� EDP has a 21% Iberian market share of electricity supply, but more than 50% is still supplied through last resource tariffs
� Electricity liberalization process in Portugal still less advanced than in Spain
� EDP has a 9% Iberian market share of gas
supply, and the last resource supply activity
(essentially Portugal) is becoming marginal
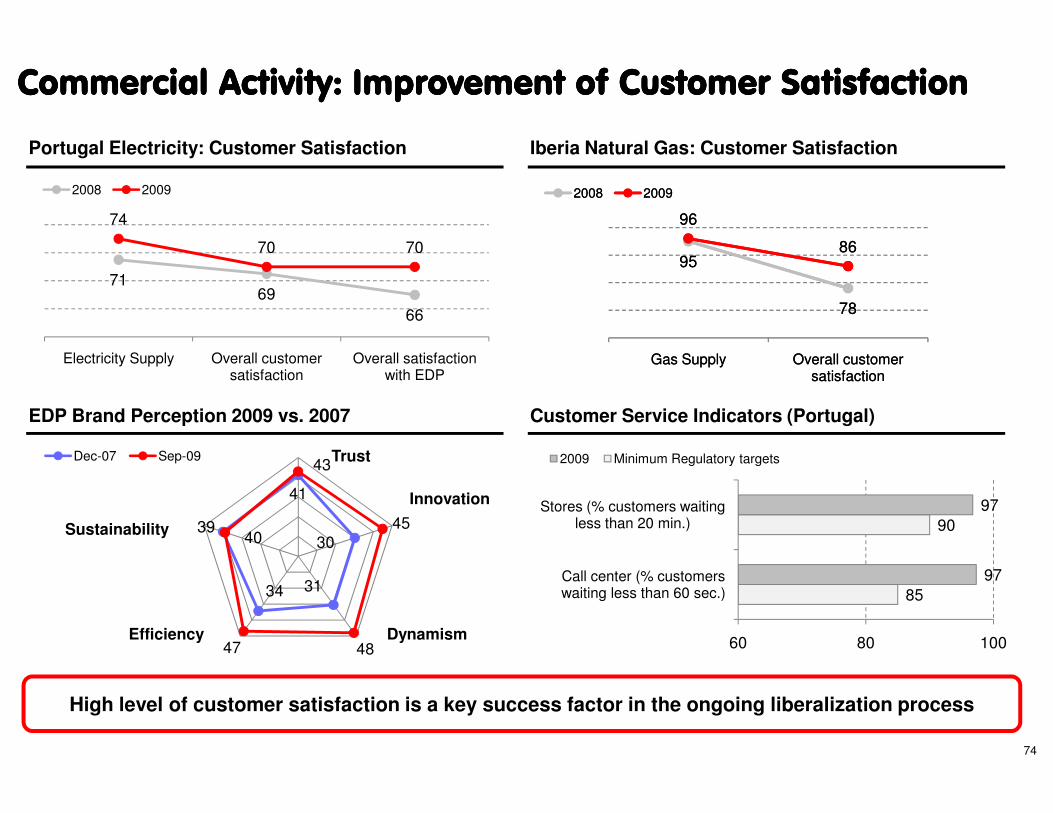
Commercial Activity: Improvement of Customer SatisfactionCommercial Activity: Improvement of Customer SatisfactionCommercial Activity: Improvement of Customer SatisfactionCommercial Activity: Improvement of Customer Satisfaction
EDP Brand Perception 2009 vs. 2007 Customer Service Indicators (Portugal)
Portugal Electricity: Customer Satisfaction Iberia Natural Gas: Customer Satisfaction
7169
66
74
70 70
Electricity Supply Overall customer satisfaction
Overall satisfaction with EDP
2008 2009
95
78
96
86
Gas Supply Overall customer satisfaction
2008 2009
95
78
96
86
Gas Supply Overall customer satisfaction
2008 2009
74
EDP Brand Perception 2009 vs. 2007 Customer Service Indicators (Portugal)
41
30
3134
40
43
45
4847
39
Dec-07 Sep-09 Trust
Innovation
DynamismEfficiency
Sustainability
85
90
97
97
60 80 100
Call center (% customers waiting less than 60 sec.)
Stores (% customers waiting less than 20 min.)
2009 Minimum Regulatory targets
High level of customer satisfaction is a key success factor in the ongoing liberalization process

Commercial activity: efficiency improvementCommercial activity: efficiency improvementCommercial activity: efficiency improvementCommercial activity: efficiency improvement
Collecting Costs (Portugal)Invoicing Costs (Portugal)
0.370.35
-5%
Avg. Costs (€)
Weight electronic invoicing (%)
3%
7%
11% 0.23
0.19
-16%
Avg. Costs (€)
57%16%
12%
15%
2009 Mix(%)
OtherAutomatic
Bank Transfer
Agents
75
Share EDP project: Integration of commercial support services at Iberian level: call centers, IT
systems, best practices increasing economies of scale and efficiency, reduction in external supplies
Control of commercial costs maintaining quality standards
2008 2009
3%
2008 2009 2012E 2009 2012E
ATM

Commercial Activity: Control over bills collectionCommercial Activity: Control over bills collectionCommercial Activity: Control over bills collectionCommercial Activity: Control over bills collection
Matured Debt / Invoicing (1)
(€m; %)
Average Collecting Period(Days)
222200
215
5%4% 4%
Matured Debt
Matured Debt/Invoicing (last 12 months)
32.231.6
Average Invoicing Mix(%)
2009
19%
1%
24%
Monthly“Conta-certa” &
Other (2)
Quarterly
76(1) Excluding EDP Distribuição (debt from municipalities). (2) Monthly payment and annual invoicing.
Level of matured debt maintained under control even considering the low economic cycle
Stable avg. collecting period ~32 days (significant weight of bi-monthly invoicing)
2007 2008 2009 2008 2009
56%
Bi-monthly

Energy Efficiency: A new business line for EDPEnergy Efficiency: A new business line for EDPEnergy Efficiency: A new business line for EDPEnergy Efficiency: A new business line for EDP
EU targets a 20% improvement in energy efficiency until 2020, incentives under analysis
New business opportunity to utilities: Depending on evolution of regulatory incentives
Key energy efficiency business lines to EDP:
� Development and offering energy efficiency services to clients
� Decentralized energy generation (micro generation)
Energy efficiency: small business but growing, relevant for customer & regulatory involvement
77
� Decentralized energy generation (micro generation)
� Increased remote control at consumption point to enable management of demand curve
EDP offers to its customers distributed generation
solutions from certified technology providers:
Solar PV, Solar
Thermal and
Micro Wind
Portuguese regulator supports projects to
promote consumers’ efficient energy behavior:EDP has had regulatory
support for: media
campaigns; distribution
of efficient light bulbs;
consulting services…

Smart Grids: Key to meet challenges of more renewables, Smart Grids: Key to meet challenges of more renewables, Smart Grids: Key to meet challenges of more renewables, Smart Grids: Key to meet challenges of more renewables, distributed generation and electric vehiclesdistributed generation and electric vehiclesdistributed generation and electric vehiclesdistributed generation and electric vehicles
Benefitting consumers and offering a technological leap forward in distribution network service and capabilities
43% of consumption in Portugal already with smart metering
�Operational Efficiency
�Energy Efficiency
�Renewable Energy
�Electric Vehicles
78
�Energy Efficiency
�Service Quality
Cutting-edge Smart Grids project is being commercially tested in the Portuguese city of Évora, the 1st Iberian InovCity, during 2010-11
Total investment: €15m(31.300 smart meters installed; integration of IT systems; setting up communications infrastructures;
remote network control systems)
Project in line with world technological trends and already a reference in Europe
�Electric Vehicles

Electric Vehicles: EDP is actively involved withElectric Vehicles: EDP is actively involved withElectric Vehicles: EDP is actively involved withElectric Vehicles: EDP is actively involved withgovernments on the setgovernments on the setgovernments on the setgovernments on the set----up of the future business modelup of the future business modelup of the future business modelup of the future business model
Electricity Network
Electricity Supply
Slow Charging
Posts
Fast Charging
Posts
Other Mobility Services
� EDP Distribuição � EDP Comercial
� Other
� Municipalities
� EDP Distribuição
� Other
� EDP Distribuição
� Service Stations
� Parking Spaces
� Other
79
Electric Vehicles to become relevant for the electric utilities business over the next decade
� Pilot project of 6 charging posts for electric vehicles in Lisbon (35 users for now);
� Government target for Portugal by 2012: 1,300 slow charging points + 50 fast charging points.
Total investment: ~€13m, (before subsidies);
� Estimated fleet in Portugal by 2020: ~160,000 vehicles (estimated electricity consumption of 500GWh) which would require an investment of €200-250m in both slow and fast charging posts;

Commercial services efficiency is improving: Key to be competitive in the supply market
ConclusionsConclusionsConclusionsConclusions
EDP is focused on its customers satisfaction: key success factor in liberalization process
Tight control over doubtful debts: Even more important on a low economic cycle
80
Customer relationship: a key competitive advantage which EDP continues to enhance
Leading the way for innovation: energy efficiency, smart grids, electric vehicles
Tight control over doubtful debts: Even more important on a low economic cycle
EDP EDP EDP EDP RenováveisRenováveisRenováveisRenováveisEDP EDP EDP EDP RenováveisRenováveisRenováveisRenováveis
Ana Maria Ana Maria Ana Maria Ana Maria FernandesFernandesFernandesFernandesCEOCEOCEOCEO
EDP Investor DayEDP Investor DayEDP Investor DayEDP Investor DayMay 20May 20May 20May 20thththth, 2010, 2010, 2010, 2010

A top global leader on the right path of sustainability and value A top global leader on the right path of sustainability and value A top global leader on the right path of sustainability and value A top global leader on the right path of sustainability and value creationcreationcreationcreation
Growth companyin a growing sector
Committed to deliver focused
growth…
82
Integrated portfolio
managementStrong human
capital anddistinctive core
competences
…sustainable profitability…
…controlled risk profile

EDPR grew by more than 2.8x over the last 3 years…EDPR grew by more than 2.8x over the last 3 years…EDPR grew by more than 2.8x over the last 3 years…EDPR grew by more than 2.8x over the last 3 years…
6,259
Evolution of Installed Capacity(Gross MW)
EDPR: #3 wind player worldwide(MW)
+4,132
+2.8x
#3
2006 2006-1Q10 capacity growth
1Q10
83
2,127
Delivery on growth targets at an average of 1.4 GW/year to become 3rd largest player in the world
2006 2010
#5
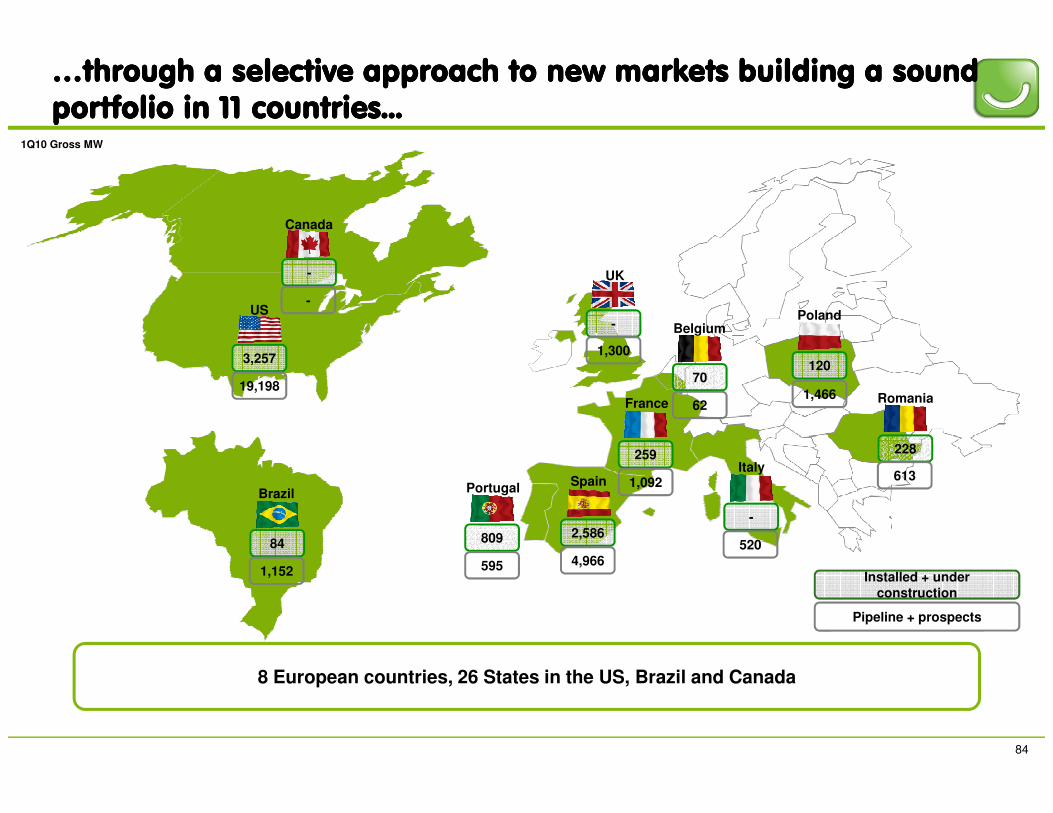
…through a selective approach to new markets building a sound …through a selective approach to new markets building a sound …through a selective approach to new markets building a sound …through a selective approach to new markets building a sound portfolio in 11 countries...portfolio in 11 countries...portfolio in 11 countries...portfolio in 11 countries...
US
Canada
UK
France
Belgium
Romania
Poland
1Q10 Gross MW
3,257
19,198
-
-
-
1,300
70
62
120
1,466
84
8 European countries, 26 States in the US, Brazil and Canada
Portugal SpainBrazil
France
Italy
Installed + under construction
Pipeline + prospects
84
1,152
809
595
2,586
4,966
259
1,092
62
-
520
228
613

…which are determined to promote sustainable growth through …which are determined to promote sustainable growth through …which are determined to promote sustainable growth through …which are determined to promote sustainable growth through renewable technologiesrenewable technologiesrenewable technologiesrenewable technologies
Europe targets set for 20% of energy produced from renewable
sources by 2020
Wind market in US + EU: target-driven growth(GW)
388
85
US current RPS targets at state level, adding up to 13% by 2020 62
114
2006 2009 2020E
EDP Renováveis grew 2.8x since 2006, outpacing the sector growth rates through 2009
+1.8x
+3.4x
…
Source: EER Wind Energy Market Forecast; EER US Renewable Policy Index: State RPSs

EDPR actively manages its portfolio through an integrated EDPR actively manages its portfolio through an integrated EDPR actively manages its portfolio through an integrated EDPR actively manages its portfolio through an integrated approachapproachapproachapproach
• Maximize long-term visibility on expected return
• Minimize short-term volatility of cash-flow streams
Operatingassets
Stabilityand
visibility
Key value drivers in portfolio management
EDPR’s fundamental value
6.3 GW
86
• Maximize optionality to execute
• Maximize flexibility to accommodate growth paces
• Maximize portfolio’s risk / return through integration of growth options with operating assets
EDPRvalue
Growth
Optionality and
Flexibility
Integration
+1.1-1.2 GWper year

EDPR’s wind operating assets are under visible remuneration EDPR’s wind operating assets are under visible remuneration EDPR’s wind operating assets are under visible remuneration EDPR’s wind operating assets are under visible remuneration schemes with stable prices for the longschemes with stable prices for the longschemes with stable prices for the longschemes with stable prices for the long----termtermtermterm
2010E EDPR’s production breakdown(GWh weighted by revenue source)
Feed-in tariffs + Long-term PPAs
Long-term remuneration view
Floor price for 100% of the
capacity post-201230%
16%
Short-term market exposure
Limited
80% of 2010E production
already hedged
87
By country
More than 80% of the expected output to deliver stable cash flows in 2010
following an active risk management policy
Following a low risk approach
through long-term PPAs
54%
70% of 2010E production under long-term PPAs
for 15 years
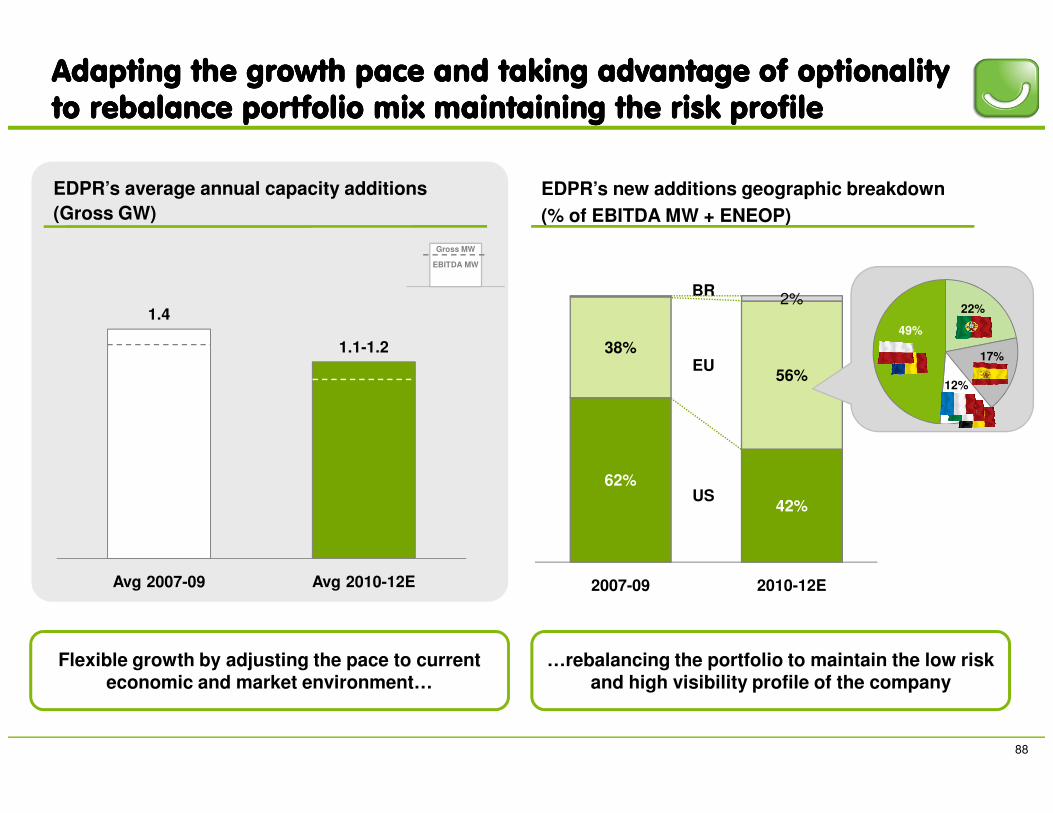
Adapting the growth pace and taking advantage of Adapting the growth pace and taking advantage of Adapting the growth pace and taking advantage of Adapting the growth pace and taking advantage of optionalityoptionalityoptionalityoptionalityto rebalance portfolio mix maintaining the risk profileto rebalance portfolio mix maintaining the risk profileto rebalance portfolio mix maintaining the risk profileto rebalance portfolio mix maintaining the risk profile
EDPR’s average annual capacity additions(Gross GW)
1.4
1.1-1.2 38%
56%
2%22%
17%
12%
49%
EDPR’s new additions geographic breakdown(% of EBITDA MW + ENEOP)
Gross MW
EBITDA MW
EU
BR
88
Avg 2007-09 Avg 2010-12E
Flexible growth by adjusting the pace to current economic and market environment…
62%
42%
2007-09 2010-12E
…rebalancing the portfolio to maintain the low risk and high visibility profile of the company
US

EfficientEfficientEfficientEfficient capexcapexcapexcapex programprogramprogramprogram andandandand a 30% a 30% a 30% a 30% annualannualannualannual EBITDA EBITDA EBITDA EBITDA growthgrowthgrowthgrowththroughthroughthroughthrough 2012…2012…2012…2012…
2010-12E Capex plan(€bn)
2009-12E: EBITDA(€m)
+30%CAGR
5.7
4.4
-22%
89
543
2009 2012E2007-09 2010-12E
• Ongoing increase of the installed capacity inattractive markets
• Maintaining high efficiency levels and gaining economies of scale
• Overall reduction of unitary cost of building (-10% in Capex/MW)…
• …with higher efficiency (-25% in Capex/MWh)

...based on distinctive core competences providing a competitive ...based on distinctive core competences providing a competitive ...based on distinctive core competences providing a competitive ...based on distinctive core competences providing a competitive advantage advantage advantage advantage to EDPRto EDPRto EDPRto EDPR
Top quality load factorsTrack record being
applied in 11 countriesLong-term
procurement strategyMaintenance of high
efficiency levels�� � �
Development Technical Procurement O&M
90
Optimizing profitability through efficiency in operations and
world class professional teams and assets
27%
34%
Efficient and focused execution
Critical local knowledge
Optimizing costs and selecting best
technology
Flexibility on time, geography and models
97% in availability
~75% EBITDA margin

Preparing the company to a sustainable longPreparing the company to a sustainable longPreparing the company to a sustainable longPreparing the company to a sustainable long----term value term value term value term value creationcreationcreationcreation
Offshore
Awarded in the UK Round 3 with1.3 GW in Scotland
Stakeholders Value
Number 1 in Reputation among the top listed Portuguese companies
Preparing the company with options to invest in new technologies in the future…
…ensuring a sustainable companyin the present
91
Solar
Starting greenfield development of 5 solar projects in Arizona andCalifornia (565 MW)
Other technologies
Framework agreement with EDP Inovação for R&D in renewable tech
Sustainability Certification
A+ evaluation by the Global ReportingIniciative (GRI)
Dow Jones Sustainability Index
Strong contributor to EDP’s position in the DJ Index
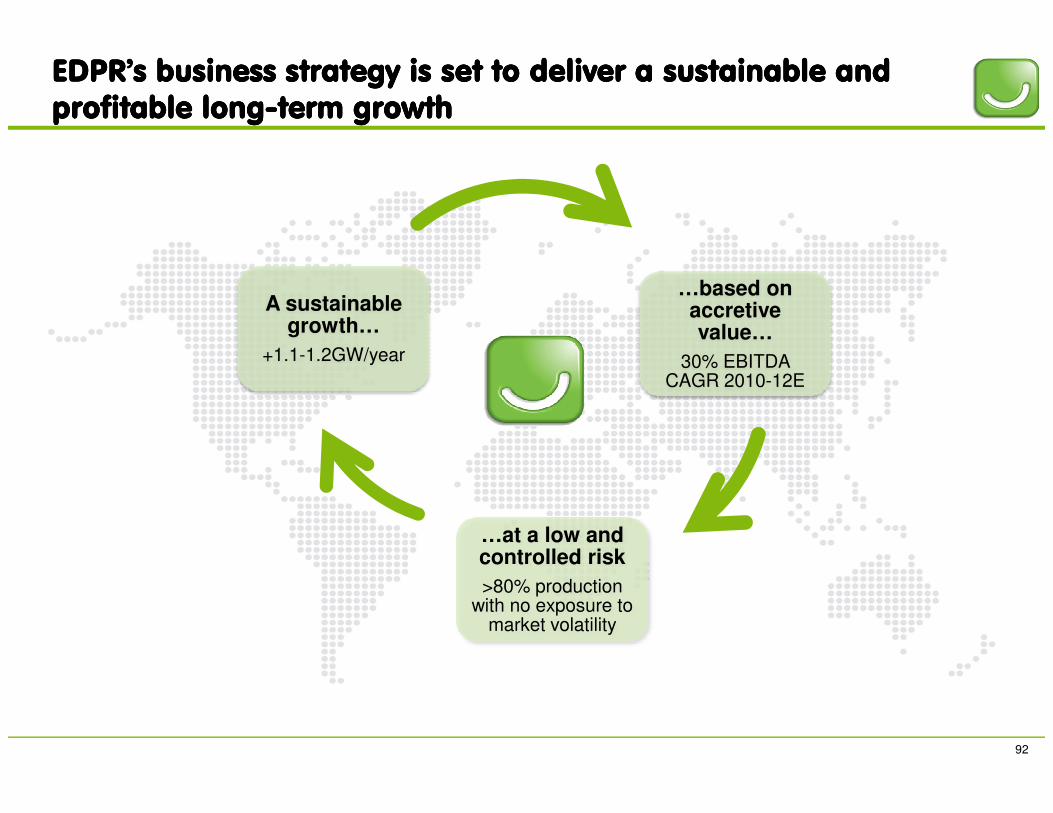
…based on accretive value…
30% EBITDA CAGR 2010-12E
A sustainable growth…
+1.1-1.2GW/year
EDPR’sEDPR’sEDPR’sEDPR’s business strategy is set to deliver a sustainable and business strategy is set to deliver a sustainable and business strategy is set to deliver a sustainable and business strategy is set to deliver a sustainable and profitable longprofitable longprofitable longprofitable long----term growthterm growthterm growthterm growth
92
…at a low and controlled risk>80% production
with no exposure to market volatility