IAEA Nuclear Energy Series - IAEA Scientific and Technical ... · PDF fileIAEA Nuclear Energy...
72
IAEA Nuclear Energy Series Technical Reports Advances in Airborne and Ground Geophysical Methods for Uranium Exploration No. NF-T-1.5
-
Upload
phungxuyen -
Category
Documents
-
view
245 -
download
4
Transcript of IAEA Nuclear Energy Series - IAEA Scientific and Technical ... · PDF fileIAEA Nuclear Energy...

Basic Principles
Objectives
IAEA Nuclear Energy Series
TechnicalReports
Advances in Airborne and Ground Geophysical Methods for Uranium Exploration
No. NF-T-1.5
Guides
INTERNATIONAL ATOMIC ENERGY AGENCYVIENNA
ISBN 978–92–0–129010–6ISSN 1995–7807

IAEA NUCLEAR ENERGY SERIES PUBLICATIONS
STRUCTURE OF THE IAEA NUCLEAR ENERGY SERIES
Under the terms of Articles III.A and VIII.C of its Statute, the IAEA is authorized to foster the exchange of scientific and technical information on the peaceful uses of atomic energy. The publications in the IAEA Nuclear Energy Series provide information in the areas of nuclear power, nuclear fuel cycle, radioactive waste management and decommissioning, and on general issues that are relevant to all of the above mentioned areas. The structure of the IAEA Nuclear Energy Series comprises three levels: 1 — Basic Principles and Objectives; 2 — Guides; and 3 — Technical Reports.
The Nuclear Energy Basic Principles publication describes the rationale and vision for the peaceful uses of nuclear energy.
Nuclear Energy Series Objectives publications explain the expectations to be met in various areas at different stages of implementation.
Nuclear Energy Series Guides provide high level guidance on how to achieve the objectives related to the various topics and areas involving the peaceful uses of nuclear energy.
Nuclear Energy Series Technical Reports provide additional, more detailed, information on activities related to the various areas dealt with in the IAEA Nuclear Energy Series.
The IAEA Nuclear Energy Series publications are coded as follows: NG — general; NP — nuclear power; NF — nuclear fuel; NW — radioactive waste management and decommissioning. In addition, the publications are available in English on the IAEA’s Internet site:
http://www.iaea.org/Publications/index.html
For further information, please contact the IAEA at PO Box 100, Vienna International Centre, 1400 Vienna, Austria.
All users of the IAEA Nuclear Energy Series publications are invited to inform the IAEA of experience in their use for the purpose of ensuring that they continue to meet user needs. Information may be provided via the IAEA Internet site, by post, at the address given above, or by email to [email protected].
ADVANCES IN AIRBORNE AND GROUND GEOPHYSICAL METHODS
FOR URANIUM EXPLORATION

AFGHANISTANALBANIAALGERIAANGOLAARGENTINAARMENIAAUSTRALIAAUSTRIAAZERBAIJANBAHRAINBANGLADESHBELARUSBELGIUMBELIZEBENINBOLIVIABOSNIA AND HERZEGOVINABOTSWANABRAZILBULGARIABURKINA FASOBURUNDICAMBODIACAMEROONCANADACENTRAL AFRICAN
REPUBLICCHADCHILECHINACOLOMBIACONGOCOSTA RICACÔTE D’IVOIRECROATIACUBACYPRUSCZECH REPUBLICDEMOCRATIC REPUBLIC
OF THE CONGODENMARKDOMINICADOMINICAN REPUBLICECUADOREGYPTEL SALVADORERITREAESTONIAETHIOPIAFIJIFINLANDFRANCEGABONGEORGIAGERMANYGHANAGREECE
GUATEMALAHAITIHOLY SEEHONDURASHUNGARYICELANDINDIAINDONESIAIRAN, ISLAMIC REPUBLIC OF IRAQIRELANDISRAELITALYJAMAICAJAPANJORDANKAZAKHSTANKENYAKOREA, REPUBLIC OFKUWAITKYRGYZSTANLAO PEOPLE’S DEMOCRATIC
REPUBLICLATVIALEBANONLESOTHOLIBERIALIBYALIECHTENSTEINLITHUANIALUXEMBOURGMADAGASCARMALAWIMALAYSIAMALIMALTAMARSHALL ISLANDSMAURITANIAMAURITIUSMEXICOMONACOMONGOLIAMONTENEGROMOROCCOMOZAMBIQUEMYANMARNAMIBIANEPALNETHERLANDSNEW ZEALANDNICARAGUANIGERNIGERIANORWAYOMANPAKISTANPALAU
PANAMAPAPUA NEW GUINEAPARAGUAYPERUPHILIPPINESPOLANDPORTUGALQATARREPUBLIC OF MOLDOVAROMANIARUSSIAN FEDERATIONRWANDASAUDI ARABIASENEGALSERBIASEYCHELLESSIERRA LEONESINGAPORESLOVAKIASLOVENIASOUTH AFRICASPAINSRI LANKASUDANSWAZILANDSWEDENSWITZERLANDSYRIAN ARAB REPUBLICTAJIKISTANTHAILANDTHE FORMER YUGOSLAV
REPUBLIC OF MACEDONIATOGOTRINIDAD AND TOBAGOTUNISIATURKEYUGANDAUKRAINEUNITED ARAB EMIRATESUNITED KINGDOM OF
GREAT BRITAIN AND NORTHERN IRELAND
UNITED REPUBLICOF TANZANIA
UNITED STATES OF AMERICAURUGUAYUZBEKISTANVENEZUELAVIETNAMYEMENZAMBIAZIMBABWE
The following States are Members of the International Atomic Energy Agency:
The Agency’s Statute was approved on 23 October 1956 by the Conference on the Statute of the
IAEA held at United Nations Headquarters, New York; it entered into force on 29 July 1957. The Headquarters of the Agency are situated in Vienna. Its principal objective is “to accelerate and enlarge the contribution of atomic energy to peace, health and prosperity throughout the world’’.
ADVANCES IN AIRBORNE AND GROUND GEOPHYSICAL METHODS
FOR URANIUM EXPLORATION
IAEA NUCLEAR ENERGY SERIES No. NF-T-1.5
INTERNATIONAL ATOMIC ENERGY AGENCYVIENNA, 2013

IAEA Library Cataloguing in Publication Data
Advances in airborne and ground geophysical methods for uranium exploration. — Vienna : International Atomic Energy Agency, 2013.
p. ; 29 cm. — (IAEA nuclear energy series, ISSN 1995–7807 ; no. NF-T-1.5)
STI/PUB/1558ISBN 978–92–0–129010–6Includes bibliographical references.
1. Uranium ores — Geology. 2. Radioactive waste sites — Cleanup. 3. Radiation —Measurement — Instruments. I. International Atomic Energy Agency. II. Series.
IAEAL 12–00778
COPYRIGHT NOTICE
All IAEA scientific and technical publications are protected by the terms of the Universal Copyright Convention as adopted in 1952 (Berne) and as revised in 1972 (Paris). The copyright has since been extended by the World Intellectual Property Organization (Geneva) to include electronic and virtual intellectual property. Permission to use whole or parts of texts contained in IAEA publications in printed or electronic form must be obtained and is usually subject to royalty agreements. Proposals for non-commercial reproductions and translations are welcomed and considered on a case-by-case basis. Enquiries should be addressed to the IAEA Publishing Section at:
Marketing and Sales Unit, Publishing SectionInternational Atomic Energy AgencyVienna International CentrePO Box 1001400 Vienna, Austriafax: +43 1 2600 29302tel.: +43 1 2600 22417email: [email protected] http://www.iaea.org/books
© IAEA, 2013
Printed by the IAEA in AustriaApril 2013
STI/PUB/1558

FOREWORD
One of the IAEA’s statutory objectives is to “seek to accelerate and enlarge the contribution of atomic energy to peace, health and prosperity throughout the world”. One way this objective is achieved is through the publication of a range of technical series. Two of these are the IAEA Nuclear Energy Series and the IAEA Safety Standards Series.
According to Article III.A.6 of the IAEA Statute, the safety standards establish “standards of safety for protection of health and minimization of danger to life and property.” The safety standards include the Safety Fundamentals, Safety Requirements and Safety Guides. These standards are written primarily in a regulatory style, and are binding on the IAEA for its own programmes. The principal users are the regulatory bodies in Member States and other national authorities.
The IAEA Nuclear Energy Series comprises reports designed to encourage and assist R&D on, and application of, nuclear energy for peaceful uses. This includes practical examples to be used by owners and operators of utilities in Member States, implementing organizations, academia, and government officials, among others. This information is presented in guides, reports on technology status and advances, and best practices for peaceful uses of nuclear energy based on inputs from international experts. The IAEA Nuclear Energy Series complements the IAEA Safety Standards Series.
According to current estimates, after 2050 available resources and cumulative uranium demand are expected to be balanced. Recent annual uranium production constitutes 65–75% of annual nuclear energy uranium requirements worldwide. With typical timeframes of between 15 and 40 years from the commencement of uranium exploration activities until uranium production, together with increasingly favourable uranium prices, many countries have seen a rise in uranium exploration activities since 2005. This experience and assessment of global energy needs support continued uranium exploration through the use of effective exploration techniques. Geophysical methods with the capability of mapping surface and subsurface parameters in relation to uranium deposition and accumulation are proving to be vital components of current exploration efforts around the world.
There is continuous development and improvement of technical and scientific disciplines using measuring instruments and spatially referenced data processing techniques. Newly designed geophysical instruments and their applications in uranium exploration are contributing to an increased probability of successful discoveries. Dissemination of information on advances in geophysical techniques encourages new strategies and promotes new approaches toward uranium exploration. Meetings and conferences organized by the IAEA, collecting the experience of participating countries, as well as its publications and the International Nuclear Information System, play an important role in the dissemination of knowledge of all aspects of the nuclear fuel cycle.
The purpose of this report is to highlight advances in airborne and ground geophysical techniques, succinctly describing modern geophysical methods and demonstrating the application of techniques through examples. The report also provides some basic concepts of radioactivity, nuclear radiation and interaction with matter.
The IAEA acknowledges the valuable contributions of the consultants in the preparation of this report. The IAEA officers responsible for this report were J. Slezak and A. Hanly of the Division of Nuclear Fuel Cycle and Waste Technology.

EDITORIAL NOTE
Although great care has been taken to maintain the accuracy of information contained in this publication, neither the IAEA nor its Member States assume any responsibility for consequences which may arise from its use.
The use of particular designations of countries or territories does not imply any judgement by the publisher, the IAEA, as to the legal status of such countries or territories, of their authorities and institutions or of the delimitation of their boundaries.
The mention of names of specific companies or products (whether or not indicated as registered) does not imply any intention to infringe proprietary rights, nor should it be construed as an endorsement or recommendation on the part of the IAEA.

CONTENTS
1. INTRODUCTION . . . . . . . . . . . . . . . . . . . . . . . . . . . . . . . . . . . . . . . . . . . . . . . . . . . . . . . . . . . . . . . . . . . 1
2. STATUS OF NUCLEAR ENERGY AROUND THE WORLD . . . . . . . . . . . . . . . . . . . . . . . . . . . . . . . 2
3. RADIOACTIVE RAW MATERIALS . . . . . . . . . . . . . . . . . . . . . . . . . . . . . . . . . . . . . . . . . . . . . . . . . . . 3
4. URANIUM AND THORIUM DEPOSITS . . . . . . . . . . . . . . . . . . . . . . . . . . . . . . . . . . . . . . . . . . . . . . . . 3
5. URANIUM EXPLORATION METHODS . . . . . . . . . . . . . . . . . . . . . . . . . . . . . . . . . . . . . . . . . . . . . . . 5
6. GEOPHYSICAL METHODS FOR URANIUM EXPLORATION . . . . . . . . . . . . . . . . . . . . . . . . . . . . . 6
6.1. Radiometric methods . . . . . . . . . . . . . . . . . . . . . . . . . . . . . . . . . . . . . . . . . . . . . . . . . . . . . . . . . . . . 66.1.1. Radioactivity . . . . . . . . . . . . . . . . . . . . . . . . . . . . . . . . . . . . . . . . . . . . . . . . . . . . . . . . . . . . 76.1.2. Nuclear radiation and interaction with matter . . . . . . . . . . . . . . . . . . . . . . . . . . . . . . . . . . . 76.1.3. Radiometric instruments . . . . . . . . . . . . . . . . . . . . . . . . . . . . . . . . . . . . . . . . . . . . . . . . . . . 86.1.4. Quantities and units . . . . . . . . . . . . . . . . . . . . . . . . . . . . . . . . . . . . . . . . . . . . . . . . . . . . . . . 86.1.5. Radioactivity of rocks . . . . . . . . . . . . . . . . . . . . . . . . . . . . . . . . . . . . . . . . . . . . . . . . . . . . . 86.1.6. Gamma survey . . . . . . . . . . . . . . . . . . . . . . . . . . . . . . . . . . . . . . . . . . . . . . . . . . . . . . . . . . . 106.1.7. Radon survey . . . . . . . . . . . . . . . . . . . . . . . . . . . . . . . . . . . . . . . . . . . . . . . . . . . . . . . . . . . . 13
6.2. Electrical and electromagnetic methods . . . . . . . . . . . . . . . . . . . . . . . . . . . . . . . . . . . . . . . . . . . . . 146.2.1. Resistivity methods . . . . . . . . . . . . . . . . . . . . . . . . . . . . . . . . . . . . . . . . . . . . . . . . . . . . . . . 156.2.2. Electrochemical methods . . . . . . . . . . . . . . . . . . . . . . . . . . . . . . . . . . . . . . . . . . . . . . . . . . . 166.2.3. Electromagnetic methods . . . . . . . . . . . . . . . . . . . . . . . . . . . . . . . . . . . . . . . . . . . . . . . . . . . 166.2.4. Application of electrical and electromagnetic methods to uranium exploration . . . . . . . . 17
6.3. Gravity prospecting . . . . . . . . . . . . . . . . . . . . . . . . . . . . . . . . . . . . . . . . . . . . . . . . . . . . . . . . . . . . . 186.4. Magnetic prospecting . . . . . . . . . . . . . . . . . . . . . . . . . . . . . . . . . . . . . . . . . . . . . . . . . . . . . . . . . . . . 196.5. Seismic prospecting . . . . . . . . . . . . . . . . . . . . . . . . . . . . . . . . . . . . . . . . . . . . . . . . . . . . . . . . . . . . . 206.6. Well logging . . . . . . . . . . . . . . . . . . . . . . . . . . . . . . . . . . . . . . . . . . . . . . . . . . . . . . . . . . . . . . . . . . . 226.7. Remote sensing . . . . . . . . . . . . . . . . . . . . . . . . . . . . . . . . . . . . . . . . . . . . . . . . . . . . . . . . . . . . . . . . 23
7. ADVANCES IN GEOPHYSICS . . . . . . . . . . . . . . . . . . . . . . . . . . . . . . . . . . . . . . . . . . . . . . . . . . . . . . . 24
7.1. Advances in radiometric methods . . . . . . . . . . . . . . . . . . . . . . . . . . . . . . . . . . . . . . . . . . . . . . . . . . 247.2. Advances in electrical and electromagnetic methods . . . . . . . . . . . . . . . . . . . . . . . . . . . . . . . . . . . 277.3. Advances in gravity methods . . . . . . . . . . . . . . . . . . . . . . . . . . . . . . . . . . . . . . . . . . . . . . . . . . . . . . 297.4. Advances in magnetic methods . . . . . . . . . . . . . . . . . . . . . . . . . . . . . . . . . . . . . . . . . . . . . . . . . . . . 297.5. Advances in seismic methods . . . . . . . . . . . . . . . . . . . . . . . . . . . . . . . . . . . . . . . . . . . . . . . . . . . . . 31
8. APPLICATION OF AIRBORNE AND GROUND GEOPHYSICS FOR URANIUMEXPLORATION . . . . . . . . . . . . . . . . . . . . . . . . . . . . . . . . . . . . . . . . . . . . . . . . . . . . . . . . . . . . . . . . . . . . 31
8.1. Review of some IAEA technical meetings . . . . . . . . . . . . . . . . . . . . . . . . . . . . . . . . . . . . . . . . . . . 318.2. Examples of applications . . . . . . . . . . . . . . . . . . . . . . . . . . . . . . . . . . . . . . . . . . . . . . . . . . . . . . . . . 34
8.2.1. Radiometric methods . . . . . . . . . . . . . . . . . . . . . . . . . . . . . . . . . . . . . . . . . . . . . . . . . . . . . . 348.2.2. Electrical and electromagnetic methods . . . . . . . . . . . . . . . . . . . . . . . . . . . . . . . . . . . . . . . 368.2.3. Gravity prospecting . . . . . . . . . . . . . . . . . . . . . . . . . . . . . . . . . . . . . . . . . . . . . . . . . . . . . . . 438.2.4. Magnetic prospecting . . . . . . . . . . . . . . . . . . . . . . . . . . . . . . . . . . . . . . . . . . . . . . . . . . . . . . 438.2.5. Seismic prospecting . . . . . . . . . . . . . . . . . . . . . . . . . . . . . . . . . . . . . . . . . . . . . . . . . . . . . . . 448.2.6. Well logging . . . . . . . . . . . . . . . . . . . . . . . . . . . . . . . . . . . . . . . . . . . . . . . . . . . . . . . . . . . . . 50

FURTHER READING . . . . . . . . . . . . . . . . . . . . . . . . . . . . . . . . . . . . . . . . . . . . . . . . . . . . . . . . . . . . . . . . . . . . 52REFERENCES . . . . . . . . . . . . . . . . . . . . . . . . . . . . . . . . . . . . . . . . . . . . . . . . . . . . . . . . . . . . . . . . . . . . . . . . . . 53CONTRIBUTORS TO DRAFTING AND REVIEW . . . . . . . . . . . . . . . . . . . . . . . . . . . . . . . . . . . . . . . . . . . . 57STRUCTURE OF THE IAEA NUCLEAR ENERGY SERIES . . . . . . . . . . . . . . . . . . . . . . . . . . . . . . . . . . . . 58

1. INTRODUCTION
Based on 2009 data, the OECD Nuclear Energy Agency’s (OECD/NEA’s) estimate of cumulative uranium demand and resource levels shows that after 2050, available resources and cumulative uranium requirements are expected to be balanced [1]. As of 2009, annual uranium production was approximately 75% of annual nuclear energy uranium requirements worldwide. McMurray [2] introduced examples of timeframes spanning several decades from the start of exploration to discovery and then on to commencement of production at nine deposits in five different countries.
The history of IAEA publications related to uranium exploration and deposit geology, geochemistry and geophysics spans 40 years, starting with a Panel Proceedings publication on uranium exploration geology in 1970, followed by numerous volumes on uranium metallogeny and deposit models in the 1980s, and finally, more recently, conference proceedings focused on exploration discovery and technology case studies (Fig. 1). Throughout this history, there were approximately 11 publications related to exploration methods and instrumentation, including 8 publications specifically related to uranium exploration geophysics with a particular focus on radiometry.
This publication is the most recent IAEA technical documentation related to the field of uranium exploration, highlighting advances in airborne and ground geophysical methods. The purpose of this report is to provide a description of geophysical methods in uranium exploration, to present several relevant advances in geophysics and to provide some evidence of advances in airborne and ground geophysics for uranium exploration through selected examples from industry and government entities. Exploration geophysics can be divided into several subdisciplines that study radiometric methods; electrical and electromagnetic methods; gravity, magnetic, seismic prospecting; well logging; and remote sensing. This publication describes developments in uranium exploration geophysics from these perspectives. It should be treated as a brief overview and snapshot of the state of the art of uranium exploration geophysics and, thus, readers should not infer that all specific technologies have been identified here. The goal is to provide readers with enough information to continue their investigation of these modern methods.
The role of geophysics in uranium exploration is varied and supports the development of geological model systems in support of uranium exploration through the definition of lithological, structural and alteration characteristics of metallogenic environments under evaluation. Recent developments in airborne and ground
FIG. 1. IAEA publications on uranium geology and exploration.
1

geophysics have responded to several factors including the resurgence of worldwide uranium exploration in the first decade of the 21st century, interest in exploring for economic uranium deposits in previously explored terrains but in more detail, and exploring for economic uranium deposits that are buried by shallow surface cover or projected to occur at greater depths. Some technological developments that have facilitated the innovation of new geophysical techniques include the development of global positioning systems and computer programmes that permit rapid data processing, data modelling and data inversion. In addition, geographical information systems are now commonly used by geoscientists to integrate geological, geochemical and geophysical data sets for synergistic compilation and interpretation in uranium exploration on regional, local and detailed exploration project scales. Table 1 is a brief summary of the new developments in uranium exploration geophysics that will be described in this report.
2. STATUS OF NUCLEAR ENERGY AROUND THE WORLD
Long term trends of an increasing global population and predicted economic growth are increasing the demand for world energy resources. According to the International Energy Agency’s World Energy Outlook 2007 [3], which assumes that governments around the world maintain current energy policies, the world’s primary energy needs are projected to grow by 55% between 2005 and 2030 at an average annual rate of 1.8%. Estimated global
TABLE 1. INNOVATIONS IN GEOPHYSICAL METHODS FOR URANIUM EXPLORATION
Method Application Innovation
Radiometric Uranium prospecting Lightweight, sensitive, field spectrometers and total count rate meters
Uranium prospecting and geological mapping
High resolution airborne systems; spectral smoothing techniques; global baseline
Borehole logging Borehole probes that are unaffected by uranium disequilibrium
Radon Detecting buried U occurrences Instruments differentiating radon and thoron
E, EM, MT (electrical, electromagnetic, magnetotellurics)
Mapping lithology, structure, alteration and topography
High resolution and deep penetrating systems;2-D and 3-D inversion techniques
Gravity Mapping lithology, structure, alteration and topography
3-D modelling; airborne gradiometry systems permit rapid regional assessments
Magnetic Mapping lithology, structure and alteration
High-resolution airborne gradiometry systems;3-D modelling
Seismic Mapping lithology, structure and alteration, and topography
Regional seismic, borehole seismic, 3-D seismic
Remote sensing Mapping lithology, structure and alteration, and topography
High-resolution, high-precision, multispectral spaceborne and airborne imagery
GPS Global Positioning System Increased geographical precision in data collection
Software Geophysical data processing Development of geological model systems for exploration through geophysical data inversion
GIS and image analysis Geographic Information Systems; visualization and interpretation
Integrated interpretation of geological, geophysical and geochemical datasets
2

resources for electricity generation based on coal (39%), gas (20%), hydroenergy (16%), nuclear energy (16%), oil (7%) and other renewable sources (2%) [1] may be regarded as inadequate to meet the increasing energy needs of the future. Recognition by many governments that nuclear power can produce secure, competitively priced electricity, essentially free of greenhouse gas emissions, has increased the prospects for growth in nuclear energy. The implementation of nuclear energy is tied to the nuclear fuel cycle and assurance of nuclear raw material resources.
A report on the production of and demand for world uranium resources jointly prepared by the OECD/NEA and the IAEA, commonly known as the “Red Book”, reports in its 2009 edition [1] that a total of 438 commercial nuclear reactors are operating with a net generating capacity of about 373 GW(e). As of 1 January 2009, estimates are that these reactors require approximately 59 065 t U per year for continued operation. By the year 2035, world nuclear capacity is projected to grow to between 511 GW(e) and 782 GW(e) net, with annual world reactor-related uranium requirements projected to rise to between 87 370 t U and 138 165 t U. As is stated in the 2009 Red Book [1],key factors that will influence future world nuclear energy capacity include projected baseload electricity demand, non-proliferation concerns, public acceptance of nuclear energy, waste management strategies and economic competitiveness of nuclear power plants (nuclear power plants) compared with other energy sources. In April 2008, UraNews 2008 [4] described the current status of 439 nuclear reactors in operation worldwide as having a total installed capacity of 372 GW(e) and an annual (2008) fuel requirement of 64 615 t U. According to the World Nuclear Association (WNA), there are plans or proposals for another 349 reactors, including the 31 currently under construction.
3. RADIOACTIVE RAW MATERIALS
Any natural radioactive element applicable for industrial use or otherwise in the life cycle can be designated a radioactive raw material. Currently, the primary use of natural radioactive materials is in the nuclear industry. The natural radionuclides of uranium and thorium can be used at nuclear power plants for electricity generation. Nuclear energy uses a controlled fission reaction to generate heat. The fissile isotope in uranium fuel is 235U, while thorium is used as fertile material for breeding fissile 233U in thorium fuel. Nuclear power reactors rely on heat producing steam that drives conventional turbines and generates electricity. A majority of nuclear power plants use uranium as nuclear fuel, however some other technologies developed show that other sources can also be used. Data from the 2009 Red Book [1] indicates the location, extent and type of uranium resources as well as various aspects of its use. In their study on the thorium potential in Norway, Kara et al. provide fundamental information on thorium resources, the front end of the thorium fuel cycle, nuclear reactors for thorium, radiation protection of man and the environment, and economical aspects of the use of thorium as a nuclear fuel [5].
Both uranium and thorium as well as their decay products are sources of gamma radiation and release the radioactive gas radon. Exploration for these minerals is carried out by various geological and geophysical techniques, including airborne, ground and subsurface geophysical surveys. Gamma ray spectrometry, radon surveys and other geophysical methods have proved to be cost-effective and efficient exploration techniques as well.
4. URANIUM AND THORIUM DEPOSITS
A resource refers to a situation where metals or minerals are enriched. The resources can be developed to a reserve (or deposit) when further investigations prove that the enrichment can be economically exploitable. This also implies that the metal or mineral can be recovered using a viable process. The OECD/NEA–IAEA resource
3

classification system recognizes identified resources, which imply reasonably assured resources (RAR) and inferred resources, as well as undiscovered resources, which imply predicted and speculative resources.
The IAEA classifies uranium resources on the basis of their geological setting according to the following styles of mineralization. These are arranged according to their approximate economic significance:
— Unconformity related deposits;— Sandstone deposits;— Hematite breccia complex deposits;— Quartz-pebble conglomerate deposits;— Vein deposits;— Intrusive deposits;— Volcanic and caldera-related deposits;— Metasomatite deposits;— Surficial deposits;— Collapse breccia pipe deposits;— Phosphorite deposits;— Other types of deposits;— Rock types with elevated uranium content.
In 1995, the IAEA published the World Distribution of Uranium Deposits atlas. This was accompanied by a guidebook with brief descriptions of 582 deposits in 48 countries, their districts or provinces and their geological characteristics [6]. Analysis of this comprehensive data on uranium deposits (each containing at least 500 t U) demonstrates the spatial distribution of uranium by deposit type and age [7].
An illustrative presentation on uranium deposits in Australia [8] describes hematite breccia, complex unconformity, sandstone and calcrete type deposits. Summary information on uranium potential and projected exploration for the Australian continent was given by Lambert [9].
The structural position and source of origin of tertiary-related uranium deposits in the USA is discussed by Otton [10]. A map of the distribution of uranium deposits in India and their relation to geological setting shows the variability in genesis and environment [11]. World unconformity related uranium deposits located in Canada and Australia have been described by many authors. A recent comprehensive list of the extent, grade and activity of uranium deposits can be found in UDEPO [6], while technical specifications of single deposits and mines and their parameters are provided by countries in the Red Book 2009 [1]. A book on uranium ore deposits with numerous figures and tables was written by Dahlkamp [12]. Systematic descriptions can also be found in IUREP (the joint OECD/NEA–IAEA International Uranium Resources Evaluation Project) reports.
Total identified resources of uranium in 2009 increased to about 5 404 000 t U in the <US $130/kg U category and 6 306 300 t U in the <US $260/kg U category and are sufficient for medium term future needs [1].
Thorium, an abundant and widely dispersed element, could also be used as a nuclear fuel resource. Many of the largest identified thorium resources were discovered during the period of exploration for carbonatites and alkaline igneous bodies for uranium, rare Earth elements, niobium, phosphate and titanium. Today, thorium is recovered mainly from the mineral monazite as a by-product of processing heavy mineral sand deposits for titanium, zirconium, or tin bearing minerals.
Thorium deposits are found in several countries around the world. The largest thorium reserves are found in Australia, Brazil, India, Norway, Turkey and Venezuela. The 2009 Red Book [1] estimate of thorium identified resources is 2 229 000 t Th and is in general agreement with the US Geological Survey Mineral commodity estimate of 2007. The most important geological environments in which thorium is enriched include:
— Carbonatites;— Placers;— Granitic rocks;— Alkaline complexes.
The average concentration of thorium in the Earth's crust is about 7–12 ppm (parts per million), which is about 2 to 4 times more abundant than uranium, reflecting the difference in half-lives of thorium-232 (1.4 × 10¹⁰
4

years) and uranium-238 (4.5 × 10⁹ years). Thorium (Th) and uranium (U) are accumulated in magmatic processes with the highest concentrations found in silica (SiO2) rich rocks such as granites. The concentration of thorium and uranium in rocks such as gabbro and granite can vary by a factor of more than 10. Due to small variations in their chemical behaviour, thorium and uranium are accumulated along different paths during weathering and near surface geological processes: uranium is mobile under oxidizing conditions and is deposited under reducing conditions while thorium, being less mobile, is often concentrated in heavy mineral sands.
5. URANIUM EXPLORATION METHODS
When forming an exploration strategy, fundamental parameters that must be considered include the physical properties of uranium, its form of mineralization, how it accumulates in the host rock environment, uranium occurrence in rocks acting as a source as well as its age and geological setting. Traditional exploration methods based on the development and experience of the past fifty years rely upon geological, geochemical and geophysical techniques. Geological activities involve appraisal of an area’s uranium potential, geological mapping and revisions of historical work. Geochemical exploration includes collection and analyses of rock, soil and water samples. Geophysical prospecting can be conducted from an aircraft, on the ground or in boreholes. Certain geophysical techniques rely on the radioactivity of uranium deposits and their radioactive halos, while others rely on physical contrasts in electrical resistivity, conductivity and induction as a means of highlighting favourable geological aspects. Other geophysical methods such as gravity, magnetic and seismic surveys, provide scope for investigation of deep subsurface structures and are a valid aid in obtaining geological information in two and three dimensions. It is reasonable to state that borehole logging plays a fundamental role in the estimation of uranium reserves.
Regional scale evaluation of geological terrain is aided by remote sensing surveys, making use of reflectance spectra to identify certain mineral assemblages. A variety of platforms are available to acquire such data, ranging from high-orbit, satellite-based systems to fixed wing aircraft and ground-based portable systems.
A basic exploration strategy could follow a sequence of localizing radioactivity anomalies followed by detailed ground surveys, drilling and logging. Conceptually, it is arguable that most of the world’s outcropping uranium deposits has already been discovered by direct radiometric detection and that surface geological mapping over recent decades limits the possibility of prospecting in many regions throughout the world. Future investigations will require adaptation of novel exploration strategies along with improvements of geophysical survey techniques focused on looking beneath the surface for deep-seated uranium mineralization. In addition, modern exploration methods are increasingly being shaped by tighter economic constraints. Recent major discoveries of subsurface uranium mineralization have substantiated the viability of new methodologies in assessing an area’s uranium potential and the development of strategies for the exploration and application of suitable exploration techniques. Geophysical methods with the ability to identify surface and subsurface uranium mineralization, combined with the identification of favourable geological settings, have proved to be an efficient exploration process. Recent advances in the development of geophysical methods, instruments and data processing techniques support the exploration goal of discovering the next generation of economic deposits.
The general principles and processes of uranium exploration are influenced by a country’s geological setting. Slezak [13] provides a summary of these stages for the Czech Republic. Basic considerations were identification of uranium mineralization within metallogenetic provinces, exploration activities ranging from regional to detailed and an assessment of the economics at each step. The work sequence involved a geological appraisal of uranium potential and development of a uranium occurrence scenario, radiometric prospecting, classification of gamma and radon anomalies, followed by ground verification. At the preliminary exploration stage, uranium anomalies were assessed for extent, grade and location. Estimates of possible mining conditions were undertaken in conjunction with detailed exploration aimed at defining an orebody and its reserves.
5

6. GEOPHYSICAL METHODS FOR URANIUM EXPLORATION
Geophysics is a science engaged in the study of the Earth and its environment by physical methods. Applied geophysics is focused on the study of the Earth’s crust, prospecting for raw materials, investigation of underground objects and rock properties as well as on monitoring of the environment. One advantage of geophysical methods is that, for measurements mostly made at the surface, deductions related to subsurface geological features can be readily made. Widely used geophysical methods include gravimetry, magnetometry and borehole logging as well as geoelectrical, radiometric and seismic techniques.
The physical properties of uranium are a clue to those parameters that will assist in its detection (Table 2). Despite a very high density, uranium mineralization, in all its forms, does not give rise to observable gravity anomalies. Low magnetic susceptibility does not enable the direct detection of uranium by means of magnetic contrast. While the electrical resistivity of uranium is extremely low, uranium mineralization does not manifest itself as a good conductor. In general, uranium minerals cannot be distinguished by electrical conductivity contrasts from neighbouring rocks, however some forms of mineralization are detectable by electrical and electromagnetic methods. Uranium is radioactive, and radiometric methods are the primary detection techniques used during exploration. The application of gravity, magnetic, electrical, electromagnetic and seismic prospecting techniques can significantly enhance the understanding of an area’s subsurface geological setting. The fundamentals of geophysical methods are described in reference publications [14–16].
Geophysical methods of prospecting are carried out from the air, ground and in boreholes. Some of these techniques overcome the logistical difficulty of exploration in remote and inaccessible areas. Long term development of airborne techniques has been progressing in Australia, Canada, the Russian Federation and the USA and other countries for many decades. As a result of its early introduction in the 1950s in these and other countries, the availability of sophisticated and cost-effective airborne prospecting techniques is now widespread. The progression and development of geophysical methods can be linked to improvements in measuring instruments, which has resulted in a more precise and accurate estimate of the geological features of interest.
6.1. RADIOMETRIC METHODS
Nuclear methods used in the analyses of solid, liquid and gaseous components of the lithosphere make an essential contribution to the study of the hard rock environment. Unstable nuclei of atoms decay and simultaneously emit nuclear radiation. Modern radiometric instruments focus on the detection and analysis of emitted radiation, thereby identifying a source qualitatively and quantitatively. Radiometric methods are therefore a primary means for prospecting and evaluating radioactive raw materials and their geological mapping by measuring nuclear radiation. Uranium and thorium are naturally occurring radioactive elements which, through the emission of nuclear radiation, experience spatial isolation and quantification.
TABLE 2. PHYSICAL PROPERTIES OF URANIUM
Physical characteristics Value
Density 19 000 kg/m3
Magnetic properties Uranium is paramagnetic
Electrical resistivity 3 × 10⁻⁷ Ωm (metal uranium), however uranium minerals range 1 to X00 Ωm
Thermal conductivity 27.5 Wm–1 K-1
Young’s modulus 208 GPa
Shear modulus 111 GPa
Melting point 1132ºC
6

6.1.1. Radioactivity
Nuclides are specified by the chemical symbol X, the proton number Z and the mass number A, AX. The atomic nuclei of some isotopes are unstable, disintegrate and form a new isotope. This process is accompanied by emission of particles or energy, termed nuclear radiation. Nuclides with this feature are called radionuclides. The disintegration is fully independent of physical and chemical conditions.
The radioactivity decay law expresses the decrease in the original number of atoms (N0) of a radionuclide with time t
Nt = N0 e–λt (6.1)
where λ (s–1) is the decay constant of a radionuclide. A related constant is the half-life T1/2 (s), which is the time it takes for one half of the atoms to decay.
T1/2 = ln 2/λ (6.2)
The half-life enables an estimate of the decrease in the number of atoms. For example, after time T1/2, a total of 50% of the atoms remain; after 5T1/2, 3% of the atoms remain; after 7T1/2, 1% of the atoms remain; and after 10T1/2, only 0.1% of the original number of atoms remain. The product λN is the activity of a radionuclide.
There are several types of radioactive decay: alpha decay, beta decay, electron capture and spontaneous fission of atoms. The decay of an unstable atom usually leaves the newly formed nucleus in an energy-excited state, and the surplus energy is emitted as gamma radiation.
Radioactive decay is a statistical phenomenon described by Poisson’s distribution. The numbers of atoms of a radionuclide, which decay gradually within a time unit, are not identical, and they exhibit fluctuations. For Poisson’s distribution, it holds that a variance σ2 of a distribution is equal to its mean value, and σ is the standard deviation. Since the number of emitted particles and gamma rays is proportional to the number of disintegrating atoms, identical principles can be applied for radiometric measurements. If N counts are recorded in time t, then the standard deviation of the recorded counts can be estimated using
σ(N) = √N (6.3)
and the fractional standard deviation (error of measurement) is
σ(N)/N = 1/√N (6.4)
Analysis of Eq. (6.4) shows that the precision of radiometric measurements can be increased by increasing the counts N, either by more sensitive instrumentation or by extending the time of measurement, or by improvement of the source–detector geometry.
6.1.2. Nuclear radiation and interaction with matter
There are natural and human made sources of radiation. Potassium, uranium and thorium are naturally occurring radioactive elements found in abundance in the rocks throughout the world. The emitted radiation of these elements is relatively intense and easily measured in the field. Uranium isotopes 238U and 235U, and thorium isotope 232Th are primary elements of the natural decay series.
Alpha radiation is a flux of positively charged alpha particles of relatively great mass (2 protons + 2 neutrons). Alpha radiation exhibits high ionization. The penetration range in matter is low; in air, it is less than 10–1 m, and the energy is specific for a particular radionuclide.
Beta radiation is a flux of electrons. The penetration range is about 8 m in air and 1 cm in rocks.Gamma radiation is electromagnetic, and its rays are specific for a particular radionuclide. The photoelectric
effect, Compton scattering and pair production are the principal processes by which gamma rays interact with atoms of matter. Their cross-section (probability of interaction) is a function of their energy and the elemental composition
7

of the matter. The distances travelled by gamma rays emitted from natural radionuclides are about 700 m in air and 0.5 m in rocks.
Cosmic radiation is composed of high energy charged particles (mostly protons) that interact with the atmosphere to generate secondary particles and energy quanta. Due to the non-terrestrial nature of cosmic radiation and absorption by the Earth’s atmosphere, there is a strong increase in intensity with rising altitude.
6.1.3. Radiometric instruments
The process of measuring radiation is achieved through its ionizing properties. Radiometric sensors convert radiation to an electrical signal, which is then counted and summed over a set time interval. The sensor performing the conversion is called a detector.
Various types of detectors are used in radiometric instruments, depending on the type of radiation under investigation. Ionization chambers are mainly used for the detection of alpha radiation. Proportional counters are used for the detection of X rays and gamma rays. Geiger–Müller (GM) counters detect gamma rays at high levels of radiation and are sometimes used as borehole detectors in the investigation of high grade uranium deposits. Another type of detector is the scintillation counter consisting of scintillator and photomultiplier whereby an incident particle of radiation passes through the scintillation crystal, generating a photon of visible light (scintillation). Photons are converted to electrons in a photomultiplier to produce an electrical signal with the resultant voltage being proportional to the energy of the incident particle. Scintillation detectors made from NaI(Tl) crystals are widely used in airborne, ground, borehole and laboratory gamma ray detectors. Alternative scintillation materials such as CsI(Tl) and BGO (bismuth–germanium–oxygen) are also used for gamma ray detection with applications in more specialized measuring conditions. The scintillation substance ZnS(Ag) serves for detection of alpha rays and is widely used in radon surveys. High-resolution germanium semiconductor detectors measure gamma rays while silicon based semiconductor detectors are suitable for alpha spectrometry. The nature and character of the observed radiation governs the selection of a suitable detector. The performance parameters of a detector are detection efficiency, sensitivity, energy resolution and dead time.
Electrical signals produced at the output of a detector are adapted, analysed and counted by the radiometric instrument. Total count (TC) instruments detect and record all radiation particles of energy above a discrimination threshold of the instrument. TC instruments provide quantitative information on the radiation field without discrimination of a particle’s energy. In contrast to this, spectrometers distinguish the energy of incident particles and provide qualitative and quantitative information on the radiation field and the source (radionuclide) of radiation.
Gamma ray spectrometers are widely used for uranium exploration and radiometric mapping. A threshold gamma ray spectrometer will record energies of gamma rays exceeding an adjustable
discrimination threshold. Multichannel differential gamma ray spectrometers analyse and record discrete energies of incident gamma rays into separate energy windows (channels). Multichannel gamma ray spectrometers are capable of distinguishing and recording concentrations of K, U and Th. A detailed description of radiometric instruments can be found in the IAEA publication cited in Ref. [17].
6.1.4. Quantities and units
Physical quantities and units in atomic and nuclear physics have been adopted and specified by the International Organization for Standardization [18, 19]. A selection of basic radiometric quantities and units most frequently applied in exploration are presented in Table 3. Conventional units used in the field of geology and geophysics are provided in Table 4.
6.1.5. Radioactivity of rocks
Potassium (K) is present in the Earth’s upper crust in concentrations of between 2.0 and 2.5%. It is a widespread element in the lithosphere with the highest concentrations occurring in magmatic and metamorphic rocks containing potassium feldspars, leucite, nepheline, biotite, muscovite, sericite and phlogopite. An increased concentration of potassium is common for clays in sedimentary rocks and is associated with hydrothermal
8

alteration in some uranium deposits. Potassium has three isotopes with 40K being radioactive and having a half-life of 1.3 ×10⁹ years. Potassium in rocks is mobile under different physical and geochemical conditions.
Uranium (U) has an average crustal abundance of 2–3 ppm and occurs in most rock types. Minerals with uranium as a major constituent include uraninite (pitchblende), betafite, coffinite and several others, while those with uranium as a minor constituent include zircon, xenotime, monazite, orthite, apatite, and sphene. Uranium has three radioactive isotopes 238U (99.274%, T1/2 = 4.5 × 10⁹ years), 235U (0.720%, T1/2 = 7.13 × 10⁸ years) and 234U (0.006%). Uranium in its hexavalent state (U6+) is mobile in the geological environment and as a result, the radioactive equilibrium between 238U and 226Ra in the 238U decay series is often disturbed. It takes about 1 million years for radioactive equilibrium to be established.
Thorium (Th) has an average crustal abundance of 7–12 ppm. Thorium occurs as an accessory constituent in the mining of monazite, allanite, zircon, sphene, xenotime and apatite. The thorium decay series commences with 232Th (T1/2 = 1.4 × 10¹⁰ years). Thorium in a tetravalent state (Th4+) exhibits low solubility. Approximately 67 years is required to establish radioactive equilibrium in the thorium decay series.
TABLE 3. SI DERIVED UNITS OF RADIOACTIVITY APPLICABLE TO GEOSCIENCES
Quantity SymbolUnit
NoteName Dimension
Activity A becquerel Bq 1 Bq = 1 decay per second
Specific activity am becquerel per kilogram Bq/kg Radioactivity of unit mass(rocks, building materials)
Activity concentration cA becquerel per cubic metre Bq/m3 (radioactivity of gases and liquids)
Dose D gray Gy Energy of nuclear radiation imparted to unit mass,1 Gy = 1 J/kg
Dose rate D' gray per second Gy/snGy/h
Ratio of incremental dose to the time intervalD' = dD/dt(applicable to terrestrial radiation)
Dose equivalent H sievert Sv Biological effects of radiation on tissueH = DQ (Q quality factor of radiation)
Equivalent dose HT sievert Sv Biological effects of radiation on tissueHT = wRDTR (wR is radiation weighting factor,DTR is the absorbed dose in tissue)
Effective dose E sievert Sv Biological effects of radiation to manE = wTHT
(wT is an organ weighting factor)
Quality factors of radiation: Alpha radiation Q = 20(Simplified) Beta radiation Q = 1
Gamma radiation Q = 1Neutron radiation Q = 10
TABLE 4. CONVENTIONAL UNITS APPLICABLE TO GEOSCIENCES
Subject Unit Note
Mass concentration of potassium in rocks % K
Mass concentration of uranium and thorium ppm 1 ppm = 10–6 grams per 1 gram of rock
Terrestrial gamma radiation nGy/h Radiometric maps
Radon in water Bq/litre, Bq/m3
Radon in soil gas kBq/m3
9
Radioactivity of magmatic rocks tends to increase with the acidity of rocks. Granite, granodiorite and syenite are usually highly radioactive, while basic and ultrabasic rocks are characterized by extremely low radioactivity. The radioactivity of sedimentary rocks is mostly related to the composition of material undergoing sedimentation. Enhanced radioactivity has been observed in clays, phosphates, potassium salts and bituminous sediments. Limestones, gypsum and quarzites all belong to the least radioactive sediments. The radioactivity of metamorphosed rocks corresponds predominantly to the primary material. Injection metamorphism can enhance or reduce the radioactivity, in dependence of the nature of the injected material. Some orthogneisses and injection migmatites display fairly high activity, whereas amphibolites and serpentinites belong to the least radioactive. The presence of radioactive elements in soils is mostly governed by the parent rock and climatic conditions of the region. Depending on the solubility of radioactive elements and the direction of water inflow or evaporation, the soils may be either enriched or depleted by single radionuclides. General trends show a 0–30% relative decrease in radioactive elements in soils with respect to the radioactive elements in the geological basement [17, 20]. Natural radionuclides contained in rocks also affect the radioactivity of the underground water and soil gas.
6.1.6. Gamma survey
Many natural radionuclides that originated during the nuclear synthesis of the Earth emit gamma radiation. With respect to their abundances and emission of gamma radiation, the most important elements contained in crustal rocks that make up the bulk of measurable terrestrial gamma radiation are potassium, uranium and thorium.
The measured field of gamma rays above the Earth’s surface I is a sum of the radioactivity of rocks Irocks, cosmic rays Icosm, atmospheric radon Iradon, and instrument minute radiation Iinstr. In areas influenced by nuclear fallout, consideration must also be given to gamma ray emissions from 137Cs (T1/2 = 30.1 years, Eγ 0.662 MeV). The total measured radiation can be represented by the equation
I = Irocks + Icosm + Iradon + Iinstr + ICs (6.5)
Radiation not originating from the Earth’s surface is regarded as “background” (IBG = Icosm + I radon + I instr) and along with ICs, is removed during data processing.
The dispersion of gamma radiation above various geological sources (Irocks) depends on that source's shape, physical dimensions and on the detector – source geometry. Gamma radiation of a point source (small geological object) with a radioelement mass m, is reduced by the square of the source – detector distance r (m), and attenuated by the mass of environment of this path; attenuation for given energy of gamma rays is specified by the linear attenuation coefficient μ (m-1).
I = (km/r2) * e-μr (6.6)
where k is the constant expressing gamma radiation of a particular radionuclide. The gamma ray field of an infinite geological body is attenuated at height h, according to the equation
Ih = I0 * E2(μh) (6.7)
where E2(μh) is the integral exponential function of the second kind for the argument μh. While attenuation of gamma rays with the distance r from a point source is significant, radioactivity over an infinite rock source (the Earth’s surface) at the altitude of h = 80 m is approximately one half of the ground value I0. More information on the field of gamma radiation and the geometry of measurement can be found in reference literature [14, 17, 21].
Penetration of gamma radiation through a solid rock environment is very limited. Consequently an airborne or ground gamma ray survey will only record radioactivity emanating from surface materials to a depth of about 0.5 m.
Environmental factors can significantly affect the observed gamma ray field. Elements such as a weathering overburden or dense vegetation can significantly reduce the radiation from underlying rocks. Atmospheric radon, accumulated under temperature inversion layers close to the ground can change the radon background signal during the day. An increase in soil moisture content will attenuate any gamma ray emissions from K, U and Th sources. On the other hand, the increased soil moisture reduces the fraction of 222Rn emanating from soil, which may result in a buildup of gamma radiation originating from radon decay products. Precipitation can have a major effect on
10

uranium estimation. Decay products of atmospheric 222Rn, which are attached to dust particles, are washed down and accumulate on the Earth’s surface and can significantly enhance the surface radioactivity. Since airborne, car-borne and ground radiometric instruments are calibrated for the 2π surface geometry (ω = 2π sr), any change in field topography can have positive or negative effects on data. A series of corrections must be applied to suppress the environmental effects on gamma surveying.
Radiometric anomalies are the first goal in prospecting for uranium and are defined within the background of varying field levels. The simplest method for estimating anomalies is based on the use of three standard deviation levels of the mean recorded data. Approaches that are more sophisticated make use of statistical data processing leading to separation of useful and background signals.
Gamma ray surveying is conducted as a total count survey or gamma ray spectrometry. Total count surveys (TC) with scintillation count rate meters are applied to ground measurements and to borehole logging. The relationship between the recorded count rate, nTC (counts/s), and the concentration of K, U, and Th in the ground is given by
nTC = sKcK + sUcU + sThcTh + nBG (6.8)
where sK, sU, sTh are the sensitivities of the TC instruments (counts/s per unit concentration of relevant radionuclide), and cK, cU, and cTh are K, U, and Th radioelement concentrations. Sensitivities can be estimated by measuring the TC response over calibration pads or over three selected geological bodies that have different K, U, and Th concentrations. The background count rate, nBG, is estimated by measurement over a large body of water. The results of a TC survey can be expressed either in equivalent uranium concentration (ppm eU), calculated as nTC/sU, or in gamma dose rate (nGy/h). The latter requires an appropriate calibration using a pressurized ionization chamber or suitable rocks. A normal terrestrial dose rate is between 15 and 250 nGy/h, but higher values can be observed at some localities. The mean deviation of measurement with portable TC rate meters is 5–15 nGy/h. Since the response of a TC instrument is fundamentally dependent of its detector and energy discrimination threshold, the results of single instruments may deviate from the correct values [17, 22].
Gamma ray spectrometry has been used since the 1960s. Field multichannel scintillation gamma ray spectrometers record count rates (counts/s) in energy intervals (energy windows or regions of interest, ROI), which are centred on the 1461 keV (40K), 1765 keV (214Bi, decay product of 238U) and 2615 keV (208Tl, decay product of 232Th) photopeaks for the estimation of K, U and Th concentrations, respectively [23]. The K, U and Th window count rates, ni (counts/s), recorded in the three selected energy windows i = 1, 2, 3, are linearly related to the K, U and Th concentrations cj, j = K, U, Th such that
ni = siKcK + siUcU + siThcTh + niBG (6.9)
The sensitivity constants, sij, are estimated from measurements on the four calibration pads [17, 23] Some 40 or more sets of specifically constructed pads located in 22 different countries are available for the calibration of ground and airborne gamma ray spectrometers [24]. Background activity can be estimated by taking measurements over a large body of water [25].
To estimate K, U and Th concentrations in rocks, count rates in three selected energy windows, ni, for i = 1, 2, 3,are related to the concentration of radioelements by Eq. (6.9). For a given count rate ni, that is corrected for background, niBG, the radioelement concentrations cK, cU, cTh can be calculated using either a matrix or stripping method. More sophisticated methods based on the full spectra processing have also been developed [17].
Detection of potassium (K) by gamma ray spectrometry through the isotope 40K is considered direct, and the results are expressed as a percentage of K in rocks. Estimation of uranium and thorium concentrations through their respective decay products 214Bi and 208Tl is indirect, with results reported in equivalent uranium (ppm eU) and equivalent thorium (ppm eTh). Since uranium is detected indirectly, its reported concentration (ppm eU) is dependent upon the radioactive equilibrium between 238U, 226Ra and 214Bi in the uranium decay series.
Airborne gamma ray spectrometry has been used over many years for uranium exploration. Airborne gamma ray spectrometers have scintillation detectors that vary in size between 16 and 50 L NaI(Tl) with an additional ‘upward looking’ 4 L NaI(Tl) detector for atmospheric radon correction. A typical spectrometer has a 256-channel pulse amplitude analyser recording the K, U and Th energy windows, an additional cosmic energy window (Eγ > 3.0 MeV), a spectrum stabilizer and a dead time correction unit. Ancillary instruments in the aircraft include
11
a radar altimeter and differential GPS. Measurements are carried out at a constant height above the ground anywhere between 30 and 120 m. Acquisition is generally programmed along parallel flight lines with a line spacing ranging from 50 m for a detailed measurement to 5000 m for a regional survey. The flight speed varies between 25 m/s and 50 m/s (90–180 km/h) with a sample interval of 1 s. In rugged terrain, acquisition is generally performed with a helicopter rather than by fixed wing aircraft. In terrain dominated by large vertical offsets (escarpments), helicopters have the added advantage of being able to fly closer to the ground where fixed wing aircraft would have to be much higher. In prospective terrain, helicopters are often used to fly closely around the base of escarpments searching for subtle radiometric anomalies that would otherwise have been missed.
The field of view of an airborne measurement is usually related to the diameter, d, of a circular plane, which for a given height generates an assigned percentage (%) of radiation from an infinite source. The field of view is a function of the flying height h and of the gamma ray energy. For a height h = 80 m, rough estimates are d = 4h for 80% of the radiation from an infinite source and d = 6h for 90% of radiation from an infinite source. Airborne gamma ray spectrometers are calibrated by a number of means, including calibration pads, flights over a calibration strip and flights over a body of water. A typical calibration strip can be 2 to 5 km long over a flat area for which ground concentrations of K, U and Th are known through a well calibrated, portable gamma ray spectrometer. Processing of airborne gamma ray data requires a number of critical corrections, including dead time corrections, filtering, corrections for aircraft background radiation, atmospheric radon correction, stripping correction, height corrections and finally a reduction to elemental concentrations [17, 26]. An example and a comprehensive description of an airborne survey in Finland is presented in Ref. [27].
Car-borne gamma ray spectrometry is another platform for surveying and is applicable in car-accessible terrain. A car-borne multichannel gamma ray spectrometer typically has a 4–8 L NaI(Tl) scintillation detector, GPS navigation and a GIS-based navigation screen displaying survey routing and the detected radiation level. Carborne surveys are typically conducted on unpaved roads and fields where vehicular access is allowed and feasible. The car speed varies between 15–30 km/h recording data over intervals of 1–4 s. A rooftop mounted detector may have a field of view in the range of 14–36 m for the equivalent 80% or 90% portion of radiation from an infinite source. These instruments can be calibrated on concrete calibration pads and over natural areas where the ground concentration of K, U, and Th has been averaged from separate ground spectrometer measurements.
Portable total count (TC) instruments are also widely used for identifying radiometric anomalies. Ground traverses can follow a grid pattern with the line separation varying between 50–250 m and a station spacing of 5–10 m. Ground gamma ray spectrometry with a portable instrument can be applied as a reconnaissance method ultimately seeking to detail radioelement distribution both qualitatively and quantitatively. Over the years, threshold gamma ray spectrometers have been gradually replaced by differential multichannel spectrometers. A typical portable differential gamma ray spectrometer designed for assays of low radioactivity rocks may have a 350 cm3 scintillation NaI(Tl) detector and will analyse gamma ray energies in the range 0–3 MeV splitting results into 256 or 512 channels. Automatic spectrum stabilization is maintained either by a low-energy reference source (typically 137Cs 662 keV) or by peaks of the natural radionuclides (40K 1461 keV, or 208Tl 2 615 keV). Calibration is achieved via specially constructed concrete calibration pads and by measurements over a large body of water. Typical sensitivities for an instrument with a 7.6 × 7.6 cm NaI(Tl) detector and standard K, U and Th energy windows are 200 c/min per 1% K,18 counts/min per 1 ppm U, and 8 counts/min per 1 ppm Th. Survey work can be conducted using static or dynamic measurement techniques with a sample time of 2 minutes over high-radioactivity rocks (e.g. granites) and 6 minutes over low-radioactivity rocks (e.g. limestones). Readings are always performed with sensors in a constant geometry for the entire survey. For a detector placed on the ground, detected gamma radiation comes from the circular area with a diameter of 1 m. As the detector is raised from the ground, the field of view increases rapidly to several metres in diameter. Modern gamma ray spectrometers will have all calibration constants stored in memory enabling the instrument to display concentrations of K, U and Th in situ while recording the full 256 channel energy spectra.
Reliability of measurements can be estimated by the ratio of the precision of measurement and the range of analysed values. Modern airborne, car-borne and portable multichannel differential gamma ray spectrometers exhibit high sensitivities with the precision of field spectrometric measurements of about 0.1% K, 0.4–1 ppm eU and 0.6–2 ppm eTh. The usual ranges of natural radioelements in rocks are 0–6% K, 0–20 ppm U (or more), and 0–60 ppm Th (or more).
Gamma logging in boreholes involves a TC technique or gamma ray spectrometry. The NaI(Tl) or CsI(Tl) scintillation crystals installed in the logging probe have limited space and therefore limited size. Measurements in the borehole where the detector is completely surrounded by rock provide an optimal 4π geometry. Logging is
12

typically carried out at 3 m/min and because of the limited detector size, low count rates require a low pass filter to improve the signal-to-noise ratio. Calibration of logging probes is conducted at calibration facilities where probes can be lowered into large concrete casts that have been specifically enriched with known concentrations of K, U, and Th. Borehole gamma ray spectrometry will provide assays for K, U and Th concentrations that can then be related to corresponding information on the borehole lithology. The application of gamma logging in uranium exploration can assist in grade-thickness estimation, subsurface lithology and structural feature identification. It is important to note that neither TC logging nor scintillation gamma ray spectrometry can compensate for radioactive disequilibrium.
Variations in the contents of K, U and Th in various types of rocks have common trends. Thus an observed increase in concentration of a single radioelement may be simply caused by a change of lithology. Estimates of the single elements K, U and Th in rocks are further dependent on geometry and conditions of field measurements, affecting in a similar way the analyses of all three radioelements. Calculated ratios U/K, U/Th and Th/K can eliminate so-called lithologic anomalies and serve as efficient, indicative parameters in uranium prospecting activities.
Sometimes field uranium exploration activities are complemented with radiometric laboratory sample analyses. Rock samples are crushed to a grain size of 1–2 mm with samples up to 1 kg measured in containers of suitable geometry (cylindrical or Marinelli-type). The sample and detector are enclosed within 6–10 cm of lead shielding to reduce the background radiation in the laboratory. Radionuclides U, Th, Ra and K are detected mostly at their low-energy lines 93 keV, 238 keV, 352 keV and 1461 keV, respectively. More sophisticated techniques making use of other energy lines are also applicable. A counting time of between 1000 and 4000 seconds is typical for the use of a scintillation detector, while the Ge semiconductor detectors require longer count times.
More detailed summary information on gamma ray techniques for uranium exploration and environmental studies can be found in the IAEA publication cited in Ref. [17].
6.1.7. Radon survey
Uranium ore bodies generate the radioactive gas radon, which can serve as an indicator. The decay series of 238U, 235U and 232Th gives rise to 222Rn (radon, T1/2 = 3.82 d), 219Rn (actinon, T1/2 = 3.92 s) and 220Rn (thoron, T1/2 = 54.5 s), respectively. Due to the primary isotope content in rocks and the half-lives of radon isotopes, radon and thoron are significant constituents in soil gas. Their concentration in soil gas (kBq/m3) is of the same order, and both are sources of alpha radiation.
Radon is a colourless and odourless gas with a density of 9.73 kg/m3. It is soluble in water and in organic fluids. Atoms of 226Ra, contained in mineral grains, generate 222Rn, of which the greater part remains embedded in mineral grains and the minor part is released into pore spaces of the rock. Emanation power (the coefficient of emanation) expresses the ratio of radon in the soil gas to the total radon originating per unit time in the unit volume of the rock. Typical values of emanation power are 0.1–0.4.
The relationship between radon (222Rn) activity concentration cA (Bq/m3) in soil gas, mass activity am of 226Ra (Bq/kg), density of the rock ρ (kg/m3), emanation power kem and rock porosity p is
cA = am * ρ * kem/p (6.10)
The common activity concentration of radon in soil gas ranges from 0 to 100 kBq/m3; however, higher values reaching hundreds of kBq/m3 or more are sometimes encountered. Uranium ore exhibits radon activity concentration of the order of 104 kBq/m3. At the Earth’s surface, radon escapes into the atmosphere, and its concentration activity may be reduced to several metres depth depending on the coefficient of diffusion, D (m2/s), of the soil.
As a gas, radon moves in the rock environment by diffusion and convection. The penetration of radon by diffusion is governed by the coefficient of diffusion (D, m2/s) of the rock or soil environment, and by the radon decay constant λ. Equation (6.11) shows the decrease of radon activity concentration cAx with the distance x from a source having an activity concentration cA0
cAx = cA0 e-x √λ/D (6.11)
13

In common rocks, the activity concentration of radon is reduced by an order of 100 times at a distance of 2–6 m.Movement of radon by convection is caused by movement of underground water, temperature gradients, pressure and tidal effects. Convection transport velocities are of the order of centimetres to tens of centimetres per 24 hours. Activity concentration of radon in uranium mineral bodies is extremely high and of the order of 104 kBq/m3, while radon activity concentration at distances of metres or tens of metres away from the ore body decreases to 100 or 101 kBq/m3. Theoretical calculations and experimental data estimate the depth range of uranium detection to several tens of metres.
Various instruments and techniques can be applied in radon surveys. Portable radon detectors (emanometers) measure the alpha activity of a soil gas sample taken from a depth of about 0.8–1 m, which is transferred to the detector chamber (ionization chamber or a Lucas cell). Alpha particles released by disintegration of radon and thoron are counted and registered within an exposure time of several minutes. Radon and thoron can be distinguished by the temporal change of their alpha radiation. While radon and its decay products cause an increase in alpha radiation with time, alpha radiation from thoron and its decay products rapidly decreases. A modern radon detector displays the resultant data on radon and thoron activity concentrations (kBq/m3) within several minutes.
The alpha track method is based on the registration of radon alpha particles on sensitive films or foils. Cups with a sensitive film are placed in pits 0.3–0.6 m deep, covered by soil and left for 20 to 30 d. The density of alpha tracks recorded on the film is a measure of radon in soil gas. The alpha card method detects the radioactivity of radon solid decay products as they accumulate on an alpha card collector placed in a pit for 1–2 d. An alpha card is a paper frame with a circular, aluminium-coated mylar collector. The Radon on Activated Charcoal (ROAC) method is based on the adsorption of radon gas on activated charcoal. Charcoal in a plastic container is placed into a pit for an exposure period of several days. The gamma radiation of radon decay products balanced with the quantity of adsorbed radon on activated charcoal is counted. Calibration of field radon detectors is achieved by means of stationary national radon chambers or smaller radon generating reference standards. The sensitivity of radon detection instruments and techniques corresponds to several kBq/m3 of radon.
Radon surveys are conducted in the field along traverses spaced 50–200 m apart, with individual readings taken along profile every 5 m, and by soil gas sampling from a fixed depth of about 1 m. Radon anomalies requiring more detailed measurements are conducted over denser grids, make use of additional assays by estimating the radon/thoron character of the anomaly, test the de-emanation of the anomaly by an increase in the soil gas sample volume and investigate the radon distribution in a vertical soil profile. Radon data readings (kBq/m3) taken at single stations along a profile in the field generally exhibit significant variability due to the heterogeneity of the rocks, the background radon field and the limited capability of the sampling technique to test for deeply buried deposits.
6.2. ELECTRICAL AND ELECTROMAGNETIC METHODS
The flow of natural and induced electrical currents through subsurface rocks provides a useful mechanism for the study of the mineralized and unmineralized environment. The electrical response of a target geological object is measured as a voltage or electrical current and provides further characterization for the given geological setting. A great number of geoelectrical methods are used to study the rock environment whereby differentiation is observed according to resistivity, electrochemical activity and permittivity.
The resistivity of a rock equals the resistance of a unit cube of rock when an electrical current flowing perpendicular to a wall of the cube is applied. The relationship between the resistivity ρ (Ωm), electrical resistance R (Ω), cross-section of a cube S (m2) and its length l (m) is expressed by the equation
ρ = RS/l(Ωm) (6.12)
The overall resistivity of a rock is influenced by many factors. Composition, porosity, saturation, intergranular pore fluid composition, structure, texture, temperature and pressure all affect the resistivity of a rock. The most frequently occurring rock-forming minerals such as quartz, mica and feldspar all exhibit high resistivity ranging from 1011 to 1014 Ωm. In general, massive sulphides, graphitic and some pyritic rocks commonly show low resistivity up to 10–5 Ωm. Further, interconnection of conductive minerals may affect the resistivity. The resistivity of most magmatic, sedimentary and metamorphosed rocks depends mainly on rock porosity, saturation and the mineralogical composition of saturizing fluids. The relationships between rock resistivity, rock porosity, water
14

saturation and water resistivity are given by Archie’s laws, which are valid for most rock types, with the exception of clay-bearing rocks. Clay minerals have a high ion exchange capacity, which can result in relatively large numbers of ions being released from the minerals. This in turn decreases water resistivity, influencing the resulting rock resistivity.
In many cases, it is convenient to use the quantity of electrical conductivity σ (S/m, Siemens/metre) instead of the electrical resistivity ρ (Ωm), σ = 1/ρ.
Electrochemical activity of a rock media is the basis for its polarization. The polarization effect of a rock may be observed when a DC electrical current is applied to a rock, which results in charged ions flowing within the pore fluids of that rock. Ionic current flow is converted to electron current flow when pore fluids are in contact with metallic minerals, resulting in a buildup of charges at the fluid–mineral interface. When the applied electrical current is removed, these induced polarization charges disperse through pore fluids, producing a small voltage that rapidly decays to zero. The effect of induced polarization can be observed in many ores as well as in graphite accumulations. Polarization can increase with fluid content and decreases with pore space. Induced polarization can be expressed relatively in percentage (%) as the ratio of registered voltage to applied voltage (mV/V). Self-electrochemical activity (spontaneous polarization) can also be developed above sulphide ore bodies because of the oxidation reduction processes. Spontaneous polarization can be observed in orebodies that exhibit electron conductivity rather than ion conductivity.
Permittivity expresses the ability of a rock to amplify or attenuate an electric field by polarization (i.e. by an ordered orientation of bound electric charges). The permittivity is a dimensionless quantity; its relative values are of the order of units and tens. The basic factor influencing permittivity is the saturation of rocks with water.
Electrical and electromagnetic methods are powerful techniques in geological investigations. In uranium exploration, resistivity methods, induced polarization and electromagnetic methods are widely applied.
6.2.1. Resistivity methods
Resistivity surveying is a method of subsurface investigation whereby an electrical current is passed through the ground by means of two electrodes. Two other electrodes are used to measure the potential across the ground away from the current electrodes, producing an apparent resistivity. Survey techniques have been designed to determine the vertical structure of a layered Earth, or vertical electrical sounding (VES), and lateral changes in resistivity, or resistivity profiling. Newly designed, more sophisticated techniques, such as electrical imaging analyse both vertical and lateral resistivity variations. Rock resistivity estimates are based on field measurements where an electrical current I is introduced into the ground by means of current electrodes C1 and C2, and the potential difference ΔV is measured between two potential electrodes P1 and P2. The spacing and arrangement of these four electrodes is called the electrode array. Since the electrical current I and the potential difference ΔVdepend on the electrode array, the resistivity is calculated as
ρ = k * ΔV/I (Ωm) (6.13)
where k is the geometrical factor of the array. There are many types of electrode arrays, each defined by current and potential electrode separation. The more common arrays are the Wenner array (equal electrode separation), Schlumberger array (potential electrodes are much closer) and the dipole-dipole array (C1 and C2 and P1 and P2 form dipoles of short spacing). Equation (6.13) is valid for a homogeneous medium. For an inhomogeneous medium, typically the real-life situation, observed values correspond to a mean resistivity of the media called the apparent resistivity, ρa (Ωm).
Depth of penetration of an electrical current into the ground is related to current electrode separation. The fundamental principle of VES is related to the increase in depth of investigation with the increase of distance between current electrodes. The log10 of calculated data ρa (Ωm) are plotted against log10 of the array spacing (m). The resulting plot is compared to master curves for a particular array type and for the number of horizontal layers. The master curve that fits the observed data determines the resistivities and thicknesses of the subsurface layers.
Resistivity profiling investigates lateral resistivity changes such as the presence of a mineral vein or a geological boundary. In resistivity profiling, some or all of the electrodes are moved laterally with fixed spacing along the profile. The calculated apparent resistivity ρa (Ωm) is referred to a single point of the array, and the results are plotted as a profile. The crossing of a conductive or nonconductive body, or vertical lithological boundary,
15

results in a specific shape of an apparent resistivity profile. Curves of apparent resistivity, as responses to various geological settings and applied electrode arrays, have been modelled and are used in interpreting data.
Resistivity can vary both vertically and horizontally. To investigate such variations, electrode arrays need to be expanded in a similar context. The field survey takes repeated readings along the same traverse crossing an area of interest but varying the range of electrode separation. Field measurements along a traverse can be greatly speeded up by deploying electrodes at all stations along the traverse. Taking multiple readings at once is then facilitated by using a multicore cable. Switches allow sets of electrodes to be selected for each spacing and lateral position. Calculated apparent resistivity is plotted at intersection points corresponding to the lateral position and vertical depth of the investigation of the array. Repeating a profile sounding with different values of electrode spacing will give rows of ρa (Ωm) at different depths. The observed values can be plotted in a vertical cross-section, resulting in a pseudosection. Recent increases in computational power mean that it is possible to rapidly invert a pseudosection into a true resistivity section using tomographic theory. This data processing is called electrical imaging.
6.2.2. Electrochemical methods
The self-potential method (SP) is based on measuring a natural electrical field occurring above natural electron conductors positioned in an oxidation reduction ambient medium (surface polarization). The potential difference (mV) is measured between the base station electrode (at infinity) and a second electrode, which is moved along the profile. The observed potential differences are in the order of millivolts, not exceeding 1500 mV, requiring the use of non-polarizing electrodes (porous pot electrodes filled with an electrolyte). The position of a polarized body manifests itself as a negative anomaly.
Induced polarization (IP) is useful for detecting geological bodies in which electron-conductive particles are surrounded by a nonconductive rock environment such as in the case of disseminated sulphide ores. The electrode configurations are similar to those used in resistivity profiling. To take a reading, the current I is switched on for a set period allowing electron conductive particles to become polarized. The current is then switched off, and the potential difference created due to a buildup of polarization charges is measured in the off-time. Readings are taken at a number of discrete time intervals during the charge decay and stacked using repeats to improve the signal-to-noise ratio. The IP method has several advantages: it is ideally suited to detecting disseminated sulphide mineralization, it eliminates non-metallic conductivity anomalies, it does not respond to resistivity inhomogeneities and, depending on the performance of the instrument and the size of the target, IP can have a considerable depth of investigation.
6.2.3. Electromagnetic methods
Electromagnetic methods, like resistivity methods, are mainly used to investigate variations in subsurface rock resistivity, however they rely on different physical principles, the most important of which is electromagnetic induction. A coil forms a transmitter (Tx) to which a power supply delivers an alternating current. An alternating current passing through the coil generates a primary magnetic field that propagates into subsurface rocks, including any incidental conductive body. As the primary magnetic field passing through the electrical conductor (ore body) is alternating, it induces an alternating current (eddy currents) in the conductor. This induced current in turn produces its own alternating secondary magnetic field, which is detected by a coil receiver (Rx) at the surface. The usual way of detecting the secondary magnetic field is either by the current or voltage induced in the receiver coil. A common method of operation is to move transmitter and receiver along a designated profile at the surface, collecting readings at regular intervals. In EM surveying, conductivity σ (S/m) is used rather than resistivity ρ(Ωm).
Electromagnetic methods make use of a generated harmonic field or transient field, which originates after a sudden change of source power. An applied alternating current generates a time-varying electromagnetic field. The vector of induced magnetic intensity H(t) depends on the intensity of the primary field H0
H(t) = H0 cos(ωt – φ) (6.14)
16

where ω is the angular velocity, and φ is the phase delay. The phase delay is the angle by which the induced electromagnetic field lags the source current. The quantities that display a zero phase delay relative to the transmitted field are in-phase with the source (real component, Re(H)), and those quantities that display φ = 90º are said to be out-of-phase or referred to as the quadrature component (imaginary component, Im(H)). Some EM methods, such as frequency domain EM, work with the harmonic field, and the measured quantities are decomposed into real and imaginary components. A strong conductor is indicated by the higher value of secondary field measured by the receiver.
The transient electromagnetic field exists for a very short time (milliseconds) after a sudden switching in the state of a source current. This field is transient and is attenuated roughly exponentially with time. Some EM methods, such as time domain EM, transmit square pulses of alternating current and measure the amplitude of the resultant decaying (transient) signal at various times (milliseconds) after current turn-off. Good subsurface conductors manifest themselves by a long decay curve.
Several factors affect the observed responses and applicability of EM methods. The signal at the receiver (Rx) depends upon many elements, including the material, shape, depth and conductivity ρ of the target, as well as the design and position of transmitter and receiver coils and their distance to the target. Signal strength of the transmitter depends upon the size and number of turns of the transmitter coil and how much current is flowing through it. The deeper and smaller the target is, the weaker the signal will be. If the target is sheet like, its orientation relative to the inducing magnetic field will affect the induced flux. If the applied frequency of the alternating current is higher, it increases the rate of change of flux but can also limit the depth of penetration of an electromagnetic wave. Transmitter frequencies range from tens to hundreds of thousands of hertz (cycles/s). The depth of investigation for EM methods is influenced by the effective propagation of electromagnetic waves into the ground; the waves being progressively attenuated as they travel through a conductive layer. Depth of penetration increases with more powerful transmitters and lower frequencies. The “skin depth” δ (m) defines the depth at which the EM waves are attenuated to 37% of their surface intensity. For frequency domain EM δ (m) = 503*√ρ/f, where f is expressed in Hz, while for the time domain EM the diffusion depth d (m) = 1 260*√ρt, where t is in seconds. If the overburden is very conductive, it may be impossible to reach the deep targets.
The EM methods were developed and applied in various systems. The Slingram system has the coil transmitter and receiver connected by a cable, and their separation is kept constant as they are moved together along a ground traverse. Some ground Slingram instruments have the transmitter and receiver placed into a fixed length rod. A more powerful system is the fixed transmitter system, where the transmitter is usually a long (km) rectangular loop, and a high electrical current is applied. The receiver consists of two portable coils connected together by a cable and kept at a fixed distance, and the ratio of signals is measured. The TDEM system measures the transient field in several time intervals (ms), called channels, showing the rate of its decrease. The TDEM system has been frequently used for airborne surveying where, at standard conditions, it can detect targets to depths greater than 700 m below the surface. Frequency domain EM (FDEM) systems are generally deployed on helicopters while time domain EM (TDEM) systems are deployed on both helicopters and fixed wing platforms.
6.2.4. Application of electrical and electromagnetic methods to uranium exploration
Uranium mineralization does not differ in resistivity from the host environment, and the spatial extent of an ore body is often small, hence the direct detection of uranium by measuring resistivity or conductivity is difficult. It is possible, however, to utilize electrical and electromagnetic methods to detect subsurface geological targets often associated with uranium mineralization. Such geological targets include large graphitic conductors in the Athabasca Basin or other similar stratigraphic units with strong carbonaceous affinities. Other applications include the mapping of subsurface structures, faults, fractured zones and paleochannels in sedimentary basins. Recent paleochannel exploration has seen a widespread use of TDEM targeting conductivity contrasts between saline water fluids localized within a channel and a surrounding resistive host. A more detailed description of electrical and electromagnetic methods can be found in Refs [14–16].
17

6.3. GRAVITY PROSPECTING
Gravity is one of the most useful geophysical techniques applicable for detecting lateral, and to a certain extent, vertical differences in the densities of subsurface rocks. Gravity surveying is applicable for finding larger buried bodies, lithological boundaries and structural features under the assumption of a sufficient density contrast between the target and host lithology.
Study of the gravitational field is based on two fundamental principles: Newton’s law of gravity and the principle of superposition. Newton’s Law defines the attractive force F between two masses, m1 and m2 (kg), which is directly proportional to the product of these masses and inversely proportional to the square of their separation r (m) as
F = G*m1m2/r2 (6.15)
where G is the universal gravitational constant (G = 6.672 × 10⁻¹¹ m3kg–1s–2). Newton’s Law applies to point masses, that is, bodies so small in extent compared to their separation r. The force F is not a convenient quantity for general characteristics of the gravity field exerted by one of the bodies m1 because it depends upon the mass m2. The ratio F/m2, Eq. (6.16) characterizes the magnitude of gravitational effect of the body m1 in the surrounding space and is referred to as the intensity of the m1 gravitational field.
F/m2 = G*m1/r2 (6.16)
According to Newton’s second law of motion, the force F, acting on the body of mass m2, is equal to the product of its mass and acceleration g and can be expressed as
F = m2*g (6.17)
By comparing Eqs (6.16) and (6.17), the gravitational acceleration g is given by
g = G*m1/r2 (6.18)
The intensity of the gravitational field is thus equal to the gravitational acceleration g, which the gravity field imparts to each body (mass) at a given point (defined by r) independently of its mass. Substitution of m1 by the mass of the Earth, M (estimated about 5.97 × 1024 kg), the Earth’s gravitational acceleration g is the convenient physical quantity for the description of the Earth’s gravity field.
g = G*M/r2 (6.19)
where r is the distance of a point from the centre of the Earth. According to the principle of superposition, the sphere has the gravity field like an equivalent point mass located in its centre.
The SI unit for acceleration is m/s2. At the Earth’s surface, the gravitational acceleration is about 10 m/s2 (the average value of g is 9.81 m/s2). In contrast to this, local gravity anomalies caused by density differences of geological bodies are in the range of 10–5 to 10–6 m/s2, and therefore the unit μm/s2 is used. Apart from SI units, an older unit, mGal (CGS system), is often used; 1 mGal = 10–5 m/s2 = 10 μm/s2.
Since the gravity field g is a function of the mass (6.18), which in turn is a product of the volume and its density, the gravitational field at the Earth’s surface may be influenced by near surface geological inhomogeneities. Densities of rocks (kg/m3) vary over a wide range; for example, some loams and sands vary from 1200 to 1900 kg/m3; the majority of igneous, sedimentary and metamorphic rocks have densities between 2000 and 2900 kg/m3 while minerals and ores range from 3500 to 5000 kg/m3. Gravity measurements are focused on identifying the size and position of geological objects that differ in their density. Various models of geological bodies and their modelled gravity fields can be found in Refs [14, 16].
Gravity measurements are absolute and relative. In gravity prospecting, the relative gravity measurements are applied whereby gravitational observations at a series of stations is compared to the gravity field at a selected base station. Gravity measurements are carried out by portable gravimeters. The operating principle lies in the
18

gravitational attraction of a mass attached to a zero length spring; changes in the gravity field result in changes to the position of the mass attached to the spring. A scaled micro screw serves as the reading mechanism and compensates for the extension of the spring. Modern digital gravimeters apply a voltage to restore the initial balance of the spring. Calibrated gravimeters display the gravity field in μm/s2 or in mGal. Modern gravimeters can detect changes in g as small as 10–7 m/s2 = 0.01 mGal or even lower.
A gravity field measured at the Earth’s surface is affected by a series of factors. Data reduction aims to remove these factors and resolve the response of subsurface geological bodies. Drift (variation due to tidal distortion of the solid Earth) is measured by periodically returning the gravimeter to a base station. A theoretical gravity field (calculated) is subtracted from measured data to obtain a gravity anomaly Δg. Correcting for latitude eliminates the Earth’s rotational force. The free air correction compensates for the altitude of the observation point. The Bouger correction subtracts the effect of an infinite underlying rock slab. The terrain correction removes the effect of a variable relief. The Bullard correction eliminates the effect of the curvature of the Earth. In exploration, the most important anomalies are the Bouger anomalies, ΔgB, which show density inhomogeneities in the rock environment. Gravity measurements are reported as contour lines of the gravity anomalies, Δg (μm/s2). Further processing can separate regional anomalies (the response to large geological objects) and residual anomalies (the response to localized geological objects).
Interpretation of gravity anomalies means to deduce a distribution of subsurface bodies of different densities. Though it is possible to calculate the gravity anomaly from any specific body, it is not possible to define a unique body from a gravity anomaly. Gravity anomalies of different bodies can be very similar. The inversion of gravity anomaly data is carried out by means of master curves of gravity anomalies for various geometrical objects or by means of modelling. Modern computer software enables the computation of gravity anomalies reflecting a choice of geological setting in which shapes, dimensions and differential densities are programmed.
A more detailed description of gravity surveying can be found in Ref. [15].
6.4. MAGNETIC PROSPECTING
Objects within the Earth’s magnetic field are magnetized according to their magnetic susceptibility. Sensitive magnetometers respond to the intensity and lateral variation of the Earth’s magnetic field, which is influenced by changes in subsurface geological features. Magnetic surveying is useful for mapping geological boundaries, structures, magnetic basement and finding some types of ores, however all of this relies on there being a sufficiently large contrast in the magnetic properties of the geological units. Uranium is a paramagnetic material (its ability to be magnetized is low), and magnetic surveying cannot detect it directly.
The magnetic field of a single geological body (magnetic anomaly) will manifest itself as a disturbance in the normal geomagnetic field of the Earth due to the amount of contained ferromagnetic material. The shape, dimension, position, depth and petrographic nature of the associated geological inhomogeneities all influence the resultant magnetic anomaly. The magnetic response of a buried body depends on both the direction of magnetization of the body and on the Earth’s incident magnetic field. This is the reason why magnetic anomalies are more complex than gravity anomalies. A magnetic anomaly, as an indication of subsurface magnetic inhomogeneity, can be determined as the difference between measured values and the normal background magnetic field.
The Earth’s magnetic field resembles the magnetic field of a bar magnet or more precisely a magnetic dipole positioned at the centre of the Earth. The vector magnetic field is defined at each point by its strength and direction. The north and south poles of the magnetic field are spatially offset from the location of their geographic equivalent, the latter being related to the Earth’s rotational axis. Magnetic field vectors are oriented vertically into the Earth at the north magnetic pole and vertically out of the Earth at the southern magnetic pole. Magnetic field intensity is measured in tesla (T) with most values of the Earth’s field given in nanoteslas (nT). The strength of the Earth’s magnetic field varies from roughly 23 000 nT near the magnetic equator to 60 000 nT near the magnetic poles.
Physical parameters describing a magnetic field are: the strength of the inducing magnetic field H (A/m), the intensity of magnetization M (A/m) and the magnetic susceptibility κ (dimensionless), a parameter showing the ability of a rock to be magnetized. These parameters are related by the equation M = κH where κ can be either positive or negative and is given in SI units (dimensionless) or CGS. The relationship between susceptibility in SI and CGS units is given by the equation SI=4 CGS.
19

Magnetically important rock-forming minerals are divided into three categories: diamagnetic minerals (such as graphite, quartz, feldspar, galena), paramagnetic minerals (such as pyrite, muscovite, biotite, siderite, amphibole), and ferromagnetic minerals (such as magnetite, hematite, pyrrhotite, maghemite). The magnetic susceptibility κ of diamagnetic minerals is negative and of the order of 10–6 to 10–5 SI units. For paramagnetic minerals, it is positive and of the order 10–5 to 10–3 SI units. The magnetic susceptibility of ferromagnetic minerals is positive and may reach very high values of the order of 10–3 to 105 SI units. Magnetic susceptibilities of rocks can be measured accurately by laboratory instruments or more generally in situ by portable magnetic susceptibility meters.
The magnetization M of rocks has two components: induced magnetization, Mi, and remanent magnetization, Mr. Induced magnetization is a product of κ and H and has a vector orientation identical to the magnetizing field H. In contrast to this, remanent magnetization Mr, refers to the magnetization independent of the Earth’s current magnetic field. The vector sum of Mi + Mr = Mtotal is the resultant total magnetization, and depending on which component is dominant, can sometimes be in the complete opposite direction to the inducing magnetic field. The presence and strength of remanent magnetization is not always clear, making the interpretation of magnetic anomalies more difficult.
The intensity of the resultant magnetic field, B (nT), at the Earth’s surface is defined by the vector of the total geomagnetic field T. The vector T can be resolved into horizontal H and vertical Z components and defined further by inclination (vertical dip) and declination (the angle between geographic and geomagnetic meridian).
Magnetometers used for magnetic surveying differ in construction and the measured components of the magnetic field. The fluxgate magnetometers make use of the difference of induced electrical current in a detector coil due to the intensity of the magnetic field. The sensor has two identical bars of magnetic material around which are wound magnetizing coils in opposite directions. The fluxgate magnetometer measures the component of the magnetic field along the axis of the sensor. Proton magnetometers, based on the frequency of precession of hydrogen atoms in the magnetic field, measure the total magnetic field. The sensitivity of both types of magnetometers is one nT or less, but more advanced magnetometers, such as Overhauser magnetometers and optically pumped magnetometers, manifest sensitivities up to 0.001 nT.
In ground magnetic surveying, readings are generally taken along profiles at regular sample intervals, with the sample interval selected in relation to the required depth of investigation, which is a function of wavelength. Sensors can be raised above the surveying plane as a means of lessening the effect of near surface, high-frequency noise. Gradient measurements can be taken with two sensors mounted vertically with a separation distance of 0.5 to 1 m. Data can be reported as a gradient of the magnetic field in nT/m. Data reduction comprises the removal of diurnal variations and subtraction of the Earth’s magnetic field. Master curves of magnetic anomalies caused by various geological bodies permit interpretations of their shape and allow depth estimations. More advanced processing of magnetic data involves forward modelling and comparison with observed data. Recent advances have introduced the concept of constrained inversion where non-uniqueness is lessened through the introduction of additional data sets or parameters providing a real world constraint during the inversion process. Magnetic data reduction to the pole, a computing process, partly eliminates the difficulty with shapes of anomalies affected by the variable inclination of the magnetizing field with latitude, and by the strike of the body. Upward and downward continuation of the magnetic field is a mathematical operation that recalculates the anomalies to an equivalent survey height, higher or lower than the original sensor height. A more detailed description of magnetic surveying can be found in Mares et al. [14] and Telford et al. [15]
Both gravity and magnetic surveying can be successfully applied in geologically mapping an area during the early stages of uranium exploration. In cases of complete cover caused by elements such as glacial till, sand or an extreme regolith development, mapping of subsurface geological features over a large area can be cost effectively undertaken through magnetic surveying.
6.5. SEISMIC PROSPECTING
Seismic prospecting (seismics) is a method suitable for investigating the geological structure of the Earth’s crust to great depths. It is based on the application of artificially excited elastic waves. These waves propagate omnidirectionally from their source and can penetrate to depths of many kilometres. A geological boundary with a velocity contrast can reflect and refract the wave, returning it to the Earth’s surface where it is recorded. Measuring
20

the travel time of a wave and studying its character enables the determination of the depth of boundaries. Information about the rocks through which the wave has propagated can also be determined. Seismic prospecting plays an important role in solving various problems of structural geology, particularly in prospecting for oil and gas deposits. It is applicable in sedimentary basins for mapping layers, faults and other discontinuities. Seismic prospecting can give a clearer picture of subsurface structures at great depths.
Seismic prospecting makes use of the propagation of elastic waves through rocks. The elastic properties of an isotropic medium are in general described by Young’s modulus of elasticity and Poisson’s ratio. Energy transferred into the medium generates a time-variable strain, which results in the oscillation of particles. The oscillations propagate, and an elastic wave is generated. Depending on the nature of the oscillation relative to the direction of propagation, elastic waves are known as longitudinal (P) or transverse (S) waves. S-waves do not travel through a liquid. Basic characteristics of seismic waves are the length of wave, λ, frequency (number of oscillations per second), f, and velocity of propagation, v; where v = f λ. P-waves propagate nearly twice as fast as S-waves. The amplitude of the wave shows its intensity. The velocity of a seismic wave in a rock medium depends on the rock’s elastic parameters, density, porosity and water saturation. Velocities of P waves in a weathered soil layer, gravel or unsaturated sand are less than 1000 m/s, while in solid rocks such as granite, limestone and claystone, velocities range between 2000 and 6000 m/s. In addition to P and S waves (body waves penetrating the rock medium), surface waves (Rayleigh waves and Love waves) travel in a narrow surface layer directly from the source to sensors. Seismic impedance (Z) of a rock medium is a product of its density (ρ) and velocity of seismic waves, v; Z = ρv(g/cm2s).
Seismic prospecting is focused on localizing seismic interfaces (geological boundaries). Seismic waves that are incident at an interface between two media of different wave velocities and densities are reflected and refracted. With knowledge of velocities through which a seismic wave is travelling, measurement of the travel time for a wave from the point of origin (the source at the surface) to the seismic interface and back again, allows the depth of seismic interface to be estimated.
Seismic instruments amplify and record seismic signals. Seismic waves can be generated by explosives placed in a shallow borehole, by the impact of a heavy mechanical weight, by a vibrator or by a strike of an iron plate on the ground using a simple sledgehammer. Data for seismic waves are recorded through individual geophones, which are highly sensitive sensors that are placed at the surface in a profile, converting the incident dynamic energy of an incoming seismic wave into an electrical current by means of an internal induction coil. Electrical signals are amplified and frequency filtered as they are stored on the recording device. The combination of a geophone and its cable is a seismic channel. Seismic signals from each channel may be recorded as a wiggle trace (print) or onto digital media. A travel time graph can be constructed as a plot of arrival time versus distance along the profile. Travel time graphs support computation of apparent velocities for seismic waves in single layers and of the existence and depth of seismic interfaces. Real velocities of subsurface rocks can be calculated from borehole seismic records using known distances to the surface source.
The method of seismic refraction relies upon waves propagating along a seismic interface and being refracted back to the surface as head waves. A ray crossing an interface downwards into a layer with a higher velocity, which is a common situation in geological strata, is refracted from the normal to the interface, according to Snell´s Law
sin α1/v1 = sin α2/v2 (6.20)
where α1 and α2 are angles of incident and refracted rays (measured from the normal to the interface), and v1 and v2
are velocities of seismic rays in the upper and lower layer, respectively. If the incident ray arrives below a critical angle αc, then the refracted angle α2 = 90º and the refracted ray travel along the interface. Refraction seismics is mainly used to detect roughly horizontal interfaces separating layers with different seismic velocities. Interpretation of refraction seismic surveying makes use of travel time graphs. The lines, or curves, of the travel time graph, its sections and their inclination can be interpreted as the number of subsurface interfaces and the estimate of apparent velocities of respective layers.
Seismic reflection is a powerful tool for investigation of subsurface geological structures at great depths and is often visualized in the form of a vertical section or as 3-D images. Seismic reflection is a form of echo sounding. The angle of reflection of a P-wave is the same as that of the incident P-ray but on the opposite side of the normal. The travel time of a seismic ray from source to the geological reflector and back again is recorded. The graphical record of each seismic channel shows traces of all seismic wave arrivals. After data processing of all seismic
21
channels, the result is presented as a reflection seismic section in the form of a two way time (ms) versus distance image. Several corrections for real velocities, displacement of reflections from dipping reflectors and an estimate of multiple reflections must be applied to compile a final cross-section. Migration (a type of correction) is used to correct for the distortion in dip and depth resulting from dipping and curved reflectors, and to eliminate diffraction effects from sharply truncated reflectors. A three dimensional reflection survey will collect data using a grid layout whereby recording is undertaken perpendicular to the traverse as well as along it.
Common depth point (CDP) stacking is an applied technique to deduce the velocities of layers and to improve the signal-to-noise ratio. Reflections from the common depth point are gained from a symmetrical surface array of several sources and geophones with respect to the position of the common depth point.
Two basic factors that influence the application of reflection seismics are the difference of acoustic impedance of the interface and its geometry (size and the location depth).
6.6. WELL LOGGING
A geophysical measurement applied in a borehole through the process of wireline logging allows the investigation and determination of physical properties of rocks at a precisely known depth. In contrast to surface measurements, down hole logging provides a constant measurement geometry, greater vertical resolution of geological formations and the possibility of correlation with the drill core.
Most of the geophysical principles used are the same as those used from the surface. Magnetic, electric and electromagnetic, nuclear geophysics and some purely technical methods are all applied in boreholes. Different types of borehole logging can provide a multitude of parameters for interpretation, including: lithology, stratigraphic continuity, porosity, bulk density, resistivity, conductivity, moisture content, water saturation, mineral concentration, stress and elastic moduli, groundwater movement and its chemical and physical characteristics. Not all methods can be used in cased boreholes since some logs require open contact with the well wall. Geophysical measurements in boreholes are widely applied in the oil and gas, and mineral industries, be they at the mining stage or purely exploration. Where uranium is concerned, the calculation of a uranium reserve/resource is fundamentally based on borehole measurements.
Wireline logging provides continuous or discrete measurements down a drill hole. Measurements are made with the use of sophisticated slimline sondes (tools), transmitting data back to the logging unit via an armoured cable. Data from a tool is converted to an electrical signal and transmitted via the winch cable to the surface recorder where it is recorded in either digital or analogue form. Many sophisticated loggers have the ability to string multiple tools together, thereby reducing the number of logging runs required to gather multiple, unrelated physical parameters. Lightweight, transportable logging units can typically log to several hundred metres, while deeper boreholes require the logging apparatus to be mounted on heavy duty trucks and have the capacity to log boreholes of several thousand metres.
Numerous geophysical methods of logging have been developed, providing a means for investigating various geological objectives. A systematic account of the theory and application of more than 37 of these methods was introduced by Mares et al. [14]. The principles of methods frequently applied to mineral exploration are briefly described.
The self-potential (SP) log can indicate potential sulphide mineralization or graphite content. An SP log requires one electrode in the logging tool and the other grounded at the surface. The potential difference between the two electrodes is recorded with depth. The SP anomalies in fluid filled boreholes originate from three types of process: electrochemical processes, filtration processes and oxidation reduction processes. Negative SP anomalies associated with sulphide mineralization reach several hundred millivolts. In practice, the anomalies opposite ore bodies are generally positive as a result of steel drilling tools leaving an iron trace on the wall of the borehole, which forms a galvanic pair with the sulphide electron conductor. In this case, a positive SP anomaly is registered. Accurate determination of the orebody can be performed by a gradient SP measurement.
Resistivity logs map changes in resistivity. A variety of electrode layouts can be used with a standard configuration represented as one current electrode grounded on the surface and a second current electrode, as well as two potential electrodes fitted in the probe. Borehole fluid is much less resistive than the surrounding formation, allowing little current to penetrate beyond the mud. This is overcome by focusing the borehole current sideways
22

through the fluid into the formation. Such sondes are known as laterolog, or in the case of a focused potential, the focused laterolog.
The induction log, an electromagnetic method, can be used to identify conductivity variations in boreholes and will work in either cased or dry boreholes. The induction log requires a transmitter and receiver coil within one sonde.
The gamma ray log is essential in uranium exploration. Borehole radiometric data are routinely used to calculate grades and thicknesses of uranium mineralized intercepts in drill holes. Equivalent uranium grades and thicknesses are calculated by computer algorithm, taking into account the unique physical properties of the borehole probe instrument that are derived from calibration pit tests. Equivalent grades are commonly benchmarked through the assaying of core samples at geochemical laboratories to ensure the accuracy of the results derived from the radiometric surveys, and for reporting purposes.
At its most basic level, simple total count (TC) rate meters with a NaI(Tl) scintillation detector are installed in the logging probe, detecting changes in downhole radioactivity. The technique can localize radioactive anomalies and has the capacity to distinguish levels of radioactivity associated with various formations (e.g. sandstones, limestones, shists, shales as well as types of crystalline rocks). Calibrated logging using gamma ray spectrometry can record the individual concentrations of K, U, and Th downhole, allowing the identification of U anomalies and element ratios. The significance of borehole lithology is in the added value of lithological classification. As in surface detectors, the sensitivity of a gamma ray probe is limited by the size of its scintillation crystal. Calibration of gamma logging instruments can be achieved through specially constructed concrete calibration wells. These concrete wells, complete with a central borehole, can measure 1.5 m in diameter and 3 m in height, and contain barren zones and ore zones enriched by K, U and Th, respectively [17]. It should be noted, the gamma ray spectrometry data on U contents need not correspond to true uranium values, as radioactive equilibrium in the 238U decay series might be distorted. A uranium resource calculation should be based on the U equilibrium knowledge or on logging methods of direct uranium determination.
The gamma–gamma log detects Compton scattered gamma rays in the borehole wall induced by an artificial radioactive source (137Cs or 60Co) within the probe. A gamma–gamma log will reflect density. Similarly, a neutron-neutron log is used to measure porosities.
Magnetic measurements in boreholes comprise records of magnetic field and magnetic susceptibility. The magnetometers used in a magnetic field log are fluxgate magnetometers and provide continuous readings. Measurement of three orthogonal vector components allows calculation of the total magnetic field strength and direction.
The induced polarization (IP) log is useful for detecting mineralization, such as disseminated sulphides that typically display a chargeability characteristic under an induced current. Measurements are usually made via a fixed array that is lowered down the borehole and moved a set interval once a reading is complete.
Logging sondes often contain several instruments that can operate without mutual interference. An illustrative review of borehole logging has been introduced by Musset and Khan [16].
6.7. REMOTE SENSING
Geophysical measurements can also be made utilizing specific parts of the reflected visible and near infrared electromagnetic spectrum. Minerals and mineral groups are known to absorb discrete parts of the electromagnetic spectrum, making it possible to identify these groups based on the observed reflectance spectra.
Measurements of reflectance spectra and the application to mineral exploration have historically evolved from satellite-based platforms where the equivalent ground pixel resolution is relatively coarse, and the measured spectrum bandwidths are limited. Demand for increasing discrimination of the electromagnetic spectrum, higher ground resolution and project-specific applications has led to the development of custom sensors, which are now available in fixed wing aircraft (e.g. HyMap) and offer considerable advantages over satellite-based sensors. Detailed discrimination of minerals is routinely conducted on drill core and rock samples using portable, land based systems. These systems offer the highest resolution of the electromagnetic spectrum. An explorer now has a multitude of platforms from which to choose depending on the objective and required resolution.
Satellite systems are providing an increasingly higher resolution data set to the end user. This resolution is increasing both in terms of ground pixel size and resolvable spectrum. Spectral measurements are possible in the
23

very near infrared (VNIR), short wave infrared (SWIR) and thermal bands. Processing of this information can then lead to establishing the presence of mineral assemblages such as ferric iron, iron oxides, vegetation, clay minerals, carbonates, quartz and feldspars.
Portable ground-based SWIR measurement instruments are used to calibrate and follow-up SWIR airborne survey results. Uranium exploration geologists use these tools to map lithological, mineralogical and clay alteration signatures in outcrop and drill cores [28].
7. ADVANCES IN GEOPHYSICS
Recent developments in theory, measurement techniques, data processing and computer modelling have yielded improvements in the field of exploration geophysics. It is reasonable to say that the progress in radiometric methods is closely tied to uranium exploration but also that some of the recent achievements in other geophysical methods have contributed to successful field investigations in the area of uranium exploration.
The geographical information system (GIS) has facilitated an unprecedented integration of digital geophysical data with independent vector and raster information. A GIS allows the ready amalgamation of diverse data sets such as remotely sensed images, digital elevation models, magnetic data, electromagnetic data, gamma ray data and gravity data, to name a few. Three dimensional display capabilities are routinely available in many current computer programmes.
7.1. ADVANCES IN RADIOMETRIC METHODS
Airborne multichannel gamma ray spectrometers equipped with 32 to 50 L NaI(Tl) scintillation detectors and energy spectrum stabilization (by means of the 40K 1461 keV peak or the 208Tl 2615 keV peak) have become standard airborne exploration tools. Additional upward-looking 4 L NaI(Tl) detectors for aerial radon correction are also an integral part of airborne measurements in the northern hemisphere because of contamination from 137Cs fallout. Other types of radon correction based on the analysis of the recorded gamma ray spectrum can be applied in regions unaffected by 137Cs contamination [25].
Over the past few years, a new generation of gamma ray spectrometers have come onto the commercial market. Some of them use a new generation of scintillation crystal that has a higher density than the standard NaI(Tl) (3.66 g/cm3) scintillation crystal.
Higher density scintillation crystals, such as Cs(I) (4.51 g/cm3), LaBr3 (5.29 g/cm3) and Bi4Ge3O12 (7.13 g/cm3) improve the detection efficiency at higher energies. Smaller detectors enable a reduction in the mass of modern portable gamma ray spectrometers to around 2 kg (Fig. 2). For example, the sensitivity of new portable field gamma ray spectrometers with a BGO scintillation detector volume of 103 cm3 is approximately 80% of the sensitivity of a detector with a NaI(Tl) crystal volume of 350 cm3. LaBr3 detectors, with an energy resolution of 2.8–4.0% (662 keV), can operate over a wide range of count rates with little variation in energy resolution while exhibiting fast decay times of output pulses, resulting in 20% more registered counts. Some portable ground gamma ray spectrometers are now equipped with an isotope library, allowing for quick identification of spectral peaks and their respective radionuclides. Reduction of the detector volume plays an important role in the development of drill hole logging tools.
New airborne and ground instruments are auto-stabilizing on the peaks of naturally occurring radioelements K, U and Th. For airborne systems, each detector crystal essentially has its own spectrometer. Therefore, energy calibration can be done on individual crystals before summing the response from each crystal. This results in better energy resolution of the summed spectra.
Full 256 channel gamma ray spectra are routinely recorded in airborne surveys, and in some cases, in ground gamma ray spectrometry (Figs 3(a) and 3(b)). Multichannel gamma ray spectra enable the application of advanced data processing aimed at improving the signal-to-noise ratio. Minty and Kennett [29] studied optimal energy window adjustment for the standard K, U, Th energy windows.
24
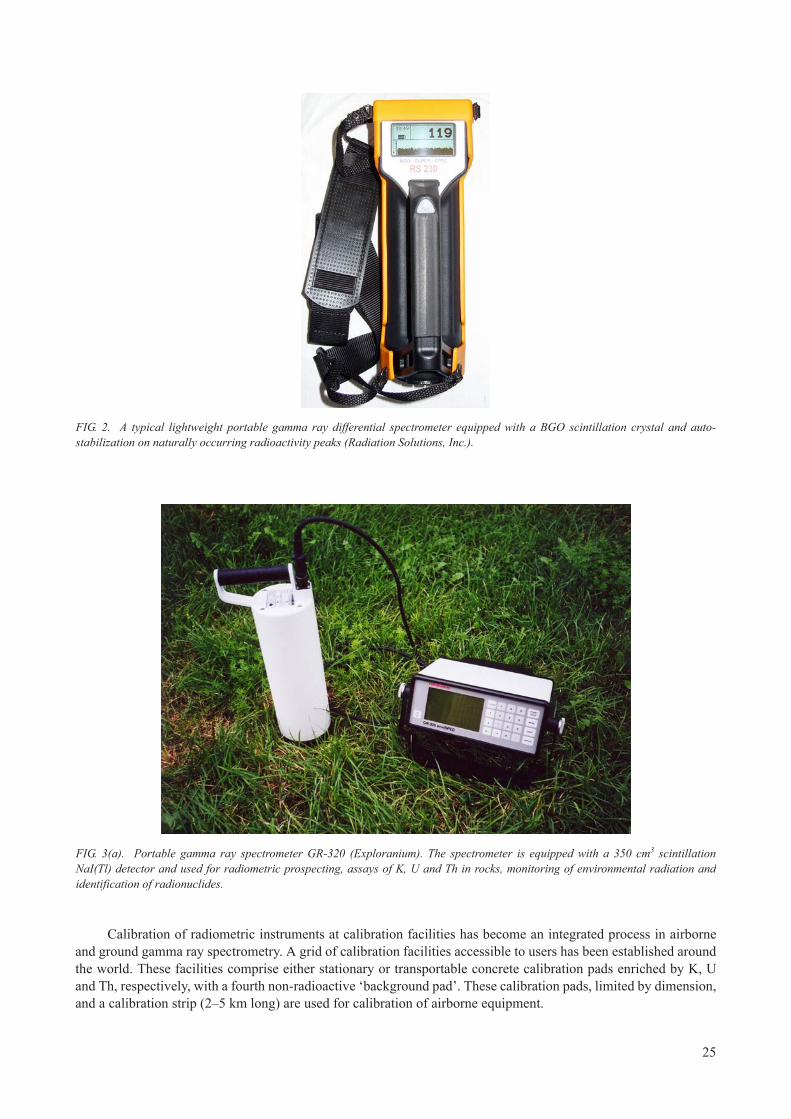
Calibration of radiometric instruments at calibration facilities has become an integrated process in airborne and ground gamma ray spectrometry. A grid of calibration facilities accessible to users has been established around the world. These facilities comprise either stationary or transportable concrete calibration pads enriched by K, U and Th, respectively, with a fourth non-radioactive ‘background pad’. These calibration pads, limited by dimension, and a calibration strip (2–5 km long) are used for calibration of airborne equipment.
FIG. 2. A typical lightweight portable gamma ray differential spectrometer equipped with a BGO scintillation crystal and auto-stabilization on naturally occurring radioactivity peaks (Radiation Solutions, Inc.).
FIG. 3(a). Portable gamma ray spectrometer GR-320 (Exploranium). The spectrometer is equipped with a 350 cm3 scintillation NaI(Tl) detector and used for radiometric prospecting, assays of K, U and Th in rocks, monitoring of environmental radiation and identification of radionuclides.
25

In 2003, the IAEA initiated a global radioelement baseline project [30]. Since data values from different gamma surveys are not directly comparable, a global radioelement baseline for gamma ray spectrometric data requires that all gamma ray data be acquired and processed in a globally consistent way. This will ensure that all radioelement estimates are tied to and consistent with agreed reference standards. A radioelement baseline is a set of radioelement measurements that conform to some standard and depict the concentration of the radioelements at the Earth’s surface at some point in time. The primary reference standards are the geological reference materials for laboratory gamma ray spectrometry issued in 1987 by the IAEA Laboratories, Seibersdorf, in Austria [31]. Two essential ingredients underpin a global radioelement baseline for gamma ray spectrometric data:
— A global network of radioelement standards that can be used for the calibration of gamma ray instruments;— A set of standard procedures for the acquisition and processing of radioelement data.
The IAEA technical publication Radioelement Mapping was issued in 2010 [32].Registering old surveys to a global radioelement baseline can be performed by back-calibration. Gamma ray
data from many older surveys were reported in units of counts/sec. Detector type, detector volume, window energy limits and survey height all affect the observed count rates. However, these older, non-standardized data can be back-calibrated. The principle of back-calibration is based on the comparison of the original K, U and Th window count rates with ground radioelement concentrations measured with a well-calibrated portable spectrometer. Instrument sensitivity coefficients are then derived and used to convert the original window count rates (counts/s) to radioelement concentrations reported in % K, ppm eU and ppm eTh [17].
Spectral smoothing techniques for reducing noise in gamma ray spectra are a recent development in the processing of multichannel spectra that have dramatically improved the quality of processed data [33–36]. The methods remove noise from raw gamma ray spectra, and the noise-reduced spectra are then processed in the normal way. There are two methods currently in use: the noise adjusted singular value decomposition (NASVD) method and the maximum noise fraction (MNF) method. Both methods use a principal component (PC) type analysis to
FIG. 3(b). Field use of GR-320.
26

extract the dominant spectral shapes (‘PCs’ or ‘components’) present in the raw spectra. The PCs are then used to reconstruct spectra that have most of the original signal but little of the noise. The NASVD and MNF methods differ mainly in how they normalize the input spectra for noise prior to spectral component analysis. Professional software for the complex processing of gamma ray spectrometric data enables the application of these methods [37].
Gamma radiation from airborne radon interferes with gamma radiation from ground-based uranium sources. Minty et al. [26] introduced two methods for airborne radon removal: the spectral-ratio method and the full spectrum method. These methods are based on separating the specific gamma ray signal of airborne radon from other components of the registered spectrum.
K, U and Th ratios calculated from airborne and ground gamma ray spectrometry measurements are used for eliminating the geometry and overburden effects. While single channels K, U and Th may be significantly affected by these environmental parameters, reducing these effects can be achieved through simple ratios of natural radioelements. Schetselaar [38] published a contribution centred on reducing the effects of vegetation cover on airborne radiometric data.
A renewed interest in uranium exploration has seen a resurgence in the application of radon surveys. The depth of investigation of a radon (222Rn) survey, based on movement by diffusion and convection, is estimated to be between several metres and several tens of metres. Extremely high radon activity concentrations of the order 104 and 105 kBq/m3 are formed around uranium mineralized bodies and are detectable at a certain distance with common radon techniques having a sensitivity of the order 100 kBq/m3. Techniques such as radon on activated charcoal (ROAC) combined with a long field exposure of the detector eliminates thoron signals and diurnal variations. Modern field radon instruments for in situ measurements (emanometers) are equipped with microprocessors that govern the measuring cycles and, when calibrated, display the values of radon and thoron activity concentration in kBq/m3 (Figs 4(a) and 4(b)).
Borehole gamma logging provides a crucial means of accurately locating radioactive minerals as well as estimating subsurface uranium concentrations. Gamma ray emissions of the uranium decay series are mostly generated by radium (98%) and not by uranium itself (2%). Consequently, in the case of radioactive disequilibrium, gamma ray logging may not be a reliable measure of uranium concentration. Correction for radioactive disequilibrium can be applied based on laboratory analyses for uranium and radium content. Alternatively, the methods of direct uranium determination have been applied in boreholes. This is the Ge semiconductor borehole gamma ray spectrometry of the 1001 keV gamma ray emission line of 234Pa, (a close decay product of 238U), borehole X ray fluorescence detection of the U-Kα1 line (98.428 keV), or application of neutron-neutron methods. Three neutron techniques were developed in the USA: Prompt fission neutron (PFN) with a neutron generator (neutron tube) as a source, the delayed fission neutron technique (DFN) with the 252Cf isotopic source and a DFN with a neutron generator. Successful application of the PFN technique has recently been reported from Australia [39].
7.2. ADVANCES IN ELECTRICAL AND ELECTROMAGNETIC METHODS
Recent progress and current status of electrical and electromagnetic methods can be summarized as follows:
— Routine usage of the DC multielectrode resistivity method with developments in continuous and capacitive measurements;
— Applications of the spectral induced polarization (SIP) method to groundwater and environmental problems;— Advances in radio-magnetotelluric (RMT) methods, surface nuclear magnetic resonance (NMR) methods and
time-domain reflectometry (TDR);— Increasing popularity of surface time-domain EM sounding;— Improvements in fixed wing and helicopter-borne TDEM methods;— Development of the marine controlled source EM method mostly used in oil prospecting.
The design of new electrical and electromagnetic instruments was focused on the development of multifrequency EM conductivity meters, progress in data acquisition by means of simultaneous use of multiple receivers in surface EM methods, advances in full-wave recording and signal-to-noise ratio procedures, and
27

FIG. 4(a). Field radon (222Rn) detector LUK-3A (SSM, J.Plch, CZ). The instrument is used for analysis of radon activity concentration (kBq/m3) in soil gas. Alpha radiation of radon is detected by means of Lucas cells.
FIG. 4(b). Field use of LUK-3A; the operator is transferring soil gas into the detector.
28

improvements of universal EM systems for multi-method measurements. Significant progress has also been made in the application of recording full B-field measurements with newly developed coils.
Electrical and electromagnetic data processing has seen improvements in the standard 2-D inversions for the resistivity and IP methods, development of fast approximate algorithms for the interpretation of airborne EM data (conductivity depth images), and continuous research into 2-D/3-D inversion methods for EM measurements.
High powered airborne EM systems have been used extensively in the Athabasca Basin, Saskatchewan, Canada, to map target graphitic conductive packages occurring in the basement below the unconformity, which may be at depths in excess of 700 m.
Ground-based magnetolluric surveys (Transient AMT, CSAMT) have been utilized in the exploration for unconformity related deposits in the Athabasca Basin, Saskatchewan since the mid-1980s. Some of the objectives include the mapping of basement structures, lithologies, including target graphitic metasedimentary packages and proximal metaquartzites, and associated undulations in sub-sandstone basement topography. More recently, MT has been used in the study of the McArthur River unconformity related uranium deposit, Athabasca Basin, Canada [40]. Mapping of sandstone alteration features such as silicification has also been attempted. More recently, MT methods have been used to map target basement graphitic packages at depths in excess of 800 m. Helicopter-borne MT is a new addition to the arsenal of uranium exploration technology. Drill targeting directly on anomalies produced by some high-resolution helicopter borne EM surveys is approaching feasibility.
7.3. ADVANCES IN GRAVITY METHODS
Improvements in the field of gravity methods include the development and wide use of portable (all in one) digital gravity meters with a resolution of 1 µGal. These instruments are capable of resolving very weak gravity anomalies with amplitudes in the order of 10 µGal.
Modelling and data integration have become a standard process for gravity interpretation. Two and three dimensional modelling software can now readily incorporate information on density from well logs, structural information and other geological constraints. This flexibility allows the interpreter to rapidly establish geometries and density contrasts for Earth models that satisfy the observed gravity values.
Full tensor gradiometry (FTG) is a method that was initially intended for mapping underwater missile launch sites and later used as a navigational aid for submarines. In the mid-1990s, the US Government allowed the method and instruments to become commercialized. The FTG has typically been installed on stable platforms such as submarines and ships; however, recent advances have seen the instrument successfully installed in fixed wing aircraft. The FTG has been commercially available for surveys of onshore and offshore oil fields for a number of years, however more recent work has been focused on mineral exploration defining the geometry of the gravity source.
Modern procedures in GPS data acquisition and processing have provided the means of accurately measuring velocity changes in a ship or aircraft. This increased accuracy has led to faster reading of the gravimeter, more accurate corrections, less filtering and minimized signal distortion because of filtering. Shipborne and airborne gravity data are now more accurate. Land-based gravity surveys also make routine use of highly accurate GPS data from modern instruments (Fig. 5).
New developments also include scientific research applications. The long term continuous gravity observations obtained by the superconducting gravimeters (SG) at seven globally distributed stations and the Gravity Recovery and Climate Experiment (GRACE) — satellite derived temporal gravity variations show the capacity of modern gravimeters to resolve gravity changes within the 10-8 m/s2 (μGal) range. Such measurements can distinguish gravity changes due to Earth, ocean tides and atmosphere, which attain 10–7 m/s2 (10 μGal) [41, 42]and are promising for location of some mineralized bodies. Project GRACE allowed changes of the gravity field in time to be measured and to register mass movements caused by global and regional sources.
7.4. ADVANCES IN MAGNETIC METHODS
Regional airborne magnetic gradiometer surveys are routinely flown to map geological contacts and structures. Processed magnetic field data sets are one of the most common sources of information utilized in
29

uranium exploration as a complement to geological mapping, or as a primary tool in drift covered terrains as well as in the search for deep blind deposits. Recent advances include the development of three-axis magnetic gradiometry technology that when coupled with advanced global positioning and altitude control systems, offers the potential for refined results from processing, modelling and inversions in addition to the increased spatial resolution of magnetic anomalies.
Today, alkali vapour magnetometers are widely used for magnetic surveys, although some proton precession instruments (including the Overhauser variant) are still in use for ground surveys (Fig. 6). Fluxgate magnetometers are used for borehole surveys.
FIG. 5. Modern gravity surveys require highly accurate GPS systems to resolve ever smaller anomalies. This survey from Australia shows two gravity meters under a GPS controlled base station.
FIG. 6. Magnetometer and GSM-19 gradiometer and the Overhauser system (GEM Systems, Inc.). This instrument measures the total magnetic field and vertical gradient of the magnetic field with a sensitivity of 0.01 nT.
30
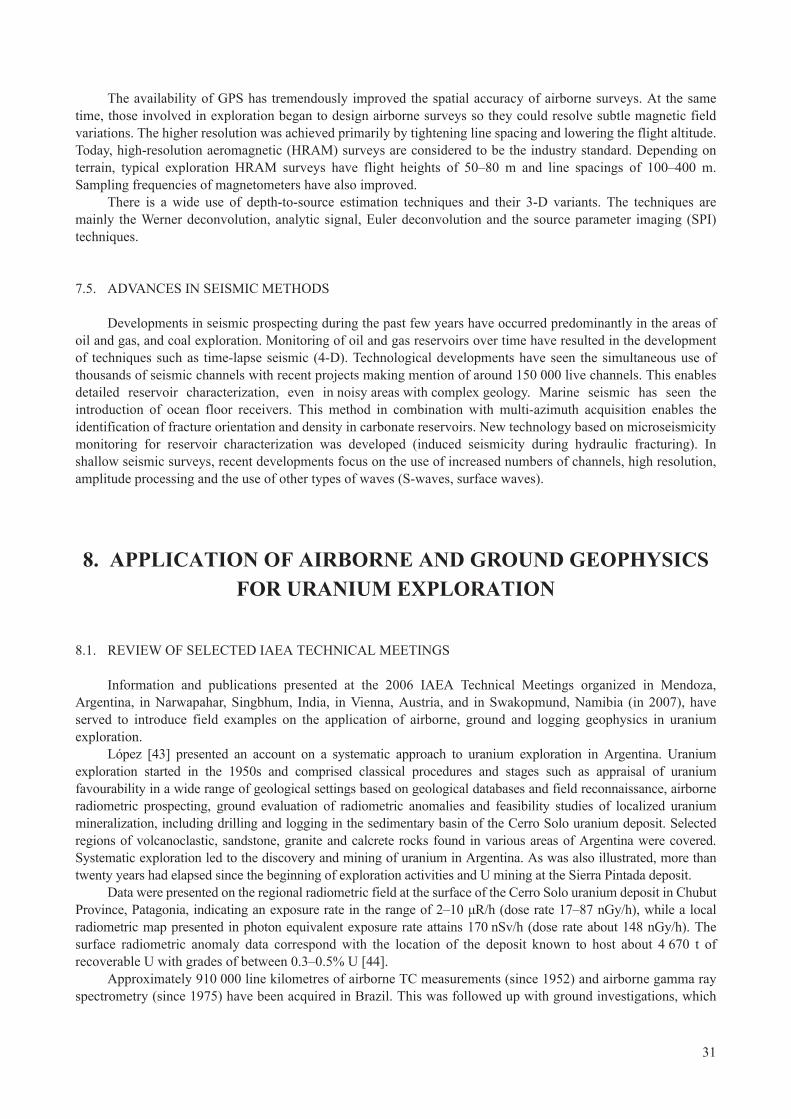
The availability of GPS has tremendously improved the spatial accuracy of airborne surveys. At the same time, those involved in exploration began to design airborne surveys so they could resolve subtle magnetic field variations. The higher resolution was achieved primarily by tightening line spacing and lowering the flight altitude. Today, high-resolution aeromagnetic (HRAM) surveys are considered to be the industry standard. Depending on terrain, typical exploration HRAM surveys have flight heights of 50–80 m and line spacings of 100–400 m. Sampling frequencies of magnetometers have also improved.
There is a wide use of depth-to-source estimation techniques and their 3-D variants. The techniques are mainly the Werner deconvolution, analytic signal, Euler deconvolution and the source parameter imaging (SPI) techniques.
7.5. ADVANCES IN SEISMIC METHODS
Developments in seismic prospecting during the past few years have occurred predominantly in the areas of oil and gas, and coal exploration. Monitoring of oil and gas reservoirs over time have resulted in the development of techniques such as time-lapse seismic (4-D). Technological developments have seen the simultaneous use of thousands of seismic channels with recent projects making mention of around 150 000 live channels. This enables detailed reservoir characterization, even in noisy areas with complex geology. Marine seismic has seen the introduction of ocean floor receivers. This method in combination with multi-azimuth acquisition enables the identification of fracture orientation and density in carbonate reservoirs. New technology based on microseismicity monitoring for reservoir characterization was developed (induced seismicity during hydraulic fracturing). In shallow seismic surveys, recent developments focus on the use of increased numbers of channels, high resolution, amplitude processing and the use of other types of waves (S-waves, surface waves).
8. APPLICATION OF AIRBORNE AND GROUND GEOPHYSICS FOR URANIUM EXPLORATION
8.1. REVIEW OF SELECTED IAEA TECHNICAL MEETINGS
Information and publications presented at the 2006 IAEA Technical Meetings organized in Mendoza, Argentina, in Narwapahar, Singbhum, India, in Vienna, Austria, and in Swakopmund, Namibia (in 2007), have served to introduce field examples on the application of airborne, ground and logging geophysics in uranium exploration.
López [43] presented an account on a systematic approach to uranium exploration in Argentina. Uranium exploration started in the 1950s and comprised classical procedures and stages such as appraisal of uranium favourability in a wide range of geological settings based on geological databases and field reconnaissance, airborne radiometric prospecting, ground evaluation of radiometric anomalies and feasibility studies of localized uranium mineralization, including drilling and logging in the sedimentary basin of the Cerro Solo uranium deposit. Selected regions of volcanoclastic, sandstone, granite and calcrete rocks found in various areas of Argentina were covered. Systematic exploration led to the discovery and mining of uranium in Argentina. As was also illustrated, more than twenty years had elapsed since the beginning of exploration activities and U mining at the Sierra Pintada deposit.
Data were presented on the regional radiometric field at the surface of the Cerro Solo uranium deposit in Chubut Province, Patagonia, indicating an exposure rate in the range of 2–10 μR/h (dose rate 17–87 nGy/h), while a local radiometric map presented in photon equivalent exposure rate attains 170 nSv/h (dose rate about 148 nGy/h). The surface radiometric anomaly data correspond with the location of the deposit known to host about 4 670 t of recoverable U with grades of between 0.3–0.5% U [44].
Approximately 910 000 line kilometres of airborne TC measurements (since 1952) and airborne gamma ray spectrometry (since 1975) have been acquired in Brazil. This was followed up with ground investigations, which
31

led to the discovery of nine uranium deposits with appreciable U reserves [45]. Most of these deposits are hosted in Proterozoic age rocks.
A review of uranium exploration in India was presented by Chaki [46], highlighting the application of radiometric, electrical, electromagnetic and logging techniques. The Meghalaya plateau in north-east India hosts uranium mineralization in palaeochannels, which are situated in Cretaceous arkosic-feldspathic sandstone with tertiary cover. Positive exploration results were achieved through the application of remote sensing, radiometric and geological survey methods. Geophysical methods were capable of identifying the course of the paleochannels and delineation of subsequent drilling. Exploration of unconformity related mineralization in the Cuddapah basin in south-west India was carried out using airborne TDEM, ground geophysics, radiometrics, geochemical methods and drilling. A mixture of geophysical methods was used to investigate exploration targets in the Delhi–Aravalli fold belt in NW India. Ground IP surveys using a dipole–dipole array configuration successfully identified zones of higher chargeability and lower resistivity. Subsurface conductors several hundred metres in length were defined by the Turam EM method. EM methods were also effective in the detection of uranium associated sulphide targets. Additional airborne TDEM, ground geophysics and drilling campaigns have identified new mineralized bodies. A long term investigation into the Kaladgi-Badami Basin commenced in 1961. The basement consists of granites, gneisses and schists, and is covered by arenaceous, argillaceous and carbonate sediments. Investigation of the basin was undertaken by various methods, including geological activities, airborne gamma ray spectrometry, airborne magnetic surveying and various ground geophysical methods. Subsurface sources of radioactivity were quantified through drilling and logging procedures.
Hadisusastro [47] reported outcropping uranium mineralization associated with sulphides in metapelites of the Amir Engala Sector, West Kalimantan, Indonesia. An induced polarization survey was applied to map underground U mineralization using 25 m station intervals along 50 m spaced grid lines. Chargeability and resistivity values indicated sulphide mineralization was likely to have a chargeability >40 mV/V and resistivity <1000 m. Borehole logging data revealed uranium mineralization over a depth interval of 36–69.5 m with values up to 0.29% U.
Chaturvedi [48] presented advanced techniques of airborne uranium exploration in India. The general approach to uranium exploration includes the application of remote sensing, integrated studies and airborne surveying, all aimed at the delineation of prospective areas through the refinement of geological information. Airborne surveying in India was initiated in 1956 and reached a highly technical level in the 1990s. Surveys included gamma ray spectrometry, magnetometry and EM methods that were applied at a flying altitude of 120 m using a fixed wing aircraft or helicopter with flight line separation mostly around 1 km. An airborne gamma ray spectrometer was equipped with a 50 L NaI(Tl) scintillation detector and calibrated over five calibration pads at the Nagpur airport calibration facility. A caesium vapour magnetometer of high sensitivity and a multi-frequency EM system with the sensor housed in a tow-bird comprise the helicopter instrument set-up. The multidiscipline interpretation presented included remote sensing, geological mapping, K, U, Th and ternary radioelement maps, airborne magnetic maps, EM maps and statistical data processing.
Aref [49] presented results from the Egyptian Nuclear Materials Authority’s airborne gamma ray spectrometry and magnetometry survey work in Egypt. Equipment installed in survey aircraft included a caesium vapour magnetometer, gamma ray spectrometer with a 50 L NaI(Tl) scintillation detector and a 4 L upward-looking detector, trimble pathfinder, computer display of survey area and differential GPS. Several radioactivity maps from the Sinai and north-western desert highlight the technical level of data processing and reporting. Ratio plots of U/Th, U/K and Th/K demonstrated areas of U potential.
Roux [50] described the latest advanced airborne EM and gravity technology. Uranium mineralization associated with conductive graphitic zones in the Athabasca Basin was surveyed with the Megatem system. Modelling showed an increased depth of exploration of up to 700 m below the surface. The Tempest EM system has a bandwidth between 25 Hz and 37.5 kHz, and was tested in Arnhem Land, Australia. Data collected along 200 m line spacings were converted to conductivity sections with subsequent manipulation to produce a 3-D image of subsurface conductance. An airborne gravity gradiometer installed on an inertial platform and placed in a fixed-wing airplane was tested in the Athabasca Basin. Multiple passes over a 45 km long ground gravity profile produced excellent repeatability of airborne traverses with comparisons against ground data indicating deviations of the order ±2 mGal.
A geological and structural description of uranium mineralization in the Athabasca Basin has been summarized by Macdonald [51]. Several geophysical techniques were applied by Cameco Corporation, including
32

high resolution magnetics, gravity, gamma ray spectrometry, time domain EM, DC resistivity and magnetotellurics. The evolution of exploration was characterized by stages from the location of radioactive boulders at the surface to the successful integration of geology and geophysical knowledge presenting subsurface conductors as drilling targets. Responses of airborne EM methods over subsurface objects at depths of several hundred metres helped to direct the exploration strategy.
Li [52] has described the development of geophysical techniques for uranium exploration in China. The Airborne and Remote Sensing Centre of Nuclear Industry (ARCN) is equipped with airborne gamma ray spectrometers, magnetometers, an airborne VLF-EM system, an aerosol measurement system, ground geophysical instruments, and geochemical and mapping facilities. ARCN has undertaken airborne geophysical survey work for more than 45 years and has airborne surveys covering more than 4 000 000 km2, discovering about 80% of China’s U resources. A calibration facility with 12 calibration pads provides calibration of portable gamma ray spectrometers (Fig. 7). Transportable calibration concrete segments serve for the calibration of logging instruments. Large area calibration pads were constructed for airborne gamma ray spectrometers.
Aboulnaga [53] reported on ground gamma ray spectrometry studies that were conducted in the north Elerediya granitic pluton of the central-eastern desert in Egypt. Ground gamma ray spectrometry measurements identified anomalous concentrations of radionuclides up to 7% K, 50 ppm eU and 150 ppm eTh. Illustrative satellite imagery provided by Google Earth demonstrates how this easily accessible imagery characterizes exposed geological structures by colours and sharply delineates their position and boundaries.
The direct determination of uranium grades from boreholes using a prompt fission neutron tool (PFN) has been described by Colin Skidmore, SXR Uranium One, Inc., and summarized by Geoscience Australia. PFN technology works by emitting neutrons into the surrounding mineralized sands. Interaction with any 235Uencountered in the mineralized zone causes a fission reaction, which emits characteristic 2 MeV prompt fission neutrons. The PFN tool counts these neutrons, giving a measure of the 235U grade. The PFN tool measures both thermal neutrons (Tn), the product of the generated neutron flux, and epithermal neutrons (En), the fission product of 235U. It achieves this by measuring the lower energy thermal neutrons in an outer ring of six BF3 gas filled detectors with higher energy epithermal neutrons measured by a central helium detector. The ratio of En/Tn is directly proportional to the grade of 235U. Sandstone hosted uranium deposits are considered to have the normal isotopic ratio for uranium (235U 0.71% and 238U 99.28%), therefore the PFN probe provides a direct measure of the total uranium. The sample volume measured by the tool is considered to be a sphere of approximately 0.5 m in diameter. To ensure reliable counting statistics, the tool is run at approximately 0.6 m per minute.
FIG. 7. Stationary calibration pads used in the calibration of portable gamma ray surveying instruments at the Airborne Survey and Remote Sensing Centre of Nuclear Industry (ARCN), China [52].
33

8.2. EXAMPLES OF APPLICATIONS
8.2.1. Radiometric methods
New radiometric map of Australia
The existing global gamma ray spectrometry coverage has been acquired over several decades. Throughout this period, there has been a gradual development in measuring techniques, detectors, instruments and their calibration, data processing techniques and data reporting; all resulting in radiometric maps, which are often not directly comparable. Unless successfully addressed, these factors limit the usefulness of radioelement data derived from airborne and ground gamma ray surveys. In order to enhance the usefulness of radiometric maps, the IAEA initiated the concept of a global radioelement baseline (Section 7.1). Older radiometric data can now be updated by back-calibration [17].
An excellent example of implementing the concept of a global radioelement baseline on a continental scale is the new radiometric map of Australia [54, 55]. In Australia, over 80% of the continent is covered by gamma ray spectrometric surveys acquired through government initiatives and private company investment over the past 40 years.Thus, where early surveys used different instrumentation and survey parameters, the results are not directly comparable. Geoscience Australia has recently undertaken an Australia-wide airborne geophysical survey (AWAGS) funded under the Australian Government’s Onshore Energy Security Programme to serve as a radioelement baseline for all current and future airborne gamma ray spectrometric surveys in Australia. The survey data were acquired at a nominal survey height of 80 m above ground level along north-south flight lines spaced 75 km apart and east-west tie lines spaced 400 km apart (Fig. 8). The survey data were acquired and processed according to the standards specified by the IAEA [17, 32]. The survey was also back-calibrated at 47 field sites located beneath sections of selected flight lines using a well-calibrated portable gamma ray spectrometer. The final estimates of radioelement concentrations along the AWAGS lines are thus consistent with the IAEA’s radioelement datum [56].
FIG. 8. Locations of the AWAGS survey flight lines [54].
34

The AWAGS survey was then used to adjust the 540 airborne gamma ray spectrometric surveys that comprise Australia’s national radioelement database to a common datum. This was achieved using an enhancement of the method described by Minty in Ref. [57]. For each survey in the national database, both a level shift and a scaling factor were estimated which, once applied, minimized both the differences in radioelement estimates between surveys (where these surveys overlap) and the differences between the surveys and the AWAGS traverses. This procedure effectively levelled the surveys to the IAEA datum to produce a consistent and coherent national gamma ray spectrometric coverage of the Australian continent [54].
The levelled database has been used to produce the first ‘Radiometric Map of Australia’ — levelled and merged composite potassium (% K), uranium (ppm eU) and thorium (ppm eTh) grids over Australia at 100 m resolution. A ternary image (K-red, eU-blue, eTh-green) derived from this database is shown in Fig. 9. The normalized K, U and Th radioelement grids can be used to produce a range of derivative grids such as dose rate and ratios between the radioelements.
There are many benefits of registering gamma ray spectrometric data to a globally consistent baseline. Examples include identification of uranium and thorium provinces, location of uranium anomalies and deposits, estimation of natural background, estimation of uranium mine and mill waste site contamination, comparison of geochemical patterns in survey areas and integration with other geophysical data sets.
Noise reduction in gamma ray spectrometry
Figure 10 shows an example of the spectral smoothing technique for airborne gamma ray spectrometry data. Minty and McFadden [34] developed an enhancement to the NASVD and MNF methods whereby the input spectra
FIG. 9. Ternary image (K-red, eU-blue, eTh-green) of Australia derived from the new, leveled National Radioelement Database (image provided by Geoscience Australia).
35

are first sorted into clusters on the basis of similarity in spectral shape. The application of the NASVD and MNF methods to these clusters typically halves the K, U and Th errors in determination compared with those obtained when the data are processed by survey or flight.
8.2.2. Electrical and electromagnetic methods
Paleochannel EM exploration
Recent advances in the search for paleochannel related uranium mineralization has seen a growing use of airborne electromagnetic surveys targeting conductivity contrasts between paleochannels and the surrounding host
FIG. 10. Estimated thorium concentrations for part of Geoscience Australia’s Fowler’s Gap survey area. The data were processed using (top) the conventional 3-channel method, (bottom) the 3-channel method after NASVD smoothing by clusters.
36

rocks. The example presented here demonstrates the application of a broadband airborne electromagnetic system [58] in defining a paleochannel system and a derived product used to assist the exploration process. Typically, information from the survey is presented in the form of a Conductivity Depth Image (CDI) as shown in Fig. 11. Additional processing of the survey data was undertaken to produce a map of depth to resistive basement as shown in Fig. 12.
Ground TDEM
An example of the application of large-loop TDEM methods for the exploration of unconformity-related uranium deposits in the Athabasca Basin (Saskatchewan, Canada) is presented.
Three types of large loop configurations are routinely used in the Athabasca Basin (Fig. 13). Fixed loop surveys are the simplest and most common type of TDEM survey. They employ one or two loops and a roving receiver, and are used for the initial ground identification and mapping of conductive trends correlative with target subsandstone and basement graphitic horizons known to be associated with uranium deposits. Tandem moving loop(or Slingram) surveys are used for EM profiling and sounding. The transmitter and one or two receivers move in tandem along the survey line at a constant separation. The primary advantage is a constant array for easier conductor identification against a high background response. The data are interpreted channel by channel in profile form. Step loop (or stepwise moving loop) is a hybrid survey that involves fewer loop moves than tandem moving loop and employs roving receivers as with fixed loop. The principal advantages are the collection of more data for better conductor resolution, and lower total survey costs when compared to the tandem moving loop method. Step loop surveying can be used for profiling, sounding and the creation of imaged sections.
An example showing the location of conductors after systematic step loop and fixed loop surveying is presented in Fig. 14. The surveys defined multiple subparallel conductors varying in strength from weak to strong. Uranium mineralization at depth is associated with a strong conductor.
An example of step loop data from line 20E is presented in Fig. 15. Late channel data (channels 14–20) are plotted in profiles for loops 1 to 7 (horizontal component in black, vertical in blue). A channel 20 pseudosection is plotted and contoured beneath with readings plotted at the midpoint between the transmitter and receiver at a
FIG. 11. Three conductivity depth images across a paleochannel environment in Australia, highlighting changes in conductivity associated with the channel in-fill material and a more resistive basement. This example is from South Australia (image provided by Toro Energy Ltd).
37

pseudodepth equal to one-half of the transmitter-receiver separation. A plot of composite in-loop data (vertical component in red) is plotted above the pseudosection. Conductor anomalies appear in profile as x component peaks and z inflections in profile and as triangular to half-moon shaped lows (in colder colours). A tight package of three conductors is interpreted. The uranium mineralized zone is associated with the central conductor as indicated.
Airborne electromagnetics
The following is an example of the application of airborne EM in the search for unconformity related uranium mineralization. In this example, it is not the actual unconformity that is being targeted, rather it is the alteration around the unconformity that has resulted in changes to the electrical properties of the rocks. The geophysical setting is best summarized as a weakly conductive horizontal plate in an electrically neutral, homogeneous half-space. In this example, a broadband airborne EM system [58] successfully detected very subtle responses associated with changes in conductivity directly related to chemical and physical alteration processes around the unconformity horizon (Fig. 16). In terms of electrical properties, rock types above and below the unconformity are highly resistive, resulting in excellent physical property contrast with the low resistivity alteration products around the unconformity (Fig. 17).
FIG. 12. An end product showing depth to resistive basement with values ranging from near surface (white areas) to depths >70 m. The topography and architecture of the channel base is clearly defined. The survey area measures approximately 25 × 25 km with survey data acquired along lines spaced 400 m apart. This example is from South Australia (image provided by Toro Energy Ltd).
38

FIG. 13. Three large-loop TDEM methods.
FIG. 14. Conductor locations after systematic step loop and fixed loop coverage (image provided by Cameco Corporation).
39

FIG. 15. Example of step loop survey profile data from the Collins Creek project, Athabasca Basin, Canada, showing the correlation of TDEM data with an unconformity related uranium occurrence (image provided by Cameco Corporation).
Maximum depth of investigation typically 300m
Alteration around unconformity
Land surface
Probable unconformity
FIG. 16. Alteration of rocks around the unconformity allows the indirect determination of the unconformity location and depth by measuring subtle changes in electrical properties associated with the alteration effects above and below the actual unconformity. The presence of the unconformity (dotted line) is thereby inferred from these changes. This example is from the Arnhem Land region of Northern Australia (image provided by Cameco Australia).
40
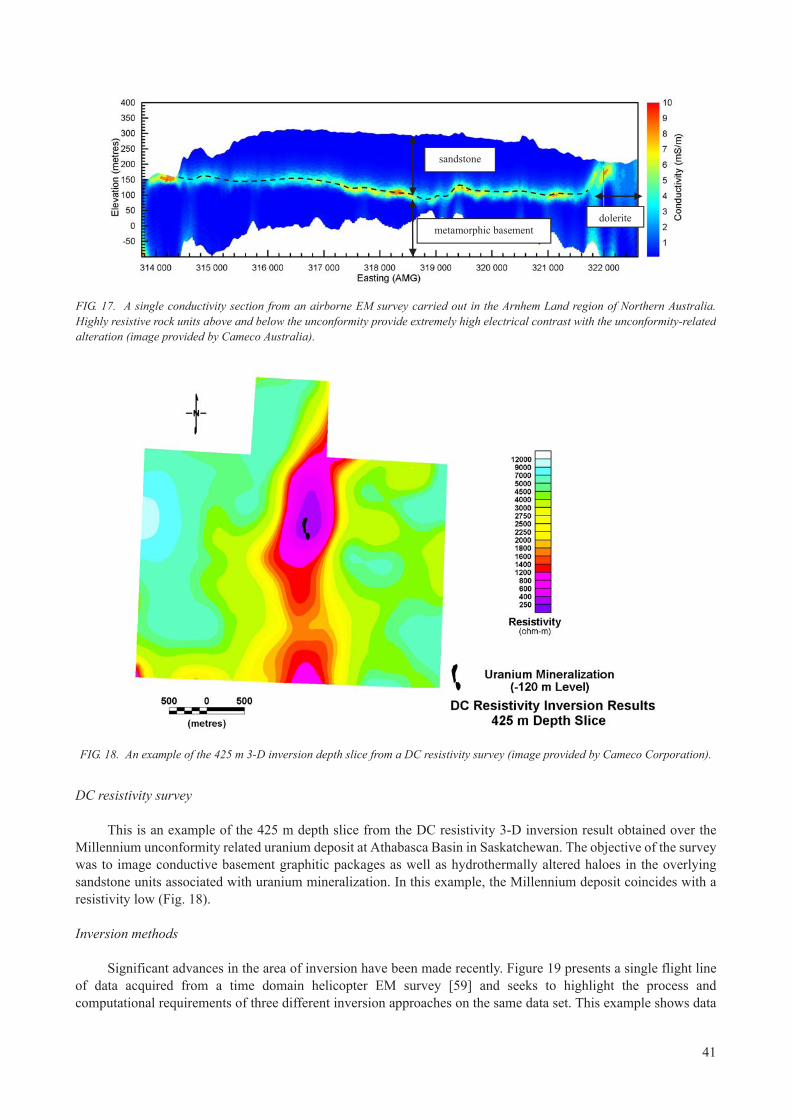
DC resistivity survey
This is an example of the 425 m depth slice from the DC resistivity 3-D inversion result obtained over the Millennium unconformity related uranium deposit at Athabasca Basin in Saskatchewan. The objective of the survey was to image conductive basement graphitic packages as well as hydrothermally altered haloes in the overlying sandstone units associated with uranium mineralization. In this example, the Millennium deposit coincides with a resistivity low (Fig. 18).
Inversion methods
Significant advances in the area of inversion have been made recently. Figure 19 presents a single flight line of data acquired from a time domain helicopter EM survey [59] and seeks to highlight the process and computational requirements of three different inversion approaches on the same data set. This example shows data
sandstone
metamorphic basement dolerite
FIG. 17. A single conductivity section from an airborne EM survey carried out in the Arnhem Land region of Northern Australia. Highly resistive rock units above and below the unconformity provide extremely high electrical contrast with the unconformity-related alteration (image provided by Cameco Australia).
FIG. 18. An example of the 425 m 3-D inversion depth slice from a DC resistivity survey (image provided by Cameco Corporation).
41

collected from the East Kimberley region on the Australian continent in an area where the target horizon is a thin, gently dipping sandstone unit unconformably overlying a resistive basement. Uranium mineralization is hosted within the sandstone unit. The sandstone unit is manifested in the data as a thin, lower order conductive layer and can be clearly seen in the three inversion sections in Fig. 19.
Data was collected using a helicopter airborne EM system [59]. A single line from this survey was inverted using three different approaches:
(1) A 30 layer fast approximate inversion (FAI) using the iTEM code developed by Christensen [60, 61];(2) A 17 layer smooth model inversion using the 1-D laterally-constrained inversion (LCI) algorithm
implemented in the Aarhus Geophysics Workbench software package [62];(3) A 4 layer inversion using the 1-D LCI, with constraints applied to the layer resistivities in addition to the
lateral constraints.
The three approaches presented here demonstrate the differences in each method but also the significant differences in the computational time required to generate each result.
iTEM is a fast approximate inversion, which yields smooth multilayer layered-Earth inversions (LEIs) in a fraction of the time required for conventional non-linear inversion. iTEM typically requires less than 0.5 s per sounding for inversion, and the computation is easily parallelized for further increases in processing speed.
Full non-linear inversion of the EM data was also performed using the LCI algorithm. In this process, a group of TEM soundings are inverted simultaneously using 1-D models. The individual 1-D models are constrained laterally on a number of model parameters such as resistivity, layer thickness and/or depth to layer boundaries; that is, these parameters are permitted to vary only gradually along a profile. The degree of lateral constraint can be set by the user depending on the local geology. The result of this is that the LCI inversion is a quasi-2-D model section that varies smoothly along the profile. In this example, a 17 layer LCI has yielded a result quite similar to that obtained from iTEM, although deep artifacts (vertical striping) in the iTEM section have been removed. The main westerly dipping conductive layer (sandstone unit) also appears to have been somewhat better resolved at depth by the LCI. In this instance, the 17 layer LCI required 14 760 seconds to compute on a single CPU, or 97 times that required for the iTEM inversion.
The third image shows an LCI using a 4-layer model. The previous two inversions suggest a geoelectric structure in the vicinity of the main sandstone unit (westerly dipping conductor) that can be defined using four layers with three layers (conductor, resistor, conductor) overlying a resistive basement. The final 4 layer model shows very good agreement with both iTEM and the 17 layer LCI. The 4 layer LCI model appears to provide the
FIG. 19. Three inversions of the same airborne EM data set. The target geological horizon is manifest as a thin, shallowly dipping, low-order conductive layer above a resistive basement. The inversions are iTEM (top), a 17-layer LCI (middle) and a 4-layer LCI (bottom). Computational time taken for each inversion varies considerably (image provided by U3O8 Limited, Australia).
42

best definition of the main dipping conductor, particularly at depth where the conductor appears to be more laterally continuous than in the other inversion sections. The time required to compute the 4 layer model was 2580 s on a single CPU, or 17 times that required for the iTEM inversion.
Permission to publish these data has been given by U3O8 Limited in Australia. The inversion and all processing was completed by Geoforce Pty Ltd in Australia.
8.2.3. Gravity prospecting
Advances in GPS technology and gravity meter instrumentation have facilitated the acquisition of highly detailed and accurate gravity observations. The application of gravity in uranium exploration is based upon the fundamental premise of being able to detect lateral density variations that can then add value to the exploration objective. Very small gravity anomalies can reflect important density changes directly related to geological factors. The example presented in Figs 20(a) and 20(b) is of a gravity survey specifically targeting alteration features in an unconformity setting. The survey comes from an area directly south of the Nabarlek Mine (now closed), Arnhem Land, in the Northern Territory of Australia.
Figure 20(a) shows the Bouguer gravity anomaly over an area measuring approximately 2.5 × 2 km. Figure 20(b) shows the residual gravity anomaly and highlights enigmatic alteration features manifested as subtle gravity lows.
A single drill hole (N147-9) tested one of these lows. Results are presented in Fig. 21, showing the down hole geological interpretation and the resulting alteration intersected at depth. Changes in density observed at the surface are probably related to a combination of dissolution in the overlying sediments as well as the intense chloritization observed around the unconformity.
8.2.4. Magnetic prospecting
Airborne vertical magnetic gradiometry
An example of airborne vertical magnetic gradiometry is presented from the unconformity-related millenium uranium deposit locality at Athabasca Basin in Saskatchewan, Canada. The geological setting is presented in
FIG. 20(a). A detailed gravity survey shows the Bouguer Anomaly targeting the effect of dissolution and alteration in sandstone in an unconformity setting. Lateral changes in subsurface density contribute to the observed anomalies (image provided by Cameco Australia).
43

Fig. 22, which depicts the regional EM conductor, a representation of anomalous sandstone lithogeochemistry, and a geological cross-section. The Millennium zone locality vertical gradient magnetic setting is presented in Fig. 23. The regional B1 conductive package is hosted in a north-south to north-east trending magnetic low related to folded graphite-bearing basement metasediments. A significant north-west trending magnetic break crosses the area and may be correlative with the Millennium uranium deposit. Subsequent to the discovery of the deposit, step loop EM surveys were carried out in support of drilling and identified conductors to the west of the historic B1 conductor, including an important “graphitic marker” associated with the deposit.
8.2.5. Seismic prospecting
Seismic survey applications
These are examples of the application of seismic surveys over the Millennium unconformity-related uranium deposit at Athabasca Basin in Saskatchewan. The primary objective of the seismic survey was to map the detailed location of the unconformity and vertically dipping structures in and around planned mine workings for geotechnical purposes, including the optimal location of the proposed mineshaft. The secondary objective of the survey was to determine if seismic methods could be used to directly image alteration and mineralization. Three survey methods were employed: 3-D surface seismic surveying, 3-D vertical seismic profiling (VSP), and side-scan seismic profiling.
The 3-D surface seismic survey couples best with horizontally layered strata and has effectively imaged the unconformity (Fig. 24). A few major subhorizontal features are visible in the migrated data. There is a lack of definition of the unconformity, and generally in the seismic signal, around the deposit. This anomaly is outlined in purple and is interpreted to be associated with significant clay alteration that exists around the deposit and extends
FIG. 20(b). The residual Bouguer anomaly highlighting subtle gravity lows associated with strong alteration and quartz dissolution of sedimentary rocks (image provided by Cameco Australia).
44

FIG. 21. The geological cross-section following drill testing of the gravity low (image provided by Cameco Australia).
45

FIG. 22. Geological setting of the Millennium zone at Athabasca Basin in Canada (image provided by Cameco Corporation).
FIG. 23. Vertical magnetic gradient setting of the Millennium zone at Athabasca Basin in Canada (image provided by Cameco Corporation).
46
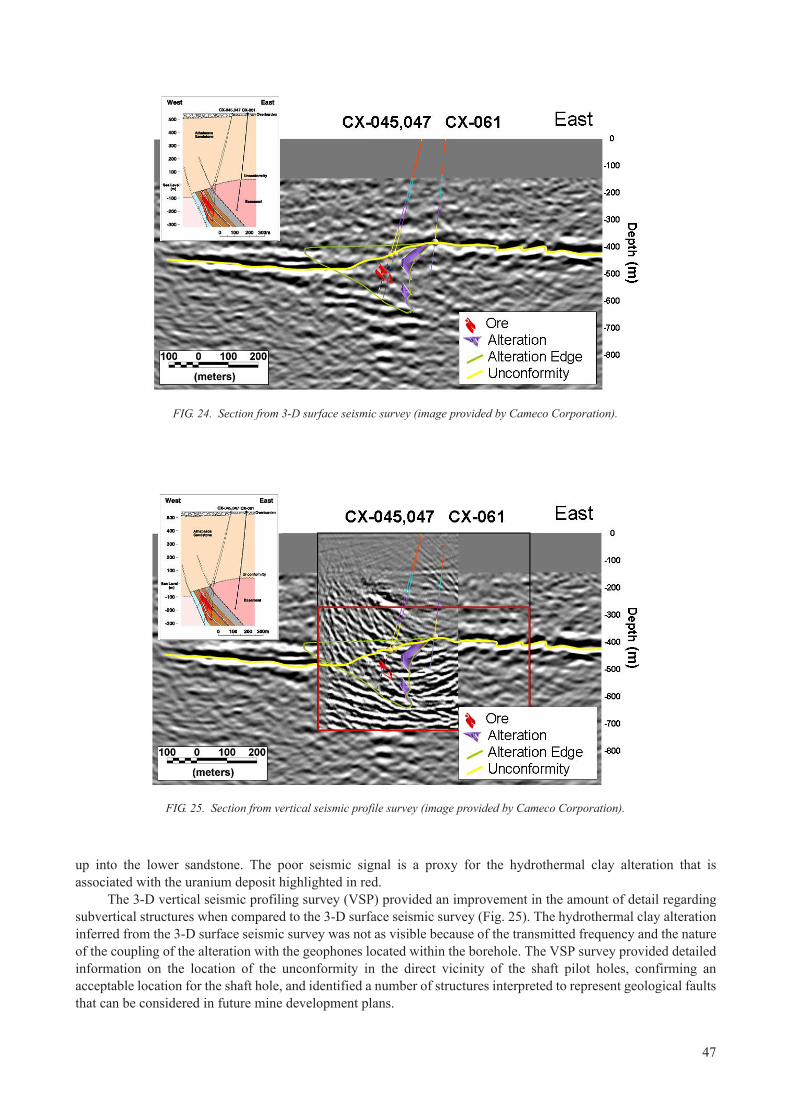
up into the lower sandstone. The poor seismic signal is a proxy for the hydrothermal clay alteration that is associated with the uranium deposit highlighted in red.
The 3-D vertical seismic profiling survey (VSP) provided an improvement in the amount of detail regarding subvertical structures when compared to the 3-D surface seismic survey (Fig. 25). The hydrothermal clay alteration inferred from the 3-D surface seismic survey was not as visible because of the transmitted frequency and the nature of the coupling of the alteration with the geophones located within the borehole. The VSP survey provided detailed information on the location of the unconformity in the direct vicinity of the shaft pilot holes, confirming an acceptable location for the shaft hole, and identified a number of structures interpreted to represent geological faults that can be considered in future mine development plans.
FIG. 24. Section from 3-D surface seismic survey (image provided by Cameco Corporation).
FIG. 25. Section from vertical seismic profile survey (image provided by Cameco Corporation).
47

The side-scan seismic survey provided very high frequency data in the immediate vicinity of the drill hole (Fig. 26). The goal was to add detailed geological and geotechnical information and to identify the presence and nature of sandstone structures in the vicinity of the proposed mineshaft pilot hole. The colours displayed along the axis of drill hole CX-061 define the sonic velocity log. Warmer colours indicate areas of higher velocity as indicated on the colour bar. The unconformity between basement rocks and upper sandstones is demarcated by a higher velocity signal in the basement. The data suggest that the sandstone column in the immediate vicinity of the mineshaft pilot drill hole is competent and devoid of significant structures.
Continental scale geophysics
Exploration for uranium mineralization can be assisted by regional activities, which are often supported by governments as is the case in Australia. The Australian Government, through Geoscience Australia, has undertaken a programme of activities under the operational title of the Onshore Energy Security Program (OESP). The intent of this programme is to:
— Secure diverse energy sources through the provision of new geoscience data for explorers to test the potential of frontier provinces;
— An improved understanding of Australia’s onshore energy resource base;— Attract exploration investment by reassessing and promoting the potential of onshore Australia for petroleum
and gas resources, geothermal energy resources as well as uranium, thorium and other mineral resources; and — Provide advice as required on the nation’s onshore energy resources.
Two examples of data output from this programme are discussed here.
OESP Seismic Acquisition and Processing Project
During July 2008, 262 km of deep crustal seismic reflection data (08GA-C1) were acquired along a continuous north-south trending line running parallel to the eastern shore of Lake Frome in South Australia (Fig. 27). The data will be used for the assessment of uranium resources and geothermal energy potential in this important mineral and energy province of South Australia.
FIG. 26. Results of side-scan borehole seismic survey (Image provided by Cameco Corporation).
48
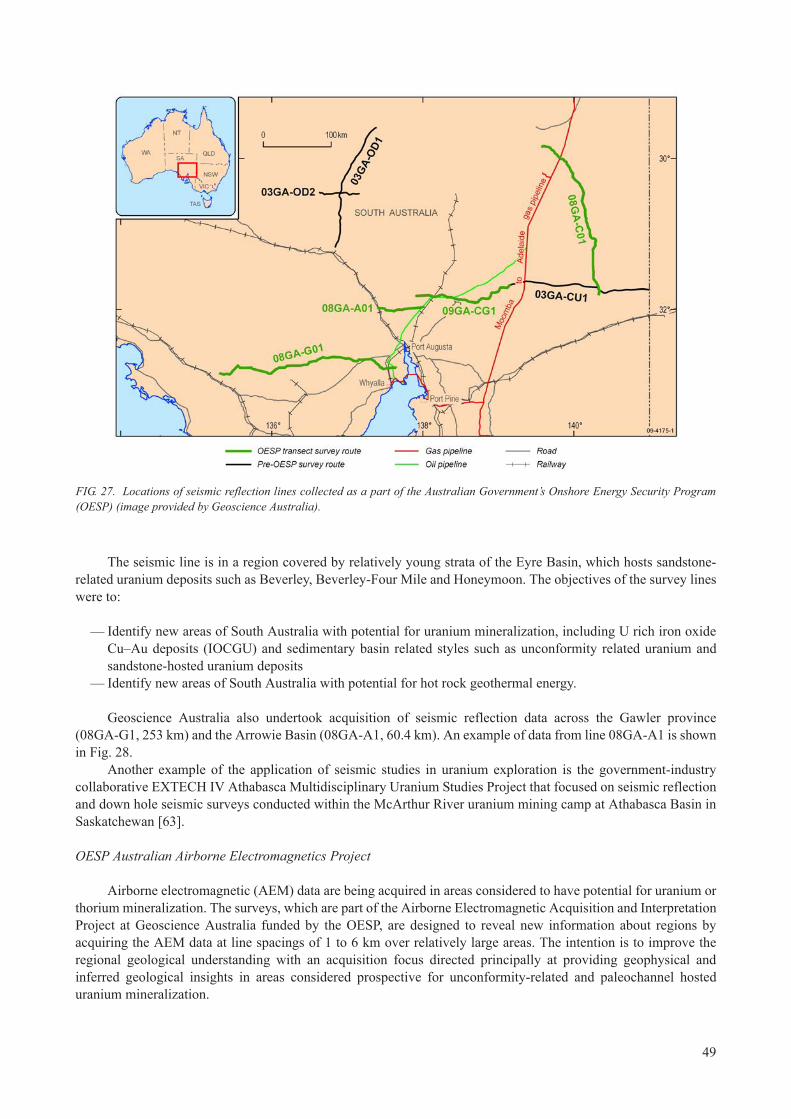
The seismic line is in a region covered by relatively young strata of the Eyre Basin, which hosts sandstone-related uranium deposits such as Beverley, Beverley-Four Mile and Honeymoon. The objectives of the survey lines were to:
— Identify new areas of South Australia with potential for uranium mineralization, including U rich iron oxide Cu–Au deposits (IOCGU) and sedimentary basin related styles such as unconformity related uranium and sandstone-hosted uranium deposits
— Identify new areas of South Australia with potential for hot rock geothermal energy.
Geoscience Australia also undertook acquisition of seismic reflection data across the Gawler province (08GA-G1, 253 km) and the Arrowie Basin (08GA-A1, 60.4 km). An example of data from line 08GA-A1 is shown in Fig. 28.
Another example of the application of seismic studies in uranium exploration is the government-industry collaborative EXTECH IV Athabasca Multidisciplinary Uranium Studies Project that focused on seismic reflection and down hole seismic surveys conducted within the McArthur River uranium mining camp at Athabasca Basin in Saskatchewan [63].
OESP Australian Airborne Electromagnetics Project
Airborne electromagnetic (AEM) data are being acquired in areas considered to have potential for uranium or thorium mineralization. The surveys, which are part of the Airborne Electromagnetic Acquisition and Interpretation Project at Geoscience Australia funded by the OESP, are designed to reveal new information about regions by acquiring the AEM data at line spacings of 1 to 6 km over relatively large areas. The intention is to improve the regional geological understanding with an acquisition focus directed principally at providing geophysical and inferred geological insights in areas considered prospective for unconformity-related and paleochannel hosted uranium mineralization.
FIG. 27. Locations of seismic reflection lines collected as a part of the Australian Government’s Onshore Energy Security Program (OESP) (image provided by Geoscience Australia).
49

An example of the AEM data collected over one of the survey regions is shown in Fig. 29. This data was acquired with a broadband time-domain AEM system [58] over the area indicated in Fig. 30 and forms a part of the Pine Creek AEM programme, which covers a larger area than is shown here.
8.2.6. Well logging
The technology of direct radiometric determination of uranium in boreholes was developed to avoid problems of false estimates of uranium reserves in subsurface uranium occurrences caused by disequilibrium. Since widely used standard gamma ray tools respond to natural gamma radiation originating from 214Bi and 214Pb, the decay products of 238U, disequilibrium in the uranium decay series can lead to inaccurate estimates of uranium grades.
Prompt fission neutron technology (PFN) was originally developed by Mobil Research and Development and Sandia Laboratories in the USA in the 1970s. As the PFN technique measures prompt neutrons originating from the fission of 235U within the borehole, the detected PFN flux is a direct response to the presence of uranium.
FIG. 28. An example of seismic reflection data collected as part of the OESP. These data is an interpreted migrated seismic section of Line 08GA-A1 across the western Arrowie Basin (image provided by Geoscience Australia).
50

FIG. 29. An example of the data available from the Rum Jungle TEMPEST AEM survey, which shows the calculated product of interval conductivity between the depth interval of 40 to 60 m below the surface. This information is published with the permission of the CEO, Geoscience Australia © Commonwealth of Australia (Geoscience Australia) 2009. The Commonwealth gives no warranty regarding the data’s accuracy, completeness, currency or suitability for any particular purpose. Visit the website http://www.ga.gov.au to access the most current version of the data.
FIG. 30. Location of the Rum Jungle TEMPEST AEM survey collected as a part of the larger Pine Creek AEM Programme.
51

A borehole tool with a neutron source irradiates the surroundings of the borehole and the resultant 2 MeV prompt fission neutrons originating from mineralization are detected. Figure 31 presents an example of logging by a standard gamma total count technique (yellow trace) and a corresponding estimate of uranium grade using a number of correction factors (solid black trace). The PFN estimate of uranium grade in the mineralized zone is marked red. Since both estimates are reported in identical scales, their difference shows an underestimation of U content would occur when using only a standard total count natural gamma ray tool.
9. FURTHER READING
Additional information on select geophysical methods can be found in the following references:
— Telford et al. [15]; — Hearst et al. [64];— IAEA [65]; — Sheriff et al. [66];— Reynolds [67];— Jacoby et al. [68].
FIG. 31. Borehole logging example demonstrating the integration of multiple data sets, including the comparison of grade estimates from natural gamma and prompt fission neutron probes (image provided by Uranium One Australia Pty Ltd).
52

REFERENCES
[1] OECD NUCLEAR ENERGY AGENCY, INTERNATIONAL ATOMIC ENERGY AGENCY, Uranium 2009: Resources, Production and Demand, OECD, Paris (2010).
[2] McMURRAY, J., The relationship between the uranium market price and supply-demand relationships. Recent developments in uranium exploration, production and environmental issues, IAEA-TECDOC-1463, IAEA, Vienna (2005) 73–78.
[3] INTERNATIONAL ENERGY AGENCY, World Energy Outlook 2007, OECD, Paris (2007).[4] URANEWS, April 2008 Edition (2008).[5] KARA, M. (Chairman of the Reporting Committee), Thorium as an Energy Source – Opportunities for Norway, Thorium Report
Committee, Norway (2008).[6] INTERNATIONAL ATOMIC ENERGY AGENCY, World Distribution of Uranium Deposits (UDEPO) with Uranium Deposit
Classification, IAEA-TECDOC-1629, IAEA, Vienna (2010).[7] TAUCHID, M., UNDERHILL, D.H., Uranium Deposits of the World, Proc. of Exploration 97, Canada (1997), paper 25,
177–180.[8] McKAY, A., LAMBERT, I., MIEZITIS, Y., “Australia’s uranium geology, resources, and potential”, Aerial and Ground
Geophysical Techniques for Uranium Exploration and Advanced Mining and Milling Methods and Equipments (Proc. Tech. Mtg Singbhum, 2006), IAEA, Vienna (2006).
[9] LAMBERT, I., “A new program of regional geoscience data in support of uranium exploration in Australia”, Uranium Small-Scale and Special Mining and Processing Technologies, IAEA, Vienna, 2007.
[10] OTTON, J.K., “Tertiary unconformities and uranium deposits in the western U.S.”, ibid.[11] GUPTA, R., “A new approach to mining and processing of a low grade uranium deposit at Tummalapalle, Andhra Pradesh,
India”, ibid.[12] DAHLKAMP, F., Uranium Ore Deposits, Springer-Verlag, Berlin–Heidelberg (1993).[13] SLEZAK, J., “Uranium exploration and mining experience in the Czech Republic”, Aerial and Ground Geophysical Techniques
for Uranium Exploration and Advanced Mining and Milling Methods and Equipments (Proc. Tech. Mtg Singbhum, 2006), IAEA, Vienna (2006).
[14] MARES, S., HRACH, S., MATOLIN, M., GRUNTORAD, J., KAROUS, M., SKOPEC, J., Introduction to Applied Geophysics, Reidel, Dordrecht (1984).
[15] TELFORD, W.M., GELDART, L.P., SHERIFF R.E., Applied Geophysics, Cambridge University Press, Cambridge (1990).[16] MUSSETT, A.E., KHAN, M.A., Looking into the Earth, Cambridge University Press, Cambridge (2000).[17] INTERNATIONAL ATOMIC ENERGY AGENCY, Guidelines to Radioelement Mapping Using Gamma Ray Spectrometric
Data, IAEA-TECDOC-1363, IAEA, Vienna (2003).[18] ISO, Atomic and Nuclear Physics, ISO 31-9 (1992).[19] ISO, Nuclear Reactions and Ionizing Radiation, ISO 31-10 (1992).[20] DICKSON, B.L., SCOTT, K.M., Interpretation of aerial gamma-ray surveys — adding the geochemical factors,
AGSO J. Austral. Geol. Geophys. 17 2 (1997) 187–200.[21] KOGAN, R.M., NAZAROV, I.M., FRIDMAN, S.D., Gamma Spectrometry of Natural Environments and Formations. Israel
Programme for Scientific Translations (1971).[22] INTERNATIONAL ATOMIC ENERGY AGENCY, The Use of Gamma Ray Data to Define the Natural Radiation
Environment, IAEA-TECDOC-566, IAEA, Vienna (1990).[23] INTERNATIONAL ATOMIC ENERGY AGENCY, Construction and Use of Calibration Facilities for Radiometric Field
Equipment, Technical Reports Series No. 309, IAEA, Vienna (1989).[24] TAUCHID, M., GRASTY, R.L., “Natural background radioactivity of the Earth´s surface — essential information for
environmental impact studies”, The Uranium Production Cycle and the Environment, IAEA-CSP-10/P, IAEA, Vienna (2002) 230–242.
[25] INTERNATIONAL ATOMIC ENERGY AGENCY, Airborne Gamma Ray Spectrometer Surveying, Technical Reports Series No. 323, IAEA, Vienna (1991).
[26] MINTY, B., LUYENDYK, A., BRODIE, R., Calibration and data processing for airborne gamma ray spectrometry, AGSO J. Austral. Geol. Geophys. 17 2 (1997) 51–62.
[27] MOORE, G., Finland’s national airborne geophysical mapping programme and the “3-in-1” approach, First Brake 26 (2008) 79–85.
[28] BECKITT, G., Exploration for unconformity uranium in Arnhem Land (NT), Explor. Geophys. 2 34 (2003) 137–142.[29] MINTY, B., KENNETT, B., Optimum channel combinations for multichannel airborne gamma-ray spectrometry, Explor.
Geophys. 26 (1995) 292–301.[30] MATOLIN, M., MINTY, B., BARRITT, S., REFORD, S., “A global radioelement baseline for gamma-ray spectrometric data”,
Uranium Raw Material for the Nuclear Fuel Cycle: Economics and Environmental Issues (URAM-2009) (Proc. Symp. Vienna, 2009), IAEA-CN-175/45, IAEA, Vienna (unpublished).
[31] INTERNATIONAL ATOMIC ENERGY AGENCY, Preparation and Certification of IAEA Gamma ray Spectrometry Reference Materials RGU-1, RGTh-1 and RGK-1, Rep. IAEA/RL/148, IAEA, Vienna (1987).
53

[32] INTERNATIONAL ATOMIC ENERGY AGENCY, Radioelement Mapping, IAEA Nuclear Energy Series No. NF-T-1.3, Vienna (2010).
[33] HOVGAARD, J., GRASTY, R.L., Reducing statistical noise in airborne gamma-ray data through spectral component analysis, Proc. Exploration 97: Fourth Decennial Conference on Mineral Exploration (GUBINS, A.G., Ed.) (1997) 753–764.
[34] MINTY, B.R.S., McFADDEN, P., Improved NASVD smoothing of airborne gamma-ray spectra, Explor. Geophys. 29 (3/4) (1998) 516–523.
[35] GREEN, A.A., BERMAN, M., SWITZER, P., CRAIG, M.D., Transformation for ordering multispectra data in terms of image quality with implications for noise removal, IEEE Trans. Geosci. Remote Sensing, GE-26 (1998) 65–74.
[36] DICKSON, B., TAYLOR, G., Noise reduction of aerial gamma-ray surveys, Explor. Geophys. 29 (1998) 324–329.[37] PICO ENVIROTEC INC. — SPECTRONICA, Praga 3 Software for processing gamma-ray spectrometric data (2004),
www.picoenvirotec.com.[38] SCHETSELAAR, E.M., Reducing the effects of vegetation cover on airborne radiometric data using Landsat TM data, Int. J.
Remote Sensing 18 7 (1997) 1503–1515.[39] LAMBERT, I., McKAY, A., CARSON, L., “Issues for the future of small scale uranium mining in Australia”, Uranium Small-
Scale and Special Mining and Processing Technologies (Proc. Tech. Mtg), IAEA, Vienna (2007).[40] CRAVEN, J.A., et al., ‘EXTECH IV Sub-project 9T: A 3D audio-magnetotelluric survey at the McArthur River Mining Camp’,
in Summary of Investigations 2002, Volume 2, Saskatchewan Geological Survey, Sask. Industry Resources, Misc. Rep. 2002-4.2,CD-ROM, Paper D-15, (2002) 6.
[41] NEUMAYER, J., et a., Combination of temporal gravity variations resulting from superconducting gravimeter (SG) recordings, GRACE satellite observations and global hydrology models, J. Geodesy 79 10–11 (2006) 573–585.
[42] ZHOU, J., SUN, H., XU, J., Validating global hydrological models by ground and space gravimetry, Chin. Sci. Bull. 54 9 (2009) 1534–1542.
[43] LÓPEZ, L., “Uranium in Argentina CNEA projects”, Uranium Exploration, Mining, Production and Mine Remediation and Environmental Issues (Proc. Tech. Mtg Mendoza), IAEA, Vienna (2006).
[44] COMISIÓN NACIONAL DE ENERGÍA ATÓMICA, “Main characteristics of the Cerro Solo uranium deposit”, ibid.[45] INDÚSTRIAS NUCLEARES DO BRASIL, “Uranium prospection and exploration in Brazil”, ibid.[46] CHAKI, A., “Uranium exploration strategy in India”, ibid.[47] HADISUSASTRO, W., “Uranium exploration using induced polarization method, case study in Amir Engala Sector, West
Kalimantan Indonesia”, ibid.[48] CHATURVEDI, A.K., “Application of airborne survey for uranium exploration — Indian scenario”, Aerial and Ground
Geophysical Techniques for Uranium Exploration and Advanced Mining and Milling Methods and Equipments (Proc. IAEA Tech. Mtg Singbhum), IAEA, Vienna (2006).
[49] AREF, A.A.F., “Airborne geophysical survey and its application for uranium exploration in Egypt”, ibid.[50] ROUX, J., “Advanced geophysical techniques, a key issue to successful future uranium exploration”, ibid.[51] MACDONALD, C., “Uranium exploration for unconformity deposits —Athabasca Basin examples”, ibid.[52] LI, H., “Application of airborne survey and remote sensing techniques for uranium exploration”, ibid.[53] ABOULNAGA, H.S.O., “Detailed geological and spectrometrical studies, North Elerediya granitic pluton, central-eastern
desert, Egypt”, Uranium Exploration, Mining, Processing, Mine and Mill Remediation and Environmental Issues (Proc. IAEA Tech. Mtg. Swakopmund), IAEA, Vienna (2007).
[54] MINTY, B., FRANKLIN, R., MILLIGAN, P., RICHARDSON, L.M., WILFORD, J., “The radiometric map of Australia”, paper presented at the 20th Int. Geophysical Conference and Exhibition, Australian Society of Exploration Geophysicists, Adelaide, 2009.
[55] MINTY, B.R.S., “Towards an Australian radioelement baseline database,” paper presented at the 18th International Geophysical Conference and Exhibition, Australian Society of Exploration Geophysicists, Melbourne, 2006.
[56] MATOLIN, M., MINTY, B., “Levelling airborne and ground gamma-ray spectrometric data to assist uranium exploration”, Uranium Raw Material for the Nuclear Fuel Cycle: Economics and Environmental Issues (URAM-2009) (Proc. Symp. Vienna, 2009), IAEA-CN-175/45, IAEA, Vienna (unpublished).
[57] MINTY, B.R.S., Automatic merging of gridded airborne gamma-ray spectrometric surveys, Explor. Geophys. 31 (2000) 47–51.[58] LANE, R., GREEN, A., GOLDING, C., OWERS, M., PIK, P., PLUNKETT, C., SATTEL, D., THOM, B., An example of 3D
conductivity mapping using the TEMPEST airborne electromagnetic system, Explor. Geophys. 31 (2000) 162–172.[59] AUKEN, E., CHRISTIANSEN, A.V., WESTERGAARD, J.H., KIRKEGAARD, C., FOGED, N., VIEZZOLI, A., An integrated
processing scheme for high-resolution airborne electromagnetic surveys – the SkyTEM system, Explor. Geophys. 40 (2009) 184–192.
[60] CHRISTENSEN, N.B., A generic 1-D imaging method for transient electromagnetic data, Geophysics 67 (2002) 438–447.[61] CHRISTENSEN, N.B., TØLBØLL, R.J., A lateral model parameter correlation procedure for 1D inverse modeling, accepted
for publication in Geophys. Prosp. (2009).[62] AUKEN, E., CHRISTIANSEN, A.V., JACOBSEN, B.H., FOGED, N., SØRENSEN, K.I., Piecewise 1D laterally constrained
inversion of resistivity data, Geophys. Prosp. 53 (2005) 497–506.[63] JEFFERSON, C.W., DELANEY, G. (Eds), Geology and uranium EXploration TECHnology of the Proterozoic Athabasca Basin,
Saskatchewan and Alberta, Geological Survey of Canada, Bulletin 588 (2007).
54
[64] HEARST, J. R., NELSON, P.H., PAILLET, F.L., Well Logging for Physical Properties, ISBN 0-471-96305-4, Wiley, Chichester (2003) 483.
[65] INTERNATIONAL ATOMIC ENERGY AGENCY, Borehole Logging for Uranium Exploration, Technical Reports Series No. 212, IAEA, Vienna (1982) 279.
[66] SHERIFF, E.G., GELDART, L.P., Exploration Seismology (2nd edn), Cambridge University Press, Cambridge (1995) 592.[67] REYNOLDS, J.M., An Introduction to Applied and Environmental Geophysics, Wiley, Chichester (1997) 796.[68] JACOBY, W., SMILDE, P.L., Gravity Interpretation, Springer-Verlag, Berlin (2009) 395.
55

.

CONTRIBUTORS TO DRAFTING AND REVIEW
Bisset, A.* U3O8 Limited, Australia
Hanly, A. International Atomic Energy Agency
Marlatt, J.** Raven Minerals Corp., Canada
Martin, P. International Atomic Energy Agency
Matolin, M. Charles University, Czech Republic
Slezak, J. International Atomic Energy Agency
Consultants Meetings
Vienna, Austria, 1–4 December 2009
* Present address: Core Geophysics, Australia.** Present address: Marlatt & Associates, Canada.
57

58
Key
Examples
BP:
B
asic
Prin
cipl
es
NG
-G-3
.1:
Nuc
lear
Gen
eral
(NG
), G
uide
, Nuc
lear
Infra
stru
ctur
e an
d P
lann
ing
(topi
c 3)
, #1
O:
Obj
ectiv
es
NP-
T-5.
4:
Nuc
lear
Pow
er (N
P), R
epor
t (T)
, Res
earc
h R
eact
ors
(topi
c 5)
, #4
G:
Gui
des
NF-
T-3.
6:
Nuc
lear
Fue
l (N
F), R
epor
t (T)
, Spe
nt F
uel M
anag
emen
t and
Rep
roce
ssin
g, #
6T:
Te
chni
cal R
epor
ts
NW
-G-1
.1:
Rad
ioac
tive
Was
te M
anag
emen
t and
Dec
omm
issi
onin
g (N
W),
Gui
de,
Nos
. 1-6
: To
pic
desi
gnat
ions
Rad
ioac
tive
Was
te (t
opic
1),
#1
#:
Gui
de o
r Rep
ort n
umbe
r (1,
2, 3
, 4, e
tc.)
Stru
ctur
e of
the
IAEA
Nuc
lear
Ene
rgy
Serie
s
Rad
ioac
tive
Was
te M
anag
emen
tan
d D
ecom
mis
sion
ing
Obj
ectiv
esN
W-O
Nuc
lear
Fue
l Cyc
le O
bjec
tives
NF-
O
Nuc
lear
Pow
er O
bjec
tives
NP-
O
Nuc
lear
Gen
eral
Obj
ectiv
es
NG
-O
Nuc
lear
Ene
rgy
Bas
ic P
rinci
ples
NE-
BP
1. Ma
nage
ment
Syste
ms
NG-G
-1.#
NG-T-
1.#
2. Hu
man R
esou
rces
NG-G
-2.#
NG-T-
2.#
3. Nu
clear
Infras
tructu
re an
d Plan
ning
NG-G
-3.#
NG-T-
3.#
4. Ec
onom
ics
NG-G
-4.#
NG-T-
4.#
5. En
ergy S
ystem
Analy
sis
NG-G
-5.#
NG-T-
5.#
6. Kn
owled
ge M
anag
emen
t NG
-G-6.
#NG
-T-6.#
1. Te
chno
logy D
evelo
pmen
t NP
-G-1.
#NP
-T-1.#
2. De
sign a
nd C
onstr
uctio
n of N
uclea
r Pow
er Pla
nts
NP-G
-2.#
NP-T-
2.#
3. Op
eratio
n of N
uclea
r Pow
er Pla
nts
NP-G
-3.#
NP-T-
3.#
4. No
n-Elec
trica
l App
licati
ons
NP-G
-4.#
NP-T-
4.#
5. Re
searc
h Rea
ctors
NP-G
-5.#
NP-T-
5.#
1. Re
sour
ces
NF-G
-1.#
NF-T-
1.#
2. Fu
el En
ginee
ring a
nd Pe
rform
ance
NF
-G-2.
#NF
-T-2.#
3. Sp
ent F
uel M
anag
emen
t and
Rep
roce
ssing
NF
-G-3.
#NF
-T-3.#
4. Fu
el Cy
cles
NF-G
-4.#
NF-T-
4.#
5. Re
searc
h Rea
ctors
— N
uclea
r Fue
l Cyc
leNF
-G-5.
#NF
-T-5.#
1. Ra
dioac
tive W
aste
Mana
geme
nt
NW-G
-1.#
NW-T-
1.#
2. De
comm
ission
ing of
Nuc
lear F
acilit
ies
NW-G
-2.#
NW-T-
2.#
3. Sit
e Rem
ediat
ion
NW-G
-3.#
NW-T-
3.#

@
!"#
! $ !%&'*+ -/0"5/676809:&76;87<====>?@9:&76;87<==**9%A >+ 9 9CC
"!$ %EH%-8<8JK77;<J09:688L6*'6<*>?@9:688L6*<*'79A>+ 9 9CCKK
&'J 'L<7?J%! 8<<H/$8<=<&K'6'&!097K*<<K*&LK6'L=>?@97K*<<K*&LK6'L<9 A>+ 9 9CC
-Q"H 7KL6&;" -# # U7E;E609:&76='L8&&L>?@9:&76='L=&&<9 A>+ 9 9CC
&( "9"Q " 0 ! #J@87<6JQ
&)&(*"! &!"V!-#U%6'=7*<87;09:'8<8&&<6L6&'>?@9:'8<8*'*87&'&9AX>+ 9 9CCX
+ !' U#J#Y78*ZU 7[?K<<7<7509:6L*;787'7>?@9:6L*;787''L<9 A >+ 9 9CC
+&?K LE#J@8L?K=L;87"@7;09:667'8<7';';>?@9:667'8<7;<;<9 A >+ 9 9CC
H%!!7'L%Q;'86&""@09:667'='<&=<8>?@:667'='<&=<89%A%>+ 9 9CC%
$%,#K\Q\ K\Q]55Q 7<$KL6776J09:';88*;';<8<>?@9:';88*;';<8<:';88*;';<8889 QAK%Q>+ 9 9CCK%Q
($,H H J #J@78&5K7&L&J 09:6&78L=====>?@9:6&78L=='=8>9A
' ]7 ?$57LE5/QJ /'<<<<709:;78888&7=;8&C8=>?@9:;78888&7=;8*9A%>+ 9 9CC
J8C=8"$77<<<;09:;777868&*=*&:;777868L=8&'>?@9:;777868*767L9A%
!,H! ^$ HJ_#`\"&K8<7'&/09:6;<8'*;L'LL8'*;L'L&8>?@9:6;<8'*;L'L'*9A>+ 9

JAPANMaruzen Company Ltd, 1-9-18, Kaigan, Minato-ku, Tokyo, 105-0022 Telephone: +81 3 6367 6079 • Fax: +81 3 6367 6207 Email: [email protected] • Web site: http://www.maruzen.co.jp
REPUBLIC OF KOREAKINS Inc., Information Business Dept. Samho Bldg. 2nd Floor, 275-1 Yang Jae-dong SeoCho-G, Seoul 137-130 Telephone: +02 589 1740 • Fax: +02 589 1746 • Web site: http://www.kins.re.kr
NETHERLANDSDe Lindeboom Internationale Publicaties B.V., M.A. de Ruyterstraat 20A, NL-7482 BZ Haaksbergen Telephone: +31 (0) 53 5740004 • Fax: +31 (0) 53 5729296 Email: [email protected] • Web site: http://www.delindeboom.com
Martinus Nijhoff International, Koraalrood 50, P.O. Box 1853, 2700 CZ Zoetermeer Telephone: +31 793 684 400 • Fax: +31 793 615 698 Email: [email protected] • Web site: http://www.nijhoff.nl
Swets and Zeitlinger b.v., P.O. Box 830, 2160 SZ Lisse Telephone: +31 252 435 111 • Fax: +31 252 415 888 Email: [email protected] • Web site: http://www.swets.nl
NEW ZEALANDDA Information Services, 648 Whitehorse Road, MITCHAM 3132, Australia Telephone: +61 3 9210 7777 • Fax: +61 3 9210 7788 Email: [email protected] • Web site: http://www.dadirect.com.au
SLOVENIACankarjeva Zalozba d.d., Kopitarjeva 2, SI-1512 Ljubljana Telephone: +386 1 432 31 44 • Fax: +386 1 230 14 35 Email: [email protected] • Web site: http://www.cankarjeva-z.si/uvoz
SPAINDíaz de Santos, S.A., c/ Juan Bravo, 3A, E-28006 Madrid Telephone: +34 91 781 94 80 • Fax: +34 91 575 55 63 Email: [email protected], [email protected], [email protected], [email protected] Web site: http://www.diazdesantos.es
UNITED KINGDOMThe Stationery Office Ltd, International Sales Agency, PO Box 29, Norwich, NR3 1 GN Telephone (orders): +44 870 600 5552 • (enquiries): +44 207 873 8372 • Fax: +44 207 873 8203 Email (orders): [email protected] • (enquiries): [email protected] • Web site: http://www.tso.co.uk
On-line orders DELTA Int. Book Wholesalers Ltd., 39 Alexandra Road, Addlestone, Surrey, KT15 2PQ Email: [email protected] • Web site: http://www.profbooks.com
Books on the Environment Earthprint Ltd., P.O. Box 119, Stevenage SG1 4TP Telephone: +44 1438748111 • Fax: +44 1438748844 Email: [email protected] • Web site: http://www.earthprint.com
UNITED NATIONSDept. I004, Room DC2-0853, First Avenue at 46th Street, New York, N.Y. 10017, USA (UN) Telephone: +800 253-9646 or +212 963-8302 • Fax: +212 963-3489 Email: [email protected] • Web site: http://www.un.org
UNITED STATES OF AMERICABernan Associates, 4501 Forbes Blvd., Suite 200, Lanham, MD 20706-4346 Telephone: 1-800-865-3457 • Fax: 1-800-865-3450 Email: [email protected] · Web site: http://www.bernan.com
Renouf Publishing Company Ltd., 812 Proctor Ave., Ogdensburg, NY, 13669 Telephone: +888 551 7470 (toll-free) • Fax: +888 568 8546 (toll-free) Email: [email protected] • Web site: http://www.renoufbooks.com
Orders and requests for information may also be addressed directly to: Marketing and Sales Unit, International Atomic Energy Agency Vienna International Centre, PO Box 100, 1400 Vienna, Austria Telephone: +43 1 2600 22529 (or 22530) • Fax: +43 1 2600 29302 Email: [email protected] • Web site: http://www.iaea.org/books
12-09481

IAEA NUCLEAR ENERGY SERIES PUBLICATIONS
STRUCTURE OF THE IAEA NUCLEAR ENERGY SERIES
Under the terms of Articles III.A and VIII.C of its Statute, the IAEA is authorized to foster the exchange of scientific and technical information on the peaceful uses of atomic energy. The publications in the IAEA Nuclear Energy Series provide information in the areas of nuclear power, nuclear fuel cycle, radioactive waste management and decommissioning, and on general issues that are relevant to all of the above mentioned areas. The structure of the IAEA Nuclear Energy Series comprises three levels: 1 — Basic Principles and Objectives; 2 — Guides; and 3 — Technical Reports.
The Nuclear Energy Basic Principles publication describes the rationale and vision for the peaceful uses of nuclear energy.
Nuclear Energy Series Objectives publications explain the expectations to be met in various areas at different stages of implementation.
Nuclear Energy Series Guides provide high level guidance on how to achieve the objectives related to the various topics and areas involving the peaceful uses of nuclear energy.
Nuclear Energy Series Technical Reports provide additional, more detailed, information on activities related to the various areas dealt with in the IAEA Nuclear Energy Series.
The IAEA Nuclear Energy Series publications are coded as follows: NG — general; NP — nuclear power; NF — nuclear fuel; NW — radioactive waste management and decommissioning. In addition, the publications are available in English on the IAEA’s Internet site:
http://www.iaea.org/Publications/index.html
For further information, please contact the IAEA at PO Box 100, Vienna International Centre, 1400 Vienna, Austria.
All users of the IAEA Nuclear Energy Series publications are invited to inform the IAEA of experience in their use for the purpose of ensuring that they continue to meet user needs. Information may be provided via the IAEA Internet site, by post, at the address given above, or by email to [email protected].

Basic Principles
Objectives
IAEA Nuclear Energy Series
TechnicalReports
Advances in Airborne and Ground Geophysical Methods for Uranium Exploration
No. NF-T-1.5
Guides
INTERNATIONAL ATOMIC ENERGY AGENCYVIENNA
ISBN 978–92–0–129010–6ISSN 1995–7807