IAB Original Digital Video Consumer Study
52
© GfK 2015 | IAB 2015 Original Digital Video Consumer Study | April 2015 1 IAB Original Digital Video Consumer Study April 2015 © 2015 GfK GfK Media & Entertainment GfK Consumer Experiences North America
Transcript of IAB Original Digital Video Consumer Study

© GfK 2015 | IAB 2015 Original Digital Video Consumer Study | April 2015 1
IAB Original Digital Video Consumer Study
April 2015
© 2015 GfK
GfK Media & Entertainment GfK Consumer Experiences North America

© GfK 2015 | IAB 2015 Original Digital Video Consumer Study | April 2015 2
The IAB manages the NewFronts, digital video’s premier showcase of new, original,
professionally produced digital video content. The 2015 NewFronts run from April 27 – May
8, 2015. As part of a comprehensive research program around the NewFronts, the IAB
partnered with GfK to track consumer attitudes, awareness and usage of original digital
video. In its third year, the purpose of this study is to benchmark how many consumers are
watching original digital video and to inform the buying community about what consumers
do, watch, think and feel about original, professionally produced digital video content.
New for the 2015 study, a small sample of young (18-34) cord-cutters/cord-nevers were
added to the overall sample to explore how this critical group makes use of Original Digital
Video.
Main Objectives of the Research
Size the market for original, professional online video (Original Digital Video) content relative to
use of TV/Movie or Amateur video content
Explore the audience experience of Original Digital Video and determine if it is different or better
than the TV viewing experience
Explore ad receptivity in Original Digital Video compared with TV advertising
Discover any key differences in the use of Original Digital Video by young cord-cutters/cord-
nevers compared with the overall Original Digital Video audience
Background & Objectives

© GfK 2015 | IAB 2015 Original Digital Video Consumer Study | April 2015 3
Who? • Full surveys were completed with 856 monthly+ viewers including:
TV Online – 675 ever users; 527 monthly+ users
Amateur – 706 ever users; 551 monthly+ users
Original Digital Video (Ad supported) – 604 ever users; 371 monthly+ users
• 1,931 persons were screened from a general population age 18+ sample for being monthly+ viewers of
online video and “ever” users of either TV Online, Amateur or Original Digital Video
• Due to robust sample sizes, analysis was performed on monthly+ users of each video type
• Additionally, this year an augment of was added to the study to enable analysis of a total of 147 age 18-34
monthly+ users of Original Digital Video who are Cord Cutters/Nevers
When? • April 7- April 14, 2015
How? • Via a 17-minute online survey using
GfK KnowledgePanel™
The cooperation rate among the assigned
sample was 46%
Study Overview
What?
TV Everywhere Awareness
Demos & HH Characteristics
Current Device
Ownership
TV Everywhere
Usage
Authentication
Usage: TV Online
Demos & HH Technology
Comparisons to
Traditional
TV
Online Video Use
Usage: Amateur
Usage: Original
Digital Video

© GfK 2015 | IAB 2015 Original Digital Video Consumer Study | April 2015 4
Respondents who reported watching streaming video monthly+ were asked how frequently
they watched each of the three video types on any device, with the video types defined as
follows:
• TV Online – Network TV shows online such as Pretty Little Liars, The Walking Dead or those found
on sites like ABC.com, Hulu.com or HBO.com
• Amateur – called “amateur online video” for the survey respondents – defined as: created by regular
people and looks and feels like it is home made. (Examples are baby videos or funny cat videos)
• Original Digital Video – originally produced online video – defined as professionally produced video
only for ad-supported online distribution and viewing (not TV). The creators of this kind of video
content can range from media companies (for example, Wall Street Journal Live News, Glamour
Do’s and Don’ts of the Week, Weather.com Behind the Scenes videos, etc.); online-only companies
(for example Funny or Die, HowCast; or YouTube’s Original Channels (The Onion, PewDiePie).
Those who only watch non-ad supported Original Digital Video (Netflix Original Series) were not
included
• As part of the screening process, a list of 81 Original Digital Video shows and sites were shown in a
separate question, and if any were selected by respondent they were considered an “ever” user of
Original Digital Video. This allowed us to classify Original Digital Video users either on response to
the definitional question or by their actual behavior
Defining the Streaming Video Types
© GfK 2015 | IAB 2015 Original Digital Video Consumer Study | April 2015 5
Some of the following slides present data for TV Online, Amateur Video, and Original Digital
Video side by side.
However, because of the way the questionnaire was structured, it is difficult to create data
tabulations that automatically calculate statistical significance between the three groups, as
well as in comparing data from previous years to 2015.
Given the sample sizes are the same order of magnitude (statistically speaking), the reader
can safely use the following rules of thumb as far as significance:
For tables/charts showing % of monthly users
– differences of 6 percentage points or more can be considered significant
(7 percentage points or more for Original Digital Video users 2014 vs. 2015).
For tables/charts showing means for monthly users
– differences of 0.6 or more can be considered significant (0.7 or more for Original
Digital Video users 2014 vs. 2015)
Colored “+/-” numbers indicate significant differences from 2014 to 2015.
Reading the Tables/Charts
© GfK 2015 | IAB 2015 Original Digital Video Consumer Study | April 2015 6
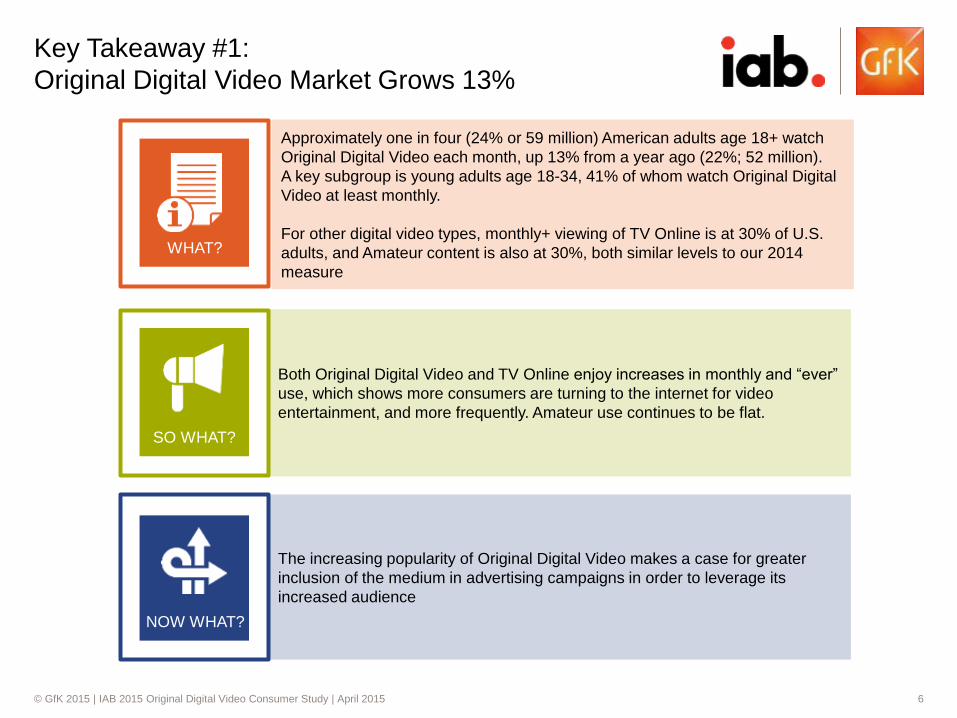
Key Takeaway #1:
Original Digital Video Market Grows 13%
Approximately one in four (24% or 59 million) American adults age 18+ watch
Original Digital Video each month, up 13% from a year ago (22%; 52 million).
A key subgroup is young adults age 18-34, 41% of whom watch Original Digital
Video at least monthly.
For other digital video types, monthly+ viewing of TV Online is at 30% of U.S.
adults, and Amateur content is also at 30%, both similar levels to our 2014
measure
The increasing popularity of Original Digital Video makes a case for greater
inclusion of the medium in advertising campaigns in order to leverage its
increased audience
WHAT?
SO WHAT?
NOW WHAT?
Both Original Digital Video and TV Online enjoy increases in monthly and “ever”
use, which shows more consumers are turning to the internet for video
entertainment, and more frequently. Amateur use continues to be flat.

© GfK 2015 | IAB 2015 Original Digital Video Consumer Study | April 2015 7
Key Takeaway #2:
Original Digital Video Establishing its Niche
Original Digital Video is perceived as more innovative, edgy, unique and mobile
compared with Regular TV, a gap that has widened over the past year. In a
preference test, Original Digital Video is again almost at parity with Primetime
TV as the video type most likely to watch, and has a higher preference than the
other regular TV genres (daytime, sports, news). Almost half cite new original
content as what is liked better about Original Digital Video over Primetime TV
by monthly users of both.
Capitalize on the momentum that Original Digital Video is gaining, and the
perception of it as being at least as good an option as regular TV, by including
original digital video in the advertising campaign mix for brands
WHAT?
SO WHAT?
NOW WHAT?
The relatively new option of Original Digital Video has quickly become
comparable with traditional TV viewing among monthly+ users. Though not a
complete substitute for regular TV, Original Digital Video is being taken
seriously as a fresh new way to consume quality programming.
© GfK 2015 | IAB 2015 Original Digital Video Consumer Study | April 2015 8
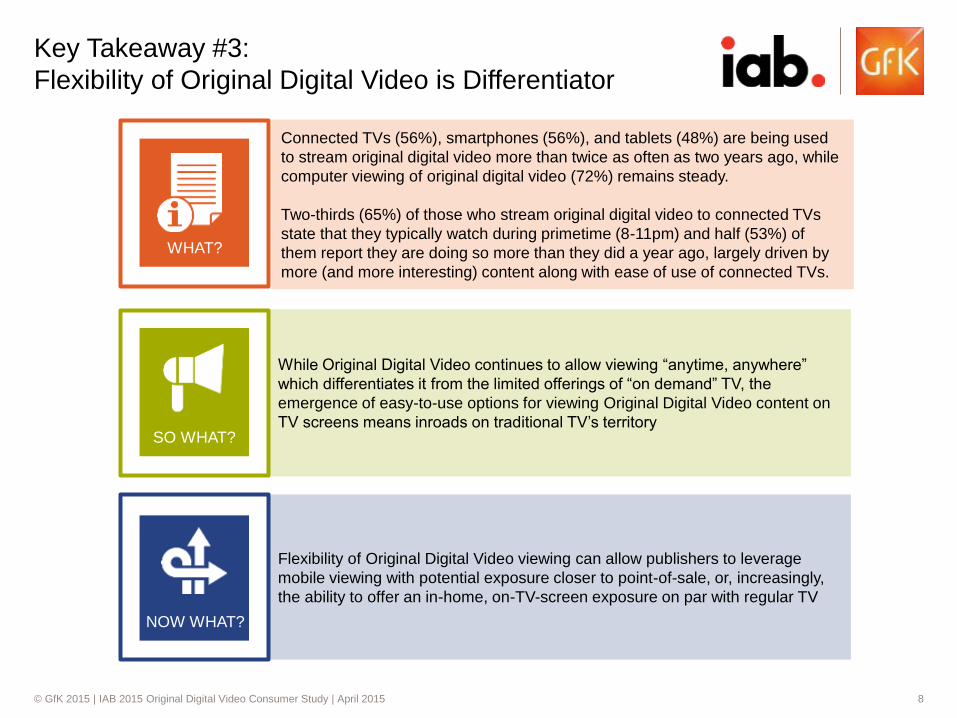
Key Takeaway #3:
Flexibility of Original Digital Video is Differentiator
Connected TVs (56%), smartphones (56%), and tablets (48%) are being used
to stream original digital video more than twice as often as two years ago, while
computer viewing of original digital video (72%) remains steady.
Two-thirds (65%) of those who stream original digital video to connected TVs
state that they typically watch during primetime (8-11pm) and half (53%) of
them report they are doing so more than they did a year ago, largely driven by
more (and more interesting) content along with ease of use of connected TVs.
Flexibility of Original Digital Video viewing can allow publishers to leverage
mobile viewing with potential exposure closer to point-of-sale, or, increasingly,
the ability to offer an in-home, on-TV-screen exposure on par with regular TV
WHAT?
SO WHAT?
NOW WHAT?
While Original Digital Video continues to allow viewing “anytime, anywhere”
which differentiates it from the limited offerings of “on demand” TV, the
emergence of easy-to-use options for viewing Original Digital Video content on
TV screens means inroads on traditional TV’s territory

© GfK 2015 | IAB 2015 Original Digital Video Consumer Study | April 2015 9
Key Takeaway #4:
Original Digital Video Important for Cord-Cutters/Nevers
Young (18-34) Cord-Cutters/Nevers are about twice as likely as adults overall to
view Original Digital Video. Both cord-cutters (53%) and cord-nevers (63%) see
Original Digital Video as “very” or “somewhat” important in their decision to not
have pay TV
Most notably, young cord-cutters/nevers have a preference for Original Digital
Video over all types of regular TV, including over Primetime
Use of Original Digital Video in a media mix can help marketers reach these
highly desirable young people who are just starting their adult life and forming
the brand relationships they will carry into a future marriage and family
WHAT?
SO WHAT?
NOW WHAT?
For young cord-cutters/nevers, Original Digital Video clearly fills their “gap” in
video content resulting from no pay TV service; indeed, Original Digital Video
appears to be preferred to regular TV fare, including Primetime
© GfK 2015 | IAB 2015 Original Digital Video Consumer Study | April 2015 10
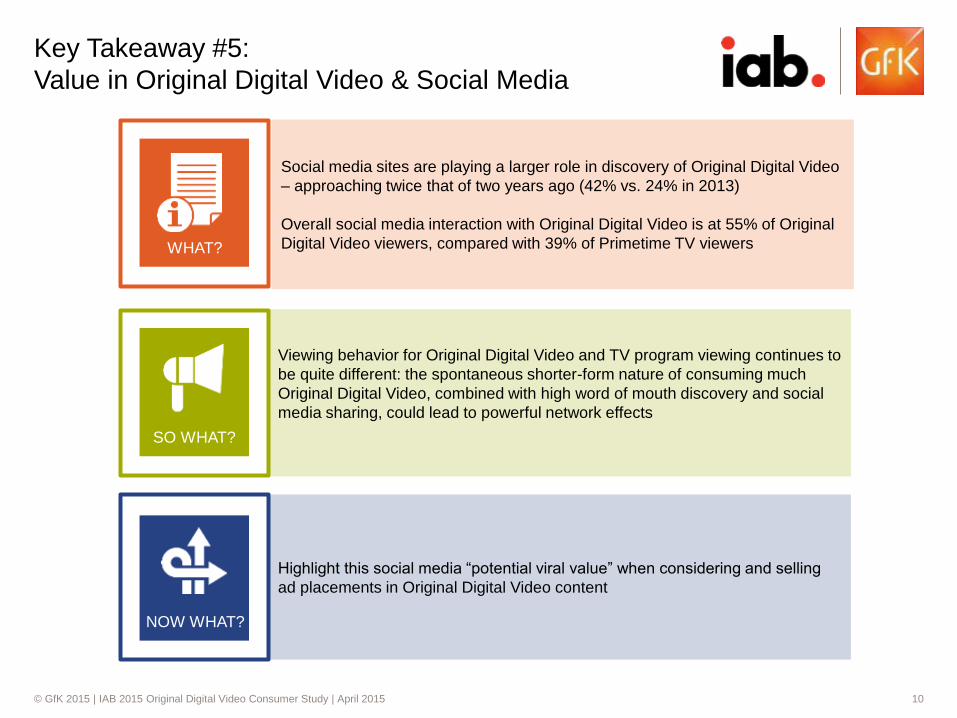
Key Takeaway #5:
Value in Original Digital Video & Social Media
Social media sites are playing a larger role in discovery of Original Digital Video
– approaching twice that of two years ago (42% vs. 24% in 2013)
Overall social media interaction with Original Digital Video is at 55% of Original
Digital Video viewers, compared with 39% of Primetime TV viewers
Highlight this social media “potential viral value” when considering and selling
ad placements in Original Digital Video content
WHAT?
SO WHAT?
NOW WHAT?
Viewing behavior for Original Digital Video and TV program viewing continues to
be quite different: the spontaneous shorter-form nature of consuming much
Original Digital Video, combined with high word of mouth discovery and social
media sharing, could lead to powerful network effects
© GfK 2015 | IAB 2015 Original Digital Video Consumer Study | April 2015 11
Sizing the Market
© GfK 2015 | IAB 2015 Original Digital Video Consumer Study | April 2015 12
38%
31%
20%
5%
1%
39%
31%
20%
6%
1%
38%
30%
21%
7%
2%
0 25 50 75
31%
23%
17%
7%
1%
36%
28%
22%
7%
1%
38%
30%
23%
9%
1%
0 25 50 75
Ever (Net)
At Least Monthly (Net)
At Least Weekly (Net)
Daily
Don’t know/ not sure
28%
19%
10%
3%
3%
31%
22%
12%
2%
3%
33%
24%
14%
4%
3%
0 25 50 75
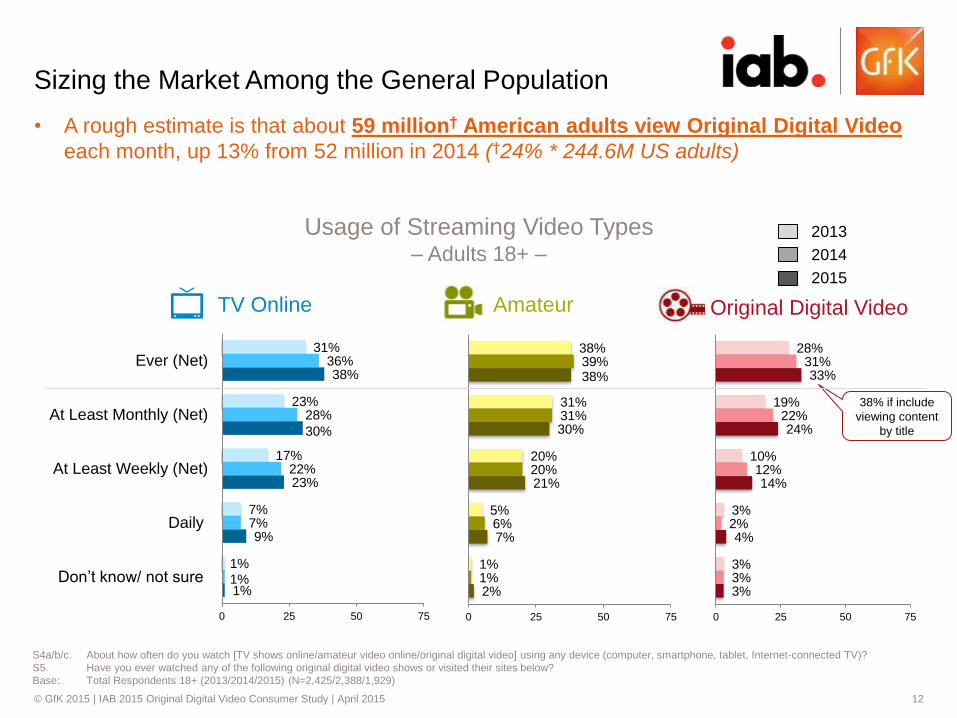
• A rough estimate is that about 59 million† American adults view Original Digital Video
each month, up 13% from 52 million in 2014 (†24% * 244.6M US adults)
S4a/b/c. About how often do you watch [TV shows online/amateur video online/original digital video] using any device (computer, smartphone, tablet, Internet-connected TV)?
S5. Have you ever watched any of the following original digital video shows or visited their sites below?
Base: Total Respondents 18+ (2013/2014/2015) (N=2,425/2,388/1,929)
Sizing the Market Among the General Population
TV Online Amateur Original Digital Video
Usage of Streaming Video Types – Adults 18+ –
38% if include
viewing content
by title
2013
2014
2015

© GfK 2015 | IAB 2015 Original Digital Video Consumer Study | April 2015 13
30% 30% 24%
50% 46%
41%
0%
25%
50%
75%
• Younger adults 18-34 (41%) are much more likely than adults 18 and older to watch
Original Digital Video at least monthly
S4a/b/c. About how often do you watch [TV shows online/amateur video online/original digital video] using any device (computer, smartphone, tablet, Internet-connected TV)?
Base: 2015 Total Respondents 18+/18-34 (N=1929/429)
Monthly Streaming of Video Types
TV Online Amateur Original Digital Video
2015 Monthly+ Usage of Streaming Video Types – Adults 18+ vs. Age 18-34 –
Total 18+
18-34
© GfK 2015 | IAB 2015 Original Digital Video Consumer Study | April 2015 14
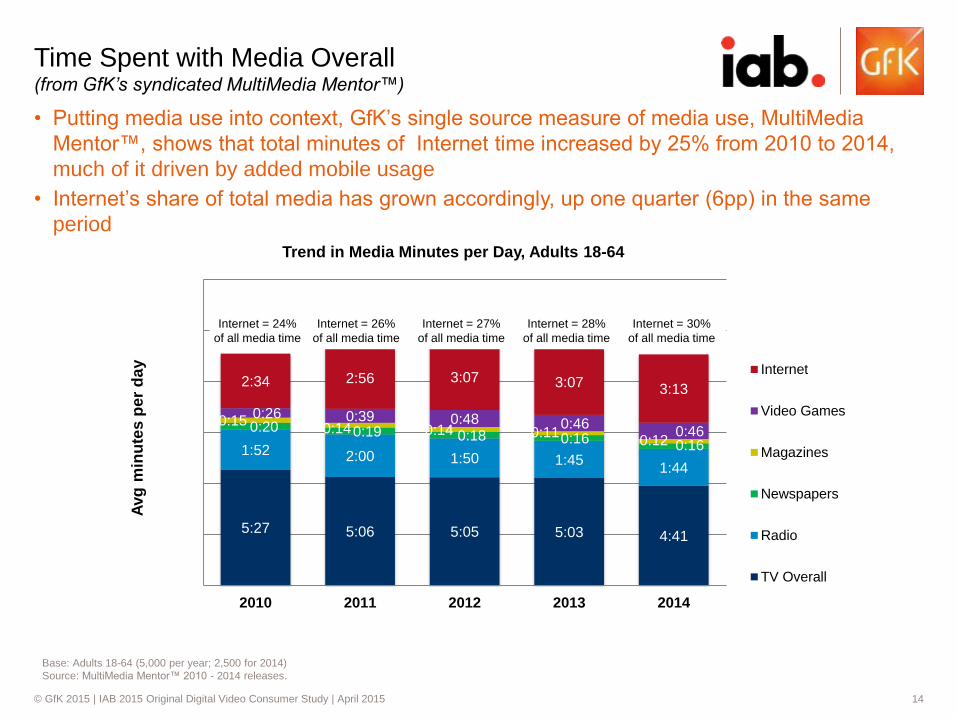
Time Spent with Media Overall (from GfK’s syndicated MultiMedia Mentor™)
14
Base: Adults 18-64 (5,000 per year; 2,500 for 2014)
Source: MultiMedia Mentor™ 2010 - 2014 releases.
• Putting media use into context, GfK’s single source measure of media use, MultiMedia
Mentor™, shows that total minutes of Internet time increased by 25% from 2010 to 2014,
much of it driven by added mobile usage
• Internet’s share of total media has grown accordingly, up one quarter (6pp) in the same
period
5:27 5:06 5:05 5:03 4:41
1:52 2:00 1:50 1:45 1:44
0:20 0:19 0:18 0:16 0:16
0:15 0:14 0:14 0:11
0:12
0:26 0:39 0:48 0:46 0:46
2:34 2:56 3:07 3:07 3:13
2010 2011 2012 2013 2014
Avg
min
ute
s p
er
da
y
Internet
Video Games
Magazines
Newspapers
Radio
TV Overall
Internet = 24%
of all media time
Internet = 26%
of all media time
Internet = 27%
of all media time
Internet = 28%
of all media time
Trend in Media Minutes per Day, Adults 18-64
Internet = 30%
of all media time
© GfK 2015 | IAB 2015 Original Digital Video Consumer Study | April 2015 15
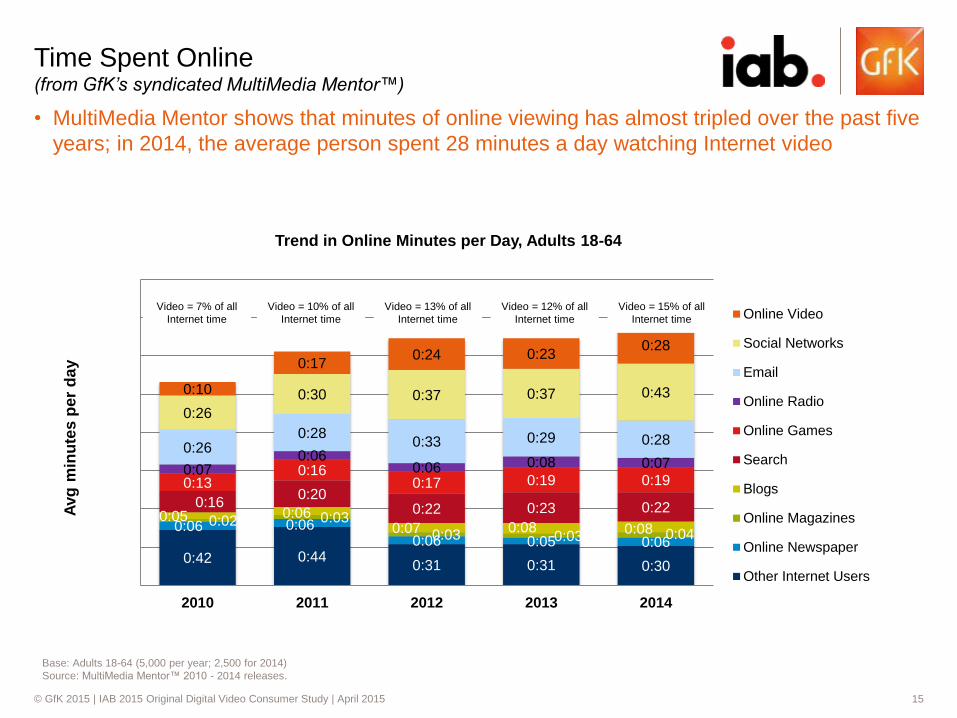
Time Spent Online (from GfK’s syndicated MultiMedia Mentor™)
15
Base: Adults 18-64 (5,000 per year; 2,500 for 2014)
Source: MultiMedia Mentor™ 2010 - 2014 releases.
• MultiMedia Mentor shows that minutes of online viewing has almost tripled over the past five
years; in 2014, the average person spent 28 minutes a day watching Internet video
0:42 0:44 0:31 0:31 0:30
0:06 0:06 0:06 0:05 0:06
0:02 0:03
0:03 0:03 0:04
0:05 0:06 0:07 0:08 0:08
0:16 0:20
0:22 0:23 0:22
0:13 0:16
0:17 0:19 0:19 0:07
0:06 0:06 0:08 0:07
0:26 0:28
0:33 0:29 0:28
0:26
0:30 0:37 0:37 0:43 0:10
0:17 0:24 0:23
0:28
2010 2011 2012 2013 2014
Avg
min
ute
s p
er
da
y
Online Video
Social Networks
Online Radio
Online Games
Search
Blogs
Online Magazines
Online Newspaper
Other Internet Users
Trend in Online Minutes per Day, Adults 18-64
Video = 7% of all
Internet time
Video = 10% of all
Internet time
Video = 13% of all
Internet time
Video = 12% of all
Internet time
Video = 15% of all
Internet time
© GfK 2015 | IAB 2015 Original Digital Video Consumer Study | April 2015 16
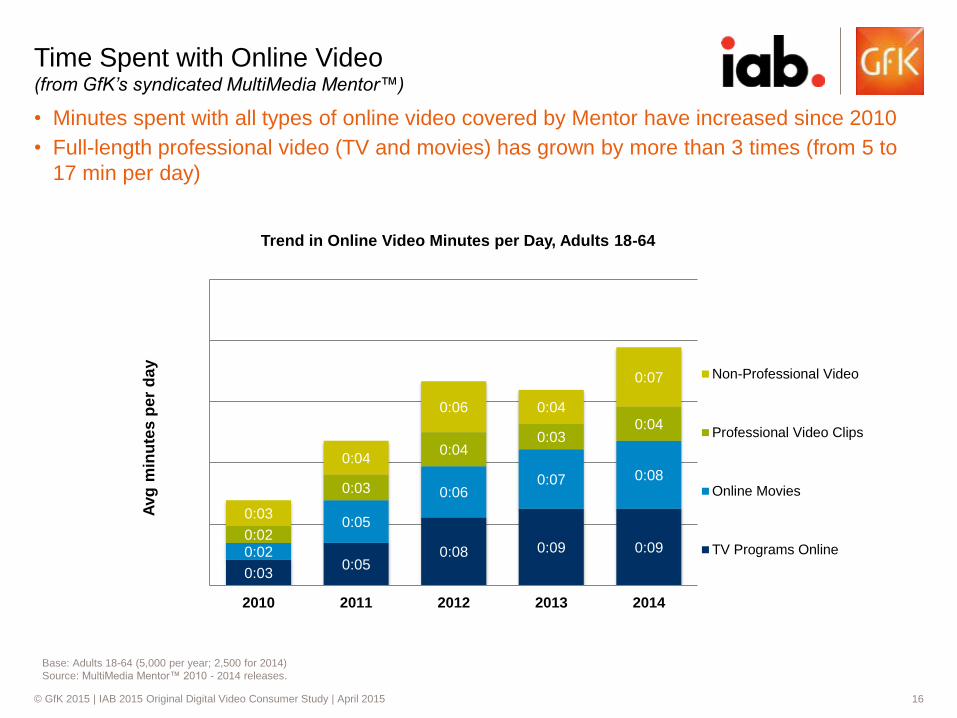
Time Spent with Online Video (from GfK’s syndicated MultiMedia Mentor™)
16
Base: Adults 18-64 (5,000 per year; 2,500 for 2014)
Source: MultiMedia Mentor™ 2010 - 2014 releases.
• Minutes spent with all types of online video covered by Mentor have increased since 2010
• Full-length professional video (TV and movies) has grown by more than 3 times (from 5 to
17 min per day)
0:03 0:05
0:08 0:09 0:09 0:02
0:05
0:06 0:07 0:08
0:02
0:03
0:04 0:03
0:04
0:03
0:04
0:06 0:04
0:07
2010 2011 2012 2013 2014
Avg
min
ute
s p
er
da
y
Non-Professional Video
Professional Video Clips
Online Movies
TV Programs Online
Trend in Online Video Minutes per Day, Adults 18-64

© GfK 2015 | IAB 2015 Original Digital Video Consumer Study | April 2015 17
Video Streaming Behavior
© GfK 2015 | IAB 2015 Original Digital Video Consumer Study | April 2015 18
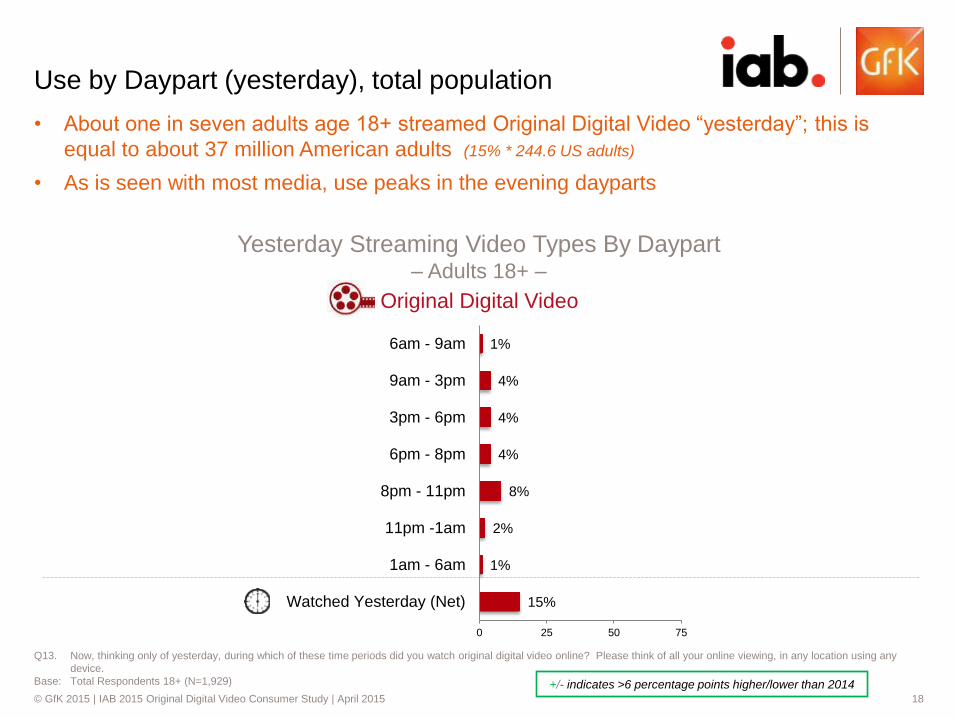
• About one in seven adults age 18+ streamed Original Digital Video “yesterday”; this is
equal to about 37 million American adults (15% * 244.6 US adults)
• As is seen with most media, use peaks in the evening dayparts
Q13. Now, thinking only of yesterday, during which of these time periods did you watch original digital video online? Please think of all your online viewing, in any location using any
device.
Base: Total Respondents 18+ (N=1,929)
Use by Daypart (yesterday), total population
Yesterday Streaming Video Types By Daypart – Adults 18+ –
Original Digital Video
1%
4%
4%
4%
8%
2%
1%
15%
0 25 50 75
6am - 9am
9am - 3pm
3pm - 6pm
6pm - 8pm
8pm - 11pm
11pm -1am
1am - 6am
Watched Yesterday (Net)
+/- indicates >6 percentage points higher/lower than 2014

© GfK 2015 | IAB 2015 Original Digital Video Consumer Study | April 2015 19
2%
9%
10%
10%
12%
5%
4%
27%
1%
7%
4%
7%
14%
5%
1%
28%
0 25 50 75
6am - 9am
9am - 3pm
3pm - 6pm
6pm - 8pm
8pm - 11pm
11pm -1am
1am - 6am
Watched Yesterday (Net)
• Original Digital Video “yesterday” daypart use is similar between genders for ages 18-34
• Younger males report more daytime use compared with younger females
Q13. Now, thinking only of yesterday, during which of these time periods did you watch each type of video original digital video online? Please think of all your online viewing, in any
location using any device.
Base: Males 18-34 (n=223), Females 18-34 (n=206)
Use by Daypart (yesterday), 18-34
Yesterday Streaming Video Types By Daypart – Adults18-34 –
Male 18-34
Female 18-34
Original Digital Video
+7
+11
+/- indicates >6 percentage points higher/lower than 2014

© GfK 2015 | IAB 2015 Original Digital Video Consumer Study | April 2015 20
• Computers continue to be used most often by Monthly+ Original Digital Video viewers
• Driven by increases in viewing, ownership, and ease of use, levels of Original Digital Video
viewing using ICTV and mobile devices are now twice that of 2013
Devices Used to Stream
Laptop/Desktop
Internet Connected TV*
Smartphone
Tablet
iPod Touch
Devices Used Monthly+ to View Original Digital Video – Monthly+ Users of Original Digital Video –
Q22. How often do you use each device to watch original digital video?
Base: Viewer of Original Digital Video (2013/2014/2015) (n=441/490/371)
69%
27%
26%
23%
13%
72%
48%
46%
41%
22%
72%
56%
56%
48%
25%
0 25 50 75
18-34 77%
18-34 Females
65%
2013
2014
2015
+8
+10
+7
18-34 Cord Cutters
35%
*includes either built-in Internet capability or
TV-connected devices with Internet capability
+/- indicates >6 percentage points higher/lower than 2014
© GfK 2015 | IAB 2015 Original Digital Video Consumer Study | April 2015 21
4%
13%
14%
38%
65%
16%
4%
0 25 50 75
6am - 9am
9am - 3pm
3pm - 6pm
6pm - 8pm
8pm - 11pm
11pm - 1am
1am - 6am
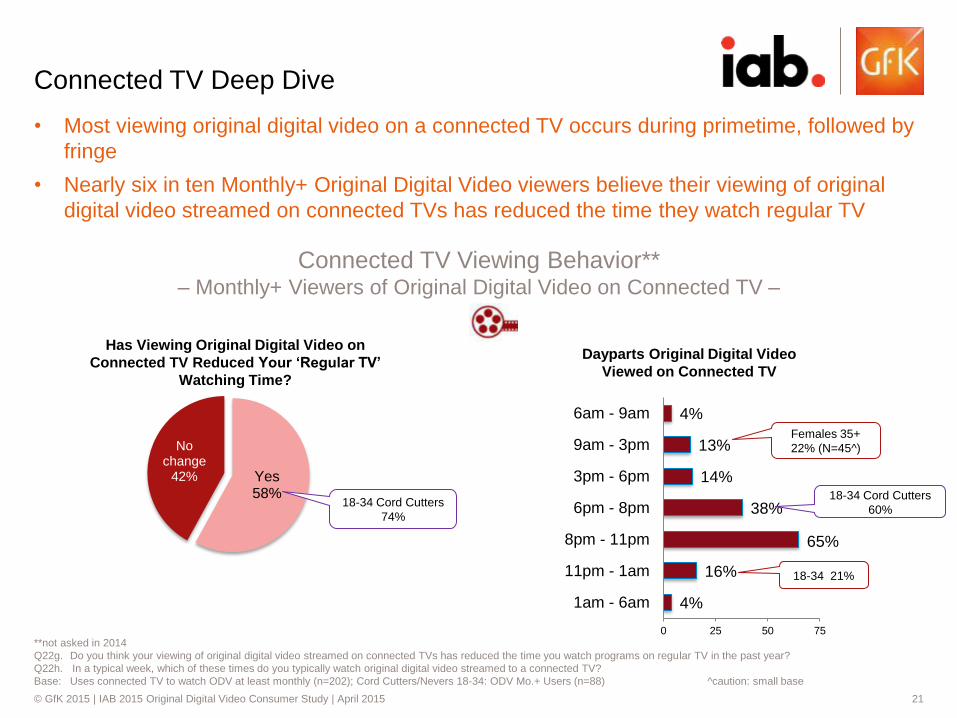
Connected TV Deep Dive
Connected TV Viewing Behavior** – Monthly+ Viewers of Original Digital Video on Connected TV –
**not asked in 2014
Q22g. Do you think your viewing of original digital video streamed on connected TVs has reduced the time you watch programs on regular TV in the past year?
Q22h. In a typical week, which of these times do you typically watch original digital video streamed to a connected TV?
Base: Uses connected TV to watch ODV at least monthly (n=202); Cord Cutters/Nevers 18-34: ODV Mo.+ Users (n=88) ^caution: small base
Yes 58%
No change
42%
Has Viewing Original Digital Video on
Connected TV Reduced Your ‘Regular TV’
Watching Time?
Dayparts Original Digital Video
Viewed on Connected TV
18-34 Cord Cutters
74%
18-34 Cord Cutters
60%
18-34 21%
Females 35+
22% (N=45^)
• Most viewing original digital video on a connected TV occurs during primetime, followed by
fringe
• Nearly six in ten Monthly+ Original Digital Video viewers believe their viewing of original
digital video streamed on connected TVs has reduced the time they watch regular TV
© GfK 2015 | IAB 2015 Original Digital Video Consumer Study | April 2015 22
44%
44%
43%
40%
36%
16%
0 25 50 75
There is more original digital video towatch
Regular TV is not as interesting
Watching on a connected TV hasgotten easier
I've gotten into the habit of streamingoriginal digital video on a connected TV
There is better quality original digitalvideo to watch
I didn't have a connected TV a yearago
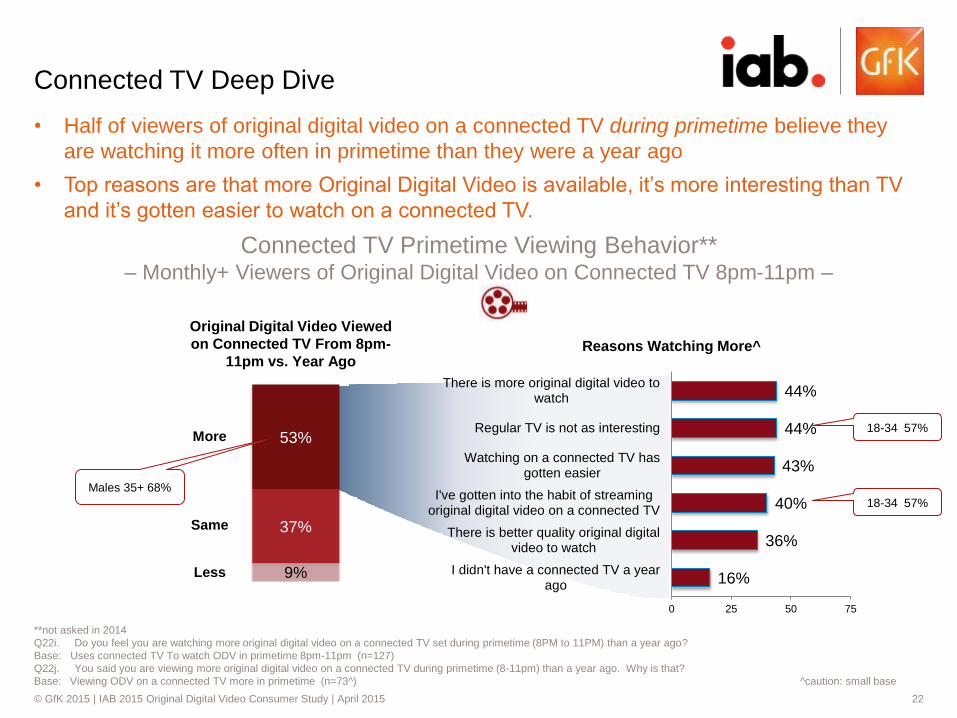
• Half of viewers of original digital video on a connected TV during primetime believe they
are watching it more often in primetime than they were a year ago
• Top reasons are that more Original Digital Video is available, it’s more interesting than TV
and it’s gotten easier to watch on a connected TV.
Connected TV Deep Dive
Connected TV Primetime Viewing Behavior** – Monthly+ Viewers of Original Digital Video on Connected TV 8pm-11pm –
**not asked in 2014
Q22i. Do you feel you are watching more original digital video on a connected TV set during primetime (8PM to 11PM) than a year ago?
Base: Uses connected TV To watch ODV in primetime 8pm-11pm (n=127)
Q22j. You said you are viewing more original digital video on a connected TV during primetime (8-11pm) than a year ago. Why is that?
Base: Viewing ODV on a connected TV more in primetime (n=73^) ^caution: small base
9%
37%
53%
Original Digital Video Viewed
on Connected TV From 8pm-
11pm vs. Year Ago
More
Less
Same
Reasons Watching More^
18-34 57%
Males 35+ 68%
18-34 57%

© GfK 2015 | IAB 2015 Original Digital Video Consumer Study | April 2015 23
• Home use continues to dominate as the location for viewing Original Digital Video; the
majority of users of all types say they only view at home.
• Mobile viewing remains on par with a year ago
Locations
At my home
At work
While traveling
At another home
At school
While commuting to/from work or
school
Other location not listed
92%
15%
11%
7%
7%
4%
3%
0% 20% 40% 60% 80% 100%
Home Only 65%
Q21. In which locations do you typically watch original digital video (using any device in any location)?
Base: Viewer of Original Digital Video (2013/2014/2015) (n=441/490/371)
Locations Typically Watch Original Digital Video – Monthly+ Users of Original Digital Video –
35+ Females
18%
18-34 Females
17%
+/- indicates >6 percentage points higher/lower than 2014

© GfK 2015 | IAB 2015 Original Digital Video Consumer Study | April 2015 24
Discovery

© GfK 2015 | IAB 2015 Original Digital Video Consumer Study | April 2015 25
• The top ways Original Digital Video viewers discover new content are consistent to a year
ago; word of mouth continues as the main way
• Females are influenced more through social media and males through search
• Cord-cutters appear to be more influenced by WOM and less influenced by search
Discovery Sources
Top Ways Learn About Original Digital Video – Monthly+ Users of Original Digital Video –
Q23. In which ways do you learn about original digital video?
Base: Viewer of Original Digital Video (2013/2014/2015) (n=441/490/371)
Friends/relatives/word of mouth
Social media sites (Facebook, Twitter, etc)
I find out about new videos by clicking on links that I stumble upon
Ads (net)
Recommendations on websites/apps offering original digital video
Search results
The news/I read about it
53%
42%
29%
24%
22%
22%
22%
0 25 50 75
Females 47%
18-34 Cord Cutters
66%
18-34 Cord Cutters
14%
18-34 Males
31%
+/- indicates >6 percentage points higher/lower than 2014
© GfK 2015 | IAB 2015 Original Digital Video Consumer Study | April 2015 26
Motivations and Attitudes

© GfK 2015 | IAB 2015 Original Digital Video Consumer Study | April 2015 27
• Watching “on my own schedule” continues to be the top driver of Original Digital Video use
• “Watching video content that is not available on TV” is a top reason, particularly among
males
Q25. And for what reasons do you usually watch original digital video? Select all that apply.
Base: Viewer of Original Digital Video (2013/2014/2015) (n=441/490/371)
Reasons Watch
Top Reasons for Watching – Original Digital Video – Monthly+ Users of Original Digital Video –
I prefer to watch original digital
video on my own schedule
I click on a link I stumble
upon and get drawn in
To watch video content about
my hobbies or interests
I like watching video content
that is not available on TV
Watching original digital video is no different
from watching regular TV to me
Watch content not available
on TV or in amateur videos
I don't have pay TV service
41%
25%
24%
22%
20%
20%
20%
0 10 20 30 40 50
+/- indicates >6 percentage points higher/lower than 2014
Males 27%
18-34 24%

© GfK 2015 | IAB 2015 Original Digital Video Consumer Study | April 2015 28
Statement Agreement About Original Digital Video – Monthly+ Users of Original Digital Video –
46%
38%
32%
31%
29%
17%
0 10 20 30 40 50
• Original Digital Video is catching on - multiple video viewing during a session continues to
rise for Original Digital Video viewers (46% up from 40% in 2014 and 32% in 2013)
• In 2015, viewers are rushing more than in 2014 to view this type of content as soon as it is
released (17%, up from 8%), particularly among the younger 18-34 audience
Statement Agreement
Q26. Thinking about when you watch original digital video, which of the following statements do you agree with? Select all that apply.
Base: Viewer of Original Digital Video (2013/2014/2015) (n=441/490/371)
I often end up watching more than one video of this type in one sitting
I like to unwind and watch this type of online video
I look forward to the next installment of this type of video
I watch online video of this type after work/homework/tasks
I have my preferred sites to watch this type of video on
I watch online video of this
type as soon as it’s available
+/- indicates >6 percentage points higher/lower than 2014
+9 18-34 21%
18-34 Males 41%
18-34 Males 39%
Males 43%
18-34 Males 59%

© GfK 2015 | IAB 2015 Original Digital Video Consumer Study | April 2015 29
68%
16%
27%
26%
51%
51%
25%
0 25 50 75
55%
24%
19%
21%
30%
35%
18%
0 25 50 75
• Consumers are more likely to interact on social media around any digital video than they are around TV.
• Amateur Video Viewers are most likely to interact in social media. Half discover content through social
media or click links posted by friends.
• Consumers are significantly more likely to follow Original Digital Video shows than other video types on
Facebook or Twitter.
• More viewers learn about Original Digital Video shows from social media than did a year ago.
Social Media Interaction - Digital
Any (Net)
I follow shows/producers of this video on
Facebook or Twitter**
I enjoy online discussions, reading or
writing comments about [video type]
I sometimes watch [video type] online
with friends online
I often click links from friends on
Facebook or Twitter to watch [video type]
I often discover this type of
video through social media sites*
I often post to Facebook or Twitter
about [video type] I've just watched online
TV Online Amateur Original Digital Video
Social Media Use – Monthly+ Users of Video Type –
40%
20%
17%
16%
15%
12%
11%
0 25 50 75
+10
+11
*not asked in 2013
** asked as “I follow [video type] on…” in 2013
Q11. How do you interact in social media with each type of online viewing listed?
Base: Viewer of … (2014/2015) TV shows online (n=614/527), Amateur(n=683/551), Original Digital Video (n=490/371)
18-34
Females
higher on
virtually
all items
+/- indicates >5 percentage points higher/lower than 2014 (>6 pp for Original Digital Video)
18-34 Cord
Cutters 41%
18-34
Females
higher on
virtually
all items

© GfK 2015 | IAB 2015 Original Digital Video Consumer Study | April 2015 30
• Adults 18-34 are more likely to interact around Original Digital Video in social media than
are Adults 18 and older.
• Original Digital Video social media interaction among the younger 18-34 set skews female
for Twitter/Facebook follows and discovery through social media
Social Media Interaction - Digital
Any (Net)
I follow shows/producers of this video on
Facebook or Twitter
I enjoy online discussions, reading or writing
comments about [video type]
I sometimes watch [video type] online with
friends online
I often click links from friends on Facebook
or Twitter to watch [video type]
I often discover this type of video through
social media sites
I often post to Facebook or Twitter about
[video type] I've just watched online
Social Media Use – 18-34 Monthly+ Users of Video Type by Gender –
Q11. How do you interact in social media with each type of online viewing listed?
Base: Viewer of Original Digital Video: Male 18-34 (n=89), Female 18-34 (n=82)
Original Digital Video
62%
23%
27%
27%
38%
41%
20%
74%
35%
21%
28%
41%
50%
24%
0 25 50 75
Male 18-34
Female 18-34
© GfK 2015 | IAB 2015 Original Digital Video Consumer Study | April 2015 31
31%
14%
11%
15%
14%
13%
9%
0 25 50 75
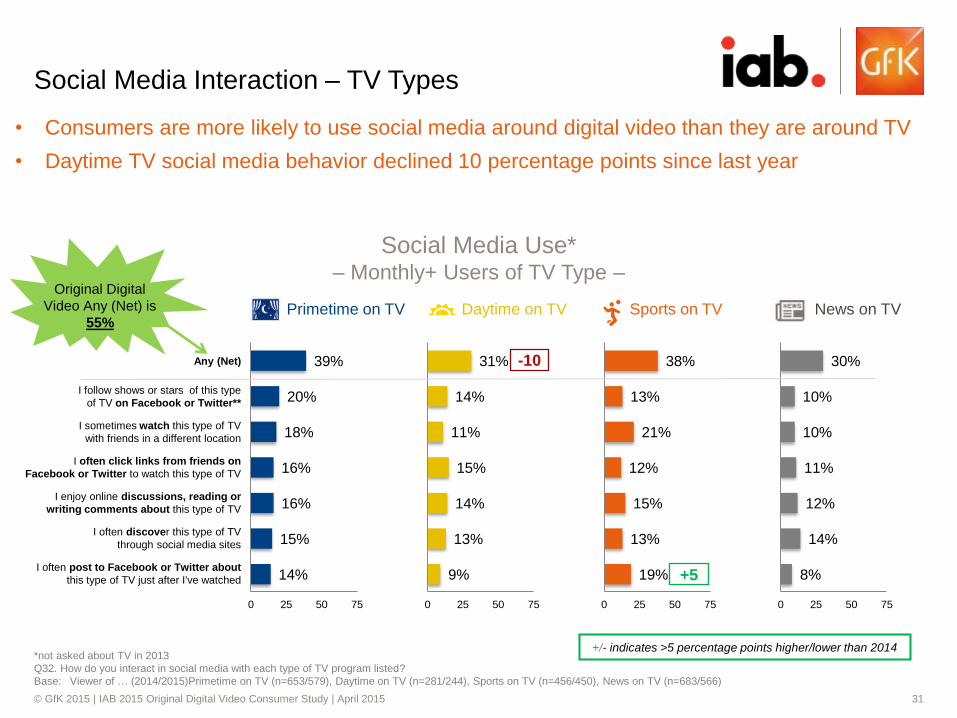
• Consumers are more likely to use social media around digital video than they are around TV
• Daytime TV social media behavior declined 10 percentage points since last year
Social Media Interaction – TV Types
Social Media Use* – Monthly+ Users of TV Type –
Any (Net)
I follow shows or stars of this type
of TV on Facebook or Twitter**
I sometimes watch this type of TV
with friends in a different location
I often click links from friends on
Facebook or Twitter to watch this type of TV
I enjoy online discussions, reading or
writing comments about this type of TV
I often discover this type of TV
through social media sites
I often post to Facebook or Twitter about
this type of TV just after I've watched
39%
20%
18%
16%
16%
15%
14%
0 25 50 75
38%
13%
21%
12%
15%
13%
19%
0 25 50 75
30%
10%
10%
11%
12%
14%
8%
0 25 50 75
*not asked about TV in 2013
Q32. How do you interact in social media with each type of TV program listed?
Base: Viewer of … (2014/2015)Primetime on TV (n=653/579), Daytime on TV (n=281/244), Sports on TV (n=456/450), News on TV (n=683/566)
Original Digital
Video Any (Net) is
55%
-10
+5
+/- indicates >5 percentage points higher/lower than 2014
Primetime on TV Daytime on TV Sports on TV News on TV
© GfK 2015 | IAB 2015 Original Digital Video Consumer Study | April 2015 32
Original Digital Video vs. Regular TV
© GfK 2015 | IAB 2015 Original Digital Video Consumer Study | April 2015 33
1 2 3 4 5 6 7 8 9 10
Mean Rating
Original Digital Video (2015) Regular Television (2015) Original Digital Video (2014) Regular Television (2014)
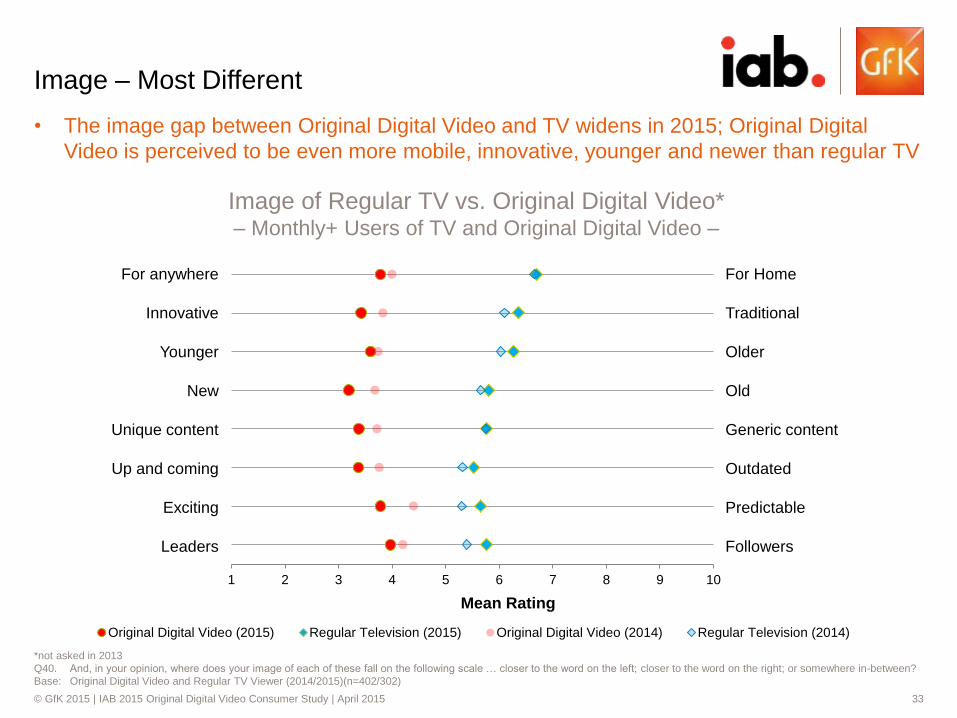
• The image gap between Original Digital Video and TV widens in 2015; Original Digital
Video is perceived to be even more mobile, innovative, younger and newer than regular TV
*not asked in 2013
Q40. And, in your opinion, where does your image of each of these fall on the following scale … closer to the word on the left; closer to the word on the right; or somewhere in-between?
Base: Original Digital Video and Regular TV Viewer (2014/2015)(n=402/302)
Image – Most Different
Image of Regular TV vs. Original Digital Video* – Monthly+ Users of TV and Original Digital Video –
For anywhere
Innovative
Younger
New
Unique content
Up and coming
Exciting
Leaders
For Home
Traditional
Older
Old
Generic content
Outdated
Predictable
Followers

© GfK 2015 | IAB 2015 Original Digital Video Consumer Study | April 2015 34
1 2 3 4 5 6 7 8 9 10
Mean Rating
Original Digital Video (2015) Regular Television (2015) Original Digital Video 2014 Regular Television 2014
• While Original Digital Video is seen as more interesting than TV, regular TV and Original
Digital Video is seen as more similar on aspects such as being “for me” and necessary
*not asked in 2013 **not asked in 2014
Q40. And, in your opinion, where does your image of each of these fall on the following scale … closer to the word on the left; closer to the word on the right; or somewhere in-between?
Base: Original Digital Video and Regular TV Viewer (2014/2015)(n=402/302)
Image – More Similar
Image of Regular TV vs. Original Digital Video* – Monthly+ Users of TV and Original Digital Video –
Not Commercial
Edgy
Hot
Interesting
**Worth my time
For me
Necessary
Commercial
Stuffy
Not
Boring
Not worth my time**
Not for me
Unnecessary
© GfK 2015 | IAB 2015 Original Digital Video Consumer Study | April 2015 35
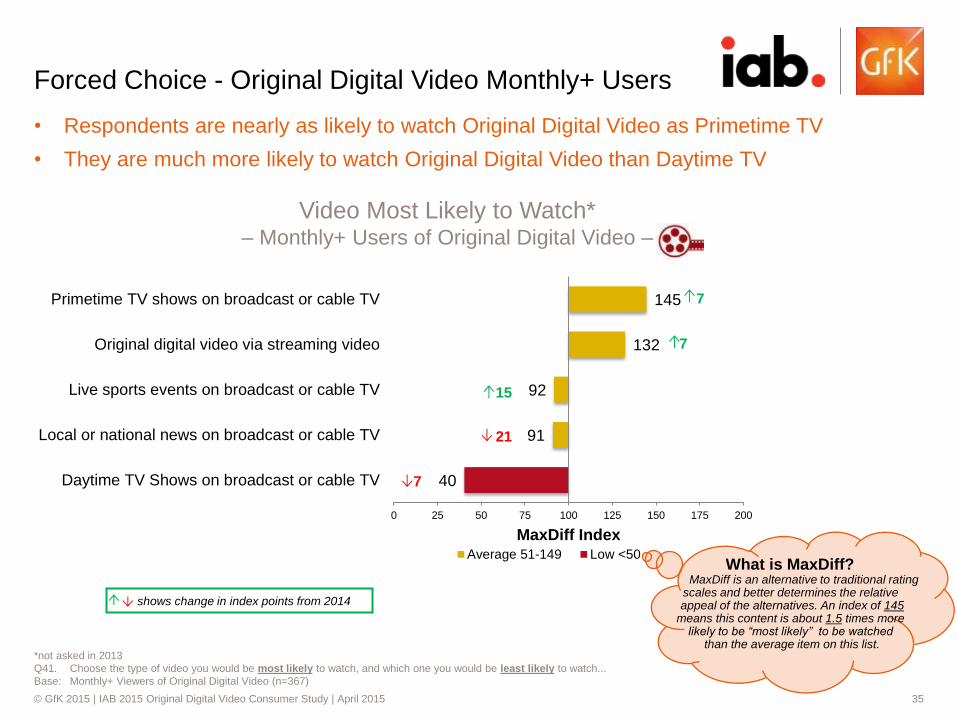
• Respondents are nearly as likely to watch Original Digital Video as Primetime TV
• They are much more likely to watch Original Digital Video than Daytime TV
*not asked in 2013
Q41. Choose the type of video you would be most likely to watch, and which one you would be least likely to watch...
Base: Monthly+ Viewers of Original Digital Video (n=367)
Forced Choice - Original Digital Video Monthly+ Users
Video Most Likely to Watch* – Monthly+ Users of Original Digital Video –
145
132
92
91
40
0 25 50 75 100 125 150 175 200
Primetime TV shows on broadcast or cable TV
Original digital video via streaming video
Live sports events on broadcast or cable TV
Local or national news on broadcast or cable TV
Daytime TV Shows on broadcast or cable TV
MaxDiff Index Average 51-149 Low <50
What is MaxDiff? MaxDiff is an alternative to traditional rating
scales and better determines the relative appeal of the alternatives. An index of 145
means this content is about 1.5 times more likely to be “most likely” to be watched
than the average item on this list.
7
21
7
15
7
shows change in index points from 2014
Most likely to watch… TV ODV

© GfK 2015 | IAB 2015 Original Digital Video Consumer Study | April 2015 36
• For TV Online Viewers, “the ability to watch on my own schedule” remains the most
common like; “fewer ads” are mentioned by some as well
• Amateur Viewers watch mainly because the content is “funny or humorous”
• Original Digital Video Viewers are more differentiated in their reasons - “watch on own
schedule”, “video quality” and “good quality video” are mentioned most often
Q14a/b/c. Overall, what do you like best about the experience of watching [video type]?
Base: Viewer of …(2014/2015) TV shows online (n=614/527), Amateur (n=683/551), Original Digital Video (n=490/371)
Likes
Like Best About Viewing Experience – Top 5 – Monthly+ Users of Video Type –
TV Online
Ability to watch old episodes/reruns
61%
Ability to pause/start/stop anytime
58
Ability to choose programs/shows
53
Ability to watch all episodes at once
53
Free or reasonable price 53
Amateur
Funny/Humorous 64%
Fun/Entertaining 57
Ability to watch on my schedule 42
Interesting/Creative 40
Shortness of videos 38
Original Digital Video
Ability to watch on my schedule
54%
Fun/Entertaining 45
No commercials 41
Good quality 40
Ability to watch multiple episodes
40
© GfK 2015 | IAB 2015 Original Digital Video Consumer Study | April 2015 37
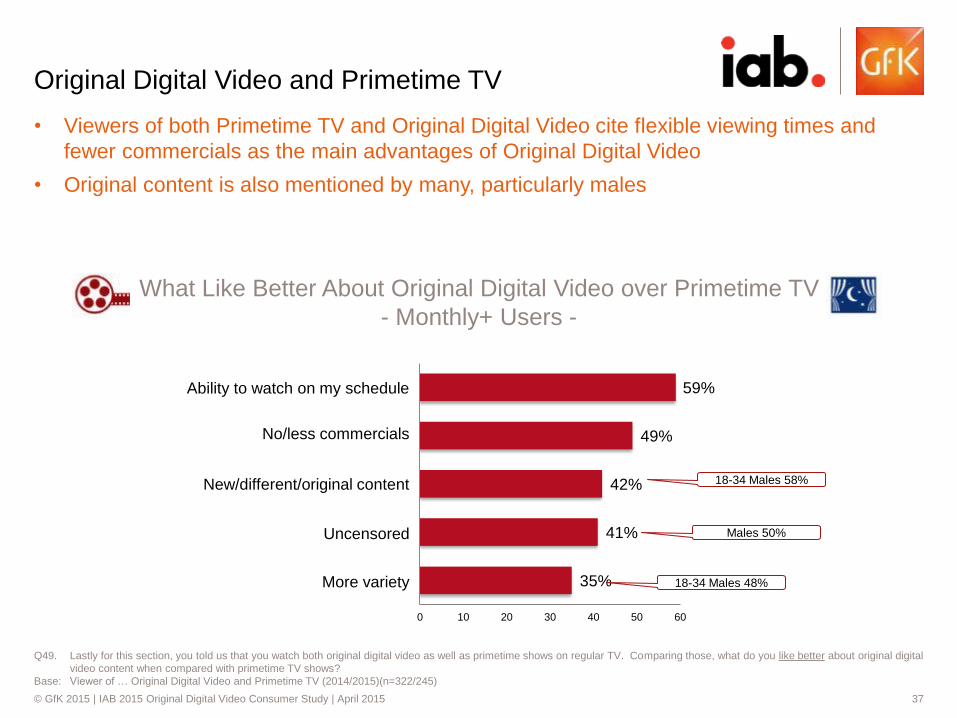
• Viewers of both Primetime TV and Original Digital Video cite flexible viewing times and
fewer commercials as the main advantages of Original Digital Video
• Original content is also mentioned by many, particularly males
Q49. Lastly for this section, you told us that you watch both original digital video as well as primetime shows on regular TV. Comparing those, what do you like better about original digital
video content when compared with primetime TV shows?
Base: Viewer of … Original Digital Video and Primetime TV (2014/2015)(n=322/245)
Original Digital Video and Primetime TV
What Like Better About Original Digital Video over Primetime TV
- Monthly+ Users -
59%
49%
42%
41%
35%
0 10 20 30 40 50 60
Ability to watch on my schedule
No/less commercials
New/different/original content
Uncensored
More variety
18-34 Males 58%
18-34 Males 48%
Males 50%

© GfK 2015 | IAB 2015 Original Digital Video Consumer Study | April 2015 38
Highlights:
Young Cord Cutters/Cord Nevers
GfK interviewed a sample augment of 147 monthly+ users of Original Digital Video
who are also pay TV Cord Cutters/Cord Nevers, age 18-34

© GfK 2015 | IAB 2015 Original Digital Video Consumer Study | April 2015 39
33%
24%
14%
4%
3%
63%
51%
31%
8%
5%
0 25 50 75
Ever (Net)
At Least Monthly(Net)
At Least Weekly(Net)
Daily
Don’t know/ not sure
• Not surprisingly, young cord-cutters/-nevers are much more likely than the general
population to watch Original Digital Video – at least twice as likely on a daily, weekly, or
monthly basis
S4c. About how often do you watch original digital video using any device (computer, smartphone, tablet, Internet-connected TV)?
Base: Total Respondents (GenPop 18+ 2015,18-34 18-34 Cord Cutter/Nevers 2015) (N=1,929/297)
Letter indicate significantly higher than comparison group at 95%
Sizing the Market
Usage of Original Digital Video – Total Respondents Screened –
GenPop 18+ (D)
18-34 Cord Cutter/Nevers (T)
D
D
D
D

© GfK 2015 | IAB 2015 Original Digital Video Consumer Study | April 2015 40
• Young cord-cutters/-nevers have a similar device profile for viewing Original Digital Video,
the exception being use of tablets
Devices Used to Stream
Laptop/Desktop
Internet Connected TV*
Smartphone
Tablet
iPod Touch
Devices Used Monthly+ to View Original Digital Video – Monthly+ Users of Original Digital Video –
Q22. How often do you use each device to watch original digital video?
Base: Viewer of Original Digital Video (GenPop 2015,18-34 Cord Cutter/Nevers 2015) (N=371,147)
Letter indicate significantly higher than comparison group at 95%
72%
56%
56%
48%
25%
76%
57%
55%
35%
20%
0 25 50 75
GenPop (D)
18-34 Cord Cutter/Nevers (T)
*includes either built-in Internet capability or
TV-connected devices with Internet capability
T

© GfK 2015 | IAB 2015 Original Digital Video Consumer Study | April 2015 41
• Young cord-cutters/-nevers have broadly similar attitudes towards ads in Original Digital
Video compared with Original Digital Video users overall. They are more likely to find
Original Digital Video ads to be “interesting” or “fun.”
Ads - Digital
I tend to remember ads the most in
this type of online video
I tend to notice ads most in this
type of online video
I am least annoyed by the ads in
this type of online video
I find some ads to be more
interesting or even fun in this type
of online video
I feel like I have more control over
the ads in this type of online video
Original Digital Video
Ad Statement Association* – Monthly+ Users of Original Digital Video –
29%
30%
33%
35%
34%
27%
24%
35%
43%
29%
0 25 50 75
*not asked in 2013
Q12. Which type of online viewing listed best matches each statement?
Base: Viewer of at least two of the video types…(GenPop 2015,18-34 Cord Cutter/Nevers 2015) (N=371,147)
Letter indicate significantly higher than comparison group at 95%
GenPop (D)
18-34 Cord Cutter/Nevers (T)

© GfK 2015 | IAB 2015 Original Digital Video Consumer Study | April 2015 42
• Young cord-cutters/-nevers again have broadly similar attitudes towards Original Digital
Video vs regular TV as do Original Digital Video viewers overall – still largely positive
*not asked in 2013
Q40. And, in your opinion, where does your image of each of these fall on the following scale … closer to the word on the left; closer to the word on the right; or somewhere in-between?
Base: Original Digital Video and Regular TV Viewer (N=302/71^) ^caution : small base
Image – Most Different
Image of Regular TV vs. Original Digital Video* – Monthly+ Users of TV and Original Digital Video^ –
For anywhere
Innovative
Younger
New
Unique content
Up and coming
Exciting
Leaders
For Home
Traditional
Older
Old
Generic content
Outdated
Predictable
Followers
1 2 3 4 5 6 7 8 9 10
Mean Rating
Original Digital Video - GenPop Regular TV - GenPop Original Digital Video - 18-34 Cord Cut Regular TV - 18-34 Cord Cut

© GfK 2015 | IAB 2015 Original Digital Video Consumer Study | April 2015 43
• Again, young cord-cutters/-nevers have broadly similar attitudes towards Original Digital
Video vs regular TV for these image statements
*not asked in 2013 **not asked in 2014
Q40. And, in your opinion, where does your image of each of these fall on the following scale … closer to the word on the left; closer to the word on the right; or somewhere in-between?
Base: Original Digital Video and Regular TV Viewer (N=302/71^) ^caution : small base
Image – More Similar
Image of Regular TV vs. Original Digital Video* – Monthly+ Users of TV and Original Digital Video ^ –
Not Commercial
Edgy
Hot
Interesting
**Worth my time
For me
Necessary
Commercial
Stuffy
Not
Boring
Not worth my time**
Not for me
Unnecessary
1 2 3 4 5 6 7 8 9 10
Mean Rating
Original Digital Video - GenPop Regular TV - GenPop Original Digital Video - 18-34 Cord Cut Regular TV - 18-34 Cord Cut
© GfK 2015 | IAB 2015 Original Digital Video Consumer Study | April 2015 44
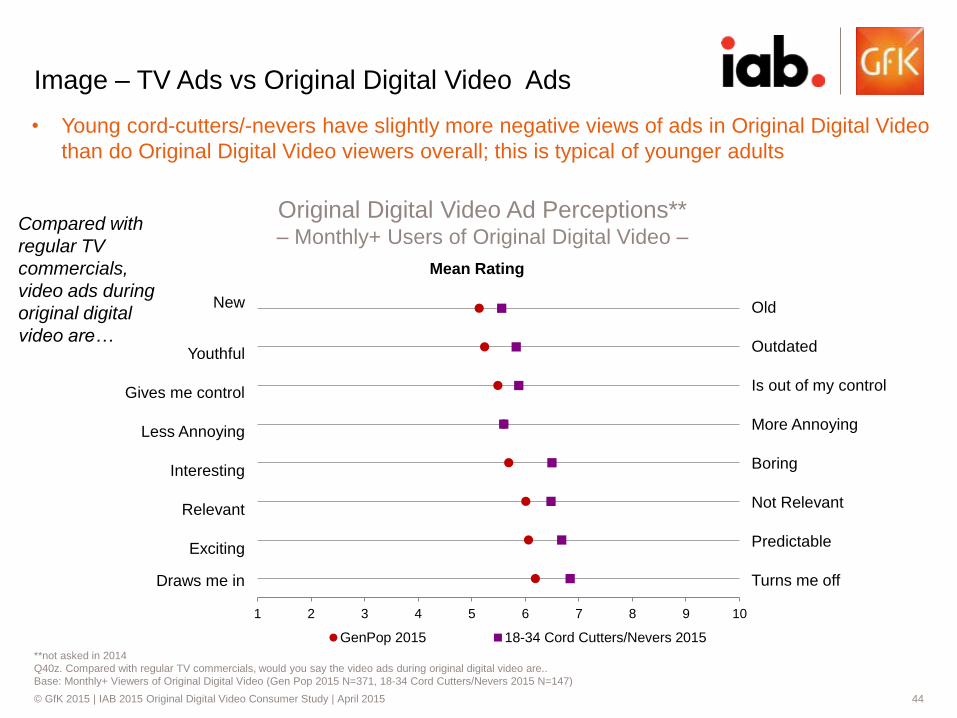
1 2 3 4 5 6 7 8 9 10
Mean Rating
GenPop 2015 18-34 Cord Cutters/Nevers 2015
• Young cord-cutters/-nevers have slightly more negative views of ads in Original Digital Video
than do Original Digital Video viewers overall; this is typical of younger adults
**not asked in 2014
Q40z. Compared with regular TV commercials, would you say the video ads during original digital video are..
Base: Monthly+ Viewers of Original Digital Video (Gen Pop 2015 N=371, 18-34 Cord Cutters/Nevers 2015 N=147)
Image – TV Ads vs Original Digital Video Ads
Original Digital Video Ad Perceptions** – Monthly+ Users of Original Digital Video –
New
Youthful
Gives me control
Less Annoying
Interesting
Relevant
Exciting
Draws me in
Old
Outdated
Is out of my control
More Annoying
Boring
Not Relevant
Predictable
Turns me off
Compared with
regular TV
commercials,
video ads during
original digital
video are…

© GfK 2015 | IAB 2015 Original Digital Video Consumer Study | April 2015 45
• Among Original Digital Video Viewers who are also cord-cutters/-nevers, there is a clear
preference for Original Digital Video content compared with all the types of TV content,
including Primetime TV
*not asked in 2013
Q41. Choose the type of video you would be most likely to watch, and which one you would be least likely to watch...
Base: 18-34 Cord Cutters/Nevers and Monthly+ Viewers of Original Digital Video (n=144)
Forced Choice – Cord Cutters/Nevers
Video Most Likely to Watch* – 18-34 Cord Cut/Never Monthly+ Users of Original Digital Video –
182
150
68
63
37
0 25 50 75 100 125 150 175 200
Original digital video via streaming video
Primetime TV shows on broadcast or cable TV
Local or national news on broadcast or cable TV
Live sports events on broadcast or cable TV
Daytime TV Shows on broadcast or cable TV
MaxDiff Index Average 51-149 Low <50 What is MaxDiff?
MaxDiff is an alternative to traditional rating scales and better determines the relative
appeal of the alternatives. An index of 182 means this content is about 1.8 times more
likely to be “most likely” to be watched than the average item on this list.
Most likely to watch… TV ODV

© GfK 2015 | IAB 2015 Original Digital Video Consumer Study | April 2015 46
37%
43%
20%
• Among Cord-Cutters/-Nevers who are also Original Digital Video viewers, a strong majority
say streaming video was important in their decision to not have pay TV; Original Digital
Video was almost as important, particularly among Cord-Nevers
Influence of Original Digital Video on
Cord-Cutter/Never Status
Degree Streaming Video Affects Lack of Pay TV**
– Cord Cutters/Nevers 18-34 –
**not asked in 2014
Q50b/Q50c. How important a role did streaming video – of any type – play in your decision to cancel your subscription to cable, satellite, fios, telco or paid TV?? / How important a role did streaming of original digital
video play in your decision to cancel your subscription to cable, satellite, fios, telco or paid TV?
Base: Total Qualified and cord-cutter (n=152) / Total qualified and cord cutter and ad-supported ODV viewer (n=99)
Q50d/Q50e. How important a role does streaming video – of any type – play in your decision to not have a subscription to cable, satellite, fios, telco or paid TV? how important a role does streaming of original digital video
play in your decision to not have a subscription to cable, satellite, FIOS, telco or paid TV?
Base: Total qualified and cord-never (n=92) / Total qualified and cord cutter and ad-supported ODV viewer (n=48^) ^caution : small base
Importance of Streaming Video (any type)
in Cancelling/Not Having Pay TV
- Total -
Very
Important
Not at all
Important
Somewhat
Important
Cutters
35%
39%
26%
Nevers
24%
28%
48%
76% 65%
Importance of Original Digital Video in
Cancelling/Not Having Pay TV
- Monthly+ Original Digital Video Viewers -
Very
Important
Not at all
Important
Somewhat
Important
Cutters Nevers^
47%
32%
21%
53% 63%
© GfK 2015 | IAB 2015 Original Digital Video Consumer Study | April 2015 47
Reactions to Ads
© GfK 2015 | IAB 2015 Original Digital Video Consumer Study | April 2015 48
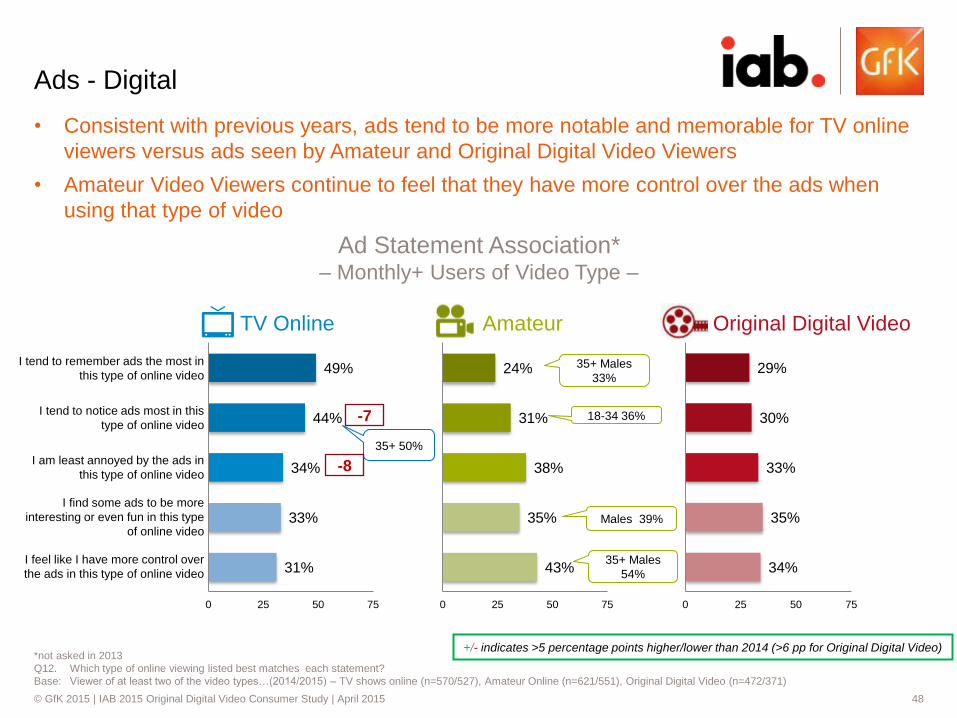
• Consistent with previous years, ads tend to be more notable and memorable for TV online
viewers versus ads seen by Amateur and Original Digital Video Viewers
• Amateur Video Viewers continue to feel that they have more control over the ads when
using that type of video
Ads - Digital
I tend to remember ads the most in
this type of online video
I tend to notice ads most in this
type of online video
I am least annoyed by the ads in
this type of online video
I find some ads to be more
interesting or even fun in this type
of online video
I feel like I have more control over
the ads in this type of online video
Ad Statement Association* – Monthly+ Users of Video Type –
49%
44%
34%
33%
31%
0 25 50 75
24%
31%
38%
35%
43%
0 25 50 75
29%
30%
33%
35%
34%
0 25 50 75
*not asked in 2013
Q12. Which type of online viewing listed best matches each statement?
Base: Viewer of at least two of the video types…(2014/2015) – TV shows online (n=570/527), Amateur Online (n=621/551), Original Digital Video (n=472/371)
35+ 50%
-7
-8
Males 39%
18-34 36%
35+ Males
54%
35+ Males
33%
+/- indicates >5 percentage points higher/lower than 2014 (>6 pp for Original Digital Video)
TV Online Amateur Original Digital Video

© GfK 2015 | IAB 2015 Original Digital Video Consumer Study | April 2015 49
• Primetime TV Viewers claim to notice and remember ads more while watching this type of
video than any of the other video genres
• Sports Viewers find some ads more interesting/fun on this type of video as well as being
less annoyed by the ads viewed than they were last year
Ads – TV Types
Ad Statement Association* – Monthly+ Users of TV Type –
Primetime on TV Daytime on TV Sports on TV News on TV
I tend to remember ads the most
in this type of online video
I tend to notice ads most in this
type of online video
I am least annoyed by the ads in
this type of online video
I find some ads to be more
interesting or even fun in this type
of online video
51%
47%
33%
44%
0 25 50 75
18%
26%
22%
24%
0 25 50 75
40%
41%
44%
50%
0 25 50 75
20%
19%
33%
16%
0 25 50 75
*not asked in 2013
Q33. Which type of TV program listed best matches each statement?
Base: Viewer of at least two TV types… (2014/2015)– Primetime TV (n=607/533), Daytime TV (n=276/242), Live TV sports (n=425/414), TV news (n=630/530)
-9
+7 -6
+/- indicates >5 percentage points higher/lower than 2014

© GfK 2015 | IAB 2015 Original Digital Video Consumer Study | April 2015 50
Monthly+ Viewer Demographics

© GfK 2015 | IAB 2015 Original Digital Video Consumer Study | April 2015 51
• Original Digital Video viewers have shifted to include more females and HHs with kids
• As expected, young cord-cutters/nevers are less likely to be married or have kids, have
lower incomes
Demographics
Letter indicates significant difference at 95% confidence level.
Demographic/Device Profile of Monthly+ Users
TV Online Amateur Original Digital
Video
18-34 Cord Cutter/Never
ODV
(N=527) (N=551) (N=371) (N=147)
(B) (C) (D) (T)
Male 51% 50% 50% 52%
Female 49 50 50 48
Mean age 37.8 39.5BD 36.9T 27.7
Median HH income (in thousands) 70.6 74.1 70.8 56.8
Non-Ethnic 67 68D 64 73D
College Grad+ 40 40 38 47D
Married 52D 49 48 41
Any kids in HH 39 36 36 30
Median HH size 3 3 3 2
+9 +7
+/- indicates >5 percentage points higher/lower than 2014 (>6 pp for Original Digital Video)

© GfK 2015 | IAB 2015 Original Digital Video Consumer Study | April 2015 52
Mike Picco | SRM [email protected]
GfK David Tice | SVP [email protected]
QUESTIONS?
IAB Kristina Sruoginis | Director [email protected]
GfK
IAB Sherrill Mane| SVP [email protected]