Full Year 2015 Report - IAB · PDF fileFull Year 2015 Report Digital, Video and Mobile...
62
Full Year 2015 Report Digital, Video and Mobile Consumer Usage Trends IAB Digital Usage Trend Report Questions? [email protected] Kristina Sruoginis, Research Director, IAB
Transcript of Full Year 2015 Report - IAB · PDF fileFull Year 2015 Report Digital, Video and Mobile...

Full Year 2015 Report
Digital, Video and Mobile Consumer Usage Trends
IAB Digital Usage Trend Report
Kristina Sruoginis, Research Director, IAB

Summary Points
• Overall 3% Growth in Internet Use Across Computers, Smartphones and Tablets.
• Shift to Mobile Continues, Especially in Time Spent Online, Especially Among Younger
Users.
• Mobile Devices and Computers Serve Different Purposes.
• More Time Spent on Apps Than Mobile Web, Smartphones Than Tablets.
• Number of Users Going Online via Computer is Steady, but Time Spent is Declining.
• Adults 55 and Older Spend as Much Time on Computer as 18-34 Year Olds.
• Adults 55 and Older Stream as Many Videos on Computer as 18-34 Year Olds.
• Computer-Based Video Streamers are Flat (Up 1%), Videos Streamed are Down 5% (Driven
by Streamers Under 35) and Streaming Time is Down Across All Age Groups (-8%) Except
Adults 55+.
• Facebook Videos are Down. Otherwise, Most Top 10 Video Properties Grew Over the Year.
IAB Digital Usage Trend Report Full Year 2015

Overall Internet Usage
Across All Devices
Full Year 2015 Report
IAB Digital Usage Trend Report

The Big Picture: Online Advertising
Revenue Continues its Incredible Growth
Quarterly Online Ad Revenue Comparisons — Q1 2010 – Q4 2015
2010:
$26,041B
2011:
$31,735B
Source: IAB Internet Advertising Revenue Reports
2012:
$36,570B
2013
$42,781B
IAB Digital Usage Trend Report 2015: The Year in Review
2014
$49,450B2015
$59,600B
• In 5 years time, annual online revenue has more than doubled

Dec-2
010
Jan
-2011
Fe
b-2
011
Ma
r-2011
Ap
r-2011
Ma
y-2
011
Jun
-2011
Jul-2
011
Au
g-2
011
Se
p-2
011
Oct-
2011
Nov-2
011
Dec-2
011
Jan
-2012
Fe
b-2
012
Ma
r-2012
Ap
r-2012
Ma
y-2
012
Jun
-2012
Jul-2
012
Au
g-2
012
Se
p-2
012
Oct-
2012
Nov-2
012
Dec-2
012
Jan
-13
Fe
b-1
3
Ma
r-13
Ap
r-13
Ma
y-1
3
Jun
-13
Jul-1
3
Au
g-1
3
Se
p-1
3
Oct-
13
Nov-1
3
Dec-1
3
Jan
-14
Fe
b-1
4
Ma
r-14
Ap
r-14
Ma
y-1
4
Jun
-14
Jul-1
4
Au
g-1
4
Se
p-1
4
Oct-
14
Nov-1
4
Dec-1
4
Jan
-15
Fe
b-1
5
Ma
r-15
Ap
r-15
Ma
y-1
5
Jun
-15
Jul-1
5
Au
g-1
5
Se
p-1
5
Oct-
15
Nov-1
5
Dec-1
5
Steady Growth in Computer-Based Internet Users Over 5 Years
% Change
5 Yrs(12/10-12/15)
Source: ComScore MediaMetrix, Total Audience, Measurement Period: Dec. 2009 - Dec. 2015. Doesn’t include mobile
10%
1%
-2%
14IAB Digital Usage Trend Report 2015: The Year in Review
441,241
228,444
By Dec. 2013, more internet
time is spent on mobile
devices than on computers
232,202
405,525
555,228

% Change
12/14 - 12/15
3%
252,469
260,182
Dec-14 Jan-15 Feb-15 Mar-15 Apr-15 May-15 Jun-15 Jul-15 Aug-15 Sep-15 Oct-15 Nov-15 Dec-15
TotalUnduplicatedInternetAudience
Growth in Total Computer and Mobile Audience
Over the Yearby Unduplicated Unique Visitors
Monthly Unique Visitors (000), Dec 2014 – Dec 2015
(of any site or app via computer or mobile device)
• The total audience accessing the internet via computer or mobile device has grown 3% over 2015
to 260 million monthly visitors (or 81% of the US population of 320M).
Source: ComScore US Media Metrix MultiPlatform Dec. 2014 to Dec. 2015, Total Unduplicated Internet Audience.
IAB Digital Usage Trend Report Full Year 2015
Computer and Mobile
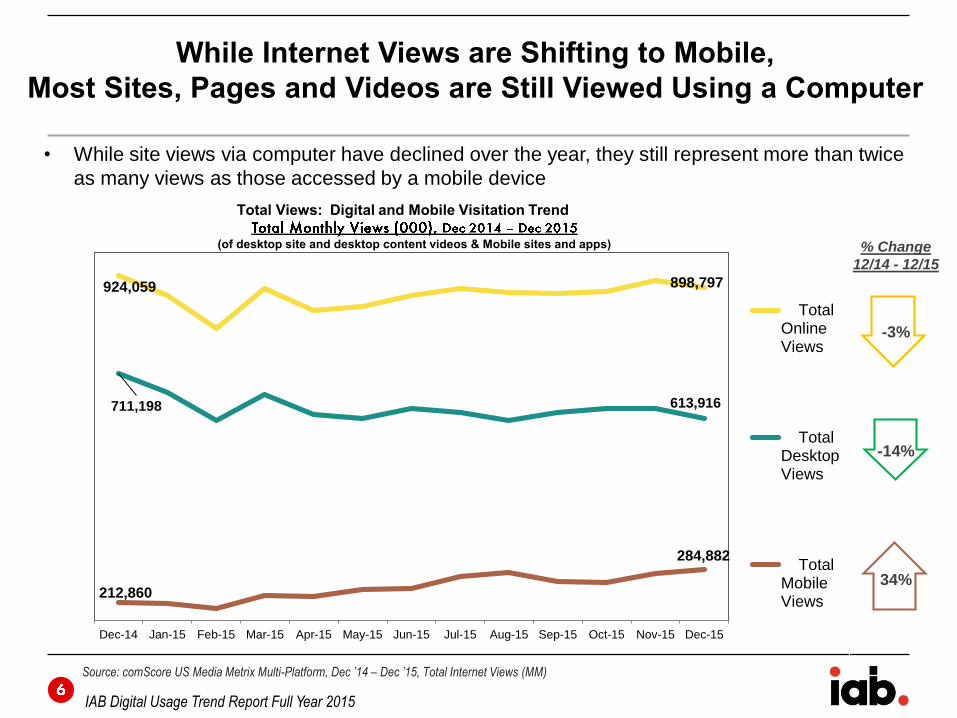
924,059 898,797
711,198 613,916
212,860
284,882
Dec-14 Jan-15 Feb-15 Mar-15 Apr-15 May-15 Jun-15 Jul-15 Aug-15 Sep-15 Oct-15 Nov-15 Dec-15
TotalOnlineViews
TotalDesktopViews
TotalMobileViews
• While site views via computer have declined over the year, they still represent more than twice
as many views as those accessed by a mobile device
% Change
12/14 - 12/15
-3%
-14%
34%
IAB Digital Usage Trend Report Full Year 2015
Source: comScore US Media Metrix Multi-Platform, Dec ’14 – Dec ’15, Total Internet Views (MM)
While Internet Views are Shifting to Mobile,
Most Sites, Pages and Videos are Still Viewed Using a Computer
(of desktop site and desktop content videos & Mobile sites and apps)
Total Views: Digital and Mobile Visitation Trend

23%77%
% of Total Internet Views
Total MobileViews
Total ComputerViews
• However, mobile views have grown over the year from roughly one-quarter to account for roughly
one-third of total internet views
Over Two-Thirds of All Internet Views are
Accessed Using a Computer
Of Desktop Site and Desktop Content Videos & Mobile Sites and Apps, Dec 2014 vs. Dec 2015
Source: comScore US Media Metrix Multi-Platform, Dec ’14, Dec ’15, Total Internet Views
IAB Digital Usage Trend Report Full Year 2015
32%68%

• While consumers continue to spend more time online overall (up 4%), most of that growth is driven by
consumers on mobile devices
• More time is spent online using a mobile device than a computer but more sites, pages and videos are
viewed using a computer
By Year’s End, Nearly Twice as Many Online Minutes Were
Spent on a Mobile Device as on a Computer
1,394,954
1,448,481
843,770
948,308
551,184500,173
Dec-14 Jan-15 Feb-15 Mar-15 Apr-15 May-15 Jun-15 Jul-15 Aug-15 Sep-15 Oct-15 Nov-15 Dec-15
TotalInternetMinutes
TotalMobileMinutes
TotalDesktopMinutes
(Monthly Minutes Spent Online (MM), Dec 2014 – Dec 2015)
4%
12%
-9%
Source: comScore US Media Metrix Multi-Platform, Dec ’14 – Dec ’15, Total Internet Time Spent (MM)
IAB Digital Usage Trend Report Full Year 2015
Total Minutes: Digital and Mobile Audience 2015 Trend

60%40%
% of Total Internet Minutes
TotalMobileMinutes
TotalComputerMinutes
• The share of time spent online using a mobile device continues to grow, up from 60% a year ago.
Nearly Two-Thirds of All Internet Time is Spent
on a Mobile Device
Monthly Minutes Spent Online (MM), Dec 2014 vs. Dec 2015
Source: comScore US Media Metrix Multi-Platform, Dec ’14 – Dec ’15, Total Internet Time Spent (MM)
IAB Digital Usage Trend Report Full Year 2015
65%35%
(Mobile Browser and Apps)

• While more users (up 3%) continue to spend more time online overall (up 4%), most of that growth
is driven by consumers on smartphones
Time Spent on Smartphones Continues to Grow
Dec-14 Jan-15 Feb-15 Mar-15 Apr-15 May-15 Jun-15 Jul-15 Aug-15 Sep-15 Oct-15 Nov-15 Dec-15
Total Tablet Minutes
Total Smartphone Minutes
Total Computer Minutes
(Monthly Minutes Spent Online (MM), Dec. 2014 – Dec. 2015)
Source: comScore US Media Metrix Multi-Platform, Dec ’14 – Dec ’15, Total Internet Time Spent (MM)
IAB Digital Usage Trend Report Full Year 2015
Total Minutes: Digital and Mobile Audience 2015 Trend
40% 35%
46%54%
14%11%
Total Minutes
1.395T
Total Minutes
1.448T
(Mobile Includes Browser and Apps)
Total Mobile
Minutes
843.8B
Total Mobile
Minutes
948.3B
Dec-14 Jan-15 Feb-15 Mar-15 Apr-15 May-15 Jun-15 Jul-15 Aug-15 Sep-15 Oct-15 Nov-15 Dec-15
Total Tablet Minutes
Total Smartphone Minutes
Total Computer Minutes
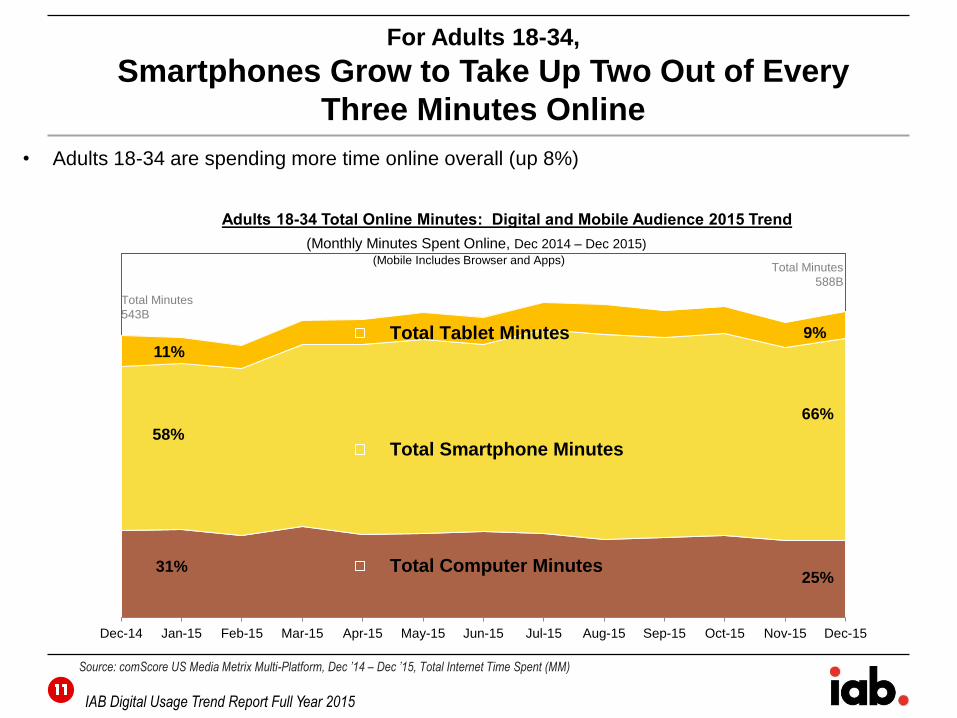
• Adults 18-34 are spending more time online overall (up 8%)
For Adults 18-34,
Smartphones Grow to Take Up Two Out of Every
Three Minutes Online
(Monthly Minutes Spent Online, Dec 2014 – Dec 2015)
Source: comScore US Media Metrix Multi-Platform, Dec ’14 – Dec ’15, Total Internet Time Spent (MM)
IAB Digital Usage Trend Report Full Year 2015
Adults 18-34 Total Online Minutes: Digital and Mobile Audience 2015 Trend
31%25%
58%
66%
11%
9%
Total Minutes
543B
Total Minutes
588B
(Mobile Includes Browser and Apps)

Dec-14 Jan-15 Feb-15 Mar-15 Apr-15 May-15 Jun-15 Jul-15 Aug-15 Sep-15 Oct-15 Nov-15 Dec-15
Total Tablet Minutes
Total Smartphone Minutes
Total Computer Minutes
• Adults 35-54 are spending slightly less time online overall (down 2%)
For Adults 35-54,
Smartphones Grow to Take Up Nearly Half of Their Online Time
(Monthly Minutes Spent Online, Dec 2014 – Dec 2015)
Source: comScore US Media Metrix Multi-Platform, Dec ’14 – Dec ’15, Total Internet Time Spent (MM)
IAB Digital Usage Trend Report Full Year 2015
Adults 35-54 Total Online Minutes: Digital and Mobile Audience 2015 Trend
39%35%
46% 54%
15% 11%
Total Minutes
535BTotal Minutes
526B
(Mobile Includes Browser and Apps)

Dec-14 Jan-15 Feb-15 Mar-15 Apr-15 May-15 Jun-15 Jul-15 Aug-15 Sep-15 Oct-15 Nov-15 Dec-15
Total Tablet Minutes
Total Smartphone Minutes
Total Computer Minutes
• Adults 55 and older are spending more time online overall (up 8%)
For Adults 55+,
Computers Still Take Up Nearly Half of Their Online Time
While Time on Smartphones Grows
(Monthly Minutes Spent Online, Dec 2014 – Dec 2015)
Source: comScore US Media Metrix Multi-Platform, Dec ’14 – Dec ’15, Total Internet Time Spent (MM)
IAB Digital Usage Trend Report Full Year 2015
Adults 55 and Older Total Online Minutes: Digital and Mobile Audience 2015 Trend
51%46%
29% 37%
20%
17%
Total Minutes
289B
Total Minutes
312B
(Mobile Includes Browser and Apps)
0%
50%
100%
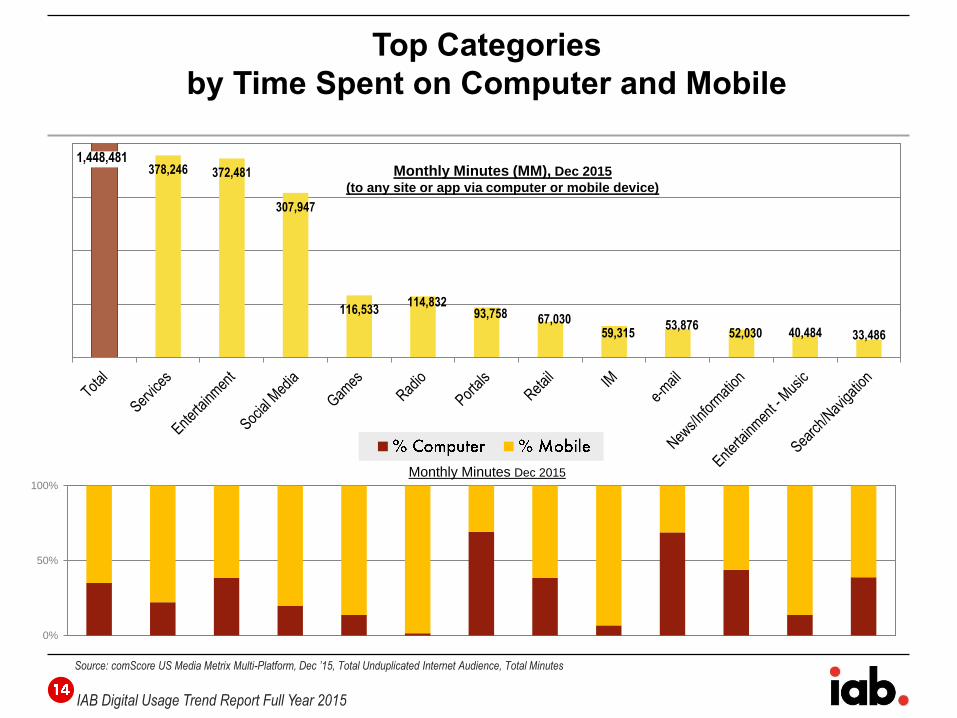
378,246 372,481
307,947
116,533114,832
93,758 67,03059,315
53,87652,030 40,484 33,486
Monthly Minutes (MM), Dec 2015
(to any site or app via computer or mobile device)
Top Categories
by Time Spent on Computer and Mobile
Source: comScore US Media Metrix Multi-Platform, Dec ’15, Total Unduplicated Internet Audience, Total Minutes
IAB Digital Usage Trend Report Full Year 2015
Monthly Minutes Dec 2015
1,448,481
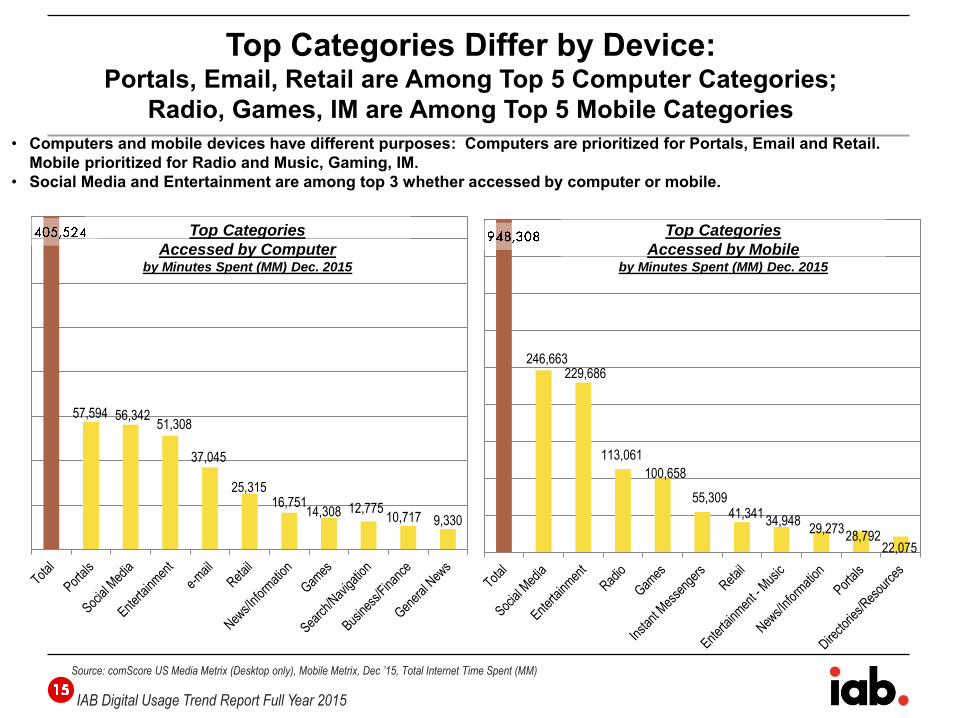
• Computers and mobile devices have different purposes: Computers are prioritized for Portals, Email and Retail.
Mobile prioritized for Radio and Music, Gaming, IM.
• Social Media and Entertainment are among top 3 whether accessed by computer or mobile.
246,663229,686
113,061
100,658
55,30941,341
34,94829,273
28,79222,075
57,594 56,34251,308
37,045
25,31516,751
14,308 12,77510,717 9,330
IAB Digital Usage Trend Report Full Year 2015
Top Categories
Accessed by Computerby Minutes Spent (MM) Dec. 2015
Top Categories
Accessed by Mobileby Minutes Spent (MM) Dec. 2015
Source: comScore US Media Metrix (Desktop only), Mobile Metrix, Dec ’15, Total Internet Time Spent (MM)
Top Categories Differ by Device: Portals, Email, Retail are Among Top 5 Computer Categories;
Radio, Games, IM are Among Top 5 Mobile Categories

200,722
94,95892,232
74,554
19,79819,38413,721 13,247
11,92311,074
84,453
50,646
34,904
20,16418,775
8,440 6,0504,593 3,4632,872
Top 10 Sites by Time Spent on Device Differ Immensely
IAB Digital Usage Trend Report Full Year 2015
Top Sites
Accessed by Computerby Minutes Spent (MM) Dec. 2015
Top Sites
Accessed by Mobileby Minutes Spent (MM) Dec. 2015
Source: comScore US Media Metrix (Desktop only), Mobile Metrix, Dec ’15
500,173 948,308
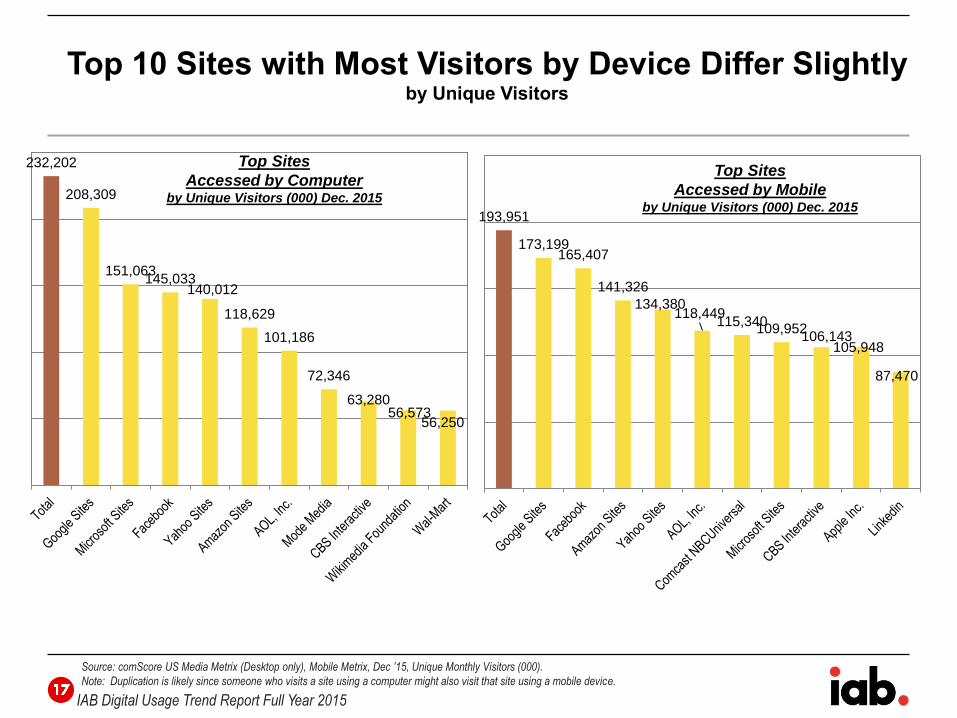
193,951
173,199165,407
141,326
134,380118,449
115,340109,952
106,143105,948
87,470
232,202
208,309
151,063145,033
140,012
118,629
101,186
72,346
63,28056,573
56,250
Top 10 Sites with Most Visitors by Device Differ Slightlyby Unique Visitors
IAB Digital Usage Trend Report Full Year 2015
Top Sites
Accessed by Computerby Unique Visitors (000) Dec. 2015
Top Sites
Accessed by Mobileby Unique Visitors (000) Dec. 2015
Source: comScore US Media Metrix (Desktop only), Mobile Metrix, Dec ’15, Unique Monthly Visitors (000).
Note: Duplication is likely since someone who visits a site using a computer might also visit that site using a mobile device.
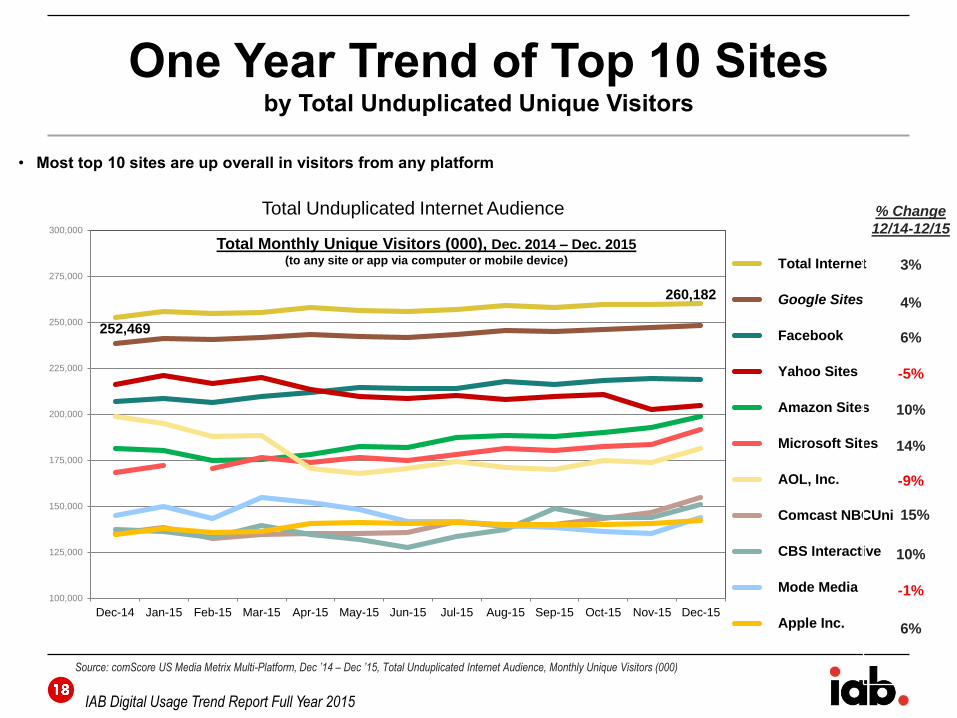
252,469
260,182
100,000
125,000
150,000
175,000
200,000
225,000
250,000
275,000
300,000
Dec-14 Jan-15 Feb-15 Mar-15 Apr-15 May-15 Jun-15 Jul-15 Aug-15 Sep-15 Oct-15 Nov-15 Dec-15
Total Internet
Google Sites
Yahoo Sites
Amazon Sites
Microsoft Sites
AOL, Inc.
Comcast NBCUni
CBS Interactive
Mode Media
Apple Inc.
One Year Trend of Top 10 Sitesby Total Unduplicated Unique Visitors
Total Monthly Unique Visitors (000), Dec. 2014 – Dec. 2015(to any site or app via computer or mobile device)
% Change
12/14-12/15
3%
4%
6%
-5%
10%
14%
-9%
15%
10%
-1%
6%
IAB Digital Usage Trend Report Full Year 2015
Total Unduplicated Internet Audience
Source: comScore US Media Metrix Multi-Platform, Dec ’14 – Dec ’15, Total Unduplicated Internet Audience, Monthly Unique Visitors (000)
• Most top 10 sites are up overall in visitors from any platform

248,385
218,640204,885
198,719191,507
181,209154,848
150,669143,788
142,396
118,640118,105
115,637
114,025
112,604
111,832
111,312105,458103,965
100,899100,242
92,483 92,41090,918
89,702
0
50,000
100,000
150,000
200,000
250,000
300,000
Monthly Unique Visitors (000), Dec 2015
(to any site or app via computer or mobile device)
Top 25 Properties with the Most Visitors
Accessed by Computer or Mobileby Unduplicated Monthly Unique Visitors
% Change in Monthly Unique Visitors (000) of Total Unduplicated Internet Audience
Dec. 2015 vs. Dec. 2014
260,182 Total Unduplicated Internet Audience
Source: comScore US Media Metrix Multi-Platform, Dec ’14 – Dec ’15, Total Unduplicated Internet Audience, Monthly Unique Visitors (000)
IAB Digital Usage Trend Report Full Year 2015

0%
50%
100%
% Time Spent on Computer % Time Spent on Mobile
251,369
176,685
95,557
74,847 54,28829,849
26,93219,849
19,77213,827
12,26910,890
10,696 8,629 8,1398,005 7,594 7,120
5,887
5,150 4,2603,961 3,440 3,056 2,855
0
100,000
200,000
Monthly Minutes (MM), Dec 2015
(to any site or app via computer or mobile device by total audience)
Top 25 Properties
by Time Spent on Computer and Mobile
Source: comScore US Media Metrix Multi-Platform, Dec ’15, Total Unduplicated Internet Audience, Total Minutes
IAB Digital Usage Trend Report Full Year 2015
1,448,481

Mobile
Full Year 2015 Report
IAB Digital Usage Trend Report

22
Mobile Advertising Revenue To Date:
Explosive Growth
$0.6 $1.2
$3.0
$5.3
$8.2
$0.6
$1.6$3.4
$7.1
$12.4
FY '10 FY'11 FY'12 FY '13 FY '14 FY '15
1st Half Year 2nd Half Year
US Mobile Ad Revenue ($ Billions)First Half Year, Full Year and % YoY Growth
22
Growth
FY: 149%
Growth
1HY: 95%
FY: 111%
$1.0$2.1
$12.5
Source: IAB Internet Advertising Revenue Report, Full and Half Year 2010-2015
Growth
1HY: 54%
FY: 66%
$4.0
$7.1
Growth
1HY:145%
FY: 110%
Growth
1HY: 75%
FY: 76%
*Full year totals accurately reflect the sum of half year totals as rounded to two decimal places.
$20.7

166,466
177,594
166,260
175,095
160,000
165,000
170,000
175,000
180,000
Dec-14 Jan-15 Feb-15 Mar-15 Apr-15 May-15 Jun-15 Jul-15 Aug-15 Sep-15 Oct-15 Nov-15 Dec-15
% Change
12/14-12/15
More Users are Accessing the Internet via
Mobile Web and Apps
Monthly Unique Visitors (000), Dec. 2014 – Dec. 2015
(to Mobile Sites and Apps)
IAB Digital Usage Trend Report Full Year 2015
ComScore Mobile Metrix, All smartphones (iPhone,Android Phone), all tablets (iPad,Android Tablet), browser and app.
Note: Duplication is likely since someone who browses on a mobile device also probably uses mobile apps.
The total unduplicated number of unique monthly mobile visitors using any mobile device via mobile web or app in Dec. 2015 was 193,951.
Total Unique Visitors (000)
Via Mobile Web
Total Unique Visitors (000)
Via Mobile App
5%
7%

More Time is Spent on
Mobile Apps Than on Mobile Web
Total Mobile Minutes on Browser vs. In App
IAB Digital Usage Trend Report Full Year 2015
14%
86%
Total Browser Minutes Total App Minutes
Source: comScore US Mobile Metrix, Dec ’14, Dec ’15, Total Minutes Browsing, Applications

77%
23%
Total Minutes
TotalSmartphoneMinutes
Total TabletMinutes
Increasingly, More Mobile Time is Spent on
Smartphones Than on Tablets
Browsing and Apps combined
IAB Digital Usage Trend Report Full Year 2015
83%
17%
Source: comScore US Mobile Metrix, Dec ’14, Dec ’15, Total Minutes Browsing and Application combined*Android Tablet numbers are not reported for many top sites, causing an unnaturally lower number for tablet use of top sites.

45%55%
iPhone
AndroidPhone
Smartphones: As of Dec. 2015, More Unique Visitors Used
an Android and Time Spent was Equal Between Phones
26
Browsing and Apps combined
IAB Digital Usage Trend Report Full Year 2015
49%51%
Total Unique Visitors Total Time Spent OnlineDec. 2015
Source: comScore US Mobile Metrix, Dec ’15, Total Unique Visitors, Total Minutes, Browsing and Applications combined

17% 16% 14% 18% 14%23%
8% 13% 15% 19%5%
0%
50%
100%
294,471,809
246,662,978229,686,010
113,061,423 100,658,262
55,308,971 41,341,38734,947,838
29,273,37528,791,737 22,075,318
Monthly Mobile Minutes (000), Dec 2015
(to any site or app via any mobile device)
Top Mobile Categories
by Time Spent on Smartphones and Tablets
IAB Digital Usage Trend Report Full Year 2015
Monthly Minutes Dec 2015
ComScore Mobile Metrix, Total Mobile Minutes (Mobile Browser and Mobile App), All Smartphones (iPhone,Android Phone) vs. All Tablets (iPad,Android Tablet)
*Android Tablet numbers are not reported for many top sites, causing an unnaturally lower number for tablet use of top sites.
0%
50%
100%
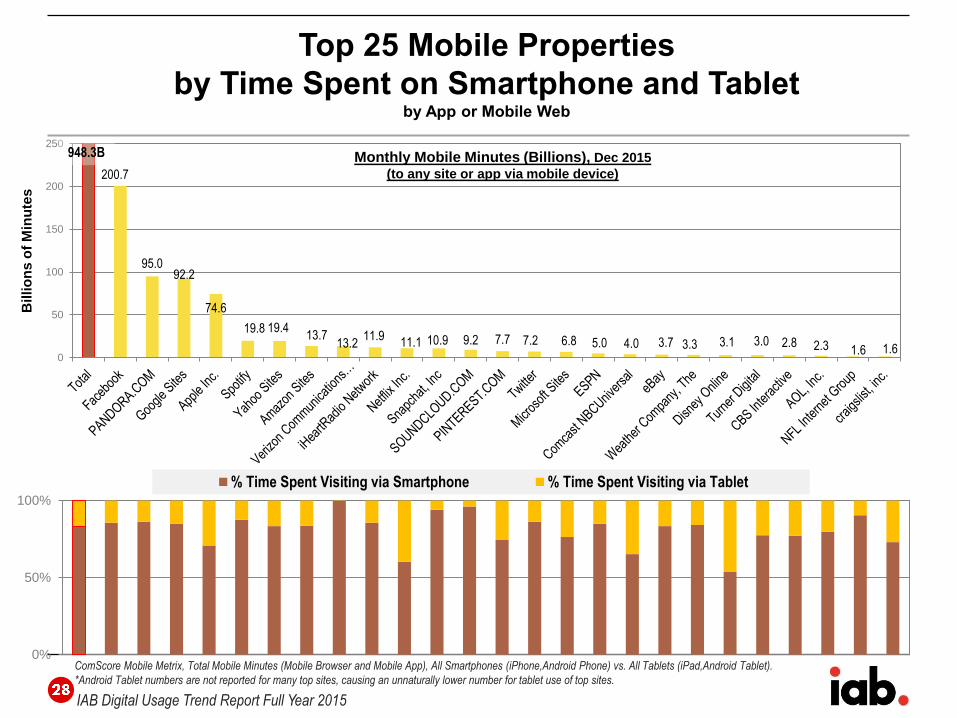
% Time Spent Visiting via Smartphone % Time Spent Visiting via Tablet
200.7
95.092.2
74.6
19.8 19.413.7
13.211.9
11.1 10.9 9.2 7.7 7.2 6.8 5.0 4.0 3.7 3.3 3.1 3.0 2.8 2.3 1.6 1.60
50
100
150
200
250
Monthly Mobile Minutes (Billions), Dec 2015
(to any site or app via mobile device)
Top 25 Mobile Properties
by Time Spent on Smartphone and Tabletby App or Mobile Web
948.3B
IAB Digital Usage Trend Report Full Year 2015
ComScore Mobile Metrix, Total Mobile Minutes (Mobile Browser and Mobile App), All Smartphones (iPhone,Android Phone) vs. All Tablets (iPad,Android Tablet).
*Android Tablet numbers are not reported for many top sites, causing an unnaturally lower number for tablet use of top sites.
Billio
ns
of
Min
ute
s

% Change
12/14-12/15
6%
9%
10%
18%
-4%
13%
23%
49%
20%
13%
27%50,000
75,000
100,000
125,000
150,000
175,000
200,000
225,000
Dec-14 Jan-15 Feb-15 Mar-15 Apr-15 May-15 Jun-15 Jul-15 Aug-15 Sep-15 Oct-15 Nov-15 Dec-15
Total Internet
Google Sites
Amazon Sites
Yahoo Sites
AOL, Inc.
Comcast NBCUni
Microsoft
CBS Interactive
Apple Inc.
One Year Trend of Top 10 Mobile Propertiesby Unique Visitors
Monthly Mobile Unique Visitors (000), Dec. 2014 – Dec. 2015
(to Mobile Sites and Apps by Smartphone or Tablet)
• Visitors to most Top 10 mobile sites and apps have grown by double digits over the year
IAB Digital Usage Trend Report Full Year 2015
ComScore Mobile Metrix, All Smartphones (iPhone,Android Phone) and Tablets (iPad,Android Tablet), browser and app combined.

175,095
52,148
27,238
17,371 14,434 13,48413,187
11,27610,982 9,784
9,740
Some Sites are More Popularly Visited in
Apps Than Mobile Webby Unique Visitors
ComScore Mobile Metrix, Total Mobile (All Smartphones,iPhone,Android Phone,All Tablets,iPad,Android Tablet), Mobile Browser Only, Mobile App Only
IAB Digital Usage Trend Report Full Year 2015
177594
146,851
145,082
95,343
87,33280,522 77,417
71,040
47,826
47,451
39,583
Top 10 Sites
Accessed by Mobile Browser Onlyby Unique Visitors (000) Dec. 2015
Top 10 Sites
Accessed by Mobile App Onlyby Unique Visitors (000) Dec. 2015
Note: Duplication is likely since someone who visits a site using a computer might also visit that site using a mobile device.

22,796,746
17,057,315
4,469,759
3,691,5312,808,187
1,876,978
1,601,5701,162,923
1,128,884989,179
Top Mobile Sites by Time Spent
in App are Very Different from Mobile Web Sites
ComScore Mobile Metrix, Total Mobile (All Smartphones,iPhone,Android Phone,All Tablets,iPad,Android Tablet), Mobile Browser Only, Mobile App Only
IAB Digital Usage Trend Report Full Year 2015
177,925,680
94,952,242
75,174,48474,375,563
19,782,68714,914,469
13,082,38811,752,528
11,030,49710,886,111
Top 10 Sites
Accessed by Mobile Browser Onlyby Minutes Spent (000) Dec. 2015
Top 10 Sites
Accessed by Mobile App Onlyby Minutes Spent (000) Dec. 2015
Note: Duplication is likely since someone who visits a site using a computer might also visit that site using a mobile device.
• 4 of the Top 10 mobile apps by time spent are streaming apps
131,090,926 817,216,829
Computer-Based Internet Usage
Full Year 2015 Report
IAB Digital Usage Trend Report

228,444
649,191
50,000
150,000
250,000
350,000
450,000
550,000
650,000
Computer Internet Usage is SteadyBut Users are Spending Less Time On Computers
as They Shift to Mobile Devices
% ChangeYear over
Year(12/14-12/15)
+2%
-8%
-14%
1
4
Source: ComScore MediaMetrix Dec. 2014 to Dec. 2015, Total Internet. Doesn’t include mobile
IAB Digital Usage Trend Report Full Year 2015
Total Minutes (MM)
555,228
Total Unique Visitors (000)
Total Pages Viewed (000)
232,202
405,525

59,989
61,634
70,921
71,694
53,561
57,337
50,000
55,000
60,000
65,000
70,000
75,000
Dec-2014 Jan-2015 Feb-2015 Mar-2015 Apr-2015 May-2015 Jun-2015 Jul-2015 Aug-2015 Sep-2015 Oct-2015 Nov-2015 Dec-2015
Number of Users Accessing Internet via Computer is
Steady with Fastest Growth from Adults 55 and Older
% ChangeYear over
Year(12/14-12/15)
+7%
+3%
+1%
1
4
• 35-54 year olds are still the largest group of users accessing via computer
Source: ComScore MediaMetrix Dec. 2014 to Dec. 2015, Total Internet. Doesn’t include mobile
IAB Digital Usage Trend Report Full Year 2015

100,000
110,000
120,000
130,000
140,000
150,000
160,000
170,000
180,000
Dec-2014 Jan-2015 Feb-2015 Mar-2015 Apr-2015 May-2015 Jun-2015 Jul-2015 Aug-2015 Sep-2015 Oct-2015 Nov-2015 Dec-2015
Time Spent Online is Shifting from Computer to Mobile
% ChangeYear over
Year(12/14-12/15)
-9%
-2%
-10%
1
4
• 35-54 Year Olds Still Spend the Most Time Accessing Sites via Computer
• Adults 55 and over now spend as much time online via computer as 18-34 year olds
Source: ComScore MediaMetrix Dec. 2014 to Dec. 2015, Total Internet. Doesn’t include mobile
IAB Digital Usage Trend Report Full Year 2015

228,444 232,202
140,000
160,000
180,000
200,000
220,000
240,000
260,000
Dec-2014 Jan-2015 Feb-2015 Mar-2015 Apr-2015 May-2015 Jun-2015 Jul-2015 Aug-2015 Sep-2015 Oct-2015 Nov-2015 Dec-2015
Total
Search/Navigation
Social Media
Portals
Entertainment
Retail
Directories/Resources
News/Information
Technology
Business/Finance
Top Category Visitors Over the Yearvia Computer
Source: ComScore MediaMetrix Dec. 2014 to Dec. 2015, Total Internet. Doesn’t include mobile
IAB Digital Usage Trend Report Full Year 2015
Decrease / Increase
% Change YoYTop Categories by Unique Visitors (000) Dec. 2015
2%
4%
6%
-5%
6%
-3%
-1%
-12%
0%
0%

20,000
70,000
120,000
170,000
220,000
Dec-2014 Jan-2015 Feb-2015 Mar-2015 Apr-2015 May-2015 Jun-2015 Jul-2015 Aug-2015 Sep-2015 Oct-2015 Nov-2015 Dec-2015
Total
Google Sites
Microsoft Sites
Yahoo Sites
Amazon Sites
AOL, Inc.
Mode Media
CBS Interactive
Wikimedia
Wal-Mart
One Year Trend of Top 10 Sitesby Unique Visitors on Computer
Monthly Unique Visitors (000), Dec. 2014 – Dec. 2015
• Top 3 sites are up slightly in unique visitors via computer while others have dropped since last Dec.
Source: ComScore MediaMetrix Dec. 2014 to Dec. 2015, Total Internet. Doesn’t include mobile
IAB Digital Usage Trend Report Full Year 2015
% Change YoY
Decrease / Increase
2%
6%
3%
3%
-13%
1%
-2%
-14%
-12%
-17%
-6%
37

232,202
208,309
151,063
145,033
140,012
118,629101,186
72,346
63,28056,573
56,25055,908
55,33252,95049,861
41,59841,05740,46639,30639,256
39,098 37,85137,606 37,295 36,48535,743
0
100,000
200,000
Unique Visitors (000), Dec 2015
(via Computer)
Top 25 Properties
Visited on Computerby Unique Visitors and Percent Change Since Last Year
IAB Digital Usage Trend Report Full Year 2015
2% 6% 3% 3%
-13%
1%
-2%-14%-12%-17%
-6%
-24%-14%-13%-17%-15%
-6%
14% 1% 1%
-7%-24%-24%
-11%
16%
% Change in Unique Visitors Dec. 2014 – Dec. 2015
Green = Up from Last Year’s Rank
Red = Down from Last Year’s Rank
Source: ComScore MediaMetrix Dec. 2014 to Dec. 2015, Total Internet. Doesn’t include mobile
1 3 4 2 5 6 7 9 10 14 8 11 12 13 17 18 23 24 19 15 16 26 20 36 Previous
Year’s Rank #
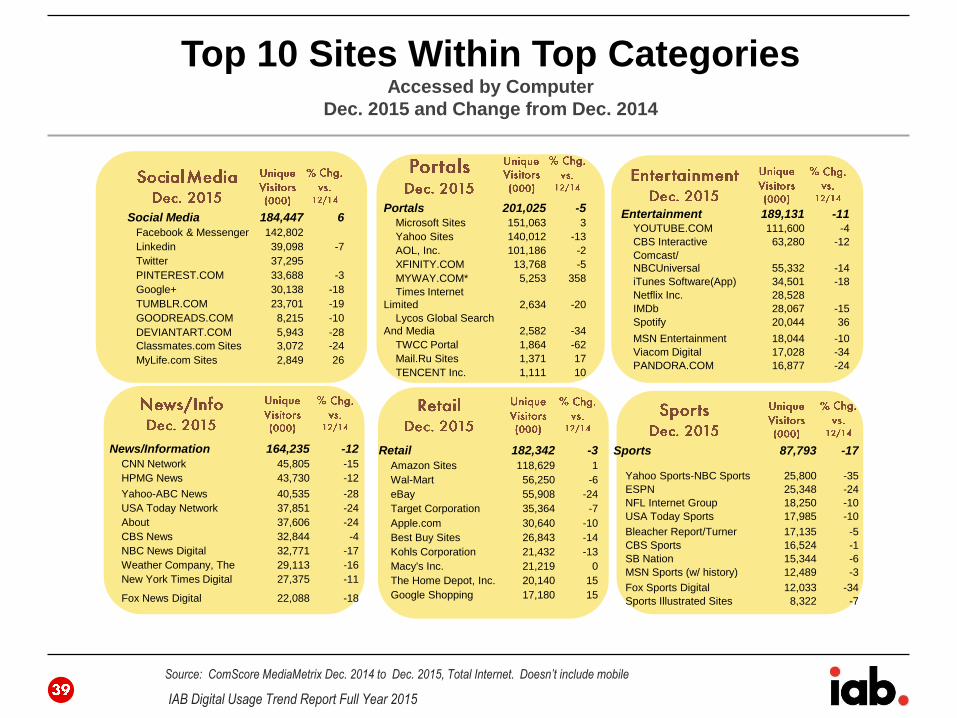
Top 10 Sites Within Top CategoriesAccessed by Computer
Dec. 2015 and Change from Dec. 2014
Social Media 184,447 6
Facebook & Messenger 142,802
Linkedin 39,098 -7
Twitter 37,295
PINTEREST.COM 33,688 -3
Google+ 30,138 -18
TUMBLR.COM 23,701 -19
GOODREADS.COM 8,215 -10
DEVIANTART.COM 5,943 -28
Classmates.com Sites 3,072 -24
MyLife.com Sites 2,849 26
Entertainment 189,131 -11YOUTUBE.COM 111,600 -4
CBS Interactive 63,280 -12
Comcast/
NBCUniversal 55,332 -14
iTunes Software(App) 34,501 -18
Netflix Inc. 28,528
IMDb 28,067 -15
Spotify 20,044 36
MSN Entertainment 18,044 -10
Viacom Digital 17,028 -34
PANDORA.COM 16,877 -24
Sports 87,793 -17
Yahoo Sports-NBC Sports 25,800 -35
ESPN 25,348 -24
NFL Internet Group 18,250 -10
USA Today Sports 17,985 -10
Bleacher Report/Turner 17,135 -5
CBS Sports 16,524 -1
SB Nation 15,344 -6
MSN Sports (w/ history) 12,489 -3
Fox Sports Digital 12,033 -34
Sports Illustrated Sites 8,322 -7
Retail 182,342 -3
Amazon Sites 118,629 1
Wal-Mart 56,250 -6
eBay 55,908 -24
Target Corporation 35,364 -7
Apple.com 30,640 -10
Best Buy Sites 26,843 -14
Kohls Corporation 21,432 -13
Macy's Inc. 21,219 0
The Home Depot, Inc. 20,140 15
Google Shopping 17,180 15
News/Information 164,235 -12
CNN Network 45,805 -15
HPMG News 43,730 -12
Yahoo-ABC News 40,535 -28
USA Today Network 37,851 -24
About 37,606 -24
CBS News 32,844 -4
NBC News Digital 32,771 -17
Weather Company, The 29,113 -16
New York Times Digital 27,375 -11
Fox News Digital 22,088 -18
IAB Digital Usage Trend Report Full Year 2015
Source: ComScore MediaMetrix Dec. 2014 to Dec. 2015, Total Internet. Doesn’t include mobile
Portals 201,025 -5
Microsoft Sites 151,063 3
Yahoo Sites 140,012 -13
AOL, Inc. 101,186 -2
XFINITY.COM 13,768 -5
MYWAY.COM* 5,253 358
Times Internet
Limited 2,634 -20
Lycos Global Search
And Media 2,582 -34
TWCC Portal 1,864 -62
Mail.Ru Sites 1,371 17
TENCENT Inc. 1,111 10
Digital Video
Full Year 2015 Report
IAB Digital Usage Trend Report

41
FY '10 FY'11 FY'12 FY '13 FY '14 HY'15
1st Half Year 2nd Half Year
Source: IAB Internet Advertising Revenue Reports, Full and Half Year 2010-2015
US Video Ad Revenue ($ Billions)First Half Year, Full Year and % YoY Growth
41
Growth
1HY: 47%
FY: 29%
$2.2
IAB 2015 Full Year and Q4 2015 Internet Advertising Revenue Report
Growth
1HY: 35%
FY: 30%Growth
1HY: 24%
FY: 19%
Growth
1HY: 18%
FY: 29%
Growth
1HY: 13%
FY: 17%
$3.3B
$2.8B
$2.3B
$1.8B
$1.4B
$0.6B $0.9B $1.0B $1.3B $1.5B $2.0B
$0.8B$0.9B
$1.3B
$1.5B
$1.8B
$4.2B
$2.2B
Digital Video Advertising Revenue To Date: Nearly Tripled Over 5 Years

195,691197,088
62,007,70158,687,660
Total Content Video Streams (000)
239,212
219,761
Total Video Minutes (MM)
Dec-14 Jan-15 Feb-15 Mar-15 Apr-15 May-15 Jun-15 Jul-15 Aug-15 Sep-15 Oct-15 Nov-15 Dec-15
Digital Video One Year Trendvia Computer
% YoY Change
12/14-12/15
ComScore VideoMetrix Dec. ‘14 – Dec.’15, Total Audience. Doesn’t include mobile.
-8%
+1%
-5%
Total Unique Streamers(000)
42
ComScore defines a video as any streamed segment of audiovisual content, (both progressive downloads and live streams). For long-form, segmented content, (e.g. TV episodes with ad pods in the middle) each 8 min. segment of the content is counted as a distinct videostream. Video Ads are separate from Content Videos.
IAB Digital Usage Trend Report Full Year 2015
• The number of people streaming videos is flat while the number of videos and time spent streaming
them has dropped slightly since a year ago, largely driven by children under 18 shifting to mobile

Dec-14 Jan-15 Feb-15 Mar-15 Apr-15 May-15 Jun-15 Jul-15 Aug-15 Sep-15 Oct-15 Nov-15 Dec-15
More Adults 55 and Older Are Streaming Videos
While Fewer Kids Under 18 are Streaming on a Computer
% ChangeYear over Year
(6/14-6/15)
+6%
+2%
+1%
43
• 35-54 year olds still make up the largest demo of computer-based video streamers
• More Adults 18 and older are streaming videos using a computer
ComScore VideoMetrix Jun. ‘14 – Jun.’15, Total Audience, Home and Work. Doesn’t include mobile.
IAB Digital Usage Trend Report Full Year 2015
-9%

Dec-14 Jan-15 Feb-15 Mar-15 Apr-15 May-15 Jun-15 Jul-15 Aug-15 Sep-15 Oct-15 Nov-15 Dec-15
Adults 55 and Older Are Streaming More Videos on a
Computer, on Par with 18-34 Year Olds
% ChangeYear over Year
(12/14-12/15)
+12%
-18%
-3%
• 35-54 year olds stream the most videos
• Those under 35 are streaming fewer videos on a computer than they did last December
ComScore VideoMetrix Dec. ‘14 – Dec.’15, Total Audience, Home and Work. Doesn’t include mobile.
IAB Digital Usage Trend Report Full Year 2015
-22%
44

Dec-14 Jan-15 Feb-15 Mar-15 Apr-15 May-15 Jun-15 Jul-15 Aug-15 Sep-15 Oct-15 Nov-15 Dec-15
Time Spent Streaming Videos Has Dropped from a Year Ago
% ChangeYear over Year
(12/14-12/15)
+2%
-13%
-9%
• Adults 55 and older are spending slightly more time streaming video
ComScore VideoMetrix Dec. ‘14 – Dec.’15, Total Audience, Home and Work. Doesn’t include mobile.
IAB Digital Usage Trend Report Full Year 2015
-18%
45

14,060
14,654Total Video Ad Minutes Streamed (MM)
Dec-14 Jan-15 Feb-15 Mar-15 Apr-15 May-15 Jun-15 Jul-15 Aug-15 Sep-15 Oct-15 Nov-15 Dec-15
38,412,837
39,974,364
Total Video Ad Streams (000)
ComScore VideoMetrix Dec. ‘14 – Dec.’15, Total Audience, Home and Work. Doesn’t include mobile.
IAB Digital Usage Trend Report Full Year 2015
More Video Ads Are Being
Streamed for Longer
% YoY Change
12/14-12/15
ComScore VideoMetrix Dec. ‘14 – Dec. ‘15
+4%
+4%
Video Ads are separate from Content Videos.
46

Video Ads Account for Only 6% of Streaming Time
• Roughly two-thirds of videos streamed are video ads
• But this only accounts for 6% of video streaming time – or 4 minutes of every hour of streaming video
content
94%
6%
% of Video Streaming Time That is Video Ads
59%41%
% of Videos Streamed that are Ads
% of videos that are ads is up 6% from a year ago% of video streaming time that is advertising is
up 13% from a year ago
ComScore VideoMetrix Dec. ’15 and change from Dec.’14, Total Audience, Home and Work. Doesn’t include mobile.
IAB Digital Usage Trend Report Full Year 2015
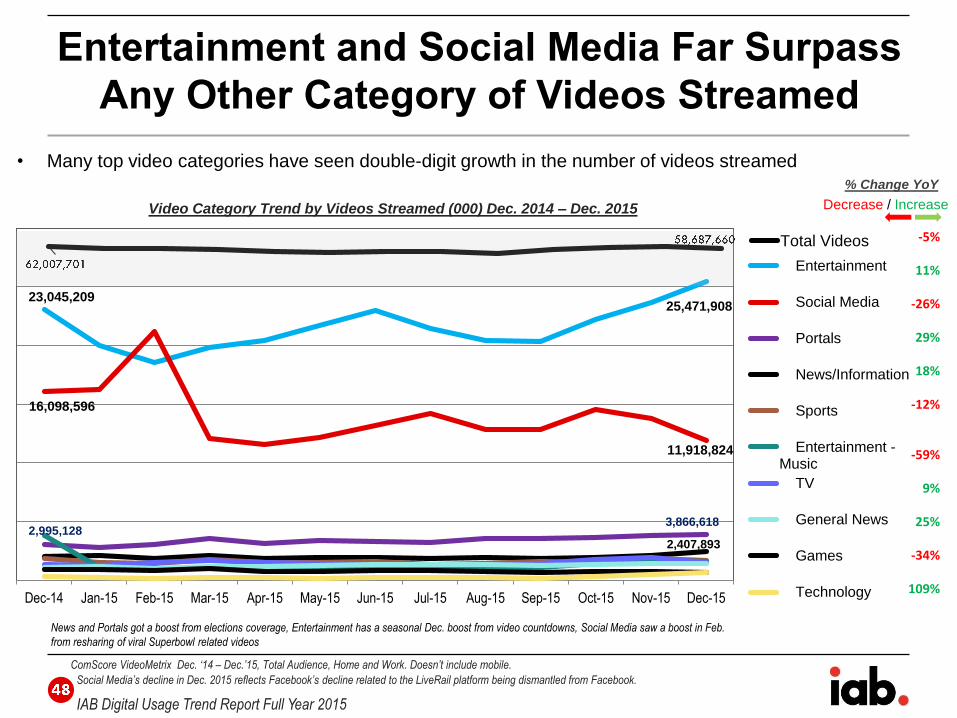
23,045,20925,471,908
16,098,596
11,918,824
2,995,1283,866,618
2,407,893
Dec-14 Jan-15 Feb-15 Mar-15 Apr-15 May-15 Jun-15 Jul-15 Aug-15 Sep-15 Oct-15 Nov-15 Dec-15
Entertainment
Social Media
Portals
News/Information
Sports
Entertainment -Music
TV
General News
Games
Technology
Total Videos
Decrease / Increase
• Many top video categories have seen double-digit growth in the number of videos streamed
Entertainment and Social Media Far Surpass
Any Other Category of Videos Streamed
Video Category Trend by Videos Streamed (000) Dec. 2014 – Dec. 2015
% Change YoY
-5%
11%
-26%
29%
18%
-12%
-59%
9%
25%
-34%
109%
ComScore VideoMetrix Dec. ‘14 – Dec.’15, Total Audience, Home and Work. Doesn’t include mobile.
IAB Digital Usage Trend Report Full Year 2015
Social Media’s decline in Dec. 2015 reflects Facebook’s decline related to the LiveRail platform being dismantled from Facebook.
News and Portals got a boost from elections coverage, Entertainment has a seasonal Dec. boost from video countdowns, Social Media saw a boost in Feb.
from resharing of viral Superbowl related videos

Top 10 Sites Within Video Categories Ranked by Unique Monthly Streamers December 2015
Social Media 119,683 11,918,824
Facebook 88,426 9,383,137
Mode Social 38,004 151,394
Twitter 32,285 683,873
ITIBITIPHONE.COM 7,042 1,187,246
TUMBLR.COM 6,355 381,126
LIJIT.COM 2,437 4,534
KALTURA.COM 1,955 5,225
IMGUR.COM 1,871 46,064
TRUEX.COM 1,495 13,537
Technorati Media 1,447 4,021
Portals 104,304 3,866,618
Yahoo Sites 69,699 2,322,718
Microsoft Sites 38,050 934,375
AOL, Inc. 35,625 530,479
Times Internet 804 7,868
TENCENT Inc. 629 9,093
Mail.Ru Sites 613 4,203
TWCC Portal 550 4,658
Grupo Televisa 485 3,394
XFINITY.COM 462 1,717
YANDEX 419 1,144
Entertainment 196,497 25,471,908
YOUTUBE.COM 175,570 14,461,499
Vimeo 58,644 358,408
VEVO 43,837 909,200
Maker Studios Inc. 42,404 629,098
Warner Music 40,096 422,757
Comcast NBCUniversal 37,197 327,954
Fullscreen 37,153 439,641
CBS Interactive 34,211 262,740
DAILYMOTION.COM 33,363 132,715
ABC Digital 28,405 300,067
Sports 52,575 1,657,851
Fox Sports Digital 18,099 323,599
ESPN 13,362 261,035
Yahoo Sports-NBC Sports 10,151 144,503
NFL Internet Group 9,053 91,129
CineSport 7,540 44,095
Sports Illustrated Sites 6,415 21,904
CBS Sports 4,934 34,394
MLB 4,118 30,971
SB Nation 3,900 11,474
Whistle Sports 3,876 20,255
Entertainment - Music 65,611 1,593,925
VEVO 43,837 909,200
Warner Music 40,096 422,757
INDYMUSIC.TV 5,244 124,458
ROCK.COM 3,755 73,708
MSN Music 3,427 7,847
Vidaprimo 2,352 5,880
AUX Music Network 1,869 8,206
IHEARTMUSIC.US 1,388 4,991
Myspace 1,266 12,647
Billboard 897 1,604
News/Information 94,833 2,407,893
CNN Network 28,053 276,317
Yahoo-ABC News 25,249 383,098
Inform (Formerly NDN) 23,113 168,023
NBC News Digital 21,709 129,107
HPMG News 19,888 95,123
CBS News 14,573 110,484
Fox News Digital 12,716 139,504
MSN News 10,859 61,078
USA TODAY Network 10,649 54,152
BUZZFEED.COM 8,258 92,550
ComScore VideoMetrix Dec. ‘14 – Dec. ’15, Total Audience, Home and Work. Doesn’t include mobile.
IAB Digital Usage Trend Report Full Year 2015

1% 10%
-9%
22%49%
98%
-1% -2%
54%38% 16% 1%
-61%
40%83%
9%
99%
-17%
4%
-29%-73%
-29%
197,088
180,955
88,426
69,69958,644
44,22343,83742,404
40,096 38,05037,197
37,15335,62534,211
33,36332,678
32,28528,40526,51125,32723,444
23,113
23,08619,622
19,04318,099
Most Visited Video SitesTop Sites by Unique Video Streamers and Change from Last Year
• Most top 25 video sites saw an increase in streaming visitors to their sites compared to a
year ago.Top Sites
by Unique Video Streamers (000) Dec. 2015
% Change in Monthly Unique Video Streamers Dec. 2014 – Dec. 2015
Growthfrom a year ago
Decline
ComScore VideoMetrix Dec. ‘14 – Dec. ’15, Total Audience, Home and Work. Doesn’t include mobile.
IAB Digital Usage Trend Report Full Year 2015
Social Media’s decline in Dec. 2015 reflects Facebook’s decline related to the LiveRail platform being dismantled from Facebook.
With September 2015 data onward, YouTube partner audiences will be better represented in Video Metrix. This is due to improvements made by YouTube in tagging of YouTube
partner traffic. comScore did not make any changes to its processes.

9,383
2,3232,177
1,437934 909 690 684 629 533 530 440 423 377 358 328 324 306 300 278 263 261 189 169
58,688
-5%
23%
-21%
136%
-55%
36% 35%11% 4%
-57%
5%
144%
41%
98%
3%
-61%
3%
145%
6%
-5% -18%
106%
Most Streamed Video SitesTop Sites by Videos Streamed and Change from Last Year
• Most top 25 video sites saw an increase in the number of videos streamed on their sites over the year.
• Among Top 3, videos streamed on Facebook have dropped due to the LiveRail platform being dismantled
from Facebook and Yahoo’s video streams grew due to its 2015 focus on TV-style videos.
Top Sitesby Videos Streamed (MM) Dec. 2015
% Change in Monthly Videos Streamed (000) Dec. 2014 – Dec. 2015
ComScore VideoMetrix Dec. ‘14 – Dec. ’15, Total Audience, Home and Work. Doesn’t include mobile.
IAB Digital Usage Trend Report Full Year 2015
Growthfrom a year ago
Decline
3877%
Videos streamed on Facebook have dropped due to the LiveRail platform being dismantled from Facebook.
With September 2015 data onward, YouTube partner audiences will be better represented in Video Metrix. This is due to improvements made by YouTube in tagging of YouTube
partner traffic. comScore did not make any changes to its processes.
14,725
195,691197,088
163,825
180,955
96,667
88,426
57,138
69,699
39,476
58,644
22,382
44,223
25,980 40,096
Dec-14 Jan-15 Feb-15 Mar-15 Apr-15 May-15 Jun-15 Jul-15 Aug-15 Sep-15 Oct-15 Nov-15 Dec-15
Total Unique VideoStreamers
Google Sites
Yahoo Sites
Vimeo
Mode Media
VEVO
Maker Studios Inc.
Warner Music
Microsoft Sites
ComcastNBCUniversal
Decrease / Increase
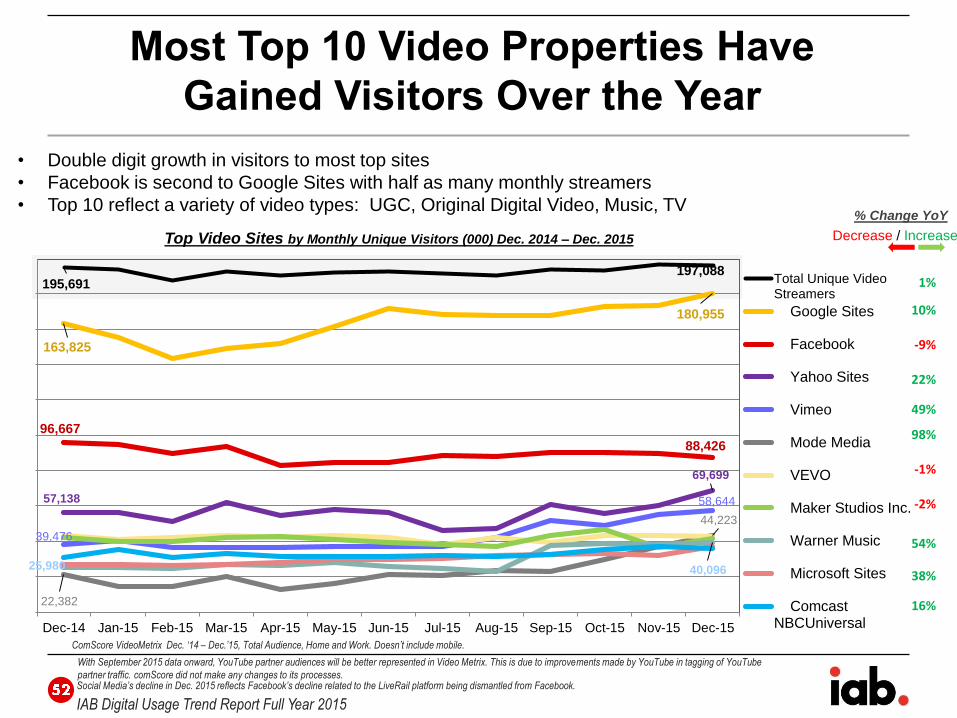
• Double digit growth in visitors to most top sites
• Facebook is second to Google Sites with half as many monthly streamers
• Top 10 reflect a variety of video types: UGC, Original Digital Video, Music, TV
Most Top 10 Video Properties Have
Gained Visitors Over the Year
% Change YoY
Top Video Sites by Monthly Unique Visitors (000) Dec. 2014 – Dec. 2015
1%
10%
-9%
22%
49%
98%
-1%
-2%
54%
38%
16%
ComScore VideoMetrix Dec. ‘14 – Dec.’15, Total Audience, Home and Work. Doesn’t include mobile.
IAB Digital Usage Trend Report Full Year 2015
Social Media’s decline in Dec. 2015 reflects Facebook’s decline related to the LiveRail platform being dismantled from Facebook.
With September 2015 data onward, YouTube partner audiences will be better represented in Video Metrix. This is due to improvements made by YouTube in tagging of YouTube
partner traffic. comScore did not make any changes to its processes.

Total Streams
983,196
2,322,718
Dec-14 Jan-15 Feb-15 Mar-15 Apr-15 May-15 Jun-15 Jul-15 Aug-15 Sep-15 Oct-15 Nov-15 Dec-15
Google Sites
Yahoo Sites
Prodege
Itibiti Network
Microsoft Sites
VEVO
Hulu
Maker Studios
Decrease / Increase
• Facebook is the nearest contender with over 9 billion monthly videos streamed.
• Other video sites are dwarfed by Google’s and Facebook’s monthly streams.
• Prodege spiked in Nov. and Dec. largely due to contributor SWAGBUCKS.COM
Google Maintains #1 Position
in Number of Videos Streamed
% Change YoY
23%
-21%
136%
3877%
-55%
36%
35%
11%
N/A
4%
-5%
Top 10 Video Sites by Monthly Videos Streamed (000)Dec. 2014 - Dec. 2015
ComScore VideoMetrix Jun. ‘14 – Jun.’15, Total Audience, Home and Work. Doesn’t include mobile.
IAB Digital Usage Trend Report Full Year 2015
Social Media’s decline in Dec. 2015 reflects Facebook’s decline related to the LiveRail platform being dismantled from Facebook.With September 2015 data onward, YouTube partner audiences will be better represented in Video Metrix. This is due to improvements made by YouTube in tagging of YouTube
partner traffic. comScore did not make any changes to its processes.

18,14820,147
13,714
3,671
11,033
5,386
Dec-14 Jan-15 Feb-15 Mar-15 Apr-15 May-15 Jun-15 Jul-15 Aug-15 Sep-15 Oct-15 Nov-15 Dec-15
Google Sites
Netflix Inc.
Yahoo Sites
Hulu
Prodege
VEVO
Microsoft Sites
ComcastNBCUniversal
Turner Digital
Total Unique Streamers
Decrease / Increase
• Facebook rivals Netflix in time spent streaming video
• Most top video sites grew in time spent on videos by double or triple digits
• Prodege spiked in Nov. and Dec. largely due to contributor Swagbucks.com
Google Remains #1 in Time Spent StreamingUsers Watch 3X Longer on YouTube Than on Closest Competitors
% Change YoY
-8%
22%
N/A
-32%
201%
51%
6672%
31%
141%
13%
18%
Top 10 Video Sites by Total Minutes Spent Streaming Videos Monthly (MM)Dec. 2014 - Dec. 2015
ComScore VideoMetrix Dec. ‘14 – Dec.’15, Total Audience, Home and Work. Doesn’t include mobile.
IAB Digital Usage Trend Report Full Year 2015
Social Media’s decline in Dec. 2015 reflects Facebook’s decline related to the LiveRail platform being dismantled from Facebook.With September 2015 data onward, YouTube partner audiences will be better represented in Video Metrix. This is due to improvements made by YouTube in tagging of YouTube partner
traffic. comScore did not make any changes to its processes.

64,141
55,116
27,383
18,41217,14715,94315,93215,65015,38212,68312,43211,07510,8149,832 8,697 8,637 8,283 8,243 8,101 8,065 7,987 7,976 6,967 6,147 5,666 5,409
12%
-14%
0%23%
44% 38%
-2%
5%
88% 89%
-15%-1% -6%
-65%
31%
-4%
18%
-67%
30%
-12%
Video Sites Most Visited by Adults 18-34by Unique Video Streamers and Change from Last Year
% Change in Monthly Video Streamers by A18-34 Dec. 2014 – Dec. 2015
ComScore VideoMetrix Dec. ‘14 – Dec. ’15, Total Audience, Home and Work. Doesn’t include mobile.
IAB Digital Usage Trend Report Full Year 2015
Growthfrom a year ago
Decline
Top Sites for A18-34by Video Streamers (000) Dec. 2015
2872%
N/A
Facebook’s decline in Dec. 2015 is related to the LiveRail platform being dismantled from Facebook.
With September 2015 data onward, YouTube partner audiences will be better represented in Video Metrix. This is due to improvements made by YouTube in tagging of YouTube
partner traffic. comScore did not make any changes to its processes.
N/A N/AN/A N/A
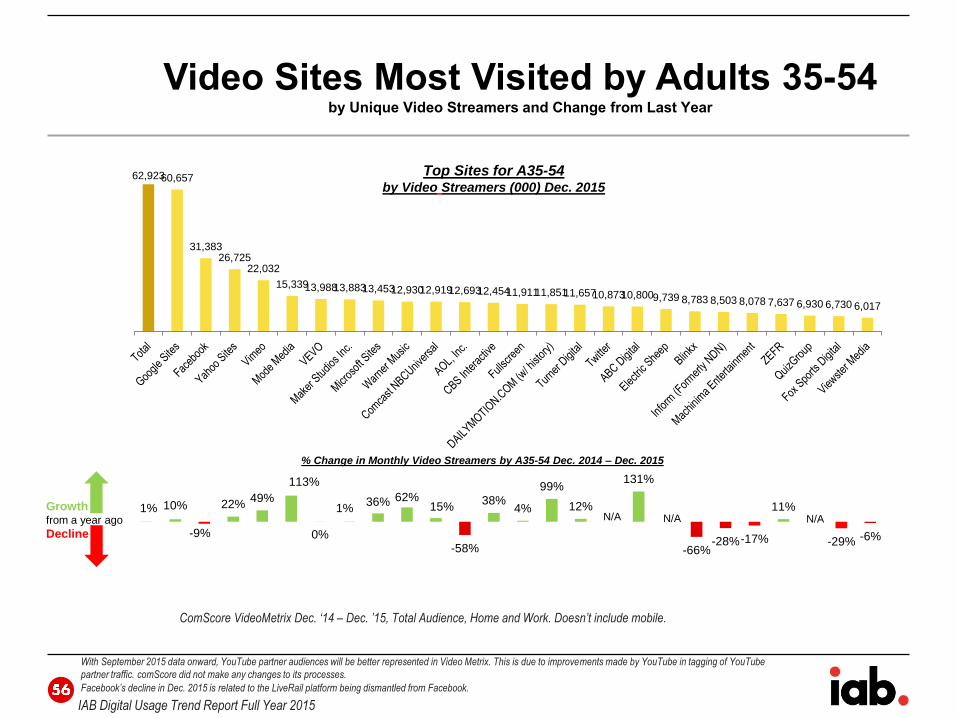
1% 10%
-9%
22%49%
113%
0%
1%36% 62%
15%
-58%
38%4%
99%
12%
131%
-66%-28%-17%
11%
-29% -6%
62,92360,657
31,38326,725
22,032
15,33913,98813,88313,45312,93012,91912,69312,45411,91111,85111,65710,87310,8009,739 8,783 8,503 8,078 7,637 6,930 6,730 6,017
Video Sites Most Visited by Adults 35-54by Unique Video Streamers and Change from Last Year
Top Sites for A35-54by Video Streamers (000) Dec. 2015
% Change in Monthly Video Streamers by A35-54 Dec. 2014 – Dec. 2015
Growthfrom a year ago
Decline
ComScore VideoMetrix Dec. ‘14 – Dec. ’15, Total Audience, Home and Work. Doesn’t include mobile.
IAB Digital Usage Trend Report Full Year 2015
Facebook’s decline in Dec. 2015 is related to the LiveRail platform being dismantled from Facebook.
With September 2015 data onward, YouTube partner audiences will be better represented in Video Metrix. This is due to improvements made by YouTube in tagging of YouTube
partner traffic. comScore did not make any changes to its processes.
N/A N/A N/A

50,605
45,571
25,12522,192
17,35414,29413,87713,28612,36912,167
10,54910,1789,374 8,295 7,302 7,072 6,725 6,636 6,248 6,097 6,053 5,561 5,167 5,163 5,163 5,142
6% 14%4%
23%49% 43% 45%
-57%
69%
136%169%
-22%
22%
-4%
80%106%
2%30%
160%
Video Sites Most Visited by Adults 55+by Unique Video Streamers and Change from Last Year
% Change in Monthly Video Streamers by A55+ Dec. 2014 – Dec. 2015
Growthfrom a year ago
Decline
Top Sites for A55+by Video Streamers (000) Dec. 2015
789%
ComScore VideoMetrix Dec. ‘14 – Dec. ’15, Total Audience, Home and Work. Doesn’t include mobile.
IAB Digital Usage Trend Report Full Year 2015
Facebook’s decline in Dec. 2015 is related to the LiveRail platform being dismantled from Facebook.
With September 2015 data onward, YouTube partner audiences will be better represented in Video Metrix. This is due to improvements made by YouTube in tagging of YouTube
partner traffic. comScore did not make any changes to its processes.
N/A N/A N/AN/A

Summary• Overall Growth in Internet Use:
• Overall, the total unduplicated US internet audience continues to grow, up 3% over 2015 to 260
million visitors accessing the internet from any computer or device monthly.
• Top 5 sites in unduplicated unique visitors across all devices in Dec. are Google, Facebook, Yahoo,
Amazon, Microsoft. Most top sites saw growth over the year.
• Top 5 sites in time spent across all devices are Facebook, Google, Pandora, Apple, Yahoo.
• Shift to Mobile:
• As smartphones and tablets proliferate, along with the numerous sites and apps that can be visited
using them, mobile’s share of internet views and time spent continues to grow.
• Most sites, pages, apps and videos are still viewed using a computer, although these internet views
are gradually shifting to mobile.
• Two-thirds of online time is spent using a mobile device, one-third using a computer.
• Younger adults are likely to spend more time online with their smartphones: 18-34 year olds spend
two-thirds of their online time on a smartphone, 35-54 year olds spend nearly half (54%) of their
internet time on a smartphone while those 55 and over spend nearly half (46%) of their internet time
on a computer.
• Mobile and Computers Serve Different Purposes:
• Radio and IM are almost exclusively accessed via mobile, while portals and email are more often
accessed via computer.
IAB Digital Usage Trend Report Full Year 2015

Summary
• Mobile: Apps vs. Web, Smartphone vs. Tablet:
• More time is spent on mobile apps (86%) than on mobile web (14%).
• More time is spent on smartphones (83%) than on tablets (17%).
• Monthly visitors to top 10 mobile sites have grown by double-digits over the year.
• Top sites differ between apps and mobile web, especially by time spent. • Top mobile apps by time spent: Facebook, Pandora, Google, Apple, Spotify
• Top mobile web sites by time spent: Facebook, Google, Yahoo, Amazon, Microsoft
• Computer-Based Internet Use:
• The number of users accessing the internet using a computer is steady but pageviews and time
spent have declined as usage shifts to mobile.
• Shift to mobile largely driven by younger users. 35-54 year olds are still largest computer-using
group (up 3% from a year ago). More (7%) adults 55 and older are accessing the internet via
computer.
• As of Dec. 2015, Adults 55 and older have reached parity with 18-34 year olds in terms of internet
time spent on computer.
• Streaming Video Across Age Groups:
• In Dec. 2015, 197 million Americans streamed videos on their computer (up 1% from a year ago),
watching 58.7 billion videos (down 5%) and spending 220 billion minutes (down 8%).
• More Adults 18 and older are streaming videos using a computer, especially 55 and older (up 6%)
while fewer children under 18 are doing so (down 9%), as they shift to mobile video. 35-54 year
olds still make up the largest demo of computer-based video streamers.
IAB Digital Usage Trend Report Full Year 2015

Summary• Streaming Video Across Age Groups:
• Time spent streaming on a computer is down by 8% across all age groups over the year except for
adults 55 and older who’s streaming time is up by 2%.
• Number of videos streamed on a computer has dropped (by 5%) for all but adults 55 and older (up
12%) compared to a year ago. Adults 55 and older now stream as many videos per month as
adults 18-34.
• Top Video Sites Accessed by Computer:
• Although the number of people streaming video on a computer is flat compared to same time last
year, most top 10 video properties have gained visitors by double-digits over 2015.
• Among top 10 most streamed video properties, Facebook is down (by 21%) due to the Liverail
platform being dismantled. Otherwise, most top 10 sites have shown strong growth in videos
streamed over the year.
• Entertainment (up 11%) and social media (down 26%) far surpass any other category of videos
streamed and many top video categories have seen double-digit growth in streams.
• Time spent streaming videos has dropped by 8%. Facebook is down 32%. Otherwise, most top 10
sites have grown in time spent streaming via computer.
• As of Dec. 2015, Google/YouTube remains #1 across all video measures:• Google has more than twice as many monthly video streamers (180M) as its #2 rival Facebook (88M) or #3
Yahoo (70M)
• While the number of videos streamed on Facebook has approached that of Google throughout 2015,
Facebook ended the year lower at 9B streams vs. Google’s 15B. Yahoo was a distant #3 at 2B.
• Users spend three times longer watching videos on YouTube (60M) than on closest competitors Netflix (18M)
or Facebook (14M).
IAB Digital Usage Trend Report Full Year 2015

Full Year 2015 Report
Digital, Video and Mobile Consumer Usage Trends
IAB Digital Usage Trend Report
Kristina Sruoginis, Research Director, IAB