IAB Internet Advertising Revenue Report · 2018-05-10 · IAB Full Year 2017 and Q4 2017 Internet...
22
IAB Internet Advertising Revenue Report Full Year 2017 and Q4 2017 May 10, 2018
Transcript of IAB Internet Advertising Revenue Report · 2018-05-10 · IAB Full Year 2017 and Q4 2017 Internet...

IAB Internet Advertising Revenue ReportFull Year 2017 and Q4 2017
May 10, 2018

IAB Full Year 2017 and Q4 2017 Internet Advertising Revenue Report
IAB Internet Ad Revenue Report: Full Year 2017 and Q4 2017Agenda
WelcomeKristina Sruoginis, Research Director, IAB
Full Year 2017 and Q4 2017 Digital Ad Revenue HighlightsAnna Bager, EVP Industry Initiatives, IAB
Kristina Sruoginis, Research Director, IAB
Detailed Analysis of IAB PwC Full Year 2017 and Q4 2017 ReportDavid Silverman, Partner, PwC
Guest PresentationBrian Wieser, CFA, Senior Analyst, Pivotal Research
Q & A
IAB Full Year 2017 and Q4 2017 Internet Advertising Revenue Report
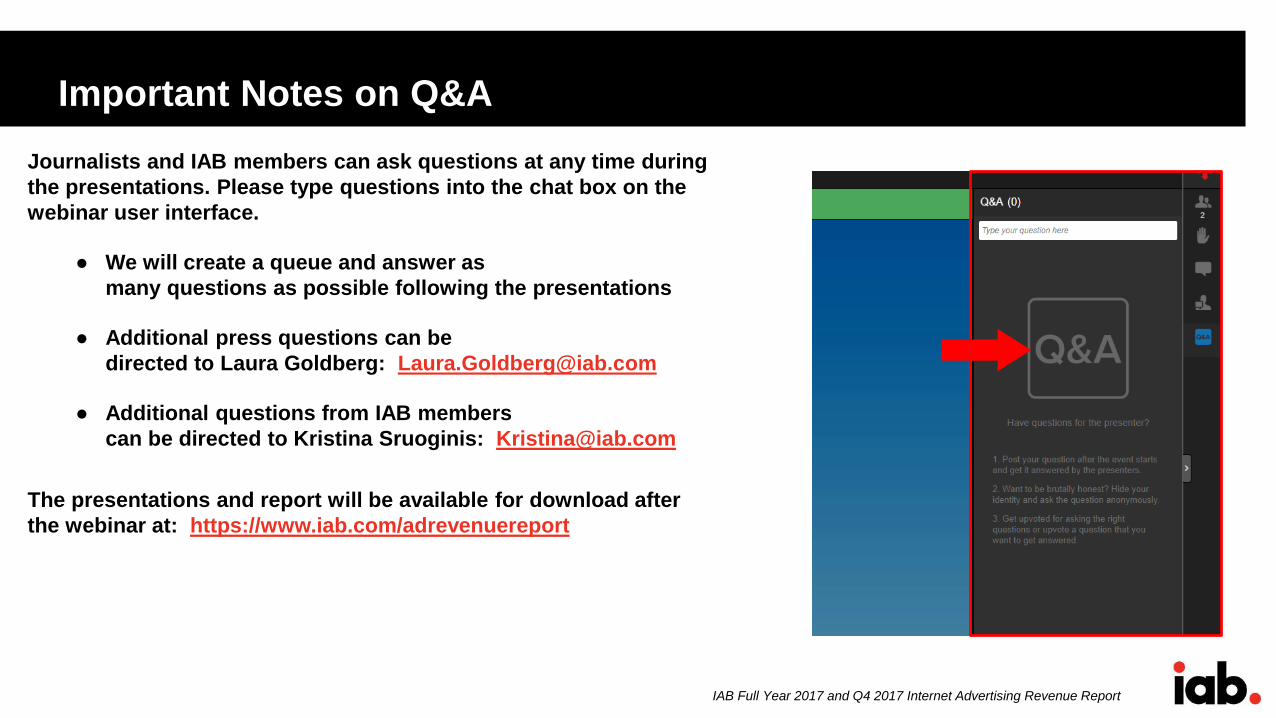
Important Notes on Q&A
Journalists and IAB members can ask questions at any time during
the presentations. Please type questions into the chat box on the
webinar user interface.
● We will create a queue and answer as
many questions as possible following the presentations
● Additional press questions can be
directed to Laura Goldberg: [email protected]
● Additional questions from IAB members
can be directed to Kristina Sruoginis: [email protected]
The presentations and report will be available for download after
the webinar at: https://www.iab.com/adrevenuereport

IAB Full Year 2017 and Q4 2017 Internet Advertising Revenue Report
IAB Internet Advertising Revenue Report Highlights
Full Year 2017 and Q4 2017
Anna Bager, EVP Industry Initiatives, IAB

IAB Full Year 2017 and Q4 2017 Internet Advertising Revenue Report
2017 Year-Over-Year Digital Ad Revenue Growth
$ B
illio
ns
*The Nielsen Company, MonitorPlus (Standard Calendar, Total includes B2B, National Internet (Display only), FSI
Coupons), Apr. 2018
Total Media Ad
Revenue Growth
(FY 2016 vs. FY 2017)
The Nielsen Company
estimates total media
revenues for FY 2017
decreased -3% from
FY 2016
$72.5
$88.0
$0
$10
$20
$30
$40
$50
$60
$70
$80
$90
$100
FY 2016 FY 2017
Digital Ad Revenue Growth (FY 2016 vs. FY 2017)
21%
21%Growth
IAB Full Year 2017 and Q4 2017 Internet Advertising Revenue Report
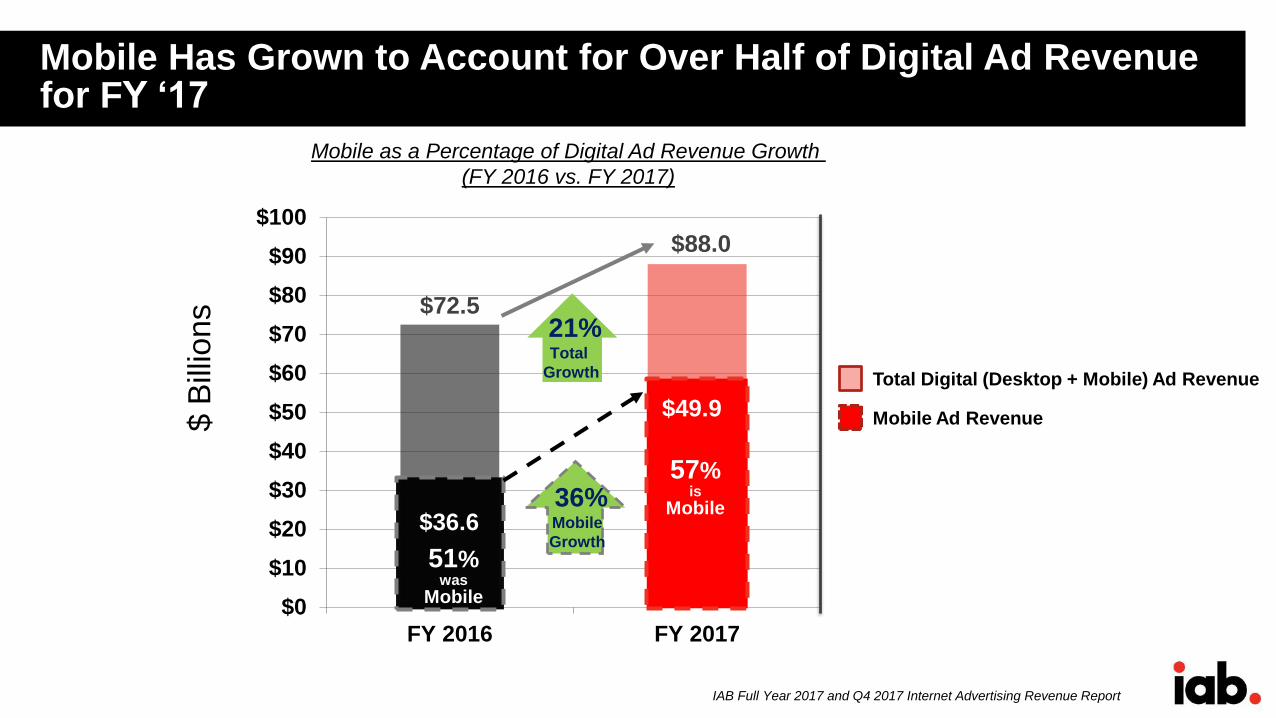
Mobile Has Grown to Account for Over Half of Digital Ad Revenue for FY ‘17
$ B
illio
ns $72.5
$88.0
$0
$10
$20
$30
$40
$50
$60
$70
$80
$90
$100
FY 2016 FY 2017
Mobile as a Percentage of Digital Ad Revenue Growth
(FY 2016 vs. FY 2017)
21%
57%is
Mobile
51%was
Mobile
$49.9
$36.6
Total Digital (Desktop + Mobile) Ad Revenue
Mobile Ad Revenue
21%Total
Growth
36%Mobile
Growth

IAB Full Year 2017 and Q4 2017 Internet Advertising Revenue Report
Full Year 2017 Ad Revenue: Digital vs. Traditional Media
Full Year 2017 Ad Revenue ($ Billions)Percent
YoY Change
21%
-3%
-1%
1%
-7%
4%
Source: PWC
$9.6
$17.0
$17.6
$20.9
$70.1
$88.0
OOH
Newspaper
Radio
Magazines
TV
Digital
2017
% Change in Ad Revenue from Full Year 2016 to. Full Year 2017

IAB Full Year 2017 and Q4 2017 Internet Advertising Revenue Report
Q4 Highlights and CPM Trends
IAB Internet Advertising Revenue Report
Q4 2017
Anna Bager, EVP Industry Initiatives, IAB

IAB Full Year 2017 and Q4 2017 Internet Advertising Revenue Report
Q4 2017 Revenue Compared to Q4 2016
$ B
illio
ns
Total Media Ad Revenue
Change
(Q4 2016 vs. Q4 2017)
According to Nielsen,
total media revenues
increased 2% from Q4 2016 to Q4 2017
$21.6
$26.1
$0
$5
$10
$15
$20
$25
$30
Q4 2016 Q4 2017
Digital Ad Revenue Growth (Q4 2016 vs. Q4 2017)
21%
*The Nielsen Company, MonitorPlus (Standard Calendar, Total includes B2B, National Internet (Display only),
FSI Coupons, Cinema, Out of Home), Nov. 2017
IAB Full Year 2017 and Q4 2017 Internet Advertising Revenue Report
$0.00
$5.00
$10.00
$15.00
$20.00
$25.00
$30.00
January February March April May June July August September October November December
2016 Display 2017 Display 2016 In-Stream 2017 In-Stream
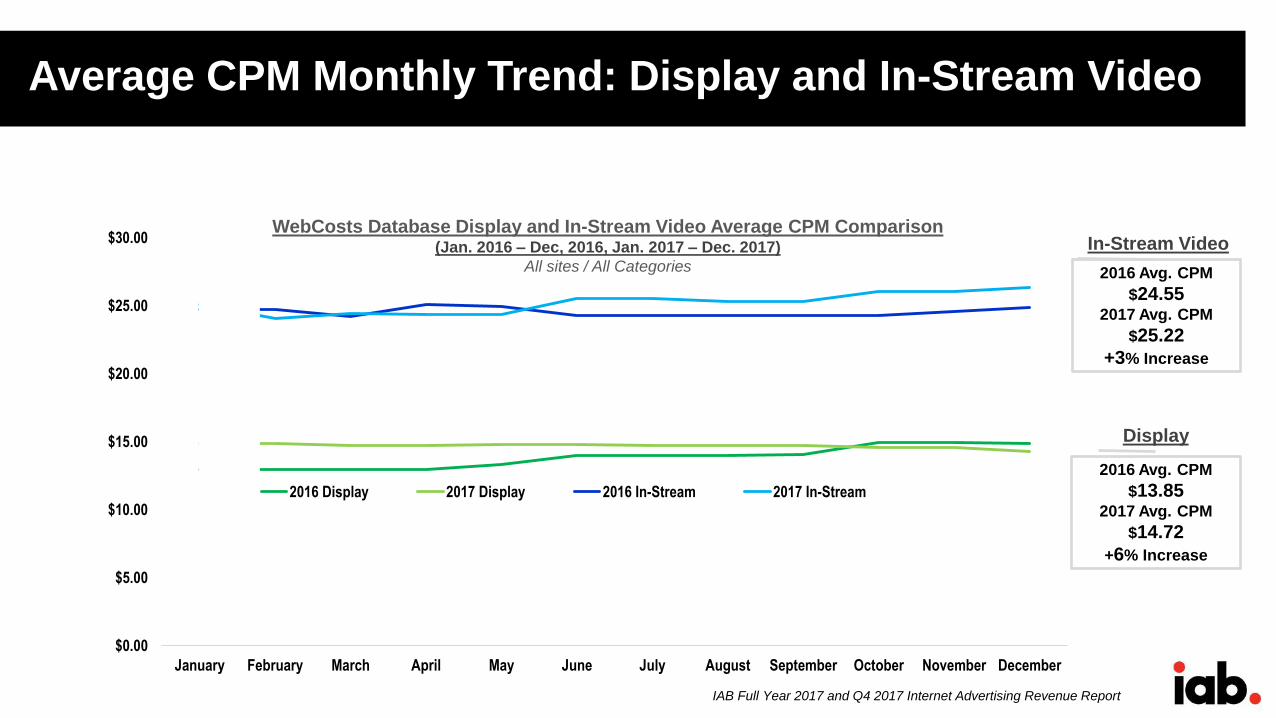
Average CPM Monthly Trend: Display and In-Stream Video
WebCosts Database Display and In-Stream Video Average CPM Comparison (Jan. 2016 – Dec, 2016, Jan. 2017 – Dec. 2017)
All sites / All Categories 2016 Avg. CPM
$24.552017 Avg. CPM
$25.22
+3% Increase
In-Stream Video
Display
2016 Avg. CPM
$13.852017 Avg. CPM
$14.72
+6% Increase

IAB Full Year 2017 and Q4 2017 Internet Advertising Revenue Report
Average CPM Monthly Trend Across Eight Display Categories
Note: Category titles refer to Nielsen dictionary. Corporate information includes primarily ad networks.Source: WebCosts Database, SQAD.com
Eight Category Average Display CPM Monthly Trend Average CPMs of All Sites in Category for Reported Month (Jan. 2017 – Dec. 2017)
SQAD Copyright(c) 2009-2016 SQAD LLC - All Rights Reserved
Eight
Category
Average
$0.00
$5.00
$10.00
$15.00
$20.00
$25.00
$30.00
Jan Feb Mar Apr May Jun Jul Aug Sep Oct Nov Dec
Finance/Insurance/Investment
Home and Fashion Entertainment Family & Lifestyles
Automotive
Search Engines / Portals & Communities
Corporate Information
News & Information

IAB Full Year 2017 and Q4 2017 Internet Advertising Revenue Report
IAB Internet Advertising Revenue Report Formats
Full Year 2017
Kristina Sruoginis, Research Director, IAB

IAB Full Year 2017 and Q4 2017 Internet Advertising Revenue Report
2%
14%
46%
All Formats Grow from a Year Ago
Search: Total search ad revenue (mobile + desktop) is up 18% to $40.6 billion
Banner*: Total banner advertising (mobile + desktop) is up 23% to $27.5 billion
Video: Total video ad revenue (mobile + desktop) is up 33% to $11.9 billion
Audio: Total audio ad revenue (mobile + desktop) is up 39% to $1.6 billion
*Includes banners, rich media and sponsorships.
% of Total Digital Ad Revenue
31%

IAB Full Year 2017 and Q4 2017 Internet Advertising Revenue Report
Mobile Advertising Revenue Growth: Full Year 2017 Mobile Revenue $50 Billion
$1.2 $3.0$5.3
$8.2
$15.5
$21.7
$3.4
$7.1
$12.4
FY'12 FY '13 FY '14 FY '15 FY'16 FY'17
1st Half Year 2nd Half Year
US Mobile Ad Revenue ($ Billions)Full Year, Half Year and % YoY Growth
14
$2.1
$4.0
$20.7
$7.1
$12.5
Note: Full Year totals accurately reflect the sum of Half Year totals as rounded to two decimal places.
$36.6
$21.1
Growth
FY: 110%
1HY: 145%
Growth
FY: 66%
1HY: 54%
Growth
FY: 76%
1HY: 75%
Growth
FY: 77%
1HY: 89%
$ B
illio
ns
Growth
FY: 36%
1HY: 40%
$28.2
$49.9

IAB Full Year 2017 and Q4 2017 Internet Advertising Revenue Report
2016
49%
Shift to Mobile: Mobile Accounts for an Increasingly Large Portion of Each Digital Format
Search:
Banner*:
Video:
Audio:
*Includes banners, rich media and sponsorships.
61%
45%
79%
54%
2017
67%
52%
77%
% of Format’s Revenue
that is from Mobile
% of Format’s Revenue
that is from Desktop
Shift toMobileMobile Mobile
51%Desktop
46%Desktop
Mobile Mobile
MobileMobile
Mobile Mobile
IAB Full Year 2017 and Q4 2017 Internet Advertising Revenue Report
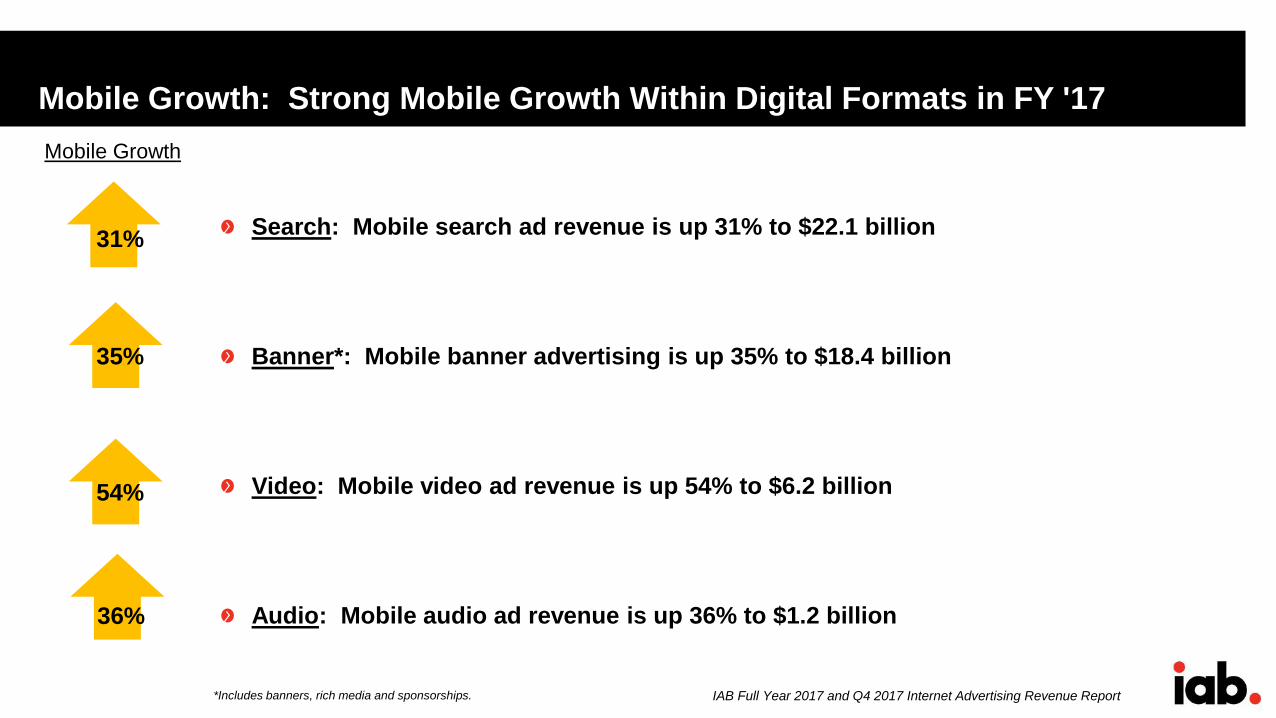
Mobile Growth: Strong Mobile Growth Within Digital Formats in FY '17
Search: Mobile search ad revenue is up 31% to $22.1 billion
Banner*: Mobile banner advertising is up 35% to $18.4 billion
Video: Mobile video ad revenue is up 54% to $6.2 billion
Audio: Mobile audio ad revenue is up 36% to $1.2 billion
*Includes banners, rich media and sponsorships.
31%
35%
54%
36%
Mobile Growth
IAB Full Year 2017 and Q4 2017 Internet Advertising Revenue Report
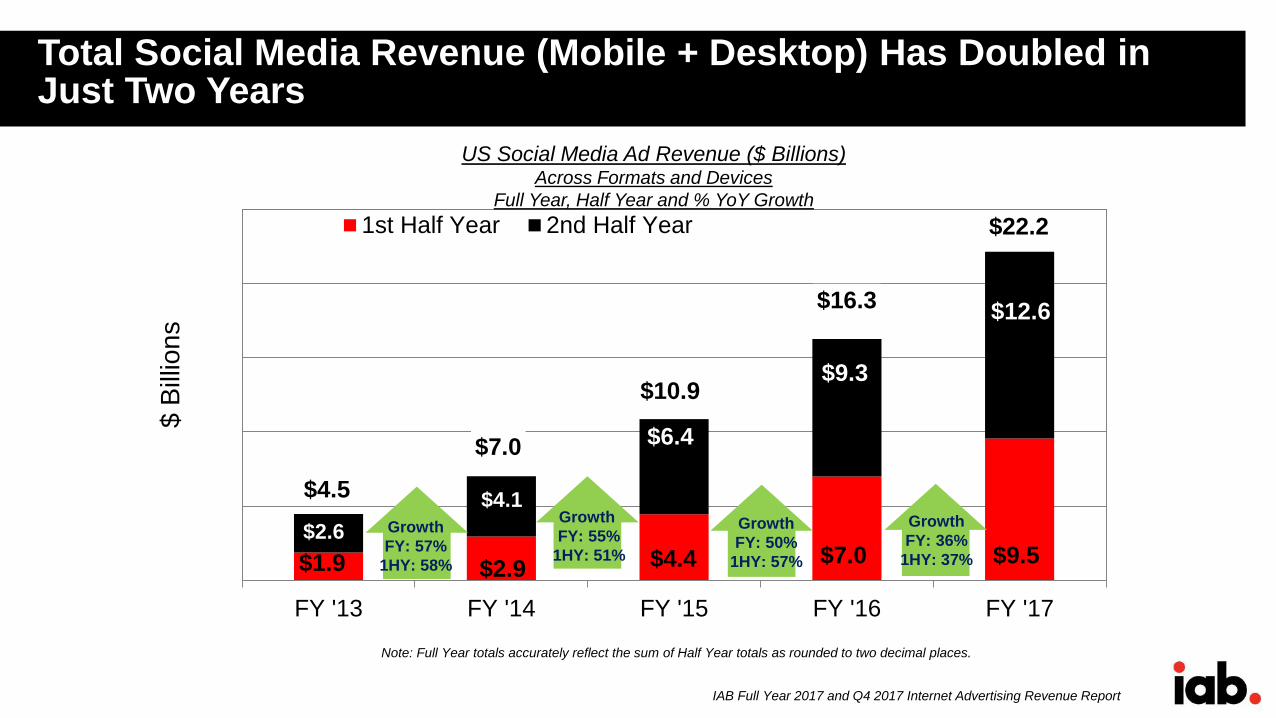
Total Social Media Revenue (Mobile + Desktop) Has Doubled in Just Two Years
$4.5
$7.0
$10.9
$16.3
FY '13 FY '14 FY '15 FY '16 FY '17
1st Half Year 2nd Half Year
$4.4
$6.4
$7.0
$9.3
$9.5
$12.6
$22.2
US Social Media Ad Revenue ($ Billions)Across Formats and Devices
Full Year, Half Year and % YoY Growth
17
$2.6
$2.9
$4.1
$1.9
Note: Full Year totals accurately reflect the sum of Half Year totals as rounded to two decimal places.
Growth
FY: 57%
1HY: 58%
Growth
FY: 55%
1HY: 51%
Growth
FY: 36%
1HY: 37%
Growth
FY: 50%
1HY: 57%
$ B
illio
ns
IAB Full Year 2017 and Q4 2017 Internet Advertising Revenue Report
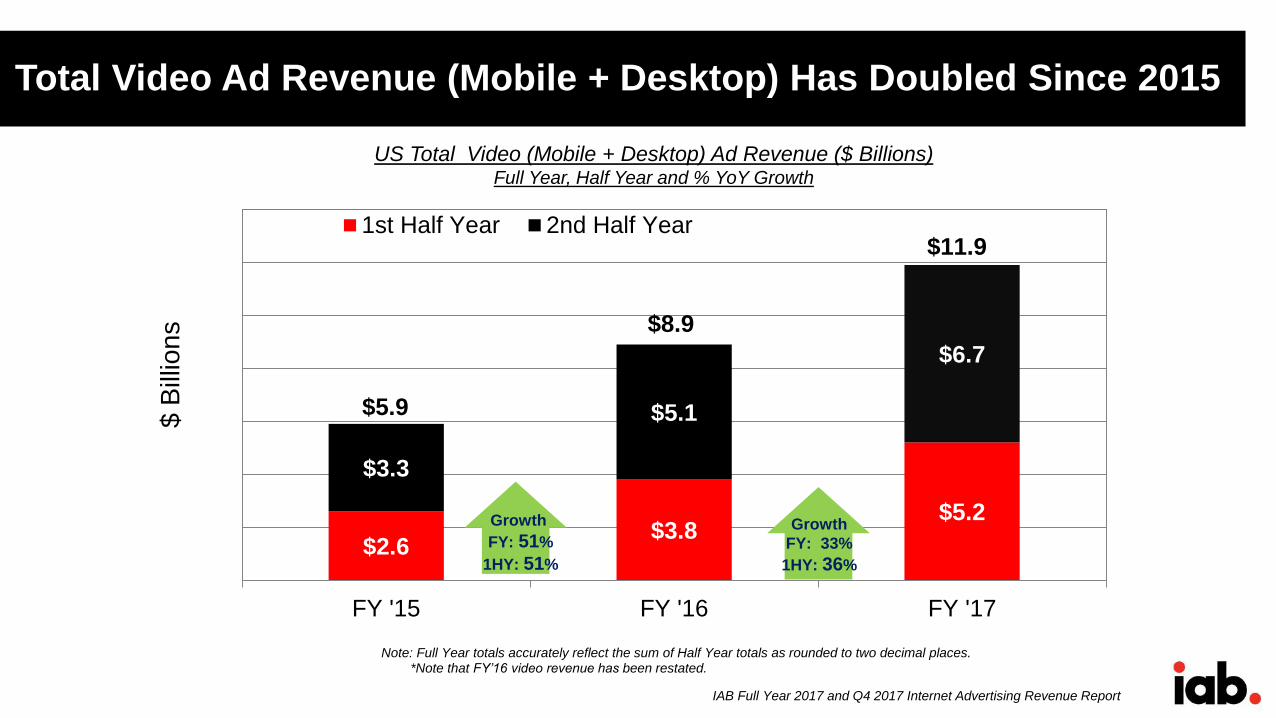
Total Video Ad Revenue (Mobile + Desktop) Has Doubled Since 2015
$2.6 $3.8
$5.2
$3.3
$5.1
$6.7
FY '15 FY '16 FY '17
1st Half Year 2nd Half Year
$8.9
$6.4$5.9
$11.9
US Total Video (Mobile + Desktop) Ad Revenue ($ Billions)Full Year, Half Year and % YoY Growth
18
Note: Full Year totals accurately reflect the sum of Half Year totals as rounded to two decimal places.
Growth
FY: 51%
1HY: 51%
Growth
FY: 33%
1HY: 36%
$ B
illio
ns
*Note that FY’16 video revenue has been restated.
IAB Full Year 2017 and Q4 2017 Internet Advertising Revenue Report
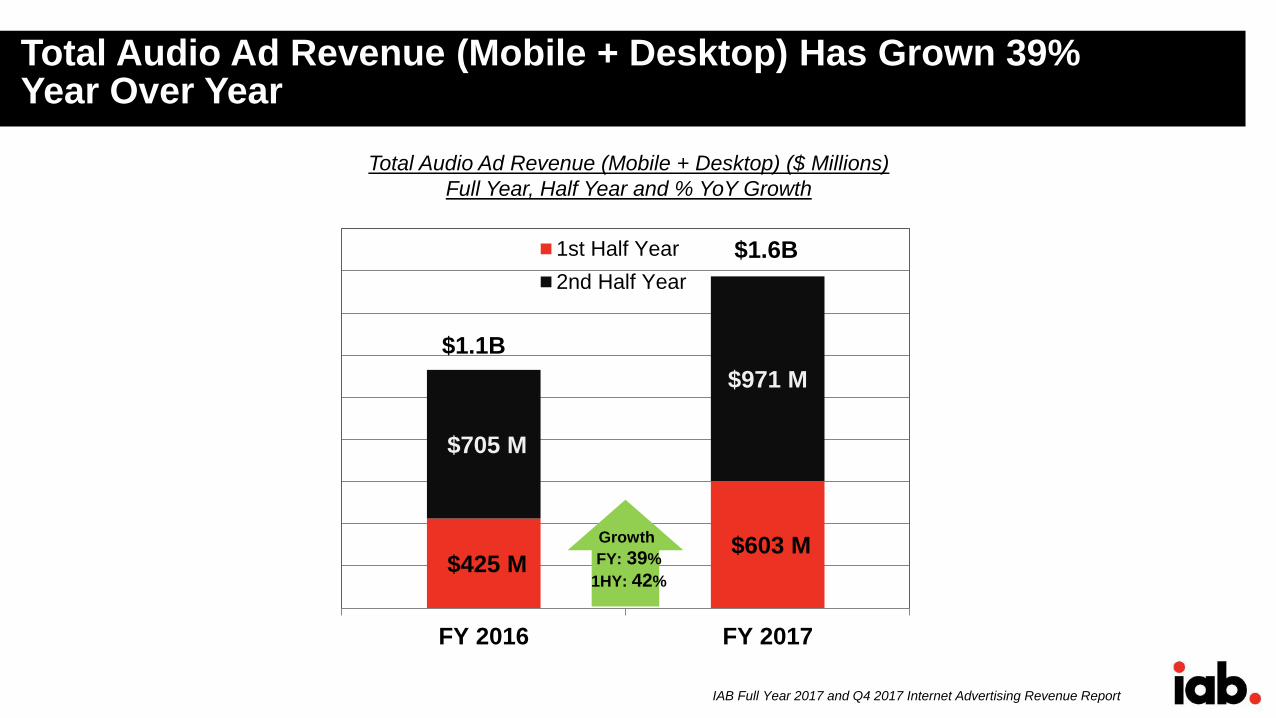
Total Audio Ad Revenue (Mobile + Desktop) Has Grown 39% Year Over Year
Total Audio Ad Revenue (Mobile + Desktop) ($ Millions)
Full Year, Half Year and % YoY Growth
$425 M$603 M
$705 M
$971 M
FY 2016 FY 2017
1st Half Year
2nd Half Year
$1.1B
$1.6B
Growth
FY: 39%
1HY: 42%
IAB Full Year 2017 and Q4 2017 Internet Advertising Revenue Report
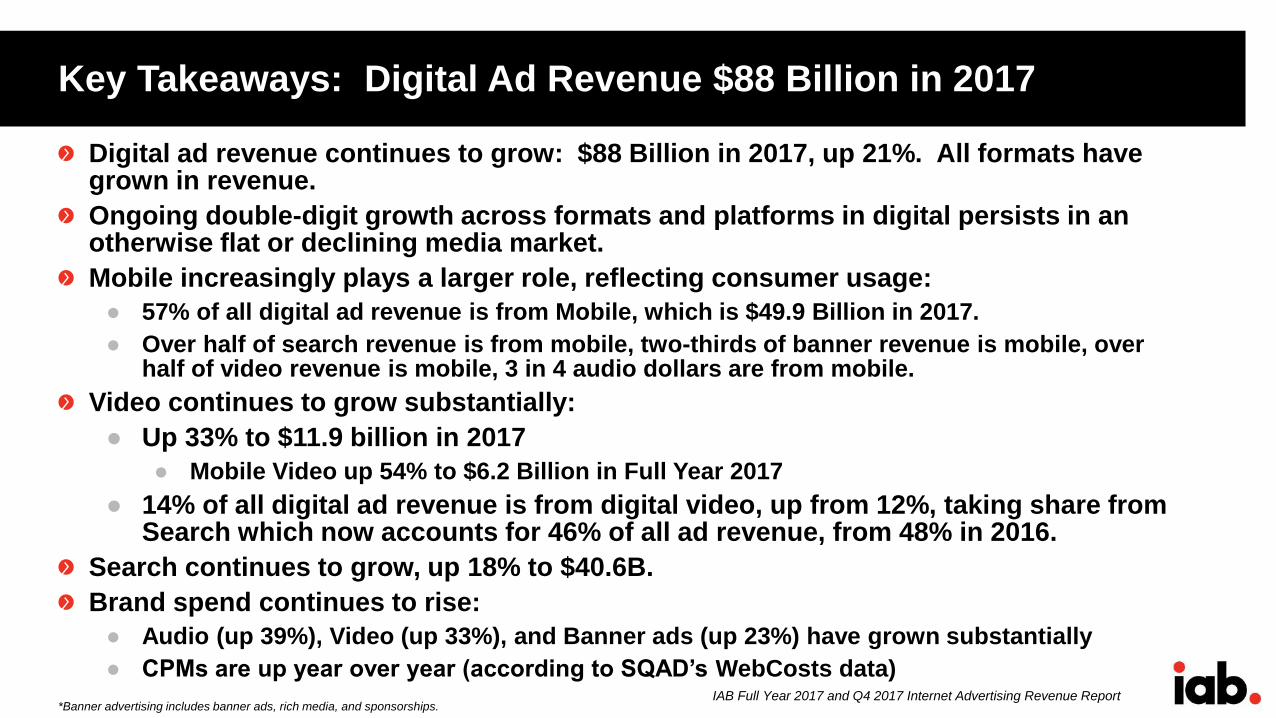
Key Takeaways: Digital Ad Revenue $88 Billion in 2017
*Banner advertising includes banner ads, rich media, and sponsorships.
Digital ad revenue continues to grow: $88 Billion in 2017, up 21%. All formats have grown in revenue.
Ongoing double-digit growth across formats and platforms in digital persists in an otherwise flat or declining media market.
Mobile increasingly plays a larger role, reflecting consumer usage:
● 57% of all digital ad revenue is from Mobile, which is $49.9 Billion in 2017.
● Over half of search revenue is from mobile, two-thirds of banner revenue is mobile, over half of video revenue is mobile, 3 in 4 audio dollars are from mobile.
Video continues to grow substantially:
● Up 33% to $11.9 billion in 2017
● Mobile Video up 54% to $6.2 Billion in Full Year 2017
● 14% of all digital ad revenue is from digital video, up from 12%, taking share from Search which now accounts for 46% of all ad revenue, from 48% in 2016.
Search continues to grow, up 18% to $40.6B.
Brand spend continues to rise:
● Audio (up 39%), Video (up 33%), and Banner ads (up 23%) have grown substantially
● CPMs are up year over year (according to SQAD’s WebCosts data)

IAB Full Year 2017 and Q4 2017 Internet Advertising Revenue Report
Questions?
Journalists and IAB members can ask questions at any time during
the presentations
Please type questions into the chat box on the WebEx user
interface
● Additional press questions can be
directed to Laura Goldberg: [email protected]
● Additional questions from IAB members
can be directed to Kristina Sruoginis: [email protected]
The presentations and report will be available for download after the
webinar at: https://www.iab.com/adrevenuereport

THANK YOU
Reports (from 1996 to present) can be found at: https://www.iab.com/adrevenuereport