IAB’s Internet Advertising Revenue Report - iab.com · PDF filePwC | IAB internet...
27
www.iab.com www.pwc.com/e&m IAB internet advertising revenue report 2017 first six months results An industry survey conducted by PwC and sponsored by Interactive Advertising Bureau (IAB) December 2017
Transcript of IAB’s Internet Advertising Revenue Report - iab.com · PDF filePwC | IAB internet...
www.iab.comwww.pwc.com/e&m
IAB internet advertisingrevenue report2017 first six months resultsAn industry survey conducted by PwC and sponsored byInteractive Advertising Bureau (IAB)
December 2017
Any trademarks included are trademarks of their respective owners and are notaffiliated with, nor endorsed by, PricewaterhouseCoopers LLP, its subsidiaries oraffiliates
PwC | IAB internet advertising revenue report
Table of contents
Background ...................................................................................................... 1
Executive summary ..........................................................................................2
Year-to-date revenues continue to show strong growth .................................3
Detailed findings ..............................................................................................4
Shift from desktop to mobile expands ..............................................................5
Continued historical quarterly revenue trends................................................6
Historical revenue mix – first half vs. second half........................................... 7
Revenue concentration.....................................................................................8
Ad format – second quarter 2017 results.........................................................9
Ad format – half year 2017 results................................................................. 10
Historical Trends: Desktop vs. Mobile............................................................11
Shifts occurred across the Search and Digtial Video formats ....................... 12
Digital Video – Mobile catches up to desktop ................................................ 13
Social media advertising revenue .................................................................. 14
Digital audio - on track to exceed last year’s full-year revenue of $1.1B....... 15
Revenues by pricing model ............................................................................ 16
PwC | IAB internet advertising revenue report 1
Background
About the IAB internet advertisingrevenue report
Conducted by PwC Advisory Services LLC (“PwC”) on an ongoingbasis, with results released quarterly, the “IAB Internet AdvertisingRevenue Report” was initiated by the Interactive AdvertisingBureau (IAB) in 1996. This report utilizes data and informationreported directly to PwC from companies selling advertising on theinternet as well as publicly available corporate data.
The results reported are considered to be a reasonablemeasurement of internet/online/mobile advertising revenuesbecause much of the data is compiled directly from informationsupplied by companies selling advertising online. The reportincludes data reflecting desktop and mobile online advertisingrevenues from websites, commercial online services, ad networksand exchanges, mobile devices, and email providers, as well asother companies selling online advertising.
The report is conducted independently by PwC on behalfof the IAB. PwC does not audit the information andprovides no opinion or other form of assurance withrespect to the information. Only aggregate results are publishedand individual company information is heldin strict confidence with PwC. Further details regarding scope andmethodology are provided in the appendix tothis report.
David SilvermanPwC
PwC | IAB internet advertising revenue report 2
Executive summary
IAB internet advertising revenue report 2017 second quarter and firstsix months highlights
Internet advertising revenues (“revenues”) in the United States totaled $40.1 billion for the first six months of 2017,with Q1 2017 accounting for approximately $19.4 billion and Q2 2017 accounting for approximately $20.8 billion.Revenues for the first six months of 2017 increased 22.6% over the first six months of 2016.
Key trends underlying Half-Year (HY) 2017 results
Revenues increase 22.6% in HY 2017Internet advertising revenues in the United States totaled $20.8 billion in the second quarter of 2017, an increase of7.4% from the 2017 first-quarter total of $19.4 billion and an increase of 23.1% from the 2016 second-quarter totalof $16.9 billion. Year-to-date revenues through June 2017 totaled $40.1 billion, up 22.6% from the $32.7 billionreported in 2016.
The shift to mobile continuesAdvertising revenues delivered on mobile devices totaled $21.7 billion in HY 2017, a 40% increase from the priorhalf year revenues of $15.5 billion. Advertising delivered on a mobile device now make up 54% of total internetadvertising revenues.
“Being nimble and accessible are hallmarks of the newdigital economy. Now, anyone with a good idea and acredit card can capture the attention of theircustomers directly, and this in turn represents anenormous growth opportunity for both marketers andpublishers alike to help make these connections.”
— Randall Rothenberg, President and CEO, IAB
“We should no longer think of the internet as mobile vsdesktop. Advertisers are simply following consumers,who live their lives online—whether on a smartphoneduring a commute, on a desktop at work, or on atablet for entertainment in the evening. Digital is anintrinsic part of every American’s day.”
— David Silverman, Partner, PwC
PwC | IAB internet advertising revenue report 3
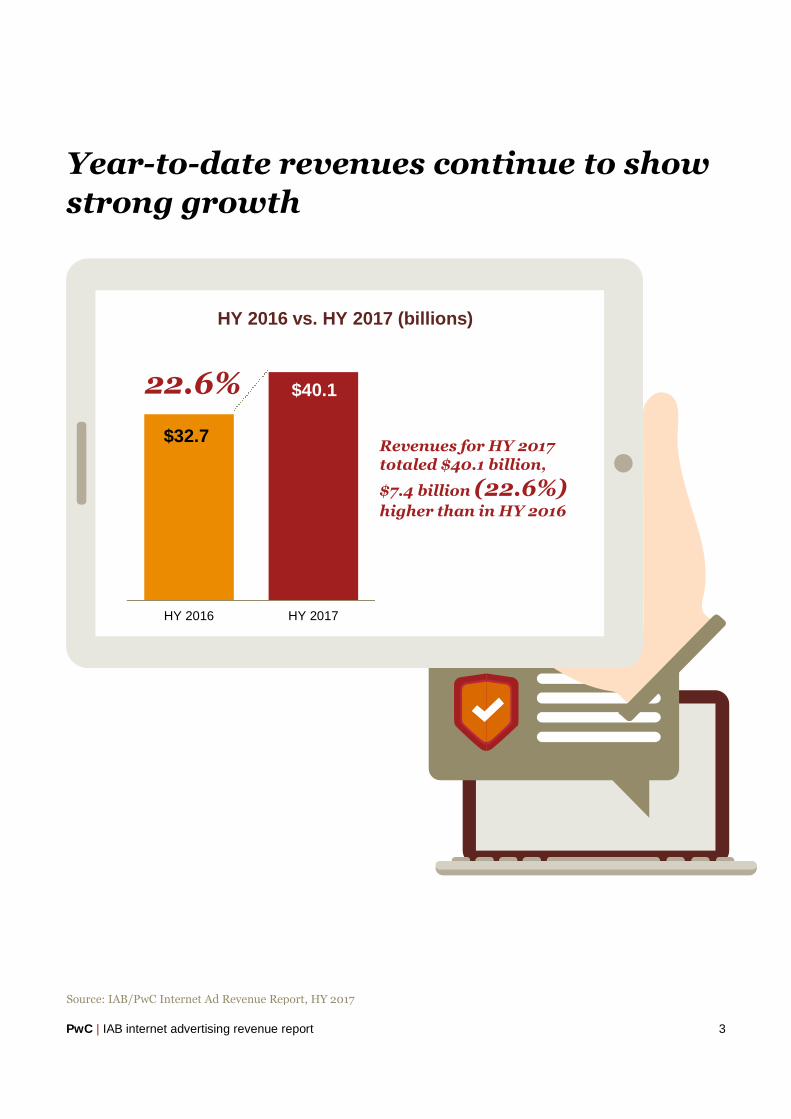
Year-to-date revenues continue to show
strong growth
HY 2016 vs. HY 2017 (billions) )
$32.7
$40.1
HY 2016 HY 2017
22.6%
Revenues for HY 2017totaled $40.1 billion,
$7.4 billion (22.6%)higher than in HY 2016
Source: IAB/PwC Internet Ad Revenue Report, HY 2017
PwC | IAB internet advertising revenue report 4
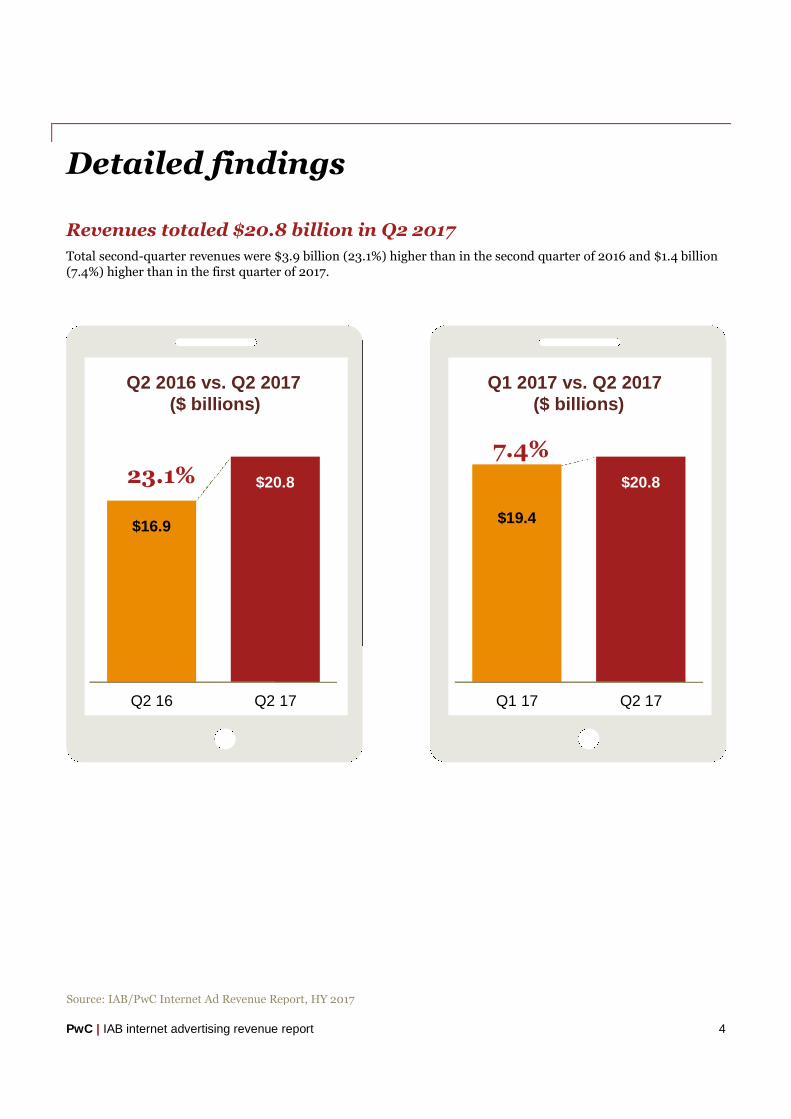
Detailed findings
Revenues totaled $20.8 billion in Q2 2017
Total second-quarter revenues were $3.9 billion (23.1%) higher than in the second quarter of 2016 and $1.4 billion(7.4%) higher than in the first quarter of 2017.
Source: IAB/PwC Internet Ad Revenue Report, HY 2017
$16.9
$20.8
Q2 16 Q2 17
23.1%
Q2 2016 vs. Q2 2017($ billions)
$19.4
$20.8
Q1 17 Q2 17
7.4%
Q1 2017 vs. Q2 2017($ billions)
PwC | IAB internet advertising revenue report 5
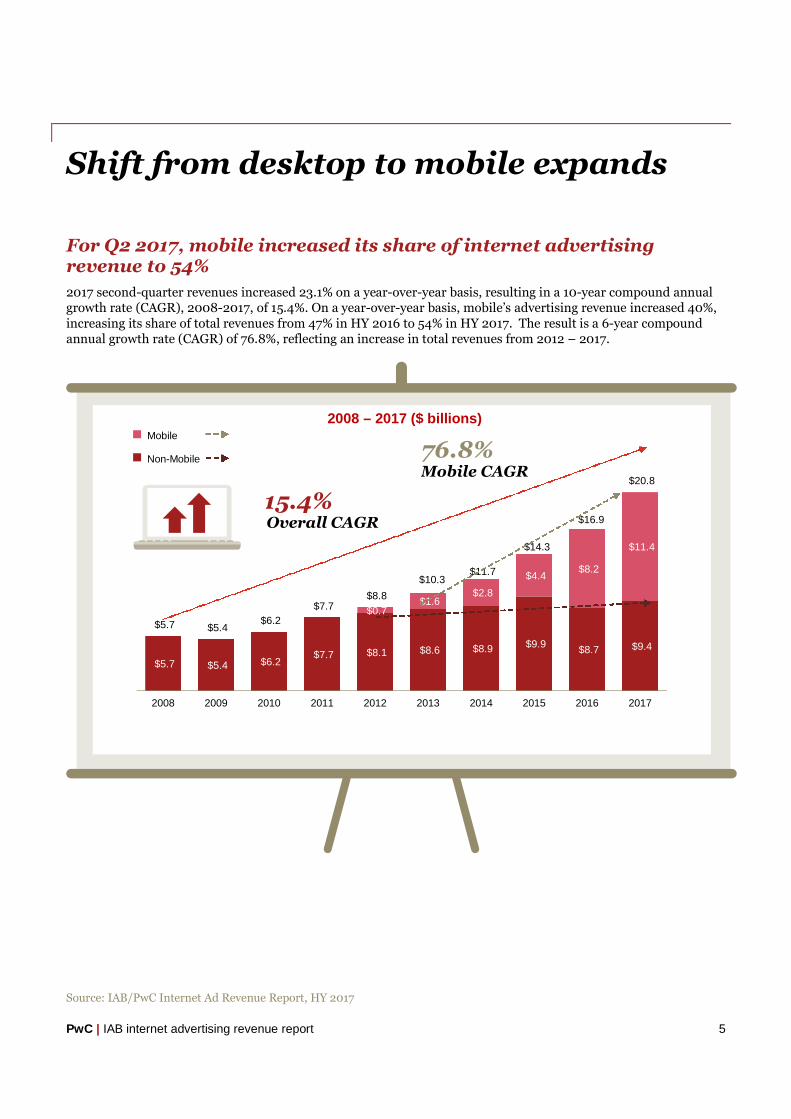
Shift from desktop to mobile expands
For Q2 2017, mobile increased its share of internet advertisingrevenue to 54%
2017 second-quarter revenues increased 23.1% on a year-over-year basis, resulting in a 10-year compound annualgrowth rate (CAGR), 2008-2017, of 15.4%. On a year-over-year basis, mobile’s advertising revenue increased 40%,increasing its share of total revenues from 47% in HY 2016 to 54% in HY 2017. The result is a 6-year compoundannual growth rate (CAGR) of 76.8%, reflecting an increase in total revenues from 2012 – 2017.
$5.7 $5.4 $6.2$7.7 $8.1 $8.6 $8.9 $9.9
$8.7 $9.4
$0.7$1.6
$2.8
$4.4$8.2
$11.4
$5.7 $5.4$6.2
$7.7$8.8
$10.3$11.7
$14.3
$16.9
$20.8
2008 2009 2010 2011 2012 2013 2014 2015 2016 2017
Mobile
Non-Mobile
1515.4%Overall CAGR
7676.8%Mobile CAGR
Source: IAB/PwC Internet Ad Revenue Report, HY 2017
2008 – 2017 ($ billions)
PwC | IAB internet advertising revenue report 6
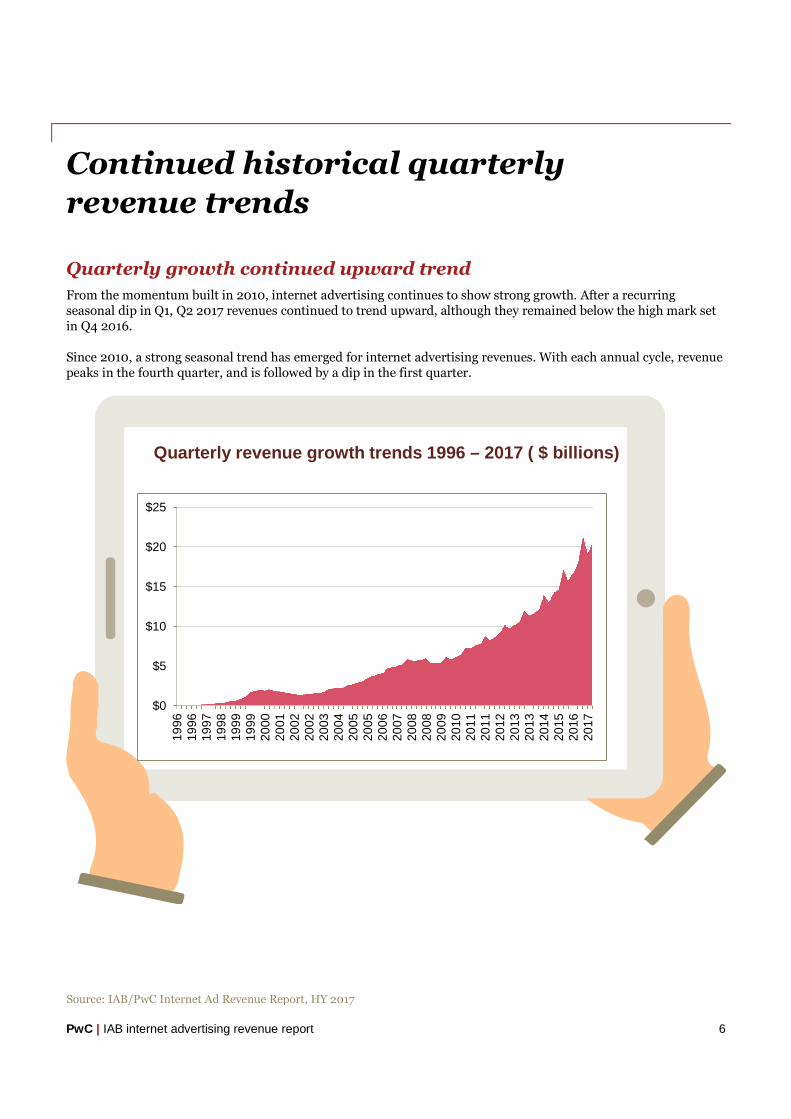
Continued historical quarterly
revenue trends
Quarterly growth continued upward trend
From the momentum built in 2010, internet advertising continues to show strong growth. After a recurringseasonal dip in Q1, Q2 2017 revenues continued to trend upward, although they remained below the high mark setin Q4 2016.
Since 2010, a strong seasonal trend has emerged for internet advertising revenues. With each annual cycle, revenuepeaks in the fourth quarter, and is followed by a dip in the first quarter.
Quarterly revenue growth trends 1996 – 2017 ( $ billions)
$0
$5
$10
$15
$20
$25
19
96
19
96
19
97
19
98
19
99
19
99
20
00
20
01
20
02
20
02
20
03
20
04
20
05
20
05
20
06
20
07
20
08
20
08
20
09
20
10
20
11
20
11
20
12
20
13
20
13
20
14
20
15
20
16
20
17
Source: IAB/PwC Internet Ad Revenue Report, HY 2017
PwC | IAB internet advertising revenue report 7
Historical revenue mix – first half vs.
second half
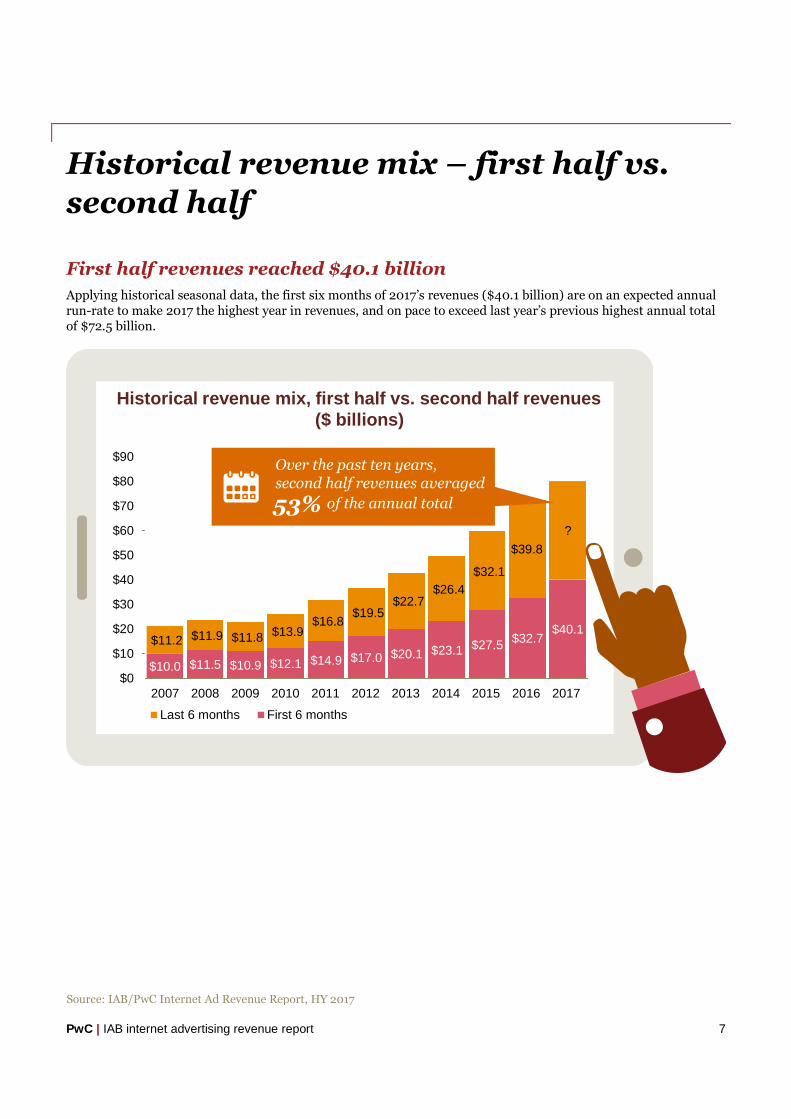
First half revenues reached $40.1 billion
Applying historical seasonal data, the first six months of 2017’s revenues ($40.1 billion) are on an expected annualrun-rate to make 2017 the highest year in revenues, and on pace to exceed last year’s previous highest annual totalof $72.5 billion.
$10.0 $11.5 $10.9 $12.1 $14.9 $17.0 $20.1 $23.1 $27.5$32.7
$40.1$11.2 $11.9 $11.8 $13.9
$16.8$19.5
$22.7$26.4
$32.1
$39.8
?
$0
$10
$20
$30
$40
$50
$60
$70
$80
$90
2007 2008 2009 2010 2011 2012 2013 2014 2015 2016 2017
Last 6 months First 6 months
Historical revenue mix, first half vs. second half revenues($ billions)
Over the past ten years,second half revenues averaged
53% of the annual total
Source: IAB/PwC Internet Ad Revenue Report, HY 2017

PwC | IAB internet advertising revenue report 8
Revenue concentration
Top 10 companies command 75% of revenues in Q2 2017
Online advertising revenues remain concentrated with the 10 leading ad-selling companies, accounting for 75% oftotal revenues in Q2 2017, consistent with the percentage reported in Q2 2016. Companies ranked 11th to 25thaccounted for 9% of revenues in Q2 2017, a two percentage point decrease from the 10% reported in Q2 2016.
The concentration of top 10 revenues have fluctuated over the past ten years, between 69% and 75%.
$0
$5
$10
$15
$20
$25
2004
20
05
20
06
20
07
20
08
20
09
20
10
20
11
20
12
20
13
20
14
20
15
Top 10 Top 25 Remaining 16%
9%
75%
2016
2017
% share of total revenues
2017Q2 Share
Source: IAB/PwC Internet Ad Revenue Report, HY 2017
PwC | IAB internet advertising revenue report 9
Ad format – second quarter 2017 results
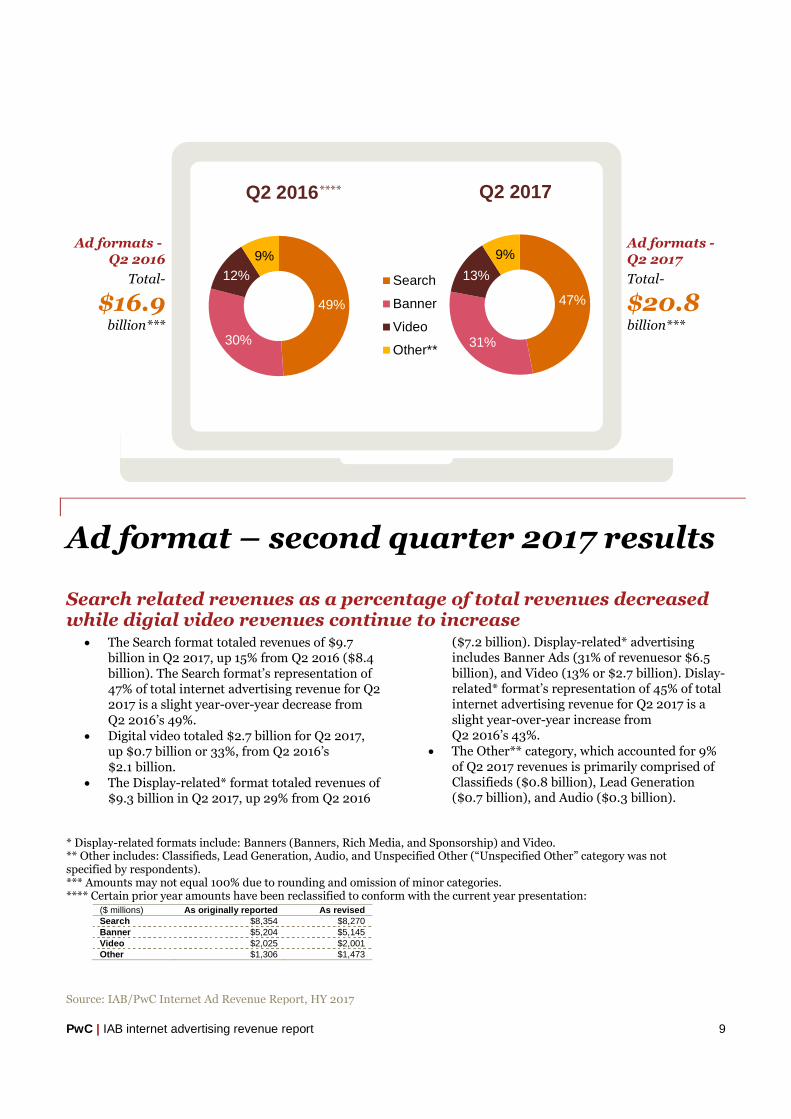
Search related revenues as a percentage of total revenues decreasedwhile digial video revenues continue to increase
The Search format totaled revenues of $9.7billion in Q2 2017, up 15% from Q2 2016 ($8.4billion). The Search format’s representation of47% of total internet advertising revenue for Q22017 is a slight year-over-year decrease fromQ2 2016’s 49%.
Digital video totaled $2.7 billion for Q2 2017,up $0.7 billion or 33%, from Q2 2016’s$2.1 billion.
The Display-related* format totaled revenues of$9.3 billion in Q2 2017, up 29% from Q2 2016
($7.2 billion). Display-related* advertisingincludes Banner Ads (31% of revenuesor $6.5billion), and Video (13% or $2.7 billion). Dislay-related* format’s representation of 45% of totalinternet advertising revenue for Q2 2017 is aslight year-over-year increase fromQ2 2016’s 43%.
The Other** category, which accounted for 9%of Q2 2017 revenues is primarily comprised ofClassifieds ($0.8 billion), Lead Generation($0.7 billion), and Audio ($0.3 billion).
* Display-related formats include: Banners (Banners, Rich Media, and Sponsorship) and Video.** Other includes: Classifieds, Lead Generation, Audio, and Unspecified Other (“Unspecified Other” category was notspecified by respondents).*** Amounts may not equal 100% due to rounding and omission of minor categories.**** Certain prior year amounts have been reclassified to conform with the current year presentation:
Ad formats -Q2 2016
Total-
$16.9billion***
Q2 2016 Q2 2017
49%
30%
12%
9%
47%
31%
13%
9%
Search
Banner
Video
Other**
Ad formats -Q2 2017
Total-
$20.8billion***
($ millions) As originally reported As revisedSearch $8,354 $8,270Banner $5,204 $5,145Video $2,025 $2,001Other $1,306 $1,473
Source: IAB/PwC Internet Ad Revenue Report, HY 2017
****
PwC | IAB internet advertising revenue report 10
Ad format – half year 2017 results
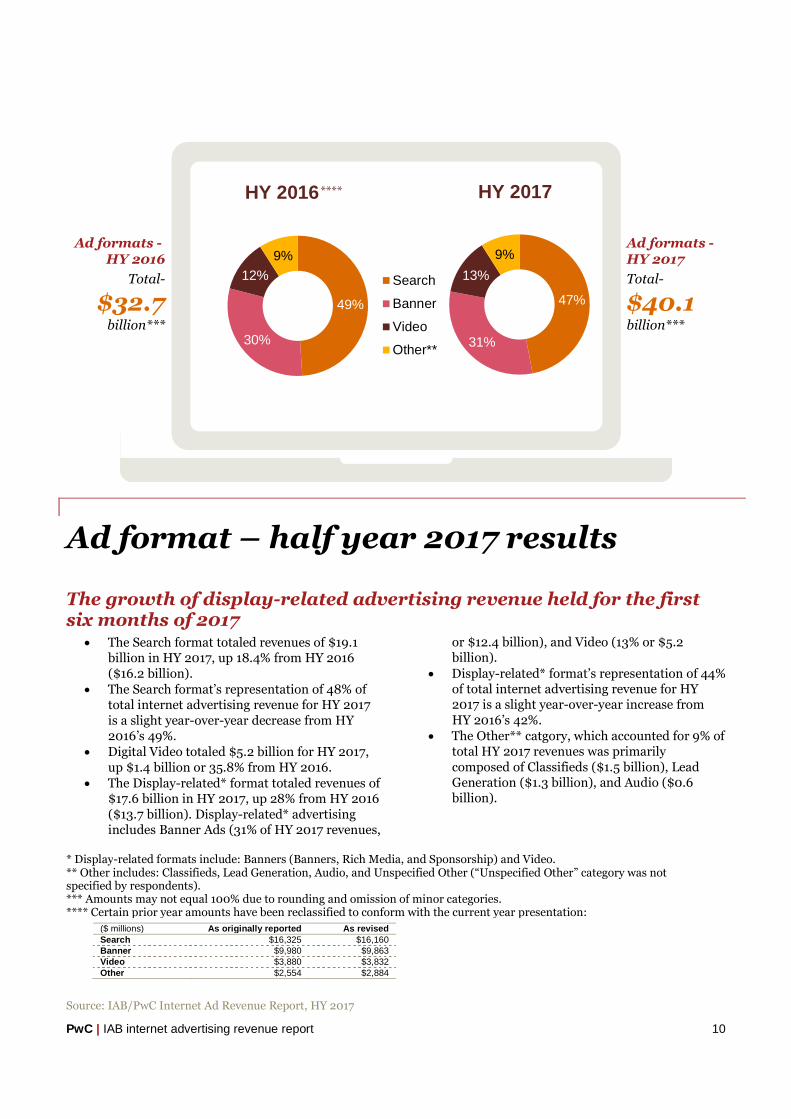
The growth of display-related advertising revenue held for the firstsix months of 2017
The Search format totaled revenues of $19.1billion in HY 2017, up 18.4% from HY 2016($16.2 billion).
The Search format’s representation of 48% oftotal internet advertising revenue for HY 2017is a slight year-over-year decrease from HY2016’s 49%.
Digital Video totaled $5.2 billion for HY 2017,up $1.4 billion or 35.8% from HY 2016.
The Display-related* format totaled revenues of$17.6 billion in HY 2017, up 28% from HY 2016($13.7 billion). Display-related* advertisingincludes Banner Ads (31% of HY 2017 revenues,
or $12.4 billion), and Video (13% or $5.2billion).
Display-related* format’s representation of 44%of total internet advertising revenue for HY2017 is a slight year-over-year increase fromHY 2016’s 42%.
The Other** catgory, which accounted for 9% oftotal HY 2017 revenues was primarilycomposed of Classifieds ($1.5 billion), LeadGeneration ($1.3 billion), and Audio ($0.6billion).
* Display-related formats include: Banners (Banners, Rich Media, and Sponsorship) and Video.** Other includes: Classifieds, Lead Generation, Audio, and Unspecified Other (“Unspecified Other” category was notspecified by respondents).*** Amounts may not equal 100% due to rounding and omission of minor categories.**** Certain prior year amounts have been reclassified to conform with the current year presentation:
Ad formats -HY 2016
Total-
$32.7billion***
HY 2016 HY 2017
Ad formats -HY 2017
Total-
$40.1billion***
49%
30%
12%
9%
47%
31%
13%
9%
Search
Banner
Video
Other**
($ millions) As originally reported As revisedSearch $16,325 $16,160Banner $9,980 $9,863Video $3,880 $3,832Other $2,554 $2,884
Source: IAB/PwC Internet Ad Revenue Report, HY 2017
****
PwC | IAB internet advertising revenue report 11
Historical Trends: Desktop vs. Mobile
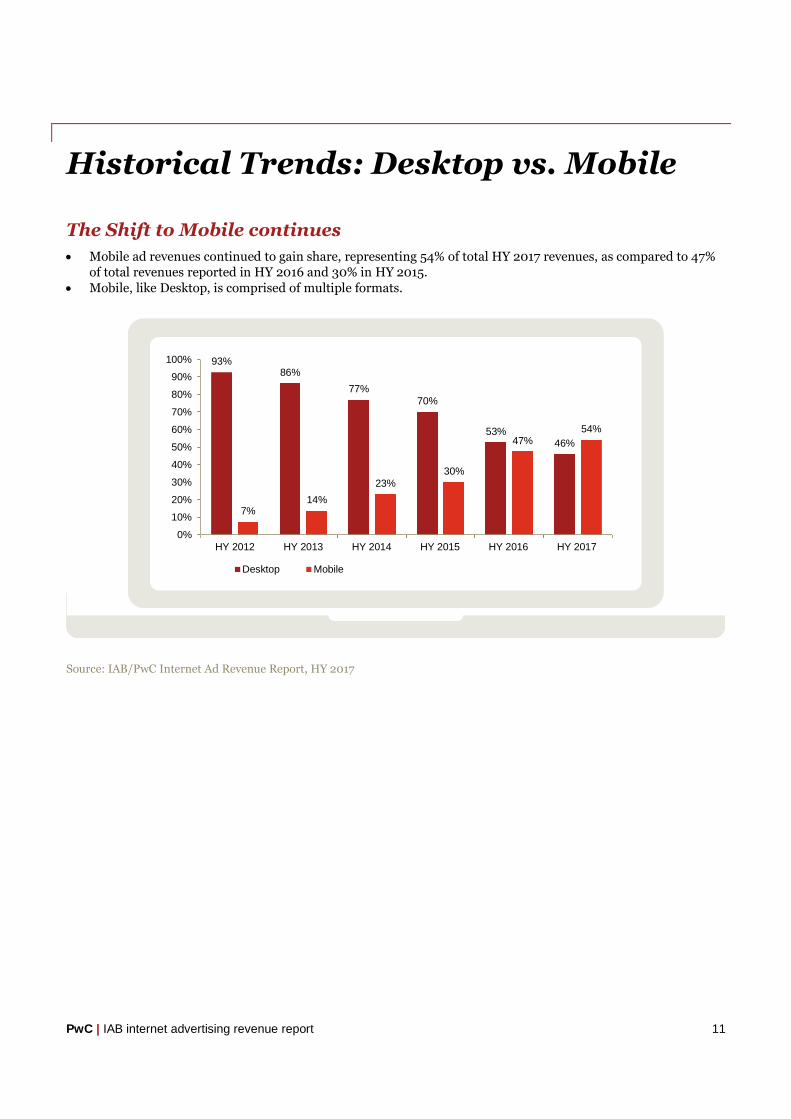
The Shift to Mobile continues
Mobile ad revenues continued to gain share, representing 54% of total HY 2017 revenues, as compared to 47%of total revenues reported in HY 2016 and 30% in HY 2015.
Mobile, like Desktop, is comprised of multiple formats.
93%86%
77%70%
53%46%
7%14%
23%30%
47%54%
0%
10%
20%
30%
40%
50%
60%
70%
80%
90%
100%
HY 2012 HY 2013 HY 2014 HY 2015 HY 2016 HY 2017
Desktop Mobile
Source: IAB/PwC Internet Ad Revenue Report, HY 2017
PwC | IAB internet advertising revenue report 12
Shifts occurred across the Search and
Digtial Video formats
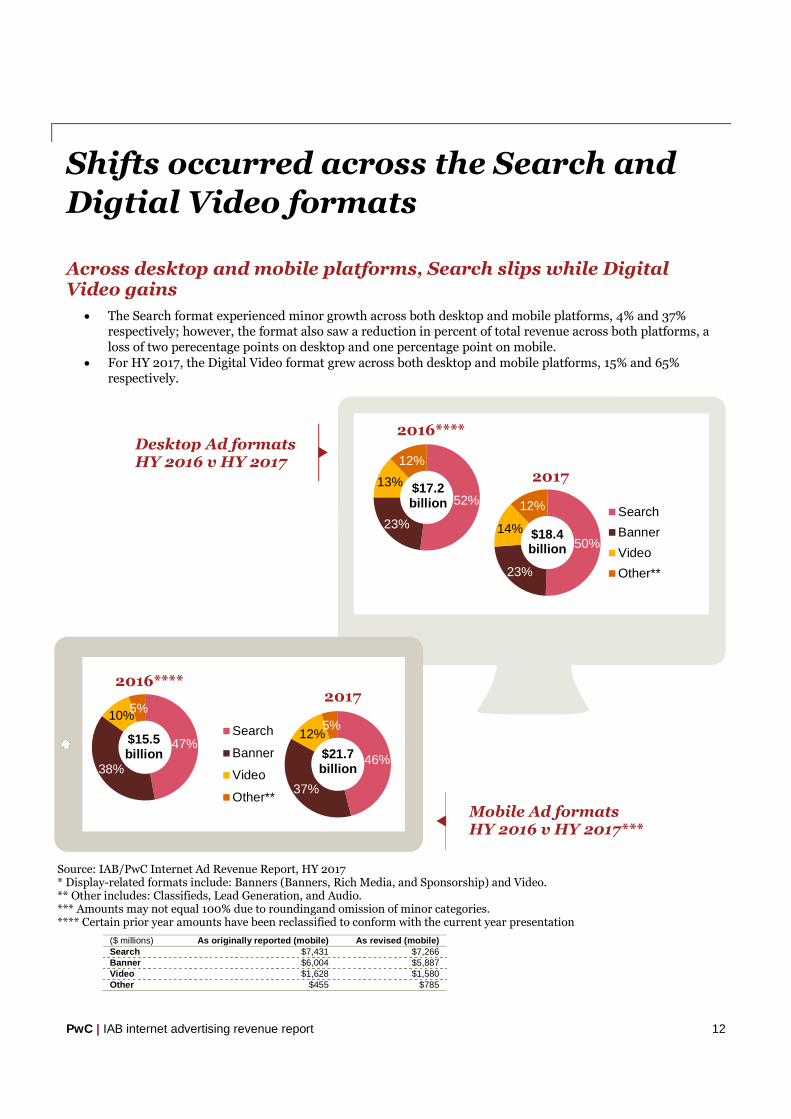
Across desktop and mobile platforms, Search slips while DigitalVideo gains
The Search format experienced minor growth across both desktop and mobile platforms, 4% and 37%respectively; however, the format also saw a reduction in percent of total revenue across both platforms, aloss of two perecentage points on desktop and one percentage point on mobile.
For HY 2017, the Digital Video format grew across both desktop and mobile platforms, 15% and 65%respectively.
($ millions) As originally reported (mobile) As revised (mobile)Search $7,431 $7,266Banner $6,004 $5,887Video $1,628 $1,580Other $455 $785
Source: IAB/PwC Internet Ad Revenue Report, HY 2017* Display-related formats include: Banners (Banners, Rich Media, and Sponsorship) and Video.** Other includes: Classifieds, Lead Generation, and Audio.*** Amounts may not equal 100% due to roundingand omission of minor categories.**** Certain prior year amounts have been reclassified to conform with the current year presentation
Desktop Ad formatsHY 2016 v HY 2017
Mobile Ad formatsHY 2016 v HY 2017***
50%
23%
14%
12% Search
Banner
Video
Other**
52%
23%
13%
12%
46%
37%
12%5%Search
Banner
Video
Other**
47%
38%
10%5%
$18.4billion
$17.2billion
$21.7billion
$15.5billion
2016****2017
2016****
2017
PwC | IAB internet advertising revenue report 13
Digital Video – Mobile catches up to
desktop
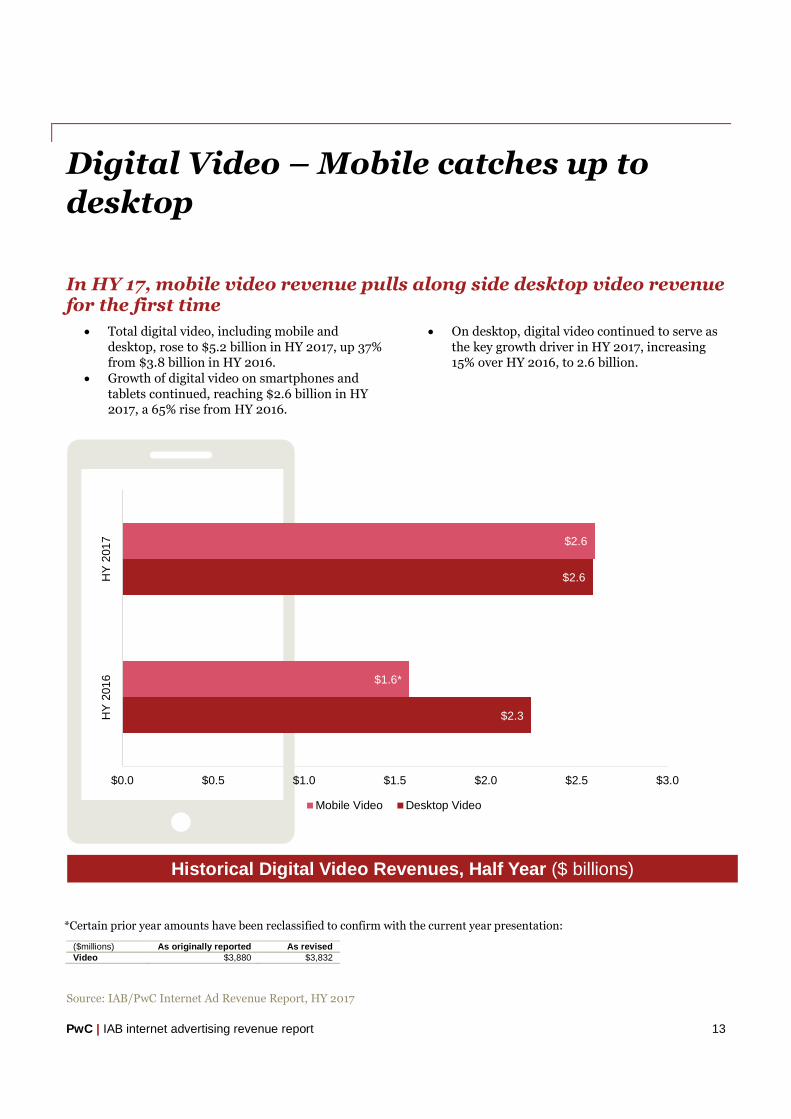
In HY 17, mobile video revenue pulls along side desktop video revenuefor the first time
Total digital video, including mobile anddesktop, rose to $5.2 billion in HY 2017, up 37%from $3.8 billion in HY 2016.
Growth of digital video on smartphones andtablets continued, reaching $2.6 billion in HY2017, a 65% rise from HY 2016.
On desktop, digital video continued to serve asthe key growth driver in HY 2017, increasing15% over HY 2016, to 2.6 billion.
($millions) As originally reported As revisedVideo $3,880 $3,832
Source: IAB/PwC Internet Ad Revenue Report, HY 2017
Historical Digital Video Revenues, Half Year ($ billions)
$2.3
$2.6
$1.6*
$2.6
$0.0 $0.5 $1.0 $1.5 $2.0 $2.5 $3.0
HY
201
6H
Y2
01
7
Mobile Video Desktop Video
*Certain prior year amounts have been reclassified to confirm with the current year presentation:
PwC | IAB internet advertising revenue report 14
Social media advertising revenue
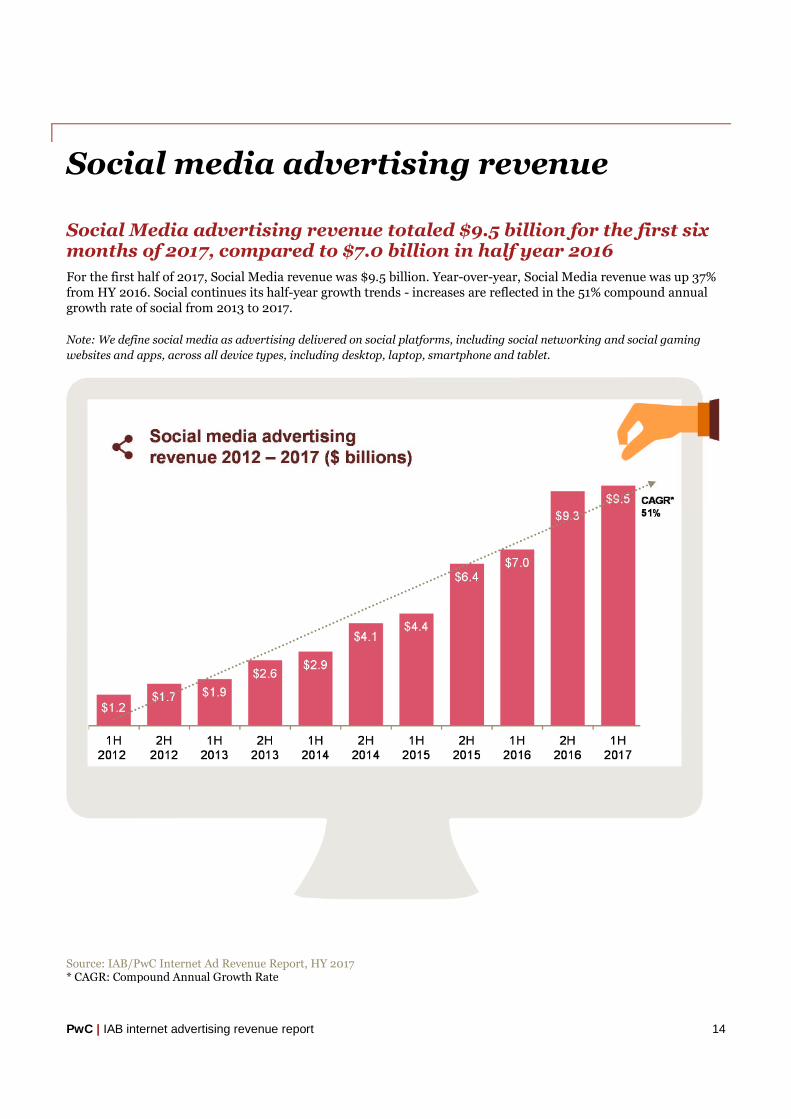
Social Media advertising revenue totaled $9.5 billion for the first sixmonths of 2017, compared to $7.0 billion in half year 2016
For the first half of 2017, Social Media revenue was $9.5 billion. Year-over-year, Social Media revenue was up 37%from HY 2016. Social continues its half-year growth trends - increases are reflected in the 51% compound annualgrowth rate of social from 2013 to 2017.
Note: We define social media as advertising delivered on social platforms, including social networking and social gaming
websites and apps, across all device types, including desktop, laptop, smartphone and tablet.
Source: IAB/PwC Internet Ad Revenue Report, HY 2017* CAGR: Compound Annual Growth Rate
PwC | IAB internet advertising revenue report 15
Digital Audio - on track to exceed last
year’s full-year revenue of $1.1B
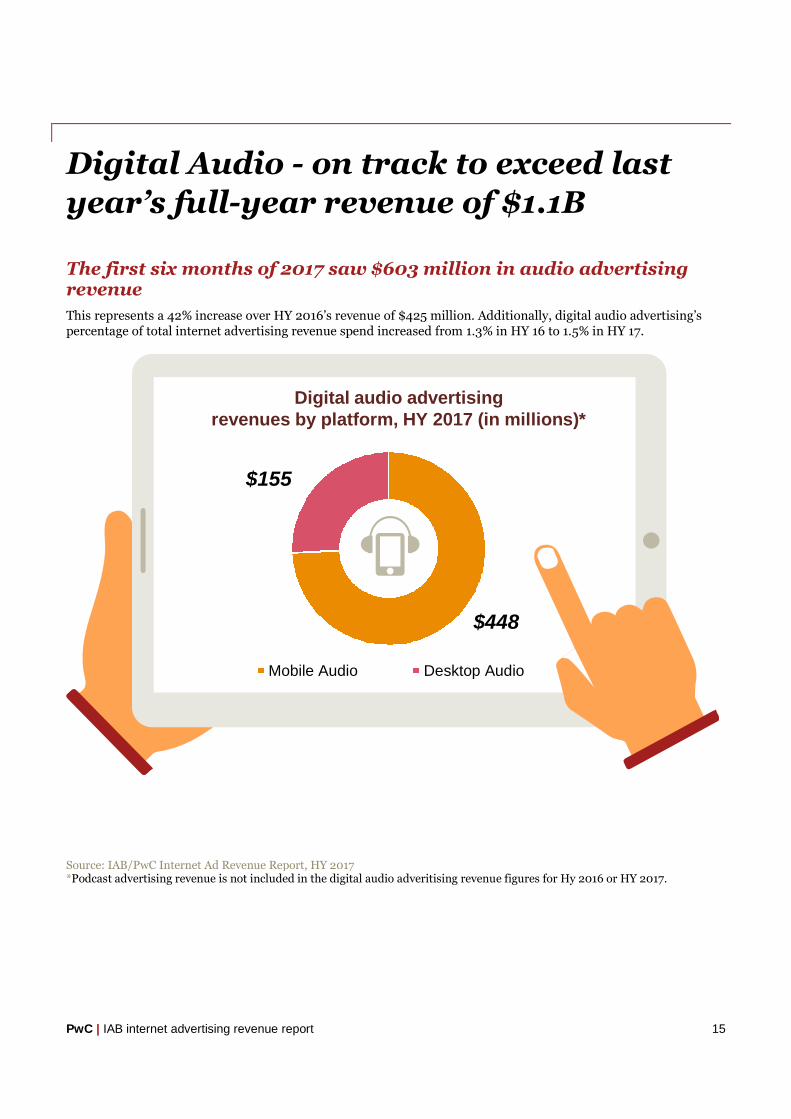
The first six months of 2017 saw $603 million in audio advertisingrevenue
This represents a 42% increase over HY 2016’s revenue of $425 million. Additionally, digital audio advertising’spercentage of total internet advertising revenue spend increased from 1.3% in HY 16 to 1.5% in HY 17.
Mobile Audio Desktop Audio
Digital audio advertisingrevenues by platform, HY 2017 (in millions)*
$448
$155
Source: IAB/PwC Internet Ad Revenue Report, HY 2017*Podcast advertising revenue is not included in the digital audio adveritising revenue figures for Hy 2016 or HY 2017.
PwC | IAB internet advertising revenue report 16
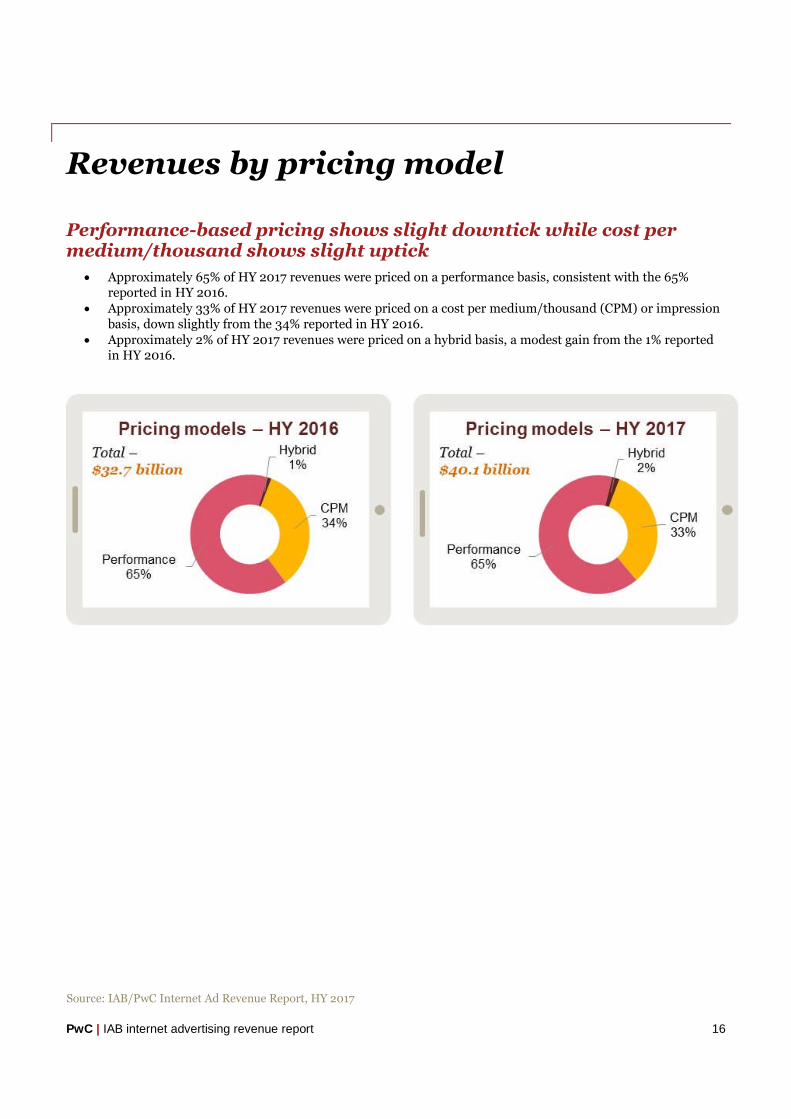
Revenues by pricing model
Performance-based pricing shows slight downtick while cost permedium/thousand shows slight uptick
Approximately 65% of HY 2017 revenues were priced on a performance basis, consistent with the 65%reported in HY 2016.
Approximately 33% of HY 2017 revenues were priced on a cost per medium/thousand (CPM) or impressionbasis, down slightly from the 34% reported in HY 2016.
Approximately 2% of HY 2017 revenues were priced on a hybrid basis, a modest gain from the 1% reportedin HY 2016.
Source: IAB/PwC Internet Ad Revenue Report, HY 2017
PwC | IAB internet advertising revenue report 17
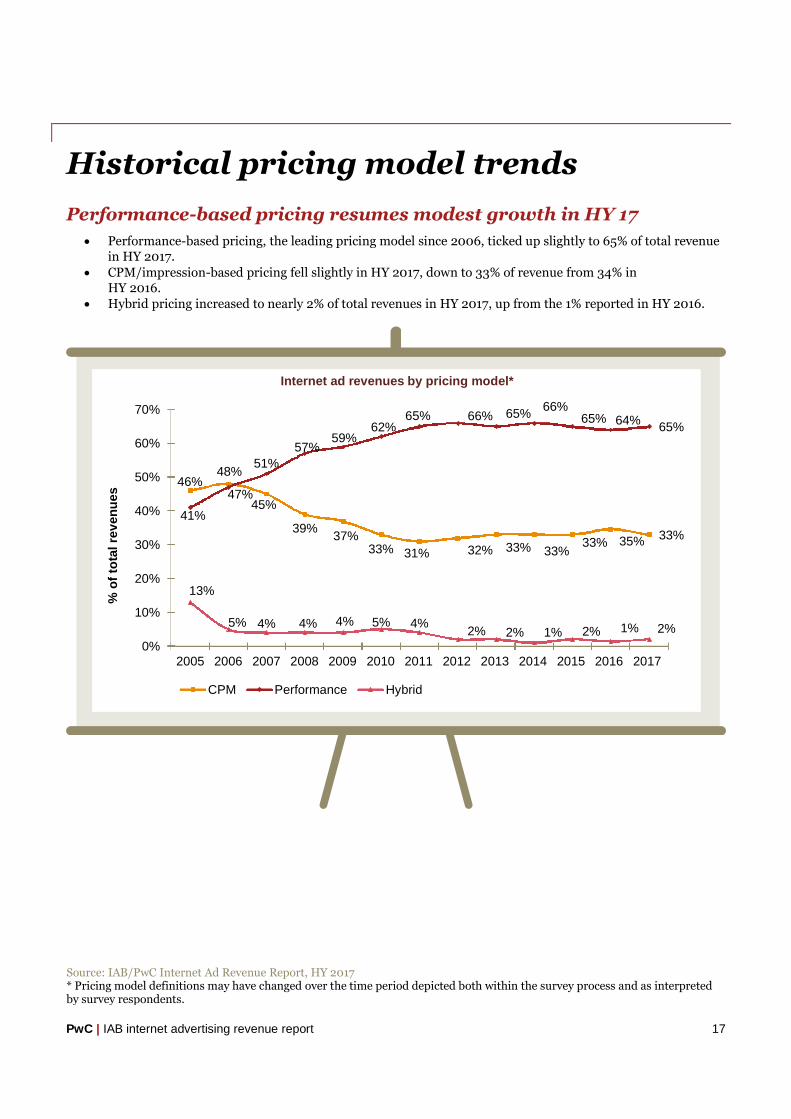
Historical pricing model trends
Performance-based pricing resumes modest growth in HY 17
Performance-based pricing, the leading pricing model since 2006, ticked up slightly to 65% of total revenuein HY 2017.
CPM/impression-based pricing fell slightly in HY 2017, down to 33% of revenue from 34% inHY 2016.
Hybrid pricing increased to nearly 2% of total revenues in HY 2017, up from the 1% reported in HY 2016.
46%48%
45%
39%37%
33% 31% 32% 33% 33%33% 35% 33%
41%
47%
51%
57%59%
62%65% 66% 65%
66%65% 64%
65%
13%
5% 4% 4% 4% 5% 4%2% 2% 1% 2% 1% 2%
0%
10%
20%
30%
40%
50%
60%
70%
2005 2006 2007 2008 2009 2010 2011 2012 2013 2014 2015 2016 2017
%o
fto
talre
ven
ues
CPM Performance Hybrid
Internet ad revenues by pricing model*
Source: IAB/PwC Internet Ad Revenue Report, HY 2017* Pricing model definitions may have changed over the time period depicted both within the survey process and as interpretedby survey respondents.
PwC | IAB internet advertising revenue report 18
Appendix
PwC | IAB internet advertising revenue report 19
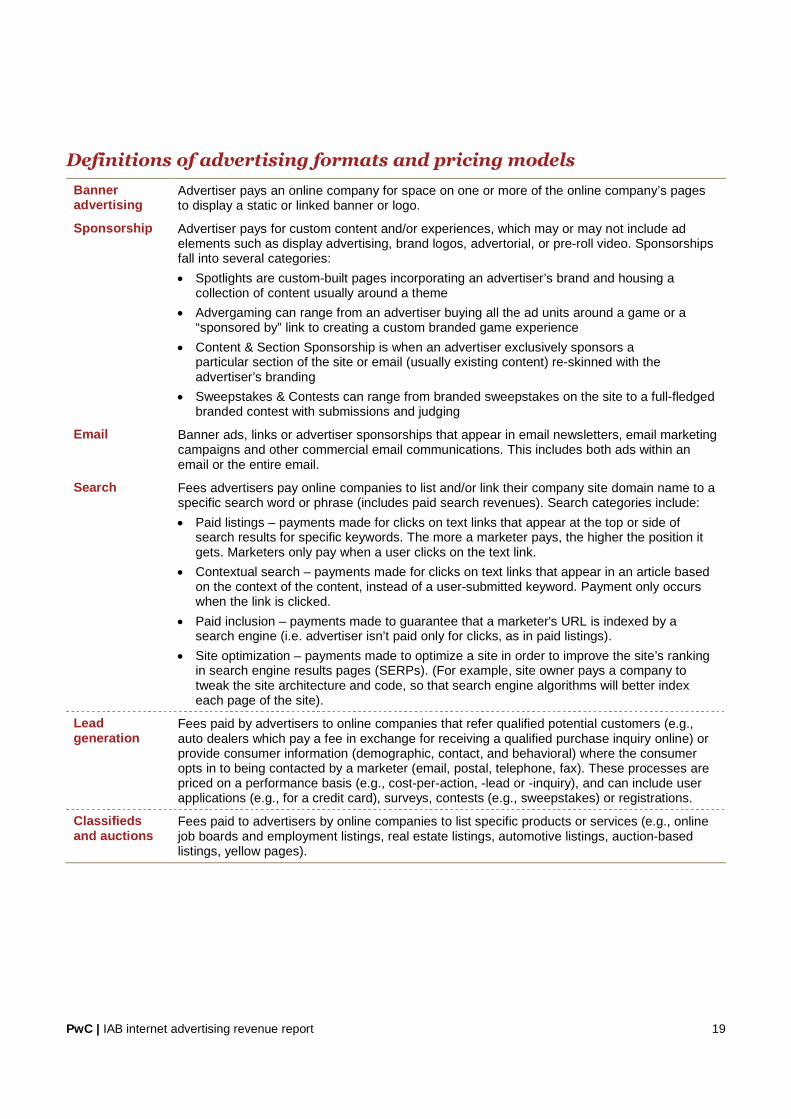
Definitions of advertising formats and pricing models
Banneradvertising
Advertiser pays an online company for space on one or more of the online company’s pagesto display a static or linked banner or logo.
Sponsorship Advertiser pays for custom content and/or experiences, which may or may not include adelements such as display advertising, brand logos, advertorial, or pre-roll video. Sponsorshipsfall into several categories:
Spotlights are custom-built pages incorporating an advertiser’s brand and housing acollection of content usually around a theme
Advergaming can range from an advertiser buying all the ad units around a game or a“sponsored by” link to creating a custom branded game experience
Content & Section Sponsorship is when an advertiser exclusively sponsors aparticular section of the site or email (usually existing content) re-skinned with theadvertiser’s branding
Sweepstakes & Contests can range from branded sweepstakes on the site to a full-fledgedbranded contest with submissions and judging
Email Banner ads, links or advertiser sponsorships that appear in email newsletters, email marketingcampaigns and other commercial email communications. This includes both ads within anemail or the entire email.
Search Fees advertisers pay online companies to list and/or link their company site domain name to aspecific search word or phrase (includes paid search revenues). Search categories include:
Paid listings – payments made for clicks on text links that appear at the top or side ofsearch results for specific keywords. The more a marketer pays, the higher the position itgets. Marketers only pay when a user clicks on the text link.
Contextual search – payments made for clicks on text links that appear in an article basedon the context of the content, instead of a user-submitted keyword. Payment only occurswhen the link is clicked.
Paid inclusion – payments made to guarantee that a marketer's URL is indexed by asearch engine (i.e. advertiser isn’t paid only for clicks, as in paid listings).
Site optimization – payments made to optimize a site in order to improve the site’s rankingin search engine results pages (SERPs). (For example, site owner pays a company totweak the site architecture and code, so that search engine algorithms will better indexeach page of the site).
Leadgeneration
Fees paid by advertisers to online companies that refer qualified potential customers (e.g.,auto dealers which pay a fee in exchange for receiving a qualified purchase inquiry online) orprovide consumer information (demographic, contact, and behavioral) where the consumeropts in to being contacted by a marketer (email, postal, telephone, fax). These processes arepriced on a performance basis (e.g., cost-per-action, -lead or -inquiry), and can include userapplications (e.g., for a credit card), surveys, contests (e.g., sweepstakes) or registrations.
Classifiedsand auctions
Fees paid to advertisers by online companies to list specific products or services (e.g., onlinejob boards and employment listings, real estate listings, automotive listings, auction-basedlistings, yellow pages).
PwC | IAB internet advertising revenue report 20
Rich media Display-related ads that integrate some component of streaming interactivity. Rich media adsoften include flash or java script, but not content, and can allow users to view and interact withproducts or services (e.g., scrolling or clicking within the ad opens a multimedia productdescription, expansion, animation, video or a “virtual test-drive” within the ad).
All IAB Rising Stars ad formats are considered Rich Media. Video commercials that appear invideo players are considered Video Ads, not Rich Media.
“Interstitials” have been consolidated within the rich media category and represent full- orpartial-page text and image server-push advertisements which appear in the transitionbetween two pages of content. Forms of interstitials can include a variation of the followingterms:
Splash screens – a preliminary page that precedes the regular home page of a websitethat usually promotes a particular site feature or provides advertising. A splash page istimed to move onto the home page after a short period of time.
Pop-up ads and pop-under ads – an advertisement that appear in a separate windowwhich automatically loads over an existing content window, without an associated banner.
Daughter windows – an advertisement that runs in a separate window associated with aconcurrently displayed banner. The content and banner are typically displayed first,followed by the daughter window.
Superstitials – ads that are distinct from interstitials because of the much higher ad quality,and that they play instantly (ads are fully downloaded before they are displayed).
Definitions of advertising formats and pricing models
Digital audio Partially or entirely advertising-supported audio programming available to consumers on astreaming basis, delivered via the wired and mobile internet. This includes a wide range ofservices, such as the following:
Online audio streams of terrestrial radio stations;
Purely online radio stations, with either professional or amateur DJs;
Personalized (i.e., without human editors/DJs) and on-demand, streamed audio servicesthat create playlists based on user preferences of artists, tracks, or genres;
Music or spoken word audio content delivered within a different website or application, e.g., in-game music services.
Digital Audio is currently included in Other.
Digital videoadvertising
Advertising that appears before, during or after digital video content in a video player (i.e. pre-roll, mid-roll, post-roll video ads). Digital Video Ads include TV commercials online and canappear in streaming content or in downloadable video. Display-related ads on a page (that arenot in a player) that contain video are categorized as rich media ads.
Video Overlays are also categorized as Digital Video Advertising. Video overlays include smallads that appear on top of digital video content. They can appear to be display, video, richmedia, text or another ad format but are contained within the video player.
PwC | IAB internet advertising revenue report 21
Mobileadvertising
Advertising tailored to and delivered through wireless mobile devices such as smartphones,feature phones (e.g. lower-end mobile phones capable of accessing mobile content), andmedia tablets. Typically taking the form of static or rich media display ads, text messagingads, search ads, or audio/video spots, such advertising generally appears within mobilewebsites (e.g. websites optimized for viewing on mobile devices), mobile apps (e.g.applications for Smartphones running proprietary or open operating systems), text messagingservices (i.e. SMS, MMS) or within mobile search results (i.e., 411 listings, directories, mobile-optimizedsearch engines).
Mobile advertising formats include: Search, Display-related (banner ads,video, audio, sponsorships, and rich media), and Other advertising served tomobile devices.
Social mediaadvertising
Advertising delivered on social platforms, including social networking and social gamingwebsites and apps, across all device types, including desktop, laptop, smartphone and tablet.
Impression-based
Cost-per-thousand (CPM) pricing model
Performance-based
Cost-per-click, sale, lead, acquisition, or application (e.g., credit card application) or straightrevenue share (e.g., % commission paid upon sale)
Hybrid Any mix of impression-based pricing plus performance-based compensation within one adcampaign
Survey scope and methodology
Survey scopeThe Interactive Advertising Bureau (IAB) retained PwC to establish a benchmark for measuring the growth ofinternet/online/mobile advertising revenues. The "IAB internet advertising revenue report" is part of an ongoingIAB mission to provide an accurate barometer of internet advertising growth.To achieve differentiation from existing estimates and accomplish industry-wide acceptance, key aspects of thesurvey include:
Obtaining historical data directly from companies generating internet/online/mobile advertising revenues; Making the survey as inclusive as possible, encompassing all forms of internet/online/mobile advertising,
including websites, consumer online services, ad networks and exchanges, mobile devices, and emailproviders; and
Ensuring and maintaining a confidential process, releasing only aggregate data.
MethodologyPwC performs the following:
Compiles a database of industry participants selling internet/online and mobile advertising revenues; Conducts a quantitative mailing survey with leading industry players, including Web publishers, ad
networks and exchanges, commercial online service providers, mobile providers, email providers, and otheronline media companies;
Acquires supplemental data through the use of publicly disclosed information; Requests and compiles several specific data items, including monthly gross commissionable advertising
revenue by industry category and transaction; Identifies non-participating companies and applies a conservative revenue estimate based on available
public sources; and, Analyzes the findings, identifies and reports key trends.
PwC | IAB internet advertising revenue report 22
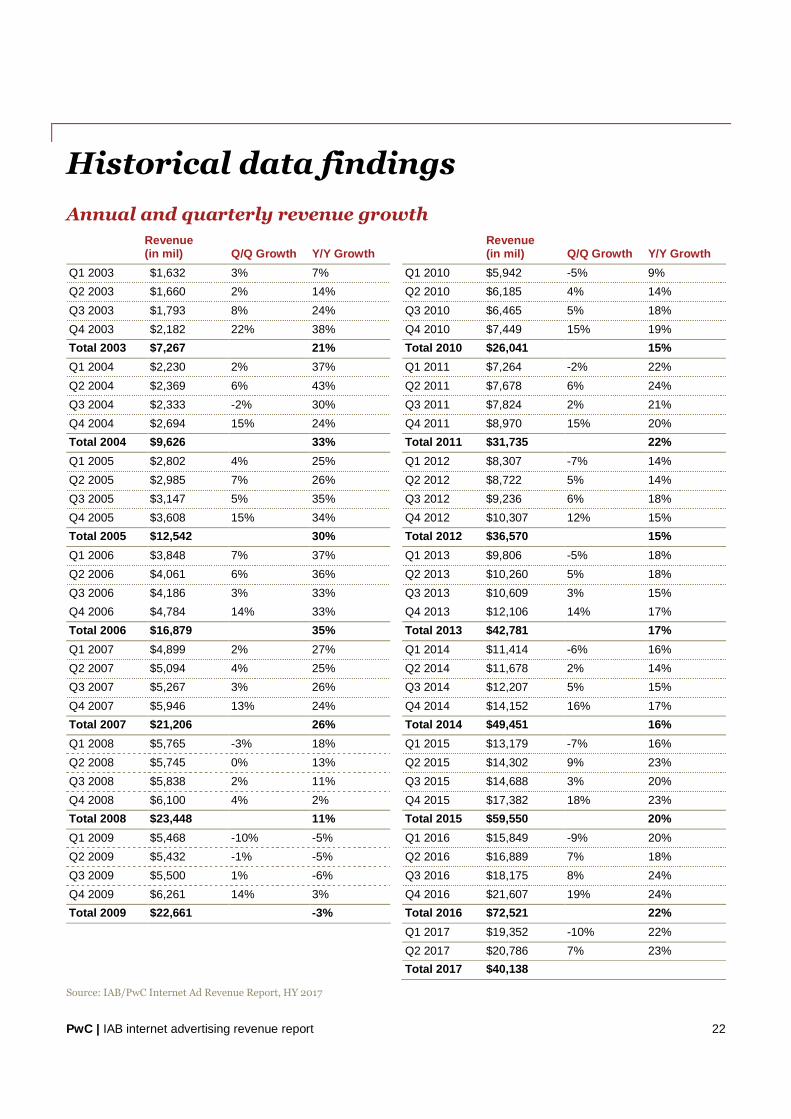
Historical data findings
Annual and quarterly revenue growth
Revenue(in mil) Q/Q Growth Y/Y Growth
Revenue(in mil) Q/Q Growth Y/Y Growth
Q1 2003 $1,632 3% 7% Q1 2010 $5,942 -5% 9%
Q2 2003 $1,660 2% 14% Q2 2010 $6,185 4% 14%
Q3 2003 $1,793 8% 24% Q3 2010 $6,465 5% 18%
Q4 2003 $2,182 22% 38% Q4 2010 $7,449 15% 19%
Total 2003 $7,267 21% Total 2010 $26,041 15%
Q1 2004 $2,230 2% 37% Q1 2011 $7,264 -2% 22%
Q2 2004 $2,369 6% 43% Q2 2011 $7,678 6% 24%
Q3 2004 $2,333 -2% 30% Q3 2011 $7,824 2% 21%
Q4 2004 $2,694 15% 24% Q4 2011 $8,970 15% 20%
Total 2004 $9,626 33% Total 2011 $31,735 22%
Q1 2005 $2,802 4% 25% Q1 2012 $8,307 -7% 14%
Q2 2005 $2,985 7% 26% Q2 2012 $8,722 5% 14%
Q3 2005 $3,147 5% 35% Q3 2012 $9,236 6% 18%
Q4 2005 $3,608 15% 34% Q4 2012 $10,307 12% 15%
Total 2005 $12,542 30% Total 2012 $36,570 15%
Q1 2006 $3,848 7% 37% Q1 2013 $9,806 -5% 18%
Q2 2006 $4,061 6% 36% Q2 2013 $10,260 5% 18%
Q3 2006 $4,186 3% 33% Q3 2013 $10,609 3% 15%
Q4 2006 $4,784 14% 33% Q4 2013 $12,106 14% 17%
Total 2006 $16,879 35% Total 2013 $42,781 17%
Q1 2007 $4,899 2% 27% Q1 2014 $11,414 -6% 16%
Q2 2007 $5,094 4% 25% Q2 2014 $11,678 2% 14%
Q3 2007 $5,267 3% 26% Q3 2014 $12,207 5% 15%
Q4 2007 $5,946 13% 24% Q4 2014 $14,152 16% 17%
Total 2007 $21,206 26% Total 2014 $49,451 16%
Q1 2008 $5,765 -3% 18% Q1 2015 $13,179 -7% 16%
Q2 2008 $5,745 0% 13% Q2 2015 $14,302 9% 23%
Q3 2008 $5,838 2% 11% Q3 2015 $14,688 3% 20%
Q4 2008 $6,100 4% 2% Q4 2015 $17,382 18% 23%
Total 2008 $23,448 11% Total 2015 $59,550 20%
Q1 2009 $5,468 -10% -5% Q1 2016 $15,849 -9% 20%
Q2 2009 $5,432 -1% -5% Q2 2016 $16,889 7% 18%
Q3 2009 $5,500 1% -6% Q3 2016 $18,175 8% 24%
Q4 2009 $6,261 14% 3% Q4 2016 $21,607 19% 24%
Total 2009 $22,661 -3% Total 2016 $72,521 22%
Q1 2017 $19,352 -10% 22%
Q2 2017 $20,786 7% 23%
Total 2017 $40,138
Source: IAB/PwC Internet Ad Revenue Report, HY 2017
PwC | IAB internet advertising revenue report 23
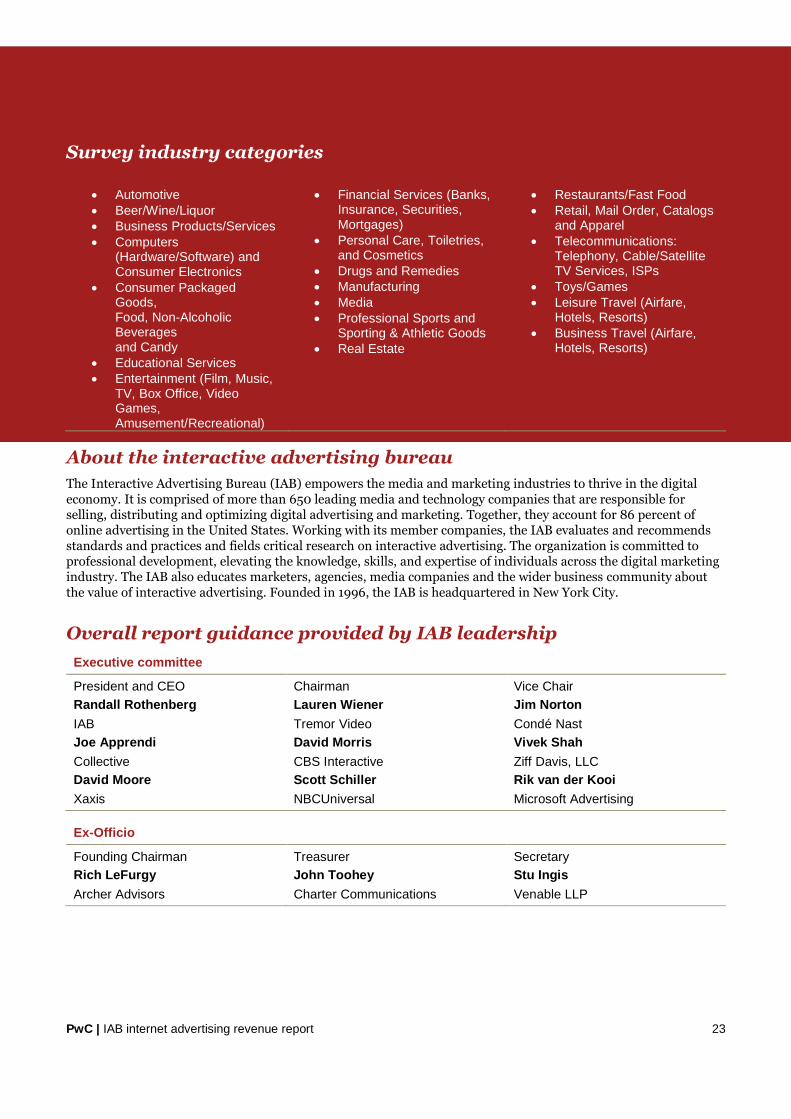
Survey industry categories
About the interactive advertising bureau
The Interactive Advertising Bureau (IAB) empowers the media and marketing industries to thrive in the digitaleconomy. It is comprised of more than 650 leading media and technology companies that are responsible forselling, distributing and optimizing digital advertising and marketing. Together, they account for 86 percent ofonline advertising in the United States. Working with its member companies, the IAB evaluates and recommendsstandards and practices and fields critical research on interactive advertising. The organization is committed toprofessional development, elevating the knowledge, skills, and expertise of individuals across the digital marketingindustry. The IAB also educates marketers, agencies, media companies and the wider business community aboutthe value of interactive advertising. Founded in 1996, the IAB is headquartered in New York City.
Overall report guidance provided by IAB leadership
Executive committee
President and CEO
Randall Rothenberg
IAB
Joe Apprendi
Collective
David Moore
Xaxis
Chairman
Lauren Wiener
Tremor Video
David Morris
CBS Interactive
Scott Schiller
NBCUniversal
Vice Chair
Jim Norton
Condé Nast
Vivek Shah
Ziff Davis, LLC
Rik van der Kooi
Microsoft Advertising
Automotive Beer/Wine/Liquor Business Products/Services Computers
(Hardware/Software) andConsumer Electronics
Consumer PackagedGoods,Food, Non-AlcoholicBeveragesand Candy
Educational Services Entertainment (Film, Music,
TV, Box Office, VideoGames,Amusement/Recreational)
Financial Services (Banks,Insurance, Securities,Mortgages)
Personal Care, Toiletries,and Cosmetics
Drugs and Remedies Manufacturing Media Professional Sports and
Sporting & Athletic Goods Real Estate
Restaurants/Fast Food Retail, Mail Order, Catalogs
and Apparel Telecommunications:
Telephony, Cable/SatelliteTV Services, ISPs
Toys/Games Leisure Travel (Airfare,
Hotels, Resorts) Business Travel (Airfare,
Hotels, Resorts)
Ex-Officio
Founding Chairman
Rich LeFurgy
Archer Advisors
Treasurer
John Toohey
Charter Communications
Secretary
Stu Ingis
Venable LLP
PwC | IAB internet advertising revenue report 24
Board of Directors
Lee Brown
Buzzfeed
Seth Dallaire
Amazon Media Group
Rick Erwin
Acxiom
Eric Franchi
Undertone
John Frelinghuysen
Disney
Keith Grossman
Bloomberg
Chris Guenther
NewsCorp
Jed Hartman
The Washington Post
Mark Howard
Forbes Media
Allie Kline
AOL
Meredith Kopit Levien
The New York Times
Seth Ladetsky
Turner Broadcasting System
Warren Lapa
Spectrum Reach
Jeff Lucas
Snapchat
Jean-Philippe Maheu
Kirk McDonald
PubMatic
Marian Pittman
Cox Media Group
Penry Price
Sridhar Ramaswamy
Michael Rubenstein
AppNexus
Samantha Skey
SheKnows Media
Brad Smallwood
Jeremy Steinberg
The Weather Company
John Trimble
Pandora
Lisa Utzshneider
Yahoo
Jacob Weisberg
Slate
Rick Welday
AT&T AdWorks
Steven Wolfe Pereira
Neustar
Troy Young
Hearst Magazines Digital Media
Joe Zawadzki
MediaMath
PwC’s technology and entertainment, media, andcommunications practicesAs business, accounting, and tax advisors to many of the world’s leading Entertainment, Media, andCommunications (EMC) and Technology (Tech) companies, PwC (www.pwc.com) has an insider’s view of trendsand developments driving the industry. With approximately 1,200 practitioners serving EMC and Tech clients inthe United States, PwC is deeply committed to providing clients with industry experience and resources. In recentyears, our pioneering work in EMC and Tech has included developing strategies to leverage digital technology,identifying new sources of financing, and marketplace positioning in industries characterized by consolidation andtransformation. Our experience reaches across all geographies and segments of the EMC and Tech sectors,including broadband, wireless, the internet, music, film, television, publishing, advertising, gaming, theme parks,computers and networking, and software. With thousands of practitioners around the world, we're always close athand to provide deep industry knowledge and resources.
Our services include Business assurance services Web audience measurement and advertising delivery auditing and advisory IAB Measurement Certification Compliance auditing Privacy policy structuring, attestation, and compliance advisory Mergers & acquisitions assistance Tax planning and compliance Capital sourcing and IPO assistance Marketing & Media operations enablement
© 2017 PwC. All rights reserved. PwC refers to the US member firmor one of its subsidiaries or affiliates, and may sometimes refer to thePwC network. Each member firm is a separate legal entity.Please see www.pwc.com/structure for further details.
For more information, contact one of the following PwC professionals:
PwC has exercised reasonable care in the collecting, processing,and reporting of this information but has not independentlyverified, validated, or audited the data to verify the accuracy orcompleteness of the information. PwC gives no express or impliedwarranties, including but not limited to any warranties ofmerchantability or fitness for a particular purpose or use and shallnot be liable to any entity or person using this document, or haveany liability with respect to this document.
This content is for general information purposes only, andshould not be used as a substitute for consultation withprofessional advisors.
New YorkDavid SilvermanPartner, Assurance [email protected]
New YorkBrian GaffneyManager, Advisory [email protected]