I Prefer the Corrupt One: A Profi le of Citizens who ...
34
Reis. Rev.Esp.Investig.Sociol. ISSN-L: 0210-5233. Nº 153, January - March 2016, pp. 77-92 doi:10.5477/cis/reis.153.77 María del Mar Martínez Rosón: Universidad de Burgos | [email protected] I Prefer the Corrupt One: A Profile of Citizens who Choose Dishonest but Competent Politicians Yo prefiero al corrupto: el perfil de los ciudadanos que eligen políticos deshonestos pero competentes María del Mar Martínez Rosón Palabras clave Competencia • Comportamiento electoral • Conocimiento político • Corrupción • Costa Rica • Honradez Resumen Los resultados electorales muestran que los electores no siempre castigan a los políticos corruptos en las urnas y son capaces de votar a un político corrupto si este es competente. El objetivo de este trabajo es analizar las características que diferencian a los ciudadanos que están dispuestos a apoyar a los corruptos de los electores que no lo están a partir de datos de opinión pública en Costa Rica. Los resultados muestran que hay cuatro variables que diferencian ambos grupos: los conocimientos políticos, los ingresos, la edad y el género. Las mujeres y los ciudadanos con más conocimientos políticos eligen políticos deshonestos pero competentes en menor medida que los hombres y aquellos ciudadanos con menos conocimientos políticos. Por el contrario, los jóvenes y los ciudadanos con más ingresos están dispuestos a compensar la falta de honradez con más competencia en mayor medida que los adultos y aquellos con menores ingresos. Key words Competence • Electoral Behavior • Political knowledge • Corruption • Costa Rica • Honesty Abstract Electoral results show that voters do not always punish corrupt politicians at the ballot box and some will vote for corrupt candidates if they are competent. The aim of this paper is to analyse the characteristics that differentiate between citizens who are prepared to support corrupt politicians from voters who are not, based on public opinion data from Costa Rica. The results show that four variables differentiate between the two groups: political knowledge, income, age and gender. Women and citizens with more political knowledge choose dishonest but competent politicians to a lesser extent than men and those with low levels of political knowledge. However, young people and citizens with higher income levels are willing to allow dishonesty to be offset by better competence to a greater extent than adults and those with low income. Citation Martínez Rosón, María del Mar (2016). ”I Prefer the Corrupt One: A Profile of Citizens who Choose Dishonest but Competent Politicians”. Revista Española de Investigaciones Sociológicas, 153: 77-92. (http://dx.doi.org/10.5477/cis/reis.153.77)
Transcript of I Prefer the Corrupt One: A Profi le of Citizens who ...
Reis. Rev.Esp.Investig.Sociol. ISSN-L: 0210-5233. Nº 153, January - March 2016, pp. 77-92
doi:10.5477/cis/reis.153.77
María del Mar Martínez Rosón: Universidad de Burgos | [email protected]
I Prefer the Corrupt One: A Profi le of Citizens who Choose Dishonest but Competent
Politicians Yo prefi ero al corrupto: el perfi l de los ciudadanos que eligen políticos
deshonestos pero competentes
María del Mar Martínez Rosón
Palabras clave
Competencia• Comportamiento electoral• Conocimiento político• Corrupción• Costa Rica• Honradez
Resumen
Los resultados electorales muestran que los electores no siempre castigan a los políticos corruptos en las urnas y son capaces de votar a un político corrupto si este es competente. El objetivo de este trabajo es analizar las características que diferencian a los ciudadanos que están dispuestos a apoyar a los corruptos de los electores que no lo están a partir de datos de opinión pública en Costa Rica. Los resultados muestran que hay cuatro variables que diferencian ambos grupos: los conocimientos políticos, los ingresos, la edad y el género. Las mujeres y los ciudadanos con más conocimientos políticos eligen políticos deshonestos pero competentes en menor medida que los hombres y aquellos ciudadanos con menos conocimientos políticos. Por el contrario, los jóvenes y los ciudadanos con más ingresos están dispuestos a compensar la falta de honradez con más competencia en mayor medida que los adultos y aquellos con menores ingresos.
Key words
Competence• Electoral Behavior• Political knowledge• Corruption• Costa Rica• Honesty
Abstract
Electoral results show that voters do not always punish corrupt politicians at the ballot box and some will vote for corrupt candidates if they are competent. The aim of this paper is to analyse the characteristics that differentiate between citizens who are prepared to support corrupt politicians from voters who are not, based on public opinion data from Costa Rica. The results show that four variables differentiate between the two groups: political knowledge, income, age and gender. Women and citizens with more political knowledge choose dishonest but competent politicians to a lesser extent than men and those with low levels of political knowledge. However, young people and citizens with higher income levels are willing to allow dishonesty to be offset by better competence to a greater extent than adults and those with low income.
Citation
Martínez Rosón, María del Mar (2016). ”I Prefer the Corrupt One: A Profi le of Citizens who Choose Dishonest but Competent Politicians”. Revista Española de Investigaciones Sociológicas, 153: 77-92.(http://dx.doi.org/10.5477/cis/reis.153.77)
Reis 153 05 Martinez Ingles.indd 77Reis 153 05 Martinez Ingles.indd 77 18/12/15 9:2518/12/15 9:25

Reis. Rev.Esp.Investig.Sociol. ISSN-L: 0210-5233. Nº 153, January - March 2016, pp. 77-92
78 I Prefer the Corrupt One: A Profi le of Citizens who Choose Dishonest but Competent Politicians
INTRODUCTION1
In general, citizens think of and defi ne a good
politician as someone who is honest and
competent (Funk, 1999; Kinder, 1983; Kinder
et al., 1980). However, there are at times sur-
prising election results, where candidates
who differ greatly from this profi le of a good
politician are rewarded at the ballot box with
enough electoral support to be (re-)elected.
This happens because, while the defi nition of
a good politician is based on a list of ideal
characteristics that citizens rank depending
on the importance given to each of them, in
real life they have to choose between candi-
dates with a particular combination of featu-
res, and honesty and competence do not
always come together in one candidate.
The aim of this paper is to investigate
how that choice takes place, trying to analy-
se what qualities are capable of being com-
promised when other features are found to
occur, and to understand the factors that
affect that choice. In particular, this research
will seek to identify the variables that diffe-
rentiate between the citizens who are most
fi rmly committed to the election of honest
candidates and those who adopt a utilitarian
approach, by preferring competence over
honesty if both cannot be achieved simulta-
neously.
The answer to this question not only con-
tributes to a better understanding of the de-
cisions made by voters about candidates,
but also to comprehend the power that cer-
tain variables such as corruption have in
breaking the public’s regulatory authority and
limiting accountability. Ascertaining what
percentage of citizens are prepared to sup-
port corruption, and the factors that lead
them to make that decision, helps to appre-
ciate the likelihood of the status quo being
1 We would like to thank the journal's two anonymous
reviewers of our article for their comments and sugges-
tions, which have helped to improve and enrich the fi nal
text.
maintained, or instead, of a change occurring
in the support received by candidates and
parties, and ultimately, in the party system.
So far the various experimental and pu-
blic opinion studies have not provided con-
clusive results. It is important to take the
analysis further in order to help explain why
there are such high election and re-election
rates of corrupt politicians worldwide (Chang
and Kerr, 2009). The analysis of corruption
also helps to improve the anti-corruption po-
licies implemented in developing countries
(Manzetti and Wilson, 2007). Some of the li-
terature indicates that when citizens support
corrupt politicians, they do so due to lack of
information or to coordination issues. Howe-
ver, actual facts show that even informed
citizens may support dishonest politicians
(Manzetti and Wilson, 2007; Jacobson and
Dimock, 1994; Dimock and Jacobson, 1995;
Stoker, 1993).
From a substantive point of view, the fun-
damental difference between this paper and
previous studies is the inclusion of a variable
that considers whether or not citizens have
been victims of corruption. There are few stu-
dies which focus on corruption being offset
by high levels of competence2 and also take
into account the impact of citizens’ experien-
ce of corruption (Deegan-Krause et al., 2011).
In contrast to other studies that use experi-
mental designs, data for this analysis came
from a representative sample of the entire
population, and respondents were asked di-
rectly about the issue. The data employed
was public data collected by the University
of Vanderbilt in the Americas Barometer
(LAPOP)3, which conducts its survey every
2 On the compensation mechanism, see Bruner and
Korchin (1946), Rundquist et al. (1977), Funk (1996),
Caínzos and Jiménez (2000), Muñoz and Esaiasson
(2013), Muñoz et al. (2013), Winters and Weitz-Shapiro
(2013), Pereira et al. (2008), and Bonifácio (2013).
3 I am grateful to the Latin American Public Opinion
Project (LAPOP) and its main donors for making this data
available.
Reis 153 05 Martinez Ingles.indd 78Reis 153 05 Martinez Ingles.indd 78 18/12/15 9:2518/12/15 9:25

María del Mar Martínez Rosón 79
Reis. Rev.Esp.Investig.Sociol. ISSN-L: 0210-5233. Nº 153, January - March 2016, pp. 77-92
two years and includes all the countries in
the Americas. Despite the breadth of cases
and data, the theme of this paper has been
little dealt with by the referred research group
and only data from one case is available, that
of Costa Rica4.
The results show that political knowled-
ge, family income, age and gender are im-
portant differentiating variables between citi-
zens who prefer competent political
representatives, even if this means that their
honesty is compromised, and those who
choose honesty, even if this entails lower le-
vels of competence. Women and those citi-
zens with a greater level of political knowled-
ge choose dishonest candidates to a lesser
extent than men and citizens with a lower
level of political knowledge. In addition,
young people and citizens with higher inco-
me levels are willing to allow competence to
offset dishonesty to a greater extent than
adults and those with lower income levels.
Although Costa Rica is politically organi-
sed under a presidential system, the results
may also be relevant to other cases which
have a parliamentary system, such as that of
Spain. As Poguntke and Webb (2005) poin-
ted out, in recent years there has been a wi-
despread presidentialisation process in par-
liamentary systems, without a change in the
formal rules governing them. This process
results in an increase in the resources and
autonomy of the leader within the party
structure, the government and the electoral
campaign. This presidentialisation therefore
means that the results may be applied to
other contexts and other analyses on how
important certain characteristics of the lea-
der are for citizens and how this infl uences
their voting behaviour.
This paper is organised as follows. Firstly,
some theoretical clarifi cations are provided
regarding the most valued features in politi-
4 Databases and questionnaires are available in www.
LapopSurveys.org.
cians. Secondly, an analysis is made of the
expected impact of a set of variables when
assessing the characteristics of politicians
that may infl uence voters to compromise ho-
nesty when it is offset by competence. Thirdly,
a logistic regression is performed in order to
measure the degree of infl uence of these va-
riables on voters’ choices. The paper fi nishes
with a summary of the most interesting fi n-
dings and their implications.
POLITICIANS’ QUALITIES
One of the reasons why researchers began
to look at the qualities of candidates was the
interest that candidates had in understan-
ding the way in which citizens decide to vote.
The literature sought to expand the number
of variables that explained this process from
the candidacy phase to the incumbency pha-
se (Campbell et al., 1954; Campbell et al.,
1960; Prewitt, 1970). Given that American
politics was focused mostly on candidates
who put themselves forward and the decrea-
sing importance of ideological identifi cation
and political issues in terms of election re-
sults, research turned towards these indivi-
dual aspects. This is why an attempt was
made to identify what personal characteris-
tics voters took into account when voting,
and to determine what aspects of the candi-
dates were most valued (Martínez Rosón,
2014).
However, the importance of the candida-
tes’ characteristics is not only based on how
they are valued by citizens; these characte-
ristics also have other political consequen-
ces. Several researchers have shown that
personal features infl uence voting decisions
(Kulisheck and Mondak, 1996; Prysby, 2008),
re-election chances (Abramowitz, 1991; Fi-
nan and Ferraz, 2005; Stone et al., 2004), the
results of the primary elections (Mondak,
1995; Welch and Hibbing, 1997), and the
election campaign (Funk, 1997 and 1999).
The evaluation of these qualities should not
Reis 153 05 Martinez Ingles.indd 79Reis 153 05 Martinez Ingles.indd 79 18/12/15 9:2518/12/15 9:25
Reis. Rev.Esp.Investig.Sociol. ISSN-L: 0210-5233. Nº 153, January - March 2016, pp. 77-92
80 I Prefer the Corrupt One: A Profi le of Citizens who Choose Dishonest but Competent Politicians
be judged as superfl uous, but must be un-
derstood as a shortcut to rational decision-
making (Fiorina, 1981 and Page, 1978) that
takes place spontaneously (Canache et al.,
2000; McCurly and Mondak, 1995; Popkin,
1991; Sullivan et al., 1990). Furthermore, the
inclusion of this data is not subject to the ab-
sence of other information. Regardless of
whether there is information on policies or
ideology, and of the amount of personal de-
tails available, this data will be taken into ac-
count by voters (Kulisheck and Mondak,
1996).
But what do citizens consider to be the
most important qualities for politicians? A
variable number of the most potentially im-
portant variables have been traditionally in-
cluded by researchers in their analysis. The
proposals found in the literature range from
very simple outlines that collect together a
couple of aspects, to others that list a host of
features5: morality, honesty, intelligence, lea-
dership, fairness, weakness, empathy, deter-
mination, inspiration, decency, exemplarity,
compassion, caring... Nevertheless, most of
the research concluded that honesty and
competence are the two features which have
the most weight in the assessments made by
citizens of candidates (Funk, 1996, 1997 and
1999; Kinder, 1983; Kinder et al., 1980).
It is common to fi nd the argument that a
voter prefers an honest politician to a corrupt
one, one who is capable over one who is not.
But as discussed in this paper, the fact is that
there are citizens who, when faced with
choosing between the two, prefer putting ho-
nesty to one side in favour of other values
such as competence. In Costa Rica, 23.2%
of respondents preferred to choose a com-
petent political representative who is disho-
nest, to an honest but incompetent political
5 A full list can be found in the American National Elec-
tion Studies questionnaires, which have been applied in
the United States since 1980: http://www.electionstu-
dies.org/
representative (76.8%). Likewise, 36.6% of
respondents preferred political representati-
ves with good ideas, even they are disho-
nest, while 63.4% would choose an honest
political representative who lacks good
ideas6. This data is consistent with that found
in other cases. In Brazil, for example, in 2002
39.6% of respondents preferred a politician
who carried out a lot of public work but stole
a little, than a politician who did not steal
anything but actually did little public work. In
2006 the percentage had dropped to 16.2%
(Bonifácio, 2013).
Several studies have also shown the limi-
ted effect scandals have on the voting per-
centages for some politicians (Peters and
Welch, 1978; Jiménez and Caínzos, 2004;
Bågemholm, 2013)7. According to Abra-
mowitz (1991), between 1984 and 1986,
members of the US Congress who ran for
re-election and were involved in scandals
saw their voting margins reduced by 11.9%,
and three out of seven lost their seats. In the
analysis made by Hibbing and Welch (1997),
politicians accused of corruption while hol-
ding offi ce received 10% fewer votes than
those who had not been accused. Despite
this, only 25% actually lost the election. In
the brazilian case used by Pereira et al.
(2008), while 61% of the political representa-
tives involved in a scandal put themselves
forward for re-election, among political re-
presentatives not involved in these scandals
this percentage rose to 75%. Electoral suc-
cess is greater among clean candidates
(75% achieved re-election) than among poli-
tical representatives who have been accused
of corruption (42%)8.
6 See Annex 1 and Table 1.
7 The impact of scandals and corruption can also be
seen as an indirect control mechanism by the elite
through fi nancing (Pereira et al., 2008).
8 According to Choi and Woo (2010), corrupt politicians
have better electoral performance because corruption
only has a signifi cant effect on election results when
there is a poor level of economic growth.
Reis 153 05 Martinez Ingles.indd 80Reis 153 05 Martinez Ingles.indd 80 18/12/15 9:2518/12/15 9:25
María del Mar Martínez Rosón 81
Reis. Rev.Esp.Investig.Sociol. ISSN-L: 0210-5233. Nº 153, January - March 2016, pp. 77-92
This data raises an immediate question:
Why do voters choose corrupt politicians?
According to Sousa and Moriconi (2013),
citizens need to have suffi cient information
about the facts of the case, the motivation
to use that information, and the ability to
punish politicians for it. However, even if they
have the relevant information, motivation
and ability may not do it. Researchers have
explored various reasons why corruption may
have a limited impact on the choice9. This
paper explores whether citizens might be
willing to choose a corrupt politician if such
politician is competent. This compensation
mechanism has been observed in different
contexts such as in Spain (Caínzos and
Jiménez, 2000; Muñoz and Esaiasson, 2013;
Muñoz et al., 2013), among the upper classes
in Brazil (Winters and Weitz-Shapiro, 2013), in
the United States (Funk, 1996) and in Sweden
(Muñoz and Esaiasson, 2013), although
some authors have minimised its importance
(Pereira et al., 2008; Bonifácio, 2013).
This article attempts to explore the cha-
racteristics that shape this process. The
choice of honesty or competence may be
affected by other variables (such as educa-
tion, the degree of political sophistication,
ideology and age) that are linked both to ci-
tizens and the politician being assessed. For
the purposes of the analysis undertaken
here, however, some issues are irrelevant be-
cause the data is not related to a real or an
imagined candidate, but rather to an abstract
question about the citizen’s preference when
faced with the dilemma of choosing between
competence and honesty. That is why the
features referring to politicians or candidates
can be ignored, as respondents lacked this
information. Conversely, variables referred to
citizens are included which highlight aspects
that have been scantily covered in the litera-
ture, such as the perception of the degree of
general corruption and whether or not they
9 There are other reasons for voting for a corrupt politi-
cian, which are summarised in the study by Sousa and
Moriconi (2013).
had been victims of corruption. The following
sections will examine the expected impact
that five groups of variables (political
knowledge and education; the degree of
perceived corruption and victimisation; poli-
tical participation and culture; income and
fi nancial situation; and fi nally, gender and
age) could have on the preference for corrupt
but effective politicians. The effect of other
variables such as ideology, the party voted
for in the last election and the geographical
location (rural-urban) will be controlled for.
FACTORS THAT INFLUENCE THE PREFERENCE FOR DISHONEST POLITICIANS
Since the analysis of the success of corrupt
or dishonest politicians is relatively recent
and limited, generally, most of the literature
is based on the relationship between varia-
bles developed by the explanations of voting
decisions. The literature that provides a spe-
cifi c theoretical explanation of the infl uence
of competence and corruption was consul-
ted, and on this basis its expected impact on
the choice of competence in the absence of
honesty was adapted. In this way a set of
working hypotheses was outlined, which was
used to perform the statistical analysis.
Political knowledge and education
Some authors have found that people with
higher levels of education tolerate corruption
to a lesser extent than the less educated (Al-
meida, 2007; Bonifácio, 2013), as they have
a greater ability to understand and forecast
the political, economic and social conse-
quences that derive from it. Nevertheless,
other authors are more nuanced in their fi n-
dings. The results provided by the study con-
ducted by Kinder (1983) showed that for the
higher educated, competence was more im-
portant than for those with lower education
levels. Years later this result was still valid.
Funk (1996) found that individuals with more
Reis 153 05 Martinez Ingles.indd 81Reis 153 05 Martinez Ingles.indd 81 18/12/15 9:2518/12/15 9:25

Reis. Rev.Esp.Investig.Sociol. ISSN-L: 0210-5233. Nº 153, January - March 2016, pp. 77-92
82 I Prefer the Corrupt One: A Profi le of Citizens who Choose Dishonest but Competent Politicians
political knowledge considered competence
to be more important in their evaluations of
politicians than citizens with less political
knowledge. In addition, people with more
knowledge continued to value the compe-
tence of politicians despite them being at the
core of a politically irrelevant scandal. What
is not clear from this study is what happens
when the problem is politically relevant.
Whether this can mean that the more educa-
ted and more politically knowledgeable citi-
zens value competence even if it means
compromising honesty, or whether they va-
lue honesty over competence. Given these
results, two alternative hypotheses are pro-
posed here. It could be that:
H1: Citizens with a higher level of education
are more likely to prefer honest but in-
competent politicians than citizens with
a lower level of education, and that
H2: Citizens with a greater level of political
knowledge are more likely to prefer ho-
nest but incompetent politicians than
citizens with a lower level of political
knowledge.
Or conversely, it could be expected that
H1a: Citizens with a higher educational level
are more likely to prefer dishonest but
competent politicians than citizens with
a lower level of education, and that
H2a: Citizens with a greater level of political
knowledge are more likely to prefer dis-
honest but competent politicians than
citizens with a lower level of political
knowledge.
Tolerated and perceived corruption
Although the literature has shown how accu-
sations of corruption have a clear effect both
on citizens’ assessment of politicians and on
their vote, researchers have not paid enough
attention to how the corruption perceived or
suffered by a citizen affects evaluation and
choice criteria. Those citizens who have
been victims of corruption can be highly sen-
sitive to this issue and prefer an inept but
honest politician than the opposite. But it can
also be the case that in a society that tolera-
tes high levels of corruption, people have
come to consider that problem as inevitable,
and to believe that all politicians are corrupt,
and therefore they do not take this into ac-
count when assessing politicians (Finan and
Ferraz, 2005). While surprising, the belief
whereby victims of corruption tend to accept
these mechanisms has been found among
citizens of some African countries (Bratton,
2009; Chang and Kerr, 2009). If this relation-
ship is confi rmed, it could be expected that
H3: Citizens who have been victims of co-
rruption are more likely to prefer compe-
tent but dishonest political representati-
ves than those citizens who have not
directly experienced corruption.
Otherwise, it could be expected that,
H3a: Citizens who have been victims of co-
rruption are more likely to prefer honest
but incompetent political representati-
ves than those citizens who have not
directly experienced corruption.
In addition to this victimisation variable,
the perceived general levels of corruption
must be taken into account. Deegan-Krause
et al. (2011) analysed the impact of the gene-
ral (sociotropic) perception of corruption and
the personal (pocketbook) experience of co-
rruption on voting. They found that percep-
tions of higher levels of corruption, together
with higher levels of victimisation were asso-
ciated with a lower probability of voting for
the party in government. However, they con-
tradicted previous studies by concluding that
tolerated corruption levels have a greater
effect on voting behaviour than the overall
perceived level of corruption in the country.
According to these authors, the difference in
results is explained by the specifi c characte-
ristics of the countries under study, as in tho-
se countries that are undergoing a transition,
Reis 153 05 Martinez Ingles.indd 82Reis 153 05 Martinez Ingles.indd 82 18/12/15 9:2518/12/15 9:25

María del Mar Martínez Rosón 83
Reis. Rev.Esp.Investig.Sociol. ISSN-L: 0210-5233. Nº 153, January - March 2016, pp. 77-92
the overall perception is less important than
the individual’s perception. Since Costa Rica
has had a democratic system for over 60
years10 it can be expected that
H4: The impact of the sociotropic corruption
variable on preferences is more impor-
tant that the impact of the pocketbook
variable.
Participation and political culture
The literature has also sought connections
between corruption and various common va-
riables in political culture studies, such as
political participation and satisfaction with
democracy. A key issue here is whether tho-
se citizens who are willing to choose corrupt
politicians actually vote in elections or not. If
a high percentage of citizens prefer a corrupt
politician, but they are not electorally active,
their infl uence on the results disappears. On
the contrary, if they are highly active, their
impact on the election results increases.
Likewise, the existence of a political subcul-
ture opposed to the dominant political cultu-
re could be a challenge if it is based on va-
lues that are incompatible with democracy.
Five common variables are considered in
this paper, based on the studies on political
culture (Morán and Benedicto, 1995): electo-
ral participation, participation in protests,
support for democracy, degree of satisfac-
tion with the performance of democracy, and
interpersonal trust. No previous results have
been found for electoral participation and
participation in protests that allow for
hypotheses to be established in a certain di-
rection. Therefore
H5: Those citizens who prefer honest but
incompetent political representatives
may show greater levels of participation
in elections and protests than those ci-
10 For further information on the political system in Cos-
ta Rica, see Booth and Seligson (2005), Lehoucq (2005),
Sánchez (2007), Seligson (2002).
tizens who are willing to allow dishones-
ty to be offset by competence.
But the data may show that
H5a: Higher levels of participation in elections
and protests may be identifi ed among
those citizens who prefer dishonest but
competent political representatives.
Maier (2011), in his experimental analysis
in Germany, found that scandals have a ne-
gative effect on the political system. Never-
theless, this impact only affects the support
given to politicians and parties, whereas the
confi dence in institutions and the satisfaction
with democracy are not affected by the scan-
dals. This lack of impact on satisfaction with
democracy occurs today due to citizens’
weariness. The higher the number of scan-
dals experienced by the public, the greater
their capacity to weigh their impact and the-
refore, the fewer the consequences arising
from them (Kumlin and Esaiasson, 2012). In
contrast, other authors have found different
evidence and argue that the perception of
corruption is negatively related to satisfac-
tion with democracy. Villoria and Jiménez
(2012) found that those citizens in Spain who
perceive that there is more corruption also
have a lower satisfaction with democracy.
Taking the latter into account
H6: Those citizens who declare that they
have a high level of support for and sa-
tisfaction with democracy are more
likely to choose honest politicians than
those with low levels of support and sa-
tisfaction.
These authors also found evidence that
perception of corruption is negatively related
to interpersonal trust. This is so because in
societies where there is distrust and citizens
think that others will not act honestly, acting
improperly becomes the rational thing to do,
and thus distrust reinforces non-compliance
with rules (Villoria and Jiménez, 2012). It is
therefore expected that
Reis 153 05 Martinez Ingles.indd 83Reis 153 05 Martinez Ingles.indd 83 18/12/15 9:2518/12/15 9:25
Reis. Rev.Esp.Investig.Sociol. ISSN-L: 0210-5233. Nº 153, January - March 2016, pp. 77-92
84 I Prefer the Corrupt One: A Profi le of Citizens who Choose Dishonest but Competent Politicians
H7: Respondents with high levels of inter-
personal trust are more likely to choose
honest politicians than those citizens
with low levels of interpersonal trust.
Financial situation and income
Some studies have attempted to establish a
relationship between the acceptance of co-
rruption and employment status (Popova,
2010), social class11 (Winters and Weitz-Shapi-
ro, 2013) and income (Redlawsk and McCann,
2002). Considering that corruption increases
poverty and inequality, and that it imposes less
of a fi nancial burden on the upper class (Win-
ters and Weitz-Shapiro, 2013: 427), a greater
rejection of corrupt candidates would be ex-
pected among the more disadvantaged
groups. However, the results have not been
conclusive in all cases (Riera et al., 2013) and
empirical evidence has been found to be con-
tradictory. Winters and Weitz-Shapiro (2013)
found greater support for the tradeoff between
competence and corruption among the Brazi-
lian upper classes. However, Redlawsk and
McCann (2002) did not fi nd any relationship
between the acceptance of corruption and in-
come, and the analysis by Bonifácio (2013)
showed that people with higher income are
less likely to accept that corruption can be off-
set by competence. Since no clear consensus
has been found in the literature on the relation-
ship between the two variables, two alternative
hypotheses are proposed that indicate that
H8: It is expected that those citizens with
higher income levels are more likely to
allow corruption to be offset by compe-
tence, or that
H8a: It is expected that those citizens with
lower income levels are more likely to
allow corruption to be offset by compe-
tence.
11 Understood by these authors as a combination of
access to a certain level of resources and the educatio-
nal level of the family head.
To explore this question, the total family
income, the overall perception of the econo-
mic situation and their own fi nancial situation
will be taken into account. The widespread
levels of informal work in Costa Rica, estima-
ted at being approximately 40% (Delgado
Jiménez, 2013), and the large proportion of
retired people and students in the survey that
were automatically regarded as unemployed
makes household income a more appropria-
te variable than employment situation.
Gender and age
Gender and age are common variables in the
analysis of the characteristics of candidates
and the impact of corruption12. In a study ba-
sed on the World Values Survey, Swamy et al.
(2001) argued that women engage less than
men in corrupt activities and are also less
likely to justify these activities. The origin of
this difference between the sexes may be
due to different reasons. Women may be less
corrupt because of differences in the sociali-
sation process, due to the lack of knowledge
about corrupt procedures and mechanisms
or due to a greater diffi culty in accessing co-
rruption networks, among others (Swamy et
al., 2001). Whatever the cause, these diffe-
rences mean that those countries where the
presence of women in parliament and in the
workplace is greater, there are lower levels of
corruption (Swamy et al., 2001; Dollar et al.,
2001)13. If it is true that women engage in
corrupt practices less than men, it is logical
to think that they will not support such prac-
tices either. Therefore it is expected that
H9: Women are more likely to prefer honest-
incompetent politicians than men.
12 According to Redlawsk and McCann, women and the
elderly apply the label of corruption to a wider range of
political behaviour, even if it not strictly illegal.
13 Other authors hold that this relationship is spurious
and that it is caused by the effects of liberal democracy
(gender equality and better governance), and not by the
greater presence of women (Sung, 2003; Goetz, 2007).
Reis 153 05 Martinez Ingles.indd 84Reis 153 05 Martinez Ingles.indd 84 18/12/15 9:2518/12/15 9:25

María del Mar Martínez Rosón 85
Reis. Rev.Esp.Investig.Sociol. ISSN-L: 0210-5233. Nº 153, January - March 2016, pp. 77-92
Age also has an impact on justifying co-
rruption. In a longitudinal study using data
from eight European countries, Torgler and
Valev (2006) found that, after controlling for
the cohort effects, young people under 30
are more likely to perceive corruption as a
justifi able fact than citizens over that age. Si-
milar results emerged in the Brazilian case
(Bonifacio, 2013). If, as these authors argue,
tolerance of corruption decreases with age,
it could be expected that
H10: Young people will have a greater prefe-
rence for corrupt but competent politi-
cians than the adults interviewed.
Finally, the political ideology of citizens
and whether they are located in an urban or
rural context needs to be taken into account.
In terms of ideology it should be noted that,
while in research conducted about real and
fi ctional candidates this variable is very im-
portant, since in the study under discussion
the question is not associated with any real
candidates, it is included as a control varia-
ble. In the literature, Johnston (1991) found a
moderate relationship in the United Kingdom
between supporting conservative candidates
and those who judge corrupt activities more
strictly. As to the second variable, it seems
that the local context also infl uences the per-
ception of corruption. In an exploratory study
on the US presidential election conducted by
Redlawsk and McCann (2002), it was argued
that citizens living in small towns have a
broader view of corruption than those living
in large cities.
DATA AND ANALYSIS
The implementation of a project about public
opinion with a common questionnaire in La-
tin America has enabled researchers to open
a new space for analysis in the region. Unfor-
tunately the Americas Barometer only explo-
red the assessment of the personal charac-
teristics of politicians in the case of Costa
Rica, and only in a round of interviews in
2006. The questionnaire included two diffe-
rent questions where it explored three perso-
nality characteristics: honesty, competence
and having good ideas. Obviously the inclu-
sion of only three data items does not allow
an analysis of the most important qualities
for Latin American citizens, and assumes
that honesty and competence are also the
most important personal characteristics.
Despite these limitations, the available data
makes it possible to explore other relations-
hips and analyse how independent variables,
as previously noted (political knowledge,
education, perception of corruption, partici-
pation, income, gender and age) affect the
way in which the preferred qualities in candi-
dates are ranked.
The question applied in the LAPOP ques-
tionnaire was phrased in an abstract manner,
without specifi cally identifying any particular
politician or post. This wording puts the
analysis at a certain disadvantage, but it also
offers some advantages. The disadvantages
notably include that, to some extent, it limits
the application of some theoretical fi ndings.
If there is a specifi c leader with a specifi c set
of characteristics, whether real or created in
an experiment, certain variables of the per-
son performing the evaluation can be com-
pared with those of the individual being eva-
luated (such as the ideological position,
party membership/sympathy or position in
public politics). However, using an abstract
question it is not possible to make that com-
parison. Among the advantages, it should be
noted that the way in which the qualities are
ranked is not biased by the image of a real
leader and their background, which results in
a more general response.
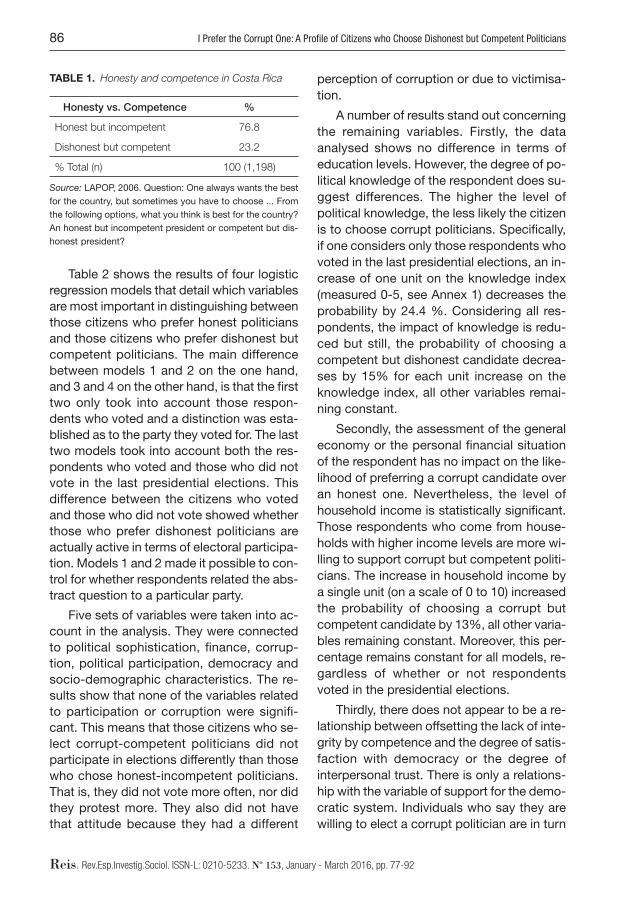
The data shows that, if they have to make
a choice between the two characteristics,
citizens prefer honesty (Table 1). Most res-
pondents prefer honesty even if it means that
the politician is incompetent (76.8%). Howe-
ver, 23.2% of citizens are willing to overlook
dishonesty if competence is ensured.
Reis 153 05 Martinez Ingles.indd 85Reis 153 05 Martinez Ingles.indd 85 18/12/15 9:2518/12/15 9:25
Reis. Rev.Esp.Investig.Sociol. ISSN-L: 0210-5233. Nº 153, January - March 2016, pp. 77-92
86 I Prefer the Corrupt One: A Profi le of Citizens who Choose Dishonest but Competent Politicians
TABLE 1. Honesty and competence in Costa Rica
Honesty vs. Competence %
Honest but incompetent 76.8
Dishonest but competent 23.2
% Total (n) 100 (1,198)
Source: LAPOP, 2006. Question: One always wants the best
for the country, but sometimes you have to choose ... From
the following options, what you think is best for the country?
An honest but incompetent president or competent but dis-
honest president?
Table 2 shows the results of four logistic
regression models that detail which variables
are most important in distinguishing between
those citizens who prefer honest politicians
and those citizens who prefer dishonest but
competent politicians. The main difference
between models 1 and 2 on the one hand,
and 3 and 4 on the other hand, is that the fi rst
two only took into account those respon-
dents who voted and a distinction was esta-
blished as to the party they voted for. The last
two models took into account both the res-
pondents who voted and those who did not
vote in the last presidential elections. This
difference between the citizens who voted
and those who did not vote showed whether
those who prefer dishonest politicians are
actually active in terms of electoral participa-
tion. Models 1 and 2 made it possible to con-
trol for whether respondents related the abs-
tract question to a particular party.
Five sets of variables were taken into ac-
count in the analysis. They were connected
to political sophistication, fi nance, corrup-
tion, political participation, democracy and
socio-demographic characteristics. The re-
sults show that none of the variables related
to participation or corruption were signifi -
cant. This means that those citizens who se-
lect corrupt-competent politicians did not
participate in elections differently than those
who chose honest-incompetent politicians.
That is, they did not vote more often, nor did
they protest more. They also did not have
that attitude because they had a different
perception of corruption or due to victimisa-
tion.
A number of results stand out concerning
the remaining variables. Firstly, the data
analysed shows no difference in terms of
education levels. However, the degree of po-
litical knowledge of the respondent does su-
ggest differences. The higher the level of
political knowledge, the less likely the citizen
is to choose corrupt politicians. Specifi cally,
if one considers only those respondents who
voted in the last presidential elections, an in-
crease of one unit on the knowledge index
(measured 0-5, see Annex 1) decreases the
probability by 24.4 %. Considering all res-
pondents, the impact of knowledge is redu-
ced but still, the probability of choosing a
competent but dishonest candidate decrea-
ses by 15% for each unit increase on the
knowledge index, all other variables remai-
ning constant.
Secondly, the assessment of the general
economy or the personal fi nancial situation
of the respondent has no impact on the like-
lihood of preferring a corrupt candidate over
an honest one. Nevertheless, the level of
household income is statistically signifi cant.
Those respondents who come from house-
holds with higher income levels are more wi-
lling to support corrupt but competent politi-
cians. The increase in household income by
a single unit (on a scale of 0 to 10) increased
the probability of choosing a corrupt but
competent candidate by 13%, all other varia-
bles remaining constant. Moreover, this per-
centage remains constant for all models, re-
gardless of whether or not respondents
voted in the presidential elections.
Thirdly, there does not appear to be a re-
lationship between offsetting the lack of inte-
grity by competence and the degree of satis-
faction with democracy or the degree of
interpersonal trust. There is only a relations-
hip with the variable of support for the demo-
cratic system. Individuals who say they are
willing to elect a corrupt politician are in turn
Reis 153 05 Martinez Ingles.indd 86Reis 153 05 Martinez Ingles.indd 86 18/12/15 9:2518/12/15 9:25

María del Mar Martínez Rosón 87
Reis. Rev.Esp.Investig.Sociol. ISSN-L: 0210-5233. Nº 153, January - March 2016, pp. 77-92
TAB
LE 2
. Lo
gis
tic R
egre
ssio
n: Variab
les r
ela
ted
to
the c
hoic
e o
f d
ishonest
but
com
pete
nt
cand
idate
s.
M
od
el 1
Mo
del
2M
od
el 3
Mo
del
4
BS
.E.
Exp
(B)
BS
.E.
Exp
(B)
BS
.E.
Exp
(B)
BS
.E.
Exp
(B)
Univ
ers
ity
ed
ucation
–.0
86
.282
.918
–.0
83
.283
.921
–.2
25
.240
.799
–.2
27
.241
.797
Polit
ical k
no
wle
dge
–.2
80
.114
.756 **
–.2
67
.115
.766 **
–.1
72
.095
.842 *
–.1
62
.096
.851 *
Fam
ily in
com
e.1
26
.049
1.1
34 **
*.1
29
.049
1.1
38 **
*.1
24
.041
1.1
33 **
*.1
28
.041
1.1
36 **
*
Bad
pers
onal fi
nancia
l situation
.415
.319
1.5
14
.435
.320
1.5
45
–.0
45
.274
.956
–.0
13
.276
.987
Bad
econom
ic s
ituation in
countr
y–.2
42
.218
.785
–.2
59
.218
.772
–.2
35
.179
.791
–.2
47
.179
.781
Polic
e v
ictim
.2
57
.370
1.2
93
.253
.371
1.2
87
.001
.308
1.0
01
–.0
14
.309
.986
Civ
il serv
ant
victim
–.4
05
.437
.667
–.3
71
.439
.690
.070
.351
1.0
73
.091
.353
1.0
95
Perc
eiv
ed
corr
up
tion: hig
h.0
22
.281
1.0
22
.031
.281
1.0
32
–.0
84
.227
.919
–.0
71
.228
.932
Part
icip
ation: p
rote
st
.045
.258
1.0
46
.034
.260
1.0
35
.001
.217
1.0
01
–.0
01
.218
.999
Part
icip
ation: vo
te
.0
73
.199
1.0
75
.087
.200
1.0
90
Vote
d for
PLN
.025
.285
1.0
25
.044
.286
1.0
45
Vote
d for
PA
C–.0
01
.295
.999
.010
.296
1.0
10
Not
alw
ays
sup
port
ed
dem
ocra
cy
.380
.304
1.4
62
.387
.305
1.4
73
.485
.234
1.6
25 **
.478
.235
1.6
13 **
Dis
satisfi e
d w
ith d
em
ocra
cy
.064
.217
1.0
67
.079
.218
1.0
82
.228
.177
1.2
56
.240
.178
1.2
71
Inte
rpers
onal m
istr
ust
.224
.236
1.2
51
.233
.236
1.2
63
.078
.194
1.0
81
.077
.195
1.0
80
Male
.410
.216
1.5
07 *
.380
.218
1.4
62 *
.304
.179
1.3
55 *
.291
.179
1.3
38
Age
–.0
12
.007
.988 *
–.0
10
.006
.991 *
Fro
m 2
5 t
o 3
4
–.3
53
.302
.703
–.2
38
.242
.788
Fro
m 3
5 t
o 4
4
–.5
10
.321
.601
–.4
32
.266
.649
Fro
m 4
5 t
o 5
9
–.5
71
.318
.565 *
–.5
49
.262
.577 **
Ove
r 60 y
ears
old
–.5
66
.361
.568
–.4
10
.306
.663
Left-r
ight
–.0
33
.042
.968
–.0
33
.042
.968
–.0
51
.034
.950
–.0
50
.035
.951
Urb
an
.367
.236
1.4
44
.317
.238
1.3
73
.232
.194
1.2
61
.206
.195
1.2
29
Consta
nt
–.8
44
.574
.430
–.9
70
.563
.379 *
–.9
19
.454
.399 **
–1.0
38
.449
.354 **
Nagelk
erk
e R
2.0
75
.078
.064
.068
***
p v
alu
e ≤
0.0
1;
** p
valu
e ≤
0.0
5;
* p
valu
e ≤
0.1
.
Reis 153 05 Martinez Ingles.indd 87Reis 153 05 Martinez Ingles.indd 87 18/12/15 9:2518/12/15 9:25
Reis. Rev.Esp.Investig.Sociol. ISSN-L: 0210-5233. Nº 153, January - March 2016, pp. 77-92
88 I Prefer the Corrupt One: A Profi le of Citizens who Choose Dishonest but Competent Politicians
those for whom the type of regime is irrele-
vant, or that in certain situations can dispen-
se with the democratic model in favour of an
authoritarian regime. All other variables re-
maining constant, it is 60% more likely for
those who do not clearly support the demo-
cratic regime to opt for a dishonest but ca-
pable candidate than for those who do sup-
port the democratic system.
Finally, it is worth noting the impact of the
two socio-demographic variables, age and
gender. As for age, it was confi rmed that
young people are more tolerant of corruption
than older people (model 1 and 3). When ta-
king into account different age groups, it was
clear that the age range from 45 to up to 59
years is when the likelihood of voting for a
competent but corrupt candidate is statisti-
cally lower than in the 18 to 25 age range,
which represents the reference group (mo-
dels 2 and 4). Specifi cally, in the 49-59 age
range, support for capable but dishonest
candidates is approximately 42% lower than
among younger age ranges.
In terms of gender, women are less likely
to choose a competent but corrupt politician
than men. When taking into account only
those who actually voted, the differences
between men and women become more im-
portant. In particular, it is between 46% and
50% more likely for a male voter than for a
female voter to opt for a corrupt but compe-
tent politician. If the whole population is
taken into account, the difference between
men and women decreases, with a man
being approximately 34% more likely to
choose a dishonest politician than a woman.
CONCLUSION
Voters like good politicians. But sometimes
competent candidates who are also honest
are not available. Then the choice must be
made between a competent but dishonest
politician and an honest but less competent
politician. The choice made by citizens was
not unanimous. In the case analysed here the
baseline data shows that only 76.8% of Cos-
ta Ricans prefer honesty despite the fact that
there may not have good outcomes. Conver-
sely, if honesty is accompanied by incompe-
tence, only 23.2% are willing to do without
honesty. This paper has analysed what cha-
racteristics differentiate between citizens
who are willing to vote for dishonest but
competent representatives and citizens who
prefer honest politicians.
The results for the Costa Rican case
show that there are four key variables that
differentiate between them: political knowled-
ge, income, age and gender. Citizens who
have greater political knowledge are less wi-
lling to vote for a dishonest candidate. Wo-
men show a similar propensity. On the con-
trary, it is more likely that young people and
citizens with higher income levels will be
prepared to allow dishonesty to be offset by
ability. When we distinguish between citizens
who vote in the elections and those who do
not, to try and weigh up the possible impact
on the election results, the two variables of
gender and political knowledge show even
greater differences. While among the entire
population it is 35% more likely that men
would vote for a dishonest but competent
politician compared to women, if only the
proportion of the sample who actually vote is
considered, this percentage increases to
50%. With regard to the degree of political
knowledge, the percentage increases from
16% to 24%.
The analysis also showed that when con-
sidering all citizens, both voters and non-
voters, there is a clear relationship between
support for corrupt but competent politi-
cians, and support for the democratic sys-
tem. Citizens who are willing to replace de-
mocracy with another political system in
diffi cult situations are more likely to choose a
competent but corrupt politician. This proba-
bility is 60% greater for them than for citizens
who support democracy.
Reis 153 05 Martinez Ingles.indd 88Reis 153 05 Martinez Ingles.indd 88 18/12/15 9:2518/12/15 9:25
María del Mar Martínez Rosón 89
Reis. Rev.Esp.Investig.Sociol. ISSN-L: 0210-5233. Nº 153, January - March 2016, pp. 77-92
With regard to the literature, these results
reinforce some previous fi ndings, such as
those that were related to age (Torgler and
Valev, 2006, Bonifacio, 2013) and to political
knowledge (Funk, 1996). They also provide
clear results on some more controversial as-
pects, such as gender and income. However,
they do not support the relevance of some
variables that seemed to have a clear impact,
such as education level.
It should also be noted that in the analysis
of the results it was only possible to make
changes to one variable, the degree of politi-
cal knowledge. The data shows that even if
citizens have information about the candidate’s
profi le, they could vote for a corrupt politician,
but those who have more political knowledge
are less likely to do so. This sends a clear
message: it is essential that citizens have fur-
ther information, as it is only by making more
political information available to citizens that
they will be able to apprehend it. The main
advantage is that these changes are possible
and can be made within a short time, even if
the results can only be seen in the long term.
It is worth noting one caveat. These re-
sults correspond to a single case. Compara-
tive studies are needed in the future in diffe-
rent democracies, in order to analyse and
verify whether or not these fi ndings are appli-
cable to other cases. Other questions also
remain to be addressed by other researchers:
What is the real impact on election results?
Are there any differences depending on the
stage of development or quality of democra-
cy of a country? Are the results stable over
time or do they change? If there are changes,
what factors are involved?
BIBLIOGRAPHY
Abramowitz, Alan I. (1991). «Incumbency, Campaign
Spending, and the Decline of Competition in US
House Elections». Journal of Politics, 53(1): 34-56.
Almeida, Alberto Carlos (2007). A cabeça do brasileiro.
São Paulo: Record.
Bågenholm, Andreas (2013). «Throwing the Rascals
Out? The Electoral Effects of Corruption Allegations
and Corruption Scandals in Europe 1981-2011».
Crime, Law and Social Change, 60(5): 595-609.
Barómetro de las Américas, Proyecto de Opinión
Pública de América Latina (LAPOP), www.Lapop-
Surveys.org.
Bonifácio, Robert (2013). «A afeição dos cidadãos
pelos políticos mal-afamados: identifi cando os
perfi s associados à aceitação do “rouba, mas
faz” no Brasil». Opinião Pública, 19(2): 320-345.
Booth, John A. and Seligson, Mitchell A. (2005). «Po-
litical Legitimacy and Participation in Costa Rica:
Evidence of Arena Shopping». Political Research
Quarterly, 58(4): 537-550.
Bratton, Michael (2009). «Are You Being Served?:
Popular Satisfaction with Health and Education
Services in Africa». In: Bland, G. and Arnson, C.
J. (eds.). Democratic Defi cits: Addressing Chal-
lenges to Sustainability and Consolidation Around
the World. Washington: Woodrow Wilson Inter-
national Center for Scholars.
Bruner, Jerome S. and Korchin, Sheldon J. (1946).
«The Boss and the Vote: Case Study in City Poli-
tics». The Public Opinion Quarterly, 10(1): 1-23.
Caínzos, Miguel and Jiménez, Fernando (2000). «El
impacto de los escándalos de corrupción sobre
el voto en las elecciones generales de 1996».
Historia y Política, 4: 93-132.
Campbell, Angus; Gurin, Gerald and Miller, Warren E.
(1954). The Voter Decides. Evanston: Row Peterson.
Campbell, Angus; Converse, Philip E.; Miller, Warren
E. and Stokes, Donald E. (1960). The American
Voter. New York: John Wiley.
Canache, Damarys; Mondak, Jeffery J. and Cabrera,
Ernesto (2000). «Voters and the Personal Vote: A
Counterfactual Simulation». Political Research
Quarterly, 53(3): 663-676.
Chang, Eric C. C. and Kerr, Nicholas N. (2009). «Do
Voters Have Different Attitudes Toward Corrup-
tion? The Sources and Implications of Popular
Perceptions and Tolerance of Political Corrup-
tion». Afrobarometer Working Papers, 116.
Choi, Eunjung and Woo, Jongseok (2010). «Political
Corruption, Economic Performance, and Elec-
toral Outcomes: A Cross-National Analysis».
Contemporary Politics, 16(3): 249-262.
Deegan-Krause, Kevin; Klasnja, Marko and Tucker,
Joshua (2011). «It’s the Bribe, Stupid! Pocket-
book vs. Sociotropic Corruption». Paper presen-
Reis 153 05 Martinez Ingles.indd 89Reis 153 05 Martinez Ingles.indd 89 18/12/15 9:2518/12/15 9:25
Reis. Rev.Esp.Investig.Sociol. ISSN-L: 0210-5233. Nº 153, January - March 2016, pp. 77-92
90 I Prefer the Corrupt One: A Profi le of Citizens who Choose Dishonest but Competent Politicians
ted at Conference Annual APSA, September 1-4,
Seattle. http://ssrn.com/abstract=1899944.
Delgado Jiménez, Francisco (2013). «El empleo in-
formal en Costa Rica: características de los ocu-
pados y sus puestos de trabajo». Ciencias
Económicas, 31(2): 35-51.
Dimock, Michael A. and Jacobson, Gary C. (1995).
«The House Bank Scandal’s Impact on Voters in
1992». The Journal of Politics, 57(4): 1143-1159.
Dollar, David; Fisman, Raymond and Gatti, Roberta
(2001). «Are Women Really the “Fairer” Sex?
Corruption and Women in Government». Journal
of Economic Behavior and Organization, 46(4):
423-429.
Finan, Frederico and Ferraz, Claudio (2005). «Reelec-
tion Incentives and Political Corruption: Evidence
from Brazilian Audit Reports». Paper presented
to Annual Meeting of the American Agricultural
Economics Association, July 24-27, Providence,
RI.
Fiorina, Morris P. (1981). Retrospective Voting in Amer-
ican Elections. New Haven: Yale University Press.
Funk, Carolyn L. (1996). «The Impact of Scandal on
Candidate Evaluations: An Experimental Test of
the Role of Candidate Traits». Political Behavior,
18(1): 1-24.
Funk, Carolyn L. (1997). «Implications of Political Ex-
pertise in Candidate Trait Evaluations». Political
Research Quarterly, 50(3): 675-697.
Funk, Carolyn L. (1999). «Bringing the Candidate into
Models of Candidate Evaluation». Journal of
Politics, 61(3): 700-720.
Goetz, Anne Marie (2007). «Political Cleaners: Women
as the New Anti-Corruption Force?». Develop-
ment and Change, 38(1): 87-105.
Jacobson, Gary C. and Dimock, Michael A. (1994).
«The Effects of Bank Overdrafts on the 1992
House Elections». American Journal of Political
Science, 38(3): 601-624.
Jiménez, Fernando and Caínzos, Miguel (2004). «La
repercusión electoral de los escándalos políticos.
Alcance and condiciones». Revista Española de
Ciencia Política, 10: 141-170.
Johnston, Michael (1991). «Right & Wrong in British
Politics: “Fits of Morality” in Comparative Pers-
pective». Polity, 24(1): 1-25.
Kinder, Donald R.; Petres, Mark D.; Abelson, Robert
P. and Fiske, Susan T. (1980). «Presidential Pro-
totypes». Political Behavior, 2(4): 315-337.
Kinder, Donald R. (1983). Presidential Traits. Ann Ar-
bor: University of Michigan.
Kulisheck, Michael R. and Mondak, Jeffery J. (1996).
«Candidate Quality and the Congressional Vote:
A Causal Connection?». Electoral Studies, 15(2):
237-253.
Kumlin, Staffan and Esaiasson, Peter (2012). «Scandal
Fatigue? Scandal Elections and Satisfaction with
Democracy in Western Europe 1977-2007». British
Journal of Political Research, 42(2): 263-282.
Lehoucq, Fabrice (2005). «Costa Rica: Paradise in
Doubt». Journal of Democracy, 16(3): 140-154.
Maier, Jürgen (2011). «The Impact of Political Scan-
dals on Political Support: An Experimental Test
of Two Theories». International Political Science
Review, 32(3): 283-302.
Manzetti, Luigi and Wilson, Carole J. (2007). «Why Do
Corrupt Governments Maintain Public Support?».
Comparative Political Studies, 40(8): 949-970.
Martínez Rosón, María del Mar (2014). «The Good,
the Bad and the Winner. Buenos políticos and
éxito electoral en América Latina». Revista de
Ciencia Política, 34(2): 351-372.
McCurley, Carl and Mondak, Jeffery J. (1995). «In-
spected by #1184063113: The Infl uence of In-
cumbents Competence and Integrity in U.S.
House Elections». American Journal of Political
Science, 39(4): 864-885.
Mondak, Jeffery J. (1995). «Competence, Integrity, and
the Electoral Success of Congressional Incum-
bents». The Journal of Politics, 57(4): 1043-1069.
Morán, Mª Luz and Benedicto, Jorge (1995). La cul-
tura política de los españoles. Un ensayo de re-
interpretación. Madrid: CIS.
Muñoz, Jordi; Anduiza, Eva and Gallego, Aina (2013).
«Why Voters Forgive Corrupt Politicians? Im-
plicit Exchange, Noise and Cynicism». Paper
presented to Workshop «Citizen Responses to
Political Corruption: Elections and Accountabili-
ty», July 19, Barcelona.
Muñoz, Jordi and Esaiasson, Peter (2013). «Roba pero
hace? –An Experimental Test of the Competence-
corruption Tradeoff Hypothesis in Spain and Swe-
den». Paper presented to Workshop «Citizen Re-
sponses to Political Corruption: Elections and
Accountability», July 19, Barcelona.
Page, Benjamin I. (1978). Choices and Echoes in
Presidential Elections. Chicago: University of Chi-
cago Press.
Reis 153 05 Martinez Ingles.indd 90Reis 153 05 Martinez Ingles.indd 90 18/12/15 9:2518/12/15 9:25
María del Mar Martínez Rosón 91
Reis. Rev.Esp.Investig.Sociol. ISSN-L: 0210-5233. Nº 153, January - March 2016, pp. 77-92
Pereira, Carlos; Rennó, Lucio and Samuels, David
(2008). «Corruption, Campaign Finance, and
Electoral Accountability». Paper presented to
Workshop Accountability Institutions and Po-
litical Corruption in Brazil, Oxford University,
May 23.
Peters, John G. and Welch, Susan (1978). «Politics,
Corruption, and Political Culture. A View From
the State Legislature». American Politics Re-
search, 6(3): 345-356.
Poguntke, Thomas and Webb, Paul (2005). «The Pre-
sidentialization of Politics in Democratic Societies:
A Framework of Analysis». In: The Presidentializa-
tion of Politics. A Comparative Study of Modern
Democracies. Oxford: Oxford University Press.
Popova, Olga (2010). «Corruption, Voting and Em-
ployment Status: Evidence from Russian Parlia-
mentary Elections». CERGE-EI Working Papers,
428.
Popkin, Samuel L. (1991). The Reasoning Voter: Com-
munication and Persuasion in Presidential Cam-
paigns. Chicago: University of Chicago Press.
Prewitt, Kenneth (1970). The Recruitment of Political
Leaders. Indianapolis: Bobbs-Merrill.
Prysby, Charles (2008). «Perceptions of Candidate
Character Traits and the Presidential Vote in
2004». Political Science and Politics, 41(1): 115-
122.
Redlawsk, David P. and McCann, James A. (2002).
«How Voters See Political Corruption: Defi nitions
and Beliefs, Causes and Consequences». Paper
presented to Annual Meeting de SPSA, New Or-
leans, March 28-30.
Riera, Pedro; Barberá, Pablo; Gómez, Raúl; Mayoral,
Juan Antonio and Montero, José Ramón (2013).
«The Electoral Consequences of Corruption
Scandals in Spain». Crime, Law and Social
Change, 60(5): 515-534.
Rundquist, Barry S.; Strom, Gerald S. and Peters,
John G. (1977). «Corrupt Politicians and Their
Electoral Support: Some Experimental Observa-
tions». The American Political Science Review,
71(3): 954-963.
Sánchez, Fernando (2007). Partidos políticos, elec-
ciones y lealtades partidarias en Costa Rica: ero-
sión y cambio. Salamanca: Ediciones Universi-
dad de Salamanca.
Seligson, Mitchell A. (2002). «Trouble in Paradise?
The Erosion of System Support in Costa Rica,
1978-1999». Latin American Research Review,
37(1): 160-185.
Sousa, Luís de and Moriconi, Marcelo (2013). «Why
Voters Do Not Throw the Rascals Out? A Con-
ceptual Framework for Analysing Electoral Pu-
nishment of Corruption». Crime, Law and Social
Change, 60(5): 471-502.
Stoker, Laura (1993). «Judging Presidential Charac-
ter: The Demise of Gary Hart». Political Behavior,
15(2): 193-223.
Stone, Walter J.; Maisel, Sandy and Maestas, Cherie
D. (2004). «Quality Counts: Extending the Strategic
Politician Model of Incumbent Deterrence». Amer-
ican Journal of Political Science, 48(3): 479-495.
Sullivan, John L.; Aldrich, John H.; Borgida, Eugene and
Rahn, Wendy (1990). «Candidate Appraisal and Hu-
man Nature: Man and Superman in the 1984 Elec-
tion». Political Psychology, 11(3): 459-484.
Sung, Hung-En (2003). «Fairer Sex or Fairer System?
Gender and Corruption Revisited». Social Forces,
82(2): 705-725.
Swamy, Anand; Knack, Stephen; Lee, Young and
Azfar, Omar (2001). «Gender and Corruption».
Journal of Development Economics, 64(1): 25-55.
Torgler, Benno and Valev, Neven T. (2006). «Corruption
and Age». Journal of Bioeconomics, 8(2): 133-145.
Villoria, Manuel and Jiménez, Fernando (2012). «La
corrupción en España (2004-2010): datos, per-
cepción y efectos». Revista Española de Investi-
gaciones Sociológicas, 138: 109-134.
Welch, Susan and Hibbing, John (1997). «The Effect
of Charges of Corruption on Voting Behavior in
Congressional Elections, 1982-90». Journal of
Politics, 59(1): 226-239.
Winters, Matthew S. and Weitz-Shapiro, Rebecca
(2013). «Lacking Information or Condoning Cor-
ruption. When Do Voters Support Corrupt Politi-
cians?». Comparative Politics, 45: 418-436..
RECEPTION: August 26, 2014
REVIEW: November 27, 2014
ACCEPTANCE: May 13, 2015
Reis 153 05 Martinez Ingles.indd 91Reis 153 05 Martinez Ingles.indd 91 18/12/15 9:2518/12/15 9:25

Reis. Rev.Esp.Investig.Sociol. ISSN-L: 0210-5233. Nº 153, January - March 2016, pp. 77-92
92 I Prefer the Corrupt One: A Profi le of Citizens who Choose Dishonest but Competent Politicians
ANNEX 1. BASIC DATA OF THE VARIABLES INCLUDED IN THE LOGISTIC REGRESSION
VARIABLES AND QUESTIONS RE-CODINGRESPONSE
PERCENTAGE AND AVERAGE
Dependent variables (COSC7) 0 Honest/Incompetent
1 Dishonest/Competent
Independent variables
Political sophistication and education
Knowledge index (Bush, Lula, Pacheco,
number of provinces, legislative period)
(GI1. GI5.GI2. GI3. GI4)
Education (ED)
0 Least knowledge –
5 Most knowledge
0 Lower than University level
1 University level
Avg.=3.01
81.4%
18.6%
Finance and income
Family income (Q10)
Personal fi nancial situation (IDIO1)
Economic situation of country (SOCT1)
0 Low – 10 High
0 Normal or good; 1 Bad
0 Normal or good; 1 Bad
Avg.= 5.07
84.1%; 15.9%
47.9%; 52.1%
Tolerated and perceived corruption
Victim of police corruption (EXC2)
Victim of civil service corruption (EXC6)
Generalised civil servant corruption (EXC7)
0 No; 1 Yes
0 No; 1 Yes
0 Little or not generalised
1 Highly or somewhat generalised
91.3%; 8.7%
93.9%; 6.1%
15.9%
84.1%
Participation and democracy
Electoral participation (VB2)
Participation in protests (PROT1)
Support for democracy (DEM2)
Satisfaction with democracy (PN4)
Trust in people in the community (IT1)
0 Did not vote; 1 Voted
0 Did not participate; 1 Participated
0 Democracy is preferable
1 Not always democracy
0 Satisfi ed 1 Not satisfi ed
0 Trust; 1 Distrust
29.2%; 70.8%
82.8%; 17.2%
87.8%
12.2%
58.5%; 41.5%
72.7%; 27.3%
Socio-demographic variables
Gender (Q1)
Age (Q2)
Area (UR)
Ideological position (L1)
0 Woman; 1 Man
Age 18 – 93
0 Rural; 1 Urban
1 Left – 10 Right
51.2%; 48.8%
Avg.= 41 years old
37.2%; 62.8%
Avg.= 5.90
Reis 153 05 Martinez Ingles.indd 92Reis 153 05 Martinez Ingles.indd 92 18/12/15 9:2518/12/15 9:25
Reis. Rev.Esp.Investig.Sociol. ISSN-L: 0210-5233. Nº 153, Enero - Marzo 2016, pp. 77-94
María del Mar Martínez Rosón: Universidad de Burgos | [email protected]
Yo prefi ero al corrupto: el perfi l de los ciudadanos que eligen políticos deshonestos
pero competentes I Prefer the Corrupt One: A Profi le of Citizens who Choose Dishonest but
Competent Politicians
María del Mar Martínez Rosón
doi:10.5477/cis/reis.153.77
Palabras clave
Competencia• Comportamiento electoral• Conocimiento político• Corrupción• Costa Rica• Honradez
Resumen
Los resultados electorales muestran que los electores no siempre castigan a los políticos corruptos en las urnas y son capaces de votar a un político corrupto si este es competente. El objetivo de este trabajo es analizar las características que diferencian a los ciudadanos que están dispuestos a apoyar a los corruptos de los electores que no lo están a partir de datos de opinión pública en Costa Rica. Los resultados muestran que hay cuatro variables que diferencian ambos grupos: los conocimientos políticos, los ingresos, la edad y el género. Las mujeres y los ciudadanos con más conocimientos políticos eligen políticos deshonestos pero competentes en menor medida que los hombres y aquellos ciudadanos con menos conocimientos políticos. Por el contrario, los jóvenes y los ciudadanos con más ingresos están dispuestos a compensar la falta de honradez con más competencia en mayor medida que los adultos y aquellos con menores ingresos.
Key words
Competence• Electoral Behavior• Political knowledge• Corruption• Costa Rica• Honesty
Abstract
Electoral results show that voters do not always punish corrupt politicians at the ballot box and some will vote for corrupt candidates if they are competent. The aim of this paper is to analyse the characteristics that differentiate between citizens who are prepared to support corrupt politicians from voters who are not, based on public opinion data from Costa Rica. The results show that four variables differentiate between the two groups: political knowledge, income, age and gender. Women and citizens with more political knowledge choose dishonest but competent politicians to a lesser extent than men and those with low levels of political knowledge. However, young people and citizens with higher income levels are willing to allow dishonesty to be offset by better competence to a greater extent than adults and those with low income.
Cómo citar
Martínez Rosón, María del Mar (2016). «Yo prefi ero al corrupto: el perfi l de los ciudadanos que eligen políticos deshonestos pero competentes». Revista Española de Investigaciones Sociológicas, 153: 77-94.(http://dx.doi.org/10.5477/cis/reis.153.77)
La versión en inglés de este artículo puede consultarse en http://reis.cis.es
Reis. Rev.Esp.Investig.Sociol. ISSN-L: 0210-5233. Nº 153, Enero - Marzo 2016, pp. 77-94
78 Yo prefi ero al corrupto: el perfi l de los ciudadanos que eligen políticos deshonestos pero competentes
INTRODUCCIÓN1 En general, los ciudadanos cuando piensan
en un buen político lo defi nen como alguien
honrado y competente (Funk, 1999; Kinder,
1983; Kinder et al., 1980). Sin embargo, a la
vez se producen resultados electorales sor-
prendentes, donde candidatos que se alejan
de ese perfi l de buen político son premiados
en las urnas con el apoyo electoral sufi cien-
te como para resultar (re)electos. Esto suce-
de porque si bien la defi nición de un buen
político se hace sobre una lista de caracte-
rísticas ideales que los ciudadanos ordenan
en función de la importancia que otorgan a
cada una, en la vida real tienen que elegir
entre candidatos con una determinada com-
binación de características y no siempre
ambas, honradez y competencia, se en-
cuentran juntas.
El objetivo de este artículo es indagar en
qué forma se produce esa elección, tratando
de analizar qué cualidades son susceptibles
de ser sacrifi cadas en presencia de otras, así
como conocer los factores que afectan a esa
elección. En concreto se tratará de identifi car
las variables que diferencian a los ciudada-
nos más fi rmemente comprometidos con la
elección de candidatos honrados, de los
que, adoptando un criterio utilitario, prefi eren
la competencia por encima de la honradez si
ambas no se pueden lograr al mismo tiempo.
La respuesta a esta pregunta no solo sir-
ve para entender mejor las decisiones que
toman los electores sobre los candidatos
sino también para comprender el poder que
tienen ciertas variables como la corrupción
para quebrar la voluntad normativa de los
ciudadanos y limitar la rendición de cuentas.
Saber qué porcentaje de ciudadanos está
dispuesto a apoyar la corrupción y qué fac-
tores hacen tomar esa decisión ayuda a co-
1 Agradezco los comentarios y sugerencias realizados
por los dos revisores anónimos de la revista que sin duda
han ayudado a mejorar y enriquecer el documento fi nal.
nocer las posibilidades de que se mantenga
el statu quo o que, por el contrario, se pro-
duzca un cambio en el apoyo a los candida-
tos y a los partidos y, en último término, en
el sistema de partidos.
Hasta ahora los distintos estudios expe-
rimentales y de opinión pública no han ofre-
cido resultados defi nitivos. Es por ello que
resulta relevante continuar con los análisis si
estos ayudan a entender por qué se mantie-
nen altas tasas de elección y reelección de
políticos corruptos en todo el mundo (Chang
y Kerr, 2009). Igualmente los análisis sobre
corrupción ayudan a mejorar las políticas an-
ticorrupción implementadas en países en
desarrollo (Manzetti y Wilson, 2007). Cierta
parte de la literatura señala que cuando los
ciudadanos apoyan a políticos corruptos es
debido a la falta de información o por proble-
mas de coordinación. Sin embargo, la reali-
dad muestra que incluso contando con infor-
mación los ciudadanos pueden apoyar a
políticos deshonestos (Manzetti y Wilson,
2007; Jacobson y Dimock, 1994; Dimock y
Jacobson, 1995; Stoker, 1993).
Desde el punto de vista sustantivo la di-
ferencia fundamental de este artículo con
respecto a trabajos previos es la inclusión de
una variable que considera si los ciudadanos
han sido o no víctimas de la corrupción. Son
escasos los estudios que, centrándose en la
compensación de la corrupción con altos
grados de competencia2, tienen en cuenta el
impacto de las experiencias de los ciudada-
nos con la corrupción (Deegan-Krause et al.,
2011). Por otro lado, y en comparación con
otros trabajos que utilizan diseños experi-
mentales, los datos de este análisis proce-
den de una muestra representativa de toda
la población a la cual se le ha preguntado
directamente sobre la cuestión. Para ello se
2 Sobre el mecanismo de compensación véanse Bruner
y Korchin (1946), Rundquist et al. (1977), Funk (1996),
Caínzos y Jiménez (2000), Muñoz y Esaiasson (2013),
Muñoz et al. (2013), Winters y Weitz-Shapiro (2013), Pe-
reira et al. (2008) y Bonifácio (2013).
María del Mar Martínez Rosón 79
Reis. Rev.Esp.Investig.Sociol. ISSN-L: 0210-5233. Nº 153, Enero - Marzo 2016, pp. 77-94
han utilizado los datos de opinión pública
recabados por la Universidad de Vanderbilt
en el proyecto Barómetro de las Américas
(LAPOP)3 que realiza sus encuestas cada
dos años e incluye a los países del continen-
te americano. A pesar de la amplitud de ca-
sos y datos, la temática de este artículo ha
sido poco tratada por este grupo de investi-
gación y únicamente es posible contar con
datos para un país, Costa Rica4.
Los resultados muestran que los conoci-
mientos políticos, los ingresos familiares, la
edad y el género son variables importantes
que establecen diferencias entre los ciuda-
danos que prefi eren diputados competentes
aunque esto signifi que comprometer su hon-
radez y aquellos que eligen la honradez aun-
que esto suponga una menor competencia.
Las mujeres y los ciudadanos con más cono-
cimientos políticos eligen al deshonesto en
menor medida que los hombres y que los
ciudadanos con menos conocimientos polí-
ticos. Por otro lado, los jóvenes y los ciuda-
danos con más ingresos están dispuestos a
compensar la falta de honradez si hay com-
petencia en mayor medida que los adultos y
aquellos con menores ingresos.
Aunque Costa Rica se organiza política-
mente bajo un sistema presidencialista, los
resultados pueden ser relevantes también
para otros casos, como el español, que
cuentan con un régimen parlamentario.
Como Poguntke y Webb (2005) señalan, en
los últimos años se ha producido de forma
generalizada un proceso de presidencializa-
ción de los sistemas parlamentarios sin un
cambio en las reglas formales. Este proceso
se traduce en un incremento de los recursos
y de la autonomía del líder dentro de la es-
tructura del partido, dentro del gobierno y en
3 Agradezco al proyecto de Opinión Pública de América
Latina (LAPOP) y a sus principales donantes por poner
a disposición los datos.
4 El acceso a las bases y los cuestionarios está dispo-
nible en www.LapopSurveys.org.
la campaña electoral. La presidencialización,
por tanto, nos permite considerar la aplica-
ción de los resultados en otros contextos y
en otros análisis sobre la importancia que
tienen algunas características del líder para
los ciudadanos y cómo infl uyen en el com-
portamiento electoral.
El artículo se organiza de la siguiente for-
ma. En primer lugar, se ofrecen algunas pre-
cisiones teóricas sobre las características
más valoradas en los políticos. En segundo
lugar, se analiza el impacto esperado de un
conjunto de variables en la valoración de las
características de los políticos que pueden
infl uir sobre los electores para que estos sa-
crifi quen la honradez en presencia de com-
petencia. En tercer lugar, se realiza un análi-
sis de regresión logística para medir el grado
de infl uencia de estas variables sobre su
elección. El artículo fi naliza con el compen-
dio de los hallazgos más interesantes y sus
implicaciones.
LAS CUALIDADES DE LOS POLÍTICOS
Una de las razones por las cuales los inves-
tigadores comenzaron a fi jarse en las cuali-
dades de los candidatos fue el interés de
estos por entender la decisión de voto de los
ciudadanos. La literatura buscaba ampliar el
número de variables que sirvieran para expli-
car el proceso por el cual se producía el paso
desde la fase de candidatura a la fase de
cargo electo (Campbell et al., 1954, 1960;
Prewitt, 1970). El hecho de que la política
americana estuviera centrada en su mayoría
en candidatos que se postulaban a sí mis-
mos y la decreciente importancia de la iden-
tifi cación ideológica y los issues políticos en
los resultados electorales, hizo girar las in-
vestigaciones hacia aspectos individuales.
De esta forma se trató de identifi car qué ca-
racterísticas personales tenían en cuenta los
electores a la hora de votar, así como deter-
minar qué aspectos de los candidatos eran
más valorados (Martínez Rosón, 2014).
Reis. Rev.Esp.Investig.Sociol. ISSN-L: 0210-5233. Nº 153, Enero - Marzo 2016, pp. 77-94
80 Yo prefi ero al corrupto: el perfi l de los ciudadanos que eligen políticos deshonestos pero competentes
Sin embargo, las características de los
candidatos importan no solo por la valoración
que los ciudadanos pueden hacer de ellas,
sino también porque tienen otras consecuen-
cias políticas. Diversos investigadores han
demostrado que las características persona-
les infl uyen en la decisión del voto (Kulisheck
y Mondak, 1996; Prysby, 2008), en las posibi-
lidades de reelección (Abramowitz, 1991; Fi-
nan y Ferraz, 2005; Stone et al., 2004), en los
resultados de las elecciones primarias (Mon-
dak, 1995; Welch y Hibbing, 1997) o en la
campaña electoral (Funk, 1997 y 1999). La
evaluación de estas cualidades no debe ser
juzgada como una actividad superfl ua, sino
que debe ser entendida como un atajo para la
toma racional de decisiones (Fiorina, 1981, y
Page, 1978) que se realiza de forma espontá-
nea (Canache et al., 2000; McCurly y Mondak,
1995; Popkin, 1991; Sullivan et al., 1990).
Además, la inclusión de estos datos no está
subyugada a la ausencia de otra información.
Independientemente de que exista informa-
ción sobre políticas o ideología y de la canti-
dad de datos personales que estén disponi-
bles, estos serán tenidos en cuenta por los
electores (Kulisheck y Mondak, 1996).
Pero ¿cuáles son las cualidades más im-
portantes para los ciudadanos? Lo más habi-
tual ha sido que los investigadores hayan in-
cluido en sus análisis un número variable de
cualidades potencialmente importantes. Así,
las propuestas que se encuentran en la litera-
tura oscilan entre esquemas muy simples que
recogen un par de aspectos hasta otras que
listan un sinfín de características5: moralidad,
honestidad, inteligencia, liderazgo, justicia,
debilidad, empatía, resolución, inspiración,
decencia, ejemplaridad, compasión, aten-
ción… Sin embargo, la mayor parte de las
investigaciones han llegado a la conclusión
de que la honradez y la competencia son las
5 Para ver una lista completa se pueden consultar los
cuestionarios del American National Election Studies
aplicados desde 1980 en Estados Unidos. http://www.
electionstudies.org/
dos características con más peso en las valo-
raciones que realizan los ciudadanos de los
candidatos (Funk, 1996, 1997 y 1999; Kinder,
1983; Kinder et al., 1980).
Además, es habitual encontrar el argumen-
to de que un elector prefi ere a un político hon-
rado que a uno corrupto, a uno capaz frente a
uno incapaz. Pero lo cierto es que, como se
verá en este artículo, hay ciudadanos que
cuando tienen que elegir prefi eren dejar de
lado la honradez frente a otros valores como
la competencia. En Costa Rica, el 23,2% de
los entrevistados prefi ere elegir a un diputado
competente pero deshonesto que a un dipu-
tado honesto pero incompetente (76,8%). Asi-
mismo, un 36,6% de los entrevistados prefi ere
a un diputado con buenas ideas aunque sea
deshonesto, mientras que el 63,4% elige a un
diputado honesto aunque carezca de buenas
ideas6. Estos datos están en consonancia con
lo que se ha encontrado en otros casos. En
Brasil, por ejemplo, en el año 2002 el 39,6%
de los entrevistados prefería a un político que
desarrollara mucho trabajo público aunque
robara un poco que a un político que no roba-
ra nada pero que hiciera poco trabajo público.
En el año 2006 el porcentaje había disminuido
hasta el 16,2% (Bonifácio, 2013).
Asimismo, diversos trabajos han mostra-
do el desgaste limitado que los escándalos
tienen en los porcentajes de voto de algunos
políticos (Peters y Welch, 1978; Jiménez y
Caínzos, 2004; Bågenholm, 2013)7. Según
Abramowitz (1991), entre 1984 y 1986 los di-
putados del Congreso de EE.UU. que se pre-
sentaban a la reelección, pero que estaban
involucrados en escándalos, vieron reducir
sus márgenes de voto en un 11,9% y tres de
cada siete perdieron el escaño. En el análisis
de Welch y Hibbing (1997) los políticos en el
6 Véase el Anexo I y tabla 5.
7 El impacto de los escándalos y de la corrupción pue-
de ser observado también como un mecanismo de con-
trol indirecto por parte de la élite a través de la fi nancia-
ción (Pereira et al., 2008).

María del Mar Martínez Rosón 81
Reis. Rev.Esp.Investig.Sociol. ISSN-L: 0210-5233. Nº 153, Enero - Marzo 2016, pp. 77-94
cargo acusados recibían un 10% menos de
votos que aquellos que no tenían ninguna
acusación. A pesar de esto, solo el 25% lle-
gaba a perder la elección. En el caso brasi-
leño, según Pereira et al. (2008), mientras
que el 61% de los diputados implicados en
un escándalo intenta ser reelegido, entre los
diputados no implicados este porcentaje
aumenta hasta el 75%. Además, el éxito
electoral es mayor entre los candidatos lim-
pios (el 75% logra la reelección) que entre
los diputados acusados (42%)8.
Estos datos generan una pregunta inme-
diata: ¿por qué los electores votan a políticos
corruptos? Según de Sousa y Moriconi (2013),
los ciudadanos tienen que tener información
sufi ciente sobre los hechos, la motivación
para usar esa información y la capacidad para
castigar a los políticos por ello. Sin embargo,
aun contando con la información, la motiva-
ción y la capacidad pueden no hacerlo. Los
investigadores han explorado diversas razo-
nes por las cuales la corrupción puede tener
un impacto limitado en la elección9. En este
artículo se explora la posibilidad de que los
ciudadanos estén dispuestos a elegir a un po-
lítico corrupto si este es competente. La exis-
tencia de este mecanismo de compensación
ha sido observada en distintos contextos
como España (Caínzos y Jiménez, 2000; Mu-
ñoz y Esaiasson, 2013; Muñoz et al., 2013),
entre las clases altas de Brasil (Winters y
Weitz-Shapiro, 2013), Estados Unidos (Funk,
1996) o Suecia (Muñoz y Esaiasson, 2013),
aunque algunos autores minimizan su impor-
tancia (Pereira et al., 2008; Bonifácio, 2013).
Este trabajo trata de profundizar en las
características que modelan este proceso.
8 Según Choi y Woo (2010), los políticos corruptos tienen
mejor rendimiento electoral ya que la corrupción solo
afecta a los resultados electorales de forma signifi cativa
cuando no se produce un nivel de crecimiento econó-
mico sufi ciente.
9 Existen otras razones para elegir a un corrupto que
aparecen sintetizadas en el trabajo de Sousa y Morico-
ni (2013).
La elección de honradez o competencia pue-
de verse afectada por otras variables (como
la educación, el grado de sofi sticación polí-
tica, la ideología o la edad) vinculadas tanto
al ciudadano como al político evaluado. Para
este análisis, sin embargo, hay algunas cues-
tiones que resultan irrelevantes, ya que los
datos no están referidos a un candidato real
o imaginado sino que se pregunta de forma
abstracta la preferencia del ciudadano ante
la disyuntiva de elegir entre competencia y
honradez. Es por ello que se puede prescin-
dir de aquellas características referidas al
político o al candidato, ya que los encuesta-
dos carecen de esa información. Por el con-
trario, se incluyen variables referidas al ciu-
dadano entre las que destacan aspectos
poco tratados por la literatura, como son la
percepción del grado de corrupción general
y haber sido víctima de actos de corrupción.
A continuación se analiza el impacto que se
prevé que pueden tener cinco grupos de va-
riables sobre la preferencia por políticos co-
rruptos pero efectivos: los conocimientos
políticos y la educación; el grado de percep-
ción de la corrupción y la victimización; par-
ticipación y cultura política; ingresos y eco-
nomía; y, fi nalmente, el género y la edad.
Además, se controlará el efecto de otras
variables como la ideología, el partido al que
votó en las últimas elecciones y la ubicación
territorial (rural-urbano).
FACTORES QUE INFLUYEN EN LA PREFERENCIA POR POLÍTICOS DESHONESTOS
Dado que el análisis del éxito de políticos
corruptos o deshonestos es relativamente
reciente y escaso, en general, la mayor parte
de la literatura se ha basado en la relación
entre variables desarrollada por las explica-
ciones sobre el voto. En este caso se ha acu-
dido a toda aquella literatura que ofrece una
explicación teórica específi ca sobre la in-
fl uencia de la competencia y de la corrupción
y a partir de esta se ha adaptado su impacto

Reis. Rev.Esp.Investig.Sociol. ISSN-L: 0210-5233. Nº 153, Enero - Marzo 2016, pp. 77-94
82 Yo prefi ero al corrupto: el perfi l de los ciudadanos que eligen políticos deshonestos pero competentes
esperado sobre la elección de competencia
en ausencia de honradez. De este modo se
ha especifi cado un conjunto de hipótesis de
trabajo sobre las que se realiza el análisis es-
tadístico.
Conocimientos políticos y educación
Algunos autores han encontrado que los ciu-
dadanos con mayores niveles de educación
toleran la corrupción en menor medida que
los menos formados (Almeida, 2007; Bonifá-
cio, 2013) por tener una mayor capacidad
para entender y prever las consecuencias
políticas, económicas y sociales que de esta
se derivan. Sin embargo, otros autores mati-
zan estos hallazgos. Los resultados ofreci-
dos por el trabajo de Kinder (1983) pusieron
de manifi esto que para los más instruidos la
competencia era más importante que para
aquellos con un menor nivel educativo. Años
después este resultado seguía siendo válido.
Funk (1996) encontró que los individuos con
más conocimientos políticos dan más impor-
tancia a la competencia, en las evaluaciones
de los políticos, que los ciudadanos con me-
nores conocimientos políticos. Además, los
ciudadanos con más conocimientos eran
capaces de seguir valorando la competencia
de un político a pesar de que este fuera pro-
tagonista de un escándalo políticamente no
relevante. Lo que no queda claro a partir de
este estudio es qué sucede cuando el pro-
blema sí es políticamente relevante. Si esto
puede signifi car que los ciudadanos más
educados y con más conocimientos políticos
valoren la competencia incluso si esto signi-
fi ca sacrifi car la honradez, o si por el contra-
rio anteponen la honradez a la competencia.
Dados estos resultados se plantean aquí dos
hipótesis alternativas. Puede suceder que:
H1: los ciudadanos con mayor nivel educativo
prefi eran políticos honrados aunque in-
competentes con mayor probabilidad que
los ciudadanos menos formados, y que
H2: los ciudadanos con más conocimientos
políticos prefi eran a políticos honrados
aunque incompetentes con mayor pro-
babilidad que los ciudadanos con me-
nos conocimientos políticos.
O por el contrario podemos esperar que:
H1a: los ciudadanos con mayor nivel educa-
tivo prefi eran a los políticos deshones-
tos aunque competentes con mayor
probabilidad que los ciudadanos menos
formados y que
H2a: los ciudadanos con más conocimientos
políticos prefi eran a los políticos desho-
nestos aunque competentes con mayor
probabilidad que los ciudadanos con
menos conocimientos políticos.
Corrupción soportada y percibida
Aunque la literatura ha mostrado cómo las
acusaciones de corrupción tienen un efecto
claro tanto en las valoraciones que emiten
los ciudadanos como en el voto, los inves-
tigadores no han prestado sufi ciente aten-
ción a cómo la corrupción que percibe o
sufre un ciudadano afecta a los criterios de
evaluación y elección. Aquellos ciudadanos
que han sido víctimas de la corrupción pue-
den estar altamente sensibilizados con esta
cuestión y preferir a un político torpe pero
honesto que al revés. Pero también puede
suceder que una sociedad que soporta al-
tos grados de corrupción haya llegado a
asumir ese problema como inevitable y con-
sidere que todos los políticos son corruptos
y por tanto no tenga en cuenta esta carac-
terística a la hora de valorarlos (Finan y Fe-
rraz, 2005). Esta posibilidad, aunque sor-
prendente, donde las víctimas de la
corrupción tienden a aceptar estos meca-
nismos, ha sido identifi cada entre ciudada-
nos de países africanos (Bratton, 2009;
Chang y Kerr, 2009). De confi rmarse esta
relación cabría esperar que:
H3: los ciudadanos víctimas de la corrup-
ción prefi eran a diputados capaces
aunque deshonestos con mayor pro-
María del Mar Martínez Rosón 83
Reis. Rev.Esp.Investig.Sociol. ISSN-L: 0210-5233. Nº 153, Enero - Marzo 2016, pp. 77-94
babilidad que los ciudadanos que no
han sufrido directamente la corrup-
ción.
En caso contrario cabría esperar que:
H3a: aquellos ciudadanos que han sufrido
actos de corrupción prefi eran a un dipu-
tado honesto aunque este no sea com-
petente con mayor probabilidad que
aquellos que no han sufrido actos de
corrupción.
Además de esta variable de victimización,
también hay que tener en cuenta el nivel de
percepción general de corrupción de los ciu-
dadanos. Deegan-Krause et al. (2011) anali-
zaron el impacto de la percepción general de
la corrupción (sociotrópica) y de la experien-
cia personal con la corrupción (egotrópica)
sobre el voto. En sus resultados encontraron
que las percepciones de más corrupción y
mayores niveles de victimización estaban re-
lacionadas con una probabilidad de voto me-
nor al partido en el gobierno. Sin embargo, y
contradiciendo estudios previos, pudieron
concluir que los niveles de corrupción sopor-
tados tienen un mayor efecto en el compor-
tamiento electoral que la percepción del nivel
de corrupción general del país. Según estos
autores la diferencia frente a otros resultados
viene explicada por las características espe-
cífi cas de los países objeto de estudio, sien-
do que en países en transición la percepción
generalizada es menos importante que la in-
dividual. Dado que Costa Rica es un país con
un sistema democrático de más de 60 años10
cabe esperar que:
H4: el impacto de la variable de corrupción
sociotrópica en las preferencias sea
más importante que el impacto de la va-
riable egotrópica.
10 Sobre el sistema político democrático costarricense
pueden consultarse Booth y Seligson (2005), Lehoucq
(2005), Sánchez (2007) y Seligson (2002).
Participación y cultura política
La literatura también ha buscado las co-
nexiones entre la corrupción y diversas va-
riables habituales en los estudios de cultura
política, como la participación política o la
satisfacción con la democracia. El hecho de
que los ciudadanos que están dispuestos a
votar a políticos corruptos sean a su vez los
que tienen una mayor o menor participación
electoral es una cuestión fundamental. Si un
porcentaje alto de ciudadanos prefi ere a un
corrupto, pero no son electoralmente acti-
vos, su infl uencia sobre los resultados des-
aparece. Por el contrario, si son altamente
participativos su impacto en los resultados
electorales aumenta.
De igual forma la existencia de una sub-
cultura política contraria a la cultura política
dominante puede ser un reto si aquella está
basada en valores incompatibles con la de-
mocracia.
Aquí se consideran cinco variables habi-
tuales en los trabajos sobre cultura política
(Morán y Benedicto, 1995): la participación
electoral, la participación en protestas, el
apoyo a la democracia, el grado de satisfac-
ción con el funcionamiento de la democracia
y la confi anza interpersonal. Con respecto a
la participación electoral y de protesta no se
encuentran resultados previos que permitan
establecer las hipótesis en una determinada
dirección. Por tanto es posible que haya:
H5: una mayor participación electoral y de
protesta entre los ciudadanos que pre-
fi eren a diputados honrados aunque in-
competentes que entre aquellos ciuda-
danos dispuestos a compensar la falta
de honradez con competencia.
Pero también se puede encontrar en los
datos que haya:
H5a: una mayor participación electoral y de
protesta entre los ciudadanos que pre-
fi eren a diputados deshonestos pero
competentes.

Reis. Rev.Esp.Investig.Sociol. ISSN-L: 0210-5233. Nº 153, Enero - Marzo 2016, pp. 77-94
84 Yo prefi ero al corrupto: el perfi l de los ciudadanos que eligen políticos deshonestos pero competentes
Por otro lado, Maier (2011), en su análisis
experimental en Alemania, encuentra que los
escándalos tienen un efecto negativo en el
sistema político. Sin embargo, este impacto
solo afecta al apoyo a los políticos y a los
partidos mientras que la confi anza en las ins-
tituciones y la satisfacción con la democra-
cia no se ven afectadas por los escándalos.
Esta ausencia de impacto sobre la satisfac-
ción con la democracia se produce en la ac-
tualidad debido a una fatiga de los ciudada-
nos, que cuantos más escándalos han vivido
mayor capacidad tienen para ponderar su
incidencia y, por tanto, menos consecuen-
cias se derivan de los mismos (Kumlin y Es-
aiasson, 2012). Sin embargo, otros autores sí
han encontrado evidencias y defi enden que
la percepción de corrupción está relacionada
de manera negativa con la satisfacción con
la democracia. Así, Villoria y Jiménez (2012)
encuentran en el caso español que aquellos
ciudadanos que perciben más corrupción
son a su vez los que tienen menor satisfac-
ción con la democracia. Teniendo esto último
en cuenta cabe esperar que:
H6: aquellos ciudadanos que declaran un
nivel alto de apoyo y satisfacción con la
democracia elegirán con mayor proba-
bilidad a políticos honrados que aque-
llos entrevistados con bajos niveles de
apoyo y satisfacción.
Igualmente estos autores han encontrado
evidencias de que la percepción de corrup-
ción está relacionada de manera negativa
con la confi anza interpersonal. Esto es así
porque en las sociedades donde hay des-
confi anza sobre los demás ciudadanos se
piensa que los demás no van a actuar hones-
tamente, de manera que lo racional es pro-
ceder de manera indebida, de forma que la
desconfi anza refuerza el incumplimiento de
las normas (Villoria y Jiménez, 2012). Por
ello, se espera que:
H7: los entrevistados con un nivel alto de
confi anza interpersonal elijan a políticos
honrados con mayor probabilidad que
los ciudadanos con niveles bajos de
confi anza interpersonal.
Situación económica e ingresos
Algunos estudios han tratado de establecer
una relación entre la aceptación de la corrup-
ción y la situación laboral (Popova, 2010), la
clase social11 (Winters y Weitz-Shapiro,
2013) o los ingresos (Redlawsk y McCann,
2002). Teniendo en cuenta que la corrupción
aumenta la pobreza y la desigualdad, y que
genera una menor carga en las fi nanzas de
las clases más favorecidas (Winters y Weitz-
Shapiro, 2013: 427), cabría esperar un mayor
rechazo a candidatos corruptos entre los
grupos más desfavorecidos. Sin embargo,
los resultados no han sido defi nitivos en to-
dos los casos (Riera et al., 2013) y podemos
encontrar evidencia empírica que va en sen-
tidos opuestos. Winters y Weitz-Shapiro
(2013) sí encuentran un mayor apoyo a la
transacción entre competencia y corrupción
entre las clases altas brasileñas. Sin embar-
go, Redlawsk y McCann (2002) no encuen-
tran relación alguna entre la aceptación de la
corrupción e ingresos y el análisis de Bonifá-
cio (2013) muestra que entre los ciudadanos
con más renta hay menos posibilidades de
aceptar la compensación de la corrupción
por competencia. Sin un sentido claro en la
relación entre ambas variables compartido
por la literatura se presentan las dos hipóte-
sis alternativas que señalan que:
H8: entre aquellas personas con mayores
ingresos se espera, con mayor probabi-
lidad, que se compense la corrupción
con competencia, o que
H8a: entre aquellas personas con menores
ingresos haya más probabilidad de
compensar la corrupción con compe-
tencia.
11 Entendida por estos autores como una combinación
de acceso a determinados bienes y la educación del
cabeza de familia.
María del Mar Martínez Rosón 85
Reis. Rev.Esp.Investig.Sociol. ISSN-L: 0210-5233. Nº 153, Enero - Marzo 2016, pp. 77-94
Para analizar esta cuestión se van a tener
en cuenta los ingresos familiares totales así
como la percepción general de la situación
económica del país y la situación económica
propia. La extensión del trabajo informal en
Costa Rica, cifrada en torno al 40% (Delgado
Jiménez, 2013) y la gran proporción de per-
sonas jubiladas o estudiantes que en la en-
cuesta se consideran de forma automática
como no trabajadores hace que los ingresos
familiares sea una variable más apropiada
que la situación laboral.
Género y edad
El género y la edad son variables habituales
en los análisis de las características de los
candidatos y del impacto de la corrupción12.
En un estudio basado en la encuesta mun-
dial de valores, Swamy et al. (2001) defi en-
den que las mujeres participan menos que
los hombres en actividades corruptas y tam-
bién es menos probable que justifi quen estas
actividades. El origen de esta diferencia en-
tre ambos sexos puede deberse a distintas
razones. Las mujeres pueden ser menos co-
rruptas debido a diferencias en el proceso de
socialización, a la falta de conocimiento so-
bre el procedimiento y los mecanismos co-
rruptos o a una mayor difi cultad en el acceso
a las redes de corrupción, entre otras (Swamy
et al., 2001). Sea cual sea la causa, estas
diferencias provocan que en aquellos países
donde la presencia de mujeres en el parla-
mento y en el ámbito laboral sea mayor se
encuentren menores niveles de corrupción
(Swamy et al., 2001; Dollar et al., 2001)13. Si
es cierto que las mujeres participan menos
12 Según Redlawsk y McCann, las mujeres y los ciuda-
danos más mayores aplican la etiqueta de corrupción a
un mayor número de comportamientos políticos aunque
estos no sean estrictamente ilegales (2002).
13 Otros autores defi enden que esta relación es espuria
y que está causada por los efectos de la democracia
liberal (igualdad de género y mejor gobernanza) y no por
la mayor presencia de mujeres (Sung, 2003; Goetz,
2007).
en actividades corruptas es lógico pensar
que tampoco apoyarán actividades de este
tipo. Por ello, cabe esperar que:
H9: las mujeres prefi eran a políticos honra-
dos-incompetentes con mayor probabi-
lidad que los hombres.
La edad también tiene un impacto sobre
la justifi cación de la corrupción. En un estu-
dio longitudinal con datos de ocho países
europeos, Torgler y Valev (2006) encuentran
que, una vez controlados por los efectos de
cohorte, los jóvenes menores de 30 años son
más propensos a percibir la corrupción como
un hecho justifi cable que los ciudadanos que
superan esa edad. Resultados similares han
sido puestos de manifi esto en el caso brasi-
leño (Bonifácio, 2013). Si, como estos auto-
res defi enden, la edad disminuye la toleran-
cia hacia la corrupción, cabe esperar que:
H10: la preferencia por políticos corruptos
pero competentes sea mayor entre los
jóvenes que entre los encuestados
adultos.
Finalmente, se tendrá en cuenta la ideo-
logía política de los ciudadanos y su ubica-
ción en un contexto urbano o rural. En cuan-
to a la ideología hay que señalar que si bien
en investigaciones realizadas a partir de can-
didatos reales y fi cticios esta variable es muy
importante, en este caso, puesto que la pre-
gunta no está asociada con ningún candida-
to, se incluye como una variable de control.
En la literatura, Johnston (1991) encontró
una relación moderada en el Reino Unido en-
tre el apoyo a candidatos conservadores y
aquellos que juzgan más estrictamente los
actos corruptos. Por otro lado, en cuanto a
la segunda variable parece que el contexto
local también tiene infl uencia sobre la per-
cepción de la corrupción. En un estudio ex-
ploratorio sobre las elecciones presidencia-
les en Estados Unidos en el año 2000,
Redlawsk y McCann (2002) plantean que los
ciudadanos que residen en poblaciones pe-
queñas tienen una visión de la corrupción
Reis. Rev.Esp.Investig.Sociol. ISSN-L: 0210-5233. Nº 153, Enero - Marzo 2016, pp. 77-94
86 Yo prefi ero al corrupto: el perfi l de los ciudadanos que eligen políticos deshonestos pero competentes
más amplia que aquellos que residen en
grandes ciudades.
DATOS Y ANÁLISIS
La puesta en marcha en el ámbito latinoame-
ricano de un proyecto de opinión pública con
un cuestionario común ha permitido a los
investigadores abrir un nuevo espacio de
análisis en la región. Lamentablemente el
Barómetro de las Américas solo exploró la
valoración de las características personales
de los políticos en el caso de Costa Rica y
solo en la ronda de entrevistas de 2006. El
cuestionario incluyó dos preguntas diferen-
tes donde se indaga sobre tres de las carac-
terísticas de la personalidad: honestidad,
capacidad y buenas ideas. Lógicamente la
inclusión de solo estos tres datos no permite
realizar un análisis sobre cuáles son las cua-
lidades más importantes para los ciudada-
nos latinoamericanos y se da por hecho que
la honradez y la capacidad son también las
características personales más relevantes. A
pesar de estas limitaciones los datos dispo-
nibles permiten explorar otras relaciones y
analizar cómo las variables independientes
que se han señalado previamente (conoci-
mientos políticos, educación, percepción de
la corrupción, participación, ingresos, géne-
ro y edad) inciden en la ordenación de las
cualidades preferidas.
Por otro lado, la pregunta que se aplica
en el cuestionario de LAPOP se realiza de
forma abstracta, sin identifi car a ningún po-
lítico ni cargo en concreto. Esta redacción
supone algunas desventajas en el análisis,
pero también ofrece algunas ventajas. Entre
las primeras cabe destacar que en cierta me-
dida limita la aplicación de algunos hallazgos
teóricos. Mientras que cuando hay un líder
concreto con ciertas características, ya sea
real o creado en un experimento, existe la
posibilidad de comparar determinadas varia-
bles del individuo evaluador con las del eva-
luado (como la posición ideológica, el parti-
do de pertenencia/simpatía o la posición en
políticas públicas), en una pregunta abstrac-
ta esa comparación no es posible. Entre las
ventajas cabe señalar que la ordenación de
las cualidades no está sesgada por la ima-
gen de un líder real y su background, dando
lugar a una respuesta más generalista.
Los datos muestran que entre las dos ca-
racterísticas, si hay que elegir, es la honesti-
dad la que despierta más interés entre los
ciudadanos (tabla 1). La mayoría de los en-
trevistados prefi eren la honestidad aun cuan-
do eso signifi que que el político sea incapaz
(76,8%). Sin embargo, existe un 23,2% de
ciudadanos que está dispuesto a pasar por
alto la falta de honradez si hay garantía de
competencia.
TABLA 1. Honestidad y capacidad en Costa Rica
Honestidad vs. capacidad %
Honesto pero incapaz 76,8
Deshonesto pero capaz 23,2
% Total (n) 100 (1.198)
Fuente: LAPOP, 2006. Pregunta: Uno siempre quiere lo me-
jor para el país, pero a veces hay que escoger... ¿De las
siguientes opciones, cuál cree es la mejor para el país? ¿Un
presidente honesto pero incapaz o un presidente capaz pero
deshonesto?
En la tabla 2 aparecen los resultados de
cuatro modelos de regresión logística que
permiten ver qué variables son más relevan-
tes para distinguir entre los ciudadanos que
prefi eren a políticos honrados y los ciudada-
nos que, por el contrario, compensan eligien-
do a políticos deshonestos pero competen-
tes. La principal diferencia entre los modelos
1 y 2, por un lado, y 3 y 4, por otro, es que en
los dos primeros solo se tuvo en cuenta a
aquellos entrevistados que votaron y se dis-
tingue a qué partido votaron. En los dos últi-
mos modelos se tienen en cuenta tanto a los
entrevistados que votaron como aquellos que
no votaron en las últimas elecciones presi-
denciales. Esta diferencia entre ciudadanos
que votan y que no votan permite ver si aque-
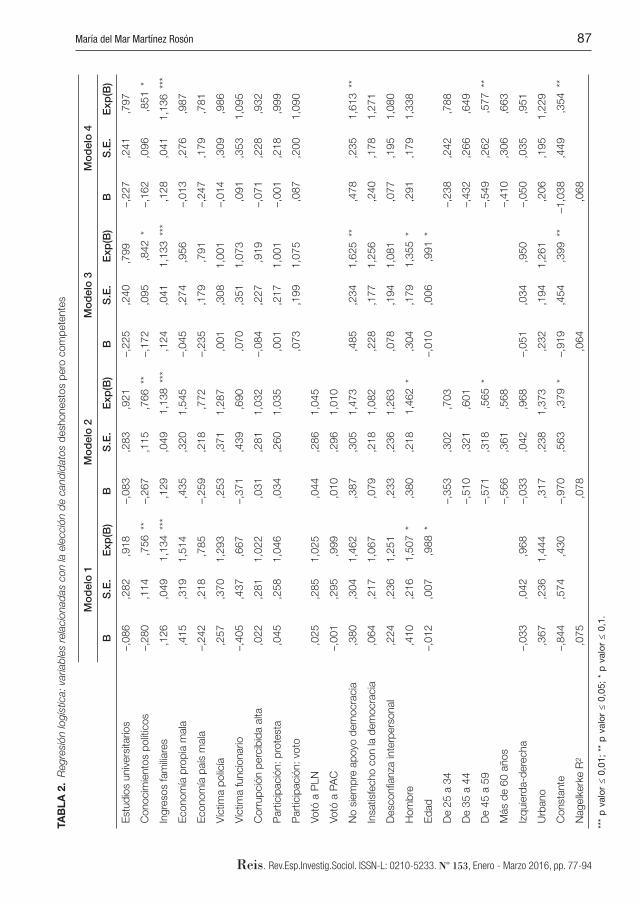
María del Mar Martínez Rosón 87
Reis. Rev.Esp.Investig.Sociol. ISSN-L: 0210-5233. Nº 153, Enero - Marzo 2016, pp. 77-94
TAB
LA 2
. R
egre
sió
n lo
gís
tica: va
riab
les r
ela
cio
nad
as c
on la
ele
cció
n d
e c
and
idato
s d
eshonesto
s p
ero
com
pete
nte
s
M
od
elo
1M
od
elo
2M
od
elo
3M
od
elo
4
BS
.E.
Exp
(B)
BS
.E.
Exp
(B)
BS
.E.
Exp
(B)
BS
.E.
Exp
(B)
Estu
dio
s u
niv
ers
itarios
–,0
86
,282
,918
–,0
83
,283
,921
–,2
25
,240
,799
–,2
27
,241
,797
Conocim
iento
s p
olít
icos
–,2
80
,114
,756 **
–,2
67
,115
,766 **
–,1
72
,095
,842 *
–,1
62
,096
,851 *
Ingre
sos fam
iliare
s,1
26
,049
1,1
34 **
*,1
29
,049
1,1
38 **
*,1
24
,041
1,1
33 **
*,1
28
,041
1,1
36 **
*
Econom
ía p
rop
ia m
ala
,415
,319
1,5
14
,435
,320
1,5
45
–,0
45
,274
,956
–,0
13
,276
,987
Econom
ía p
aís
mala
–,2
42
,218
,785
–,2
59
,218
,772
–,2
35
,179
,791
–,2
47
,179
,781
Víc
tim
a p
olic
ía
,257
,370
1,2
93
,253
,371
1,2
87
,001
,308
1,0
01
–,0
14
,309
,986
Víc
tim
a funcio
nario
–,4
05
,437
,667
–,3
71
,439
,690
,070
,351
1,0
73
,091
,353
1,0
95
Corr
up
ció
n p
erc
ibid
a a
lta
,022
,281
1,0
22
,031
,281
1,0
32
–,0
84
,227
,919
–,0
71
,228
,932
Part
icip
ació
n: p
rote
sta
,045
,258
1,0
46
,034
,260
1,0
35
,001
,217
1,0
01
–,0
01
,218
,999
Part
icip
ació
n: vo
to
,0
73
,199
1,0
75
,087
,200
1,0
90
Votó
a P
LN
,025
,285
1,0
25
,044
,286
1,0
45
Votó
a P
AC
–,0
01
,295
,999
,010
,296
1,0
10
No s
iem
pre
ap
oyo
dem
ocra
cia
,380
,304
1,4
62
,387
,305
1,4
73
,485
,234
1,6
25 **
,478
,235
1,6
13 **
Insatisfe
cho c
on la
dem
ocra
cia
,064
,217
1,0
67
,079
,218
1,0
82
,228
,177
1,2
56
,240
,178
1,2
71
Desconfi a
nza
inte
rpers
onal
,224
,236
1,2
51
,233
,236
1,2
63
,078
,194
1,0
81
,077
,195
1,0
80
Hom
bre
,410
,216
1,5
07 *
,380
,218
1,4
62 *
,304
,179
1,3
55 *
,291
,179
1,3
38
Ed
ad
–,0
12
,007
,988 *
–,0
10
,006
,991 *
De 2
5 a
34
–,3
53
,302
,703
–,2
38
,242
,788
De 3
5 a
44
–,5
10
,321
,601
–,4
32
,266
,649
De 4
5 a
59
–,5
71
,318
,565 *
–,5
49
,262
,577 **
Más d
e 6
0 a
ños
–,5
66
,361
,568
–,4
10
,306
,663
Izq
uie
rda-d
ere
cha
–,0
33
,042
,968
–,0
33
,042
,968
–,0
51
,034
,950
–,0
50
,035
,951
Urb
ano
,367
,236
1,4
44
,317
,238
1,3
73
,232
,194
1,2
61
,206
,195
1,2
29
Consta
nte
–,8
44
,574
,430
–,9
70
,563
,379 *
–,9
19
,454
,399 **
–1,0
38
,449
,354 **
Nagelk
erk
e R
2,0
75
,078
,064
,068
***
p v
alo
r ≤
0,0
1;
** p
valo
r ≤
0,0
5;
* p
valo
r ≤
0,1
.
Reis. Rev.Esp.Investig.Sociol. ISSN-L: 0210-5233. Nº 153, Enero - Marzo 2016, pp. 77-94
88 Yo prefi ero al corrupto: el perfi l de los ciudadanos que eligen políticos deshonestos pero competentes
llos que prefi eren a políticos deshonestos son
fi nalmente ciudadanos electoralmente partici-
pativos y los modelos 1 y 2 permiten controlar
si los entrevistados relacionan la pregunta
abstracta con algún partido concreto.
En el análisis se tiene en cuenta cinco
grupos de variables relacionados con la so-
fi sticación política, la economía, la corrup-
ción, la participación política y la democracia
y de carácter sociodemográfi co. Los resulta-
dos muestran que ninguna de las variables
relacionadas con la participación o con la
corrupción es signifi cativa. Esto supone que
aquellos ciudadanos que eligen políticos
corruptos-competentes no participan de for-
ma diferente que aquellos que eligen honra-
dos-incompetentes (no votan más, ni protes-
tan más), ni tampoco mantienen esta actitud
por tener una percepción o victimización de
la corrupción distinta.
Sobre el resto de variables, varios resul-
tados llaman la atención. En primer lugar, los
datos analizados no muestran una diferencia
en función del nivel educativo. Sin embargo,
el grado de conocimientos políticos del en-
cuestado sí ofrece diferencias. Cuanto ma-
yor sea el nivel de conocimientos políticos
menos probable es que se elija a políticos
corruptos. En concreto, si se tiene en cuenta
únicamente a los entrevistados que sí vota-
ron en las últimas elecciones presidenciales,
el incremento de una unidad en el índice de
conocimientos (medido de 0 a 5, véase el
Anexo I) disminuye la probabilidad en un
24,4%. Considerando a todos los entrevista-
dos, el impacto de los conocimientos se re-
duce, pero aun así la probabilidad de elegir a
un deshonesto competente disminuye un
15% por cada incremento de una unidad en
el índice de conocimientos, manteniendo el
resto de variables constantes.
En segundo lugar, la valoración de la eco-
nomía general o de la economía personal del
encuestado no tiene ningún impacto en las
posibilidades de preferir a un candidato co-
rrupto sobre uno honrado. Sin embargo, el
nivel de ingresos familiar sí resulta estadísti-
camente signifi cativo. Son los encuestados
que proceden de hogares con mayores in-
gresos los que están más dispuestos a apo-
yar a políticos corruptos pero competentes.
El incremento de los ingresos del hogar en
una unidad (en una escala de 0 a 10) aumen-
ta un 13% la probabilidad de elegir a un
competente corrupto, manteniendo el resto
de variables constantes. Además, este por-
centaje se mantiene constante para todos
los modelos independientemente de que los
encuestados hayan votado o no en las pre-
sidenciales.
En tercer lugar, no parece existir una rela-
ción entre compensar la falta de integridad
con competencia y el grado de satisfacción
con la democracia o el grado de confi anza
interpersonal. Solamente existe relación con
la variable de apoyo al sistema democrático.
Los individuos que dicen estar dispuestos a
elegir a un corrupto son a su vez aquellos a
los que el tipo de régimen le es irrelevante o
que en determinadas situaciones pueden
prescindir del modelo democrático a favor de
un régimen autoritario. Manteniendo el resto
de variables constantes, es un 60% más pro-
bable que aquellos que no apoyan el régimen
democrático de forma clara se decidan por un
candidato capaz pero deshonesto que quie-
nes sí apoyan el sistema democrático.
Finalmente, cabe reseñar el impacto de
dos variables sociodemográfi cas: la edad y
el género. En cuanto a la primera se confi rma
que los jóvenes son más tolerantes con la
corrupción que las personas de mayor edad
(modelos 1 y 3). Cuando se tienen en cuenta
distintos tramos de edad se ve perfectamen-
te que es a partir de los 45 y hasta los 59
años cuando las probabilidades de votar a
un corrupto competente son estadística-
mente menores que en el tramo entre 18 y 25
años que representa el grupo de referencia
(modelos 2 y 4). En concreto en esa horquilla
(45-59 años) el apoyo a candidatos capaces
pero deshonestos es aproximadamente un
42% menor que entre los más jóvenes.
María del Mar Martínez Rosón 89
Reis. Rev.Esp.Investig.Sociol. ISSN-L: 0210-5233. Nº 153, Enero - Marzo 2016, pp. 77-94
En cuanto al género, las mujeres tienen
menos probabilidades de elegir a un corrup-
to competente que los hombres. Cuando
solo se tiene en cuenta a aquellos que han
votado, las diferencias entre hombres y mu-
jeres son más importantes. En concreto, es
entre un 46% y un 50% más probable que un
elector varón vote a un corrupto competente
que una mujer. Si tenemos en cuenta toda la
población, la diferencia entre hombres y mu-
jeres disminuye, siendo aproximadamente
un 34% más probable que un hombre elija a
un deshonesto que una mujer.
CONCLUSIONES
A los electores les gustan los buenos políti-
cos. Pero en ocasiones no se puede contar
con candidatos competentes y honrados.
Hay que elegir: un político competente pero
deshonesto o un político de moral intachable
pero menos competente. La realidad mues-
tra que la decisión de los ciudadanos no es
unánime. En el caso aquí analizado los datos
de partida muestran que solo un 76,8% de
los costarricenses prefi ere la honradez a pe-
sar de que no haya buenos resultados. Por
el contrario, si la honradez viene acompaña-
da por falta de capacidad un 23,2% está
dispuesto a prescindir de aquella. En este
artículo se ha analizado qué características
diferencian a los ciudadanos que están dis-
puestos a votar a representantes deshones-
tos si estos son competentes de los ciuda-
danos que prefi eren a políticos honrados.
Los resultados para el caso costarricense
muestran que hay cuatro variables funda-
mentales que los diferencian: los conoci-
mientos políticos, los ingresos, la edad y el
género. Aquellos ciudadanos que tienen más
conocimientos políticos están menos dis-
puestos a votar a un candidato deshonesto.
De igual forma responden las mujeres. Por el
contrario, es más probable que los jóvenes y
los ciudadanos con más ingresos puedan
compensar la falta de honradez con capaci-
dad. Por otro lado, cuando se distingue entre
los ciudadanos que acuden a las urnas y los
que no, para tratar de sopesar el posible im-
pacto sobre los resultados electorales, se
observa que hay dos variables, género y co-
nocimientos políticos, que establecen aún
mayores diferencias. Mientras que entre la
población hay un 35% más de probabilida-
des de que los hombres voten a un compe-
tente deshonesto con respecto a las muje-
res, si tomamos solo a los votantes este
porcentaje aumenta hasta el 50%. Con res-
pecto al grado de conocimientos políticos el
porcentaje pasa del 16 al 24%.
El análisis también ha mostrado que
cuando consideramos a todos los ciudada-
nos, votantes o no, hay una relación eviden-
te entre el apoyo a un corrupto competente
y el apoyo al sistema democrático. Los ciu-
dadanos que están dispuestos a sustituir la
democracia por otro sistema político en si-
tuaciones de difi cultad eligen a un corrupto
competente con una probabilidad un 60%
mayor que los ciudadanos que apoyan sin
fi suras la democracia.
Con respecto a la literatura, estos resulta-
dos refuerzan algunos hallazgos previos como
los relacionados con la edad (Torgler y Valev,
2006; Bonifácio, 2013) y con los conocimientos
políticos (Funk, 1996). También ofrecen resul-
tados claros en algunos aspectos sobre los
que hay más controversia, como el género y
los ingresos. Pero a su vez no apoyan la rele-
vancia de algunas variables que parecían tener
un impacto claro, como la educación.
Asimismo, hay que resaltar que entre los
resultados del análisis solo es posible hacer
cambios sobre una variable, el grado de co-
nocimientos políticos. Los datos muestran
que aun cuando los ciudadanos cuentan con
la información sobre el perfi l del candidato
pueden votar a un corrupto, pero aquellos
que tienen más conocimientos políticos lo
hacen con menor probabilidad. Esto envía un
mensaje claro: es necesario que los ciudada-
nos cuenten con más información, ya que
Reis. Rev.Esp.Investig.Sociol. ISSN-L: 0210-5233. Nº 153, Enero - Marzo 2016, pp. 77-94
90 Yo prefi ero al corrupto: el perfi l de los ciudadanos que eligen políticos deshonestos pero competentes
solo poniendo más información política a
disposición de los ciudadanos es posible
que estos la aprehendan. La principal venta-
ja es que estos cambios son posibles y, ade-
más, es posible realizarlos en un breve espa-
cio de tiempo, si bien sus resultados solo se
pueden observar en el largo plazo.
También cabe hacer una advertencia. Estos
resultados corresponden a un solo caso. En el
futuro es necesario hacer estudios compara-
dos que permitan analizar distintas democra-
cias, así como comprobar si estas conclusio-
nes son o no aplicables a otros casos.
Igualmente resta que los investigadores abor-
den otras preguntas: ¿cuál es el impacto real
sobre los resultados electorales? ¿Hay diferen-
cias en función del estadio de desarrollo o de
calidad democrática de un país? ¿Los resulta-
dos son estables en el tiempo o cambian? Si
hay cambios, ¿qué factores intervienen?
BIBLIOGRAFÍA
Abramowitz, Alan I. (1991). «Incumbency, Campaign
Spending, and the Decline of Competition in US
House Elections». Journal of Politics, 53(1): 34-
56.
Almeida, Alberto Carlos (2007). A cabeça do brasileiro.
São Paulo: Record.
Bågenholm, Andreas (2013). «Throwing the Rascals
Out? The Electoral Effects of Corruption Allega-
tions and Corruption Scandals in Europe 1981-
2011». Crime, Law and Social Change, 60(5):
595-609.
Barómetro de las Américas, Proyecto de Opinión
Pública de América Latina (LAPOP), www.Lapop-
Surveys.org.
Bonifácio, Robert (2013). «A afeição dos cidadãos
pelos políticos mal-afamados: identifi cando os
perfi s associados à aceitação do “rouba, mas
faz” no Brasil». Opinião Pública, 19(2): 320-345.
Booth, John A. y Seligson, Mitchell A. (2005). «Po-
litical Legitimacy and Participation in Costa Rica:
Evidence of Arena Shopping». Political Research
Quarterly, 58(4): 537-550.
Bratton, Michael (2009). «Are You Being Served?:
Popular Satisfaction with Health and Education
Services in Africa». En: Bland, G. y Arnson, C. J.
(eds.). Democratic Defi cits: Addressing Chal-
lenges to Sustainability and Consolidation Around
the World. Washington: Woodrow Wilson Inter-
national Center for Scholars.
Bruner, Jerome S. y Korchin, Sheldon J. (1946). «The
Boss and the Vote: Case Study in City Politics».
The Public Opinion Quarterly, 10(1): 1-23.
Caínzos, Miguel y Jiménez, Fernando (2000). «El im-
pacto de los escándalos de corrupción sobre el
voto en las elecciones generales de 1996». His-
toria y Política, 4: 93-132.
Campbell, Angus; Gurin, Gerald y Miller, Warren E.
(1954). The Voter Decides. Evanston: Row Peter-
son.
Campbell, Angus; Converse, Philip E.; Miller, Warren
E. y Stokes, Donald E. (1960). The American
Voter. New York: John Wiley.
Canache, Damarys; Mondak, Jeffery J. y Cabrera,
Ernesto (2000). «Voters and the Personal Vote: A
Counterfactual Simulation». Political Research
Quarterly, 53(3): 663-676.
Chang, Eric C. C. y Kerr, Nicholas N. (2009). «Do
Voters Have Different Attitudes Toward Corrup-
tion? The Sources and Implications of Popular
Perceptions and Tolerance of Political Corrup-
tion». Afrobarometer Working Papers, 116.
Choi, Eunjung y Woo, Jongseok (2010). «Political
Corruption, Economic Performance, and Elec-
toral Outcomes: A Cross-National Analysis».
Contemporary Politics, 16(3): 249-262.
Deegan-Krause, Kevin; Klasnja, Marko y Tucker,
Joshua (2011). «It’s the Bribe, Stupid! Pocket-
book vs. Sociotropic Corruption». Ponencia pre-
sentada en la Conferencia annual de APSA, del
1 al 4 de septiembre, Seattle. http://ssrn.com/
abstract=1899944.
Delgado Jiménez, Francisco (2013). «El empleo in-
formal en Costa Rica: características de los ocu-
pados y sus puestos de trabajo». Ciencias
Económicas, 31(2): 35-51.
Dimock, Michael A. y Jacobson, Gary C. (1995). «The
House Bank Scandal’s Impact on Voters in 1992».
The Journal of Politics, 57(4): 1143-1159.
Dollar, David; Fisman, Raymond y Gatti, Roberta
(2001). «Are Women Really the “Fairer” Sex? Cor-
ruption and Women in Government». Journal of
Economic Behavior and Organization, 46(4): 423-
429.
María del Mar Martínez Rosón 91
Reis. Rev.Esp.Investig.Sociol. ISSN-L: 0210-5233. Nº 153, Enero - Marzo 2016, pp. 77-94
Finan, Frederico y Ferraz, Claudio (2005). «Reelection
Incentives and Political Corruption: Evidence
from Brazilian Audit Reports». Ponencia presen-
tada en el Annual Meeting of the American Agri-
cultural Economics Association, del 24 al 27 de
julio, Providence, RI.
Fiorina, Morris P. (1981). Retrospective Voting in
American Elections. New Haven: Yale University
Press.
Funk, Carolyn L. (1996). «The Impact of Scandal on
Candidate Evaluations: An Experimental Test of
the Role of Candidate Traits». Political Behavior,
18(1): 1-24.
Funk, Carolyn L. (1997). «Implications of Political Ex-
pertise in Candidate Trait Evaluations». Political
Research Quarterly, 50(3): 675-697.
Funk, Carolyn L. (1999). «Bringing the Candidate into
Models of Candidate Evaluation». Journal of
Politics, 61(3): 700-720.
Goetz, Anne Marie (2007). «Political Cleaners: Women
as the New Anti-Corruption Force?». Develop-
ment and Change, 38(1): 87-105.
Jacobson, Gary C. y Dimock, Michael A. (1994). «The
Effects of Bank Overdrafts on the 1992 House
Elections». American Journal of Political Science,
38(3): 601-624.
Jiménez, Fernando y Caínzos, Miguel (2004). «La
repercusión electoral de los escándalos políticos.
Alcance y condiciones». Revista Española de
Ciencia Política, 10: 141-170.
Johnston, Michael (1991). «Right & Wrong in British
Politics: “Fits of Morality” in Comparative Pers-
pective». Polity, 24(1): 1-25.
Kinder, Donald R.; Petres, Mark D.; Abelson, Robert
P. y Fiske, Susan T. (1980). «Presidential Proto-
types». Political Behavior, 2(4): 315-337.
Kinder, Donald R. (1983). Presidential Traits. Ann Ar-
bor: University of Michigan.
Kulisheck, Michael R. y Mondak, Jeffery J. (1996).
«Candidate Quality and the Congressional Vote:
A Causal Connection?». Electoral Studies, 15(2):
237-253.
Kumlin, Staffan y Esaiasson, Peter (2012). «Scandal
Fatigue? Scandal Elections and Satisfaction with
Democracy in Western Europe 1977-2007». Brit-
ish Journal of Political Research, 42(2): 263-282.
Lehoucq, Fabrice (2005). «Costa Rica: Paradise in
Doubt». Journal of Democracy, 16(3): 140-154.
Maier, Jürgen (2011). «The Impact of Political Scan-
dals on Political Support: An Experimental Test
of Two Theories». International Political Science
Review, 32(3): 283-302.
Manzetti, Luigi y Wilson, Carole J. (2007). «Why Do
Corrupt Governments Maintain Public Support?».
Comparative Political Studies, 40(8): 949-970.
Martínez Rosón, María del Mar (2014). «The Good,
the Bad and the Winner. Buenos políticos y éxi-
to electoral en América Latina». Revista de Cien-
cia Política, 34(2): 351-372.
McCurley, Carl y Mondak, Jeffery J. (1995). «Inspect-
ed by #1184063113: The Infl uence of Incumbents
Competence and Integrity in U.S. House Elec-
tions». American Journal of Political Science,
39(4): 864-885.
Mondak, Jeffery J. (1995). «Competence, Integrity, and
the Electoral Success of Congressional Incum-
bents». The Journal of Politics, 57(4): 1043-1069.
Morán, Mª Luz y Benedicto, Jorge (1995). La cultura
política de los españoles. Un ensayo de reinter-
pretación. Madrid: CIS.
Muñoz, Jordi; Anduiza, Eva y Gallego, Aina (2013).
«Why Voters Forgive Corrupt Politicians? Im-
plicit Exchange, Noise and Cynicism». Ponencia
presentada en el Workshop «Citizen Responses
to Political Corruption: Elections and Account-
ability», 19 de julio, Barcelona.
Muñoz, Jordi y Esaiasson, Peter (2013). «Roba pero
hace? –An Experimental Test of the Competence-
corruption Tradeoff Hypothesis in Spain and
Sweden». Ponencia presentada en el Workshop
«Citizen Responses to Political Corruption: Elec-
tions and Accountability», 19 de julio, Barcelona.
Page, Benjamin I. (1978). Choices and Echoes in
Presidential Elections. Chicago: University of Chi-
cago Press.
Pereira, Carlos; Rennó, Lucio y Samuels, David
(2008). «Corruption, Campaign Finance, and
Electoral Accountability». Ponencia presentada
en el Workshop Accountability Institutions and
Political Corruption in Brazil, Oxford University,
23 de mayo.
Peters, John G. y Welch, Susan (1978). «Politics, Cor-
ruption, and Political Culture. A View From the
State Legislature». American Politics Research,
6(3): 345-356.
Poguntke, Thomas y Webb, Paul (2005). «The Presi-
dentialization of Politics in Democratic Societies:
Reis. Rev.Esp.Investig.Sociol. ISSN-L: 0210-5233. Nº 153, Enero - Marzo 2016, pp. 77-94
92 Yo prefi ero al corrupto: el perfi l de los ciudadanos que eligen políticos deshonestos pero competentes
A Framework of Analysis». En: The Presidentiali-
zation of Politics. A Comparative Study of Modern
Democracies. Oxford: Oxford University Press.
Popova, Olga (2010). «Corruption, Voting and Em-
ployment Status: Evidence from Russian Parlia-
mentary Elections». CERGE-EI Working Papers,
428.
Popkin, Samuel L. (1991). The Reasoning Voter: Com-
munication and Persuasion in Presidential Cam-
paigns. Chicago: University of Chicago Press.
Prewitt, Kenneth (1970). The Recruitment of Political
Leaders. Indianapolis: Bobbs-Merrill.
Prysby, Charles (2008). «Perceptions of Candidate
Character Traits and the Presidential Vote in
2004». Political Science and Politics, 41(1): 115-
122.
Redlawsk, David P. y McCann, James A. (2002).
«How Voters See Political Corruption: Defi nitions
and Beliefs, Causes and Consequences». Ponen-
cia presentada en el Annual Meeting de SPSA,
New Orleans, del 28 al 30 de marzo.
Riera, Pedro; Barberá, Pablo; Gómez, Raúl; Mayoral,
Juan Antonio y Montero, José Ramón (2013).
«The Electoral Consequences of Corruption
Scandals in Spain». Crime, Law and Social
Change, 60(5): 515-534.
Rundquist, Barry S.; Strom, Gerald S. y Peters, John
G. (1977). «Corrupt Politicians and Their Elec-
toral Support: Some Experimental Observations».
The American Political Science Review, 71(3):
954-963.
Sánchez, Fernando (2007). Partidos políticos, elec-
ciones y lealtades partidarias en Costa Rica: ero-
sión y cambio. Salamanca: Ediciones Universi-
dad de Salamanca.
Seligson, Mitchell A. (2002). «Trouble in Paradise?
The Erosion of System Support in Costa Rica,
1978-1999». Latin American Research Review,
37(1): 160-185.
Sousa, Luís de y Moriconi, Marcelo (2013). «Why
Voters Do Not Throw the Rascals Out? A Con-
ceptual Framework for Analysing Electoral Pu-
nishment of Corruption». Crime, Law and Social
Change, 60(5): 471-502.
Stoker, Laura (1993). «Judging Presidential Charac-
ter: The Demise of Gary Hart». Political Behavior,
15(2): 193-223.
Stone, Walter J.; Maisel, Sandy y Maestas, Cherie D.
(2004). «Quality Counts: Extending the Strategic
Politician Model of Incumbent Deterrence».
American Journal of Political Science, 48(3): 479-
495.
Sullivan, John L.; Aldrich, John H.; Borgida, Eugene
y Rahn, Wendy (1990). «Candidate Appraisal and
Human Nature: Man and Superman in the 1984
Election». Political Psychology, 11(3): 459-484.
Sung, Hung-En (2003). «Fairer Sex or Fairer System?
Gender and Corruption Revisited». Social Forces,
82(2): 705-725.
Swamy, Anand; Knack, Stephen; Lee, Young y Azfar,
Omar (2001). «Gender and Corruption». Journal
of Development Economics, 64(1): 25-55.
Torgler, Benno y Valev, Neven T. (2006). «Corruption
and Age». Journal of Bioeconomics, 8(2): 133-
145.
Villoria, Manuel y Jiménez, Fernando (2012). «La co-
rrupción en España (2004-2010): datos, percep-
ción y efectos». Revista Española de Investigaci-
ones Sociológicas, 138: 109-134.
Welch, Susan y Hibbing, John (1997). «The Effect of
Charges of Corruption on Voting Behavior in Con-
gressional Elections, 1982-90». Journal of Poli-
tics, 59(1): 226-239.
Winters, Matthew S. y Weitz-Shapiro, Rebecca
(2013). «Lacking Information or Condoning Cor-
ruption. When Do Voters Support Corrupt Politi-
cians?». Comparative Politics, 45: 418-436.
RECEPCIÓN: 26/08/2014
REVISIÓN: 27/11/2014
APROBACIÓN: 13/05/2015
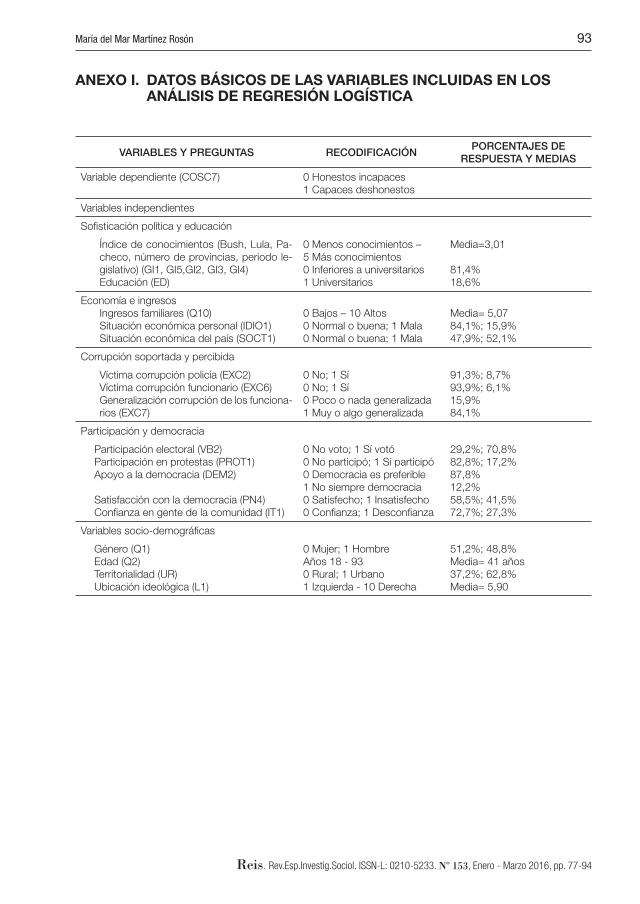
María del Mar Martínez Rosón 93
Reis. Rev.Esp.Investig.Sociol. ISSN-L: 0210-5233. Nº 153, Enero - Marzo 2016, pp. 77-94
ANEXO I. DATOS BÁSICOS DE LAS VARIABLES INCLUIDAS EN LOS ANÁLISIS DE REGRESIÓN LOGÍSTICA
VARIABLES Y PREGUNTAS RECODIFICACIÓNPORCENTAJES DE
RESPUESTA Y MEDIAS
Variable dependiente (COSC7) 0 Honestos incapaces
1 Capaces deshonestos
Variables independientes
Sofi sticación política y educación
Índice de conocimientos (Bush, Lula, Pa-
checo, número de provincias, periodo le-
gislativo) (GI1, GI5,GI2, GI3, GI4)
Educación (ED)
0 Menos conocimientos –
5 Más conocimientos
0 Inferiores a universitarios
1 Universitarios
Media=3,01
81,4%
18,6%
Economía e ingresos
Ingresos familiares (Q10)
Situación económica personal (IDIO1)
Situación económica del país (SOCT1)
0 Bajos – 10 Altos
0 Normal o buena; 1 Mala
0 Normal o buena; 1 Mala
Media= 5,07
84,1%; 15,9%
47,9%; 52,1%
Corrupción soportada y percibida
Víctima corrupción policía (EXC2)
Víctima corrupción funcionario (EXC6)
Generalización corrupción de los funciona-
rios (EXC7)
0 No; 1 Sí
0 No; 1 Sí
0 Poco o nada generalizada
1 Muy o algo generalizada
91,3%; 8,7%
93,9%; 6,1%
15,9%
84,1%
Participación y democracia
Participación electoral (VB2)
Participación en protestas (PROT1)
Apoyo a la democracia (DEM2)
Satisfacción con la democracia (PN4)
Confi anza en gente de la comunidad (IT1)
0 No voto; 1 Sí votó
0 No participó; 1 Sí participó
0 Democracia es preferible
1 No siempre democracia
0 Satisfecho; 1 Insatisfecho
0 Confi anza; 1 Desconfi anza
29,2%; 70,8%
82,8%; 17,2%
87,8%
12,2%
58,5%; 41,5%
72,7%; 27,3%
Variables socio-demográfi cas
Género (Q1)
Edad (Q2)
Territorialidad (UR)
Ubicación ideológica (L1)
0 Mujer; 1 Hombre
Años 18 - 93
0 Rural; 1 Urbano
1 Izquierda - 10 Derecha
51,2%; 48,8%
Media= 41 años
37,2%; 62,8%
Media= 5,90