I EDU VISTEC: A SOFTWARE FOR COMPUTER VISION...
24
I EDU_VISTEC: A SOFTWARE FOR COMPUTER VISION EDUCATIONAL TRAINER USING MATLAB LAW KOK SIN This thesis is submitted as partial fulfilment of the requirement for the award of the Bachelor Degree of Electrical Engineering (Electronic) Faculty of Electrical & Electronic Engineering Universiti Malaysia Pahang NOVEMBER 2010
Transcript of I EDU VISTEC: A SOFTWARE FOR COMPUTER VISION...

I
EDU_VISTEC: A SOFTWARE FOR COMPUTER VISION EDUCATIONAL
TRAINER USING MATLAB
LAW KOK SIN
This thesis is submitted as partial fulfilment of the requirement for the award of
the
Bachelor Degree of Electrical Engineering (Electronic)
Faculty of Electrical & Electronic Engineering
Universiti Malaysia Pahang
NOVEMBER 2010

II
“All the trademark and copyrights use herein are property of their respective
owner. References of information from other sources are quoted accordingly;
otherwise the information presented in this report is solely work of the author.”
Signature : _________________________________
Name : LAW KOK SIN
Date : ________

IV
Acknowledgement
First and foremost, I am heartily thankful to my supervisor of this work, Dr.
Kamarul Hawari bin Ghazali, whose encouragement, guidance and advice from the
initial to the final level throughout the course of my graduate studies. He inspired me
greatly to work in this project. This work would not be possible without his willingness
to motivate me contributed tremendously to my work.
Besides, I wish to express my gratitude to the authority of Faculty of Electrical
and Electronic for providing me with the good environment and facilities to complete
this work. I would like to extend my gratitude to those who gave me the possibilities for
me to complete this work especially my beloved parents and my siblings for giving such
a great motivation and financial support.
Finally, an honourable mention goes to my graduate friends especially to those
group members under Dr. Kamarul supervision whose sharing all the literature and
skills. Special thanks to the administrator who help me to find the research material
easily.

V
Abstract
Nowadays, from time to time technologies become more advances that bring
much advantage for our human life. But, it needs time for us to learn especially the
knowledge about image processing because it uses for many field such as medical or
aerospace. So, this project is a study that mains in the basic applications of image
processing. It will introduce to the new learner about the image processing. MATLAB
software is the main tools that will be use for the application of image processing.
MATLAB software has been chosen because of this tool is a universal and all well
known tool. Then, MATLAB GUI is one of the parts that use to create the module of
those applications. The main outcome of this project is to create a module about the
application of image processing for learning purpose. In this module which will cover
two parts, which is shape detection and color recognition (RGB). The method that will
be use for the shape detection is edge detection. A few edge-finding methods will be
used for this application such as Sobel, Prewitt, Roberts, Laplacian of Gaussian (Log),
zero-cross and also canny technique. Therefore, the user can learn much in this module.
Then, for the application of color part used histogram to recognize the 3 basic colors,
that are red, green and blue. To complete this project it need to further study about the
MATLAB tools briefly and also all the technique that use to create that module. Finally,
this module can give the benefit for the new learner of image processing to more
understand about the useful applications. This module was designed to perform basic
applications effectively.

VI
Abstrak
Pada masa kini, kemajuan teknologi dari semasa ke semasa telah membawa
banyak manfaat dalam kehidupan harian manusia. Tapi, ia memerlukan masa bagi kita
untuk belajar terutama pengetahuan tentang pemprosesan imej kerana kegunaannya
dalam pelbagai bidang yang amat meluas seperti perubatan atau aerospace. Jadi, projek
ini merupakan kajian yang berkaitan dengan aplikasi pemprosesan imej. Ini akan
memperkenalkan kepada mereka yang baru belajar tentang pemprosesan imej.
MATLAB adalah alat utama yang akan digunakan untuk aplikasi pemprosesan imej.
MATLAB telah dipilih kerana alat ini adalah universal dan semua amat mengenalinya
dalam bidang kejururteraan ini. Kemudian, MATLAB GUI merupakan salah satu
bahagian yang digunakan untuk membuat modul dari aplikasi tersebut. Objektif utama
dari projek ini adalah menghasilkan modul tentang aplikasi pemprosesan imej untuk
tujuan belajar. Dalam modul ini akan merangkumi dua bahagian, iaitu pengenalpastian
bentuk dan warna (RGB). Kaedah yang akan digunakan untuk pengesanan bentuk
adalah pengesanan tepi. Teknik ini merangkumi beberapa kaedah yang akan digunakan
untuk aplikasi seperti teknik Sobel, Prewitt, Roberts, Laplacian dari Gaussian (Log),
zero-cross dan juga canny. Oleh kerana itu, pengguna boleh banyak belajar di dalam
modul ini. Maka, untuk aplikasi bahagian warna yang digunakan adalah histogram untuk
mengenali 3 warna iaitu merah, hijau dan biru. Demi menyiapkan projek ini perlu
mempelajari lebih lanjut mengenai alat MATLAB terlebih dahulu dan juga semua teknik
yang digunakan untuk membuat modul itu. Akhirnya, modul ini dapat memberikan
manfaat bagi mereka baru ingin belajar pemprosesan imej untuk lebih memahami
tentang aplikasi bermanfaat yang ada. Modul ini direka dengan tujuan mampu
menonjolkan aplikasi asas dengan berkesan.
VII
TABLE OF CONTENTS
CHAPTER TITLE PAGE
ORGANIZATION OF THE THESIS
TITLE PAGE I
DECLARATION II
DEDICATION III
ACKNOWLEDGEMENT IV
ABSTRACT V
ABSTRACK VI
TABLE OF CONTENTS VII
LIST OF FIGURE VIII
LIST OF TABLE XI
LIST OF ABBREVIATIONS XII
LIST OF APPENDICES XIII
1. INTRODUCTION 1
1.1 Problem Statements 2
1.2 Objectives 2
1.3 Scope of project 2
1.4 Thesis Outline 3
2. LITERATURE REVIEW
2.1 Image processing 4
2.1.1 Threshold image 7
2.1.2 Edge Detection 10
2.1.3 Histogram Method 12
2.2 RGB 15
2.3 MATLAB 2008 16
2.4 Graphical User Interface (GUI) 17
2.4.1 GUI definition 17
2.4.2 MATLAB GUI 18
2.4.3 MATLAB GUIDE 19
2.4.4 GUI operation 19
3. METHODOLOGY
3.1 Introduction 21
3.2 Software Development 23
3.2.1 Development MATLAB GUI 25
Using MATLAB GUIDE
3.2.2 Build MATLAB Programming 30
4. RESULT AND DISCUSSIONS
4.1 Introduction 35
4.2 Training phase result 36
4.2.1 Result of shape detection development 36
4.2.2 Result of color recognition development 39
4.3 Execution phase result 43
4.4 Discussion 47
5. CONCLUSION AND RECOMMENDATION
5.1 Conclusion 48
5.2 Future Recommendation 49
REFERENCES 50
APPENDICES 51

VIII
LIST OF FIGURES
FIGURE TITLE PAGE
2.1 Example of restoration image 5
2.2 Example of enhancement image 5
2.3 Example of understanding images 6
2.4 Original image 8
2.5 RGB to gray scale 8
2.6 Threshold to binary image 8
2.7 Inverse binary image 8
2.8 Prewitt horizontal and vertical operators 11
2.9 Example of image histogram 13
2.10 Example of histogram show pixel value 13
2.11 Low key image with the majority of pixels to the left 14
of center of the graph
2.12 High key images with the majority of the pixels 14
to the right of center of the graph
2.13 Result of combination primary color 15
2.14 The application, developed in MATLAB, 16
directly acquires signals from measurement hardware,
performs analysis and plotting, and includes GUI controls.
2.15 Example of GUI elements 18
3.1 Block diagram for the flow of the project 22
3.2 Flow Chart 24

3.3 MATLAB GUIDE Layouts 26
3.4 Property Inspector 27
3.5 Example GUI 28
3.6 Example m-files for GUI 29
4.1 Coding for sobel method 37
4.2 Coding shown decision of detect image 38
4.3 Coding of read and check the image 39
4.4 Coding of extract out the color image to the 40
individual color channels
4.5 Coding of after calculate the pixel value and 41
plot in a graph
4.6 Final result 42
4.7 Main Menu GUI 43
4.8 Load Image 44
4.9 Select edge-detection method 44
4.10 Recognize and get result 44
4.11 GUI for the color recognition ( Part I ) 45
4.12 GUI for the color recognition ( Part II ) 46
4.13 GUI for the color recognition ( Part III ) 46

XI
LIST OF TABLE
TABLE TITLE
PAGE
3.1 Basic Matlab GUI component 25
3.2 Various kind of Callbacks 31
3.3 Major Sections of the GUI M-file 34
XII
LIST OF ABBREVIATIONS
GUI - Graphical User Interface
RGB - Red, Green and Blue
HSV - hue, saturation, and value
XIII
LIST OF APPENDICES
APPENDIX TITLE PAGE
A Coding GUI Shape Detection 51
B Coding Color Recognition 56
C Coding Main GUI 60
D Coding Color GUI 62
1
CHAPTER 1
INTRODUCTION
New technologies need to be exploring for the development a system for help in
the human daily life. Exploring and learn a new technologies is not that easy because it
need some guide for it. Nowadays, the application of image processing and analysis are
now used in a wide range of industrial, artistic, and educational applications such as
biotechnology, medicine, environmental science and art. Image processing in
biotechnology or medicine also need use the basic application of object detection and
color recognition. So, development of object detection and color recognition module
need the intelligence on new technologies as a contribution due to help the industries
and also education field. Designing this module is useful for the new learner and this
module is a process to determine the shape detection and color recognition. In this
module will be cover several method such as edge detection and using histogram. The
basic tools that be used is MATLAB software. That is basic software that used in
engineering field especially. Then implement MATLAB GUI which is one of the
functions in MATLAB to design as simple module applications. Therefore, the new
learner can follow step by step in this module to know more about the application of
image processing that helpful in the entire field.

2
1.1 Problem Statement
Exploring a new technology like image processing is quite hard and need some
guide for it. In the internet got a lot of the manual guide for it but it hard for new learner
to really understand about it. Unfortunately, the guide from a module or system that can
let the new learner to try it out some method that can be use for the image processing
applications is much effective. So, a module about that is needed then this project is
important to complete for that purpose.
1.2 Objective
This project aims to create a module about the application of image processing
which using the MATLAB software as the main tools and use the application Graphics
User Integrated (GUI) skill. In these modules which cover two parts, shape detection
(circle and square) and color recognitions (RGB). Both of these basic applications are
suitable for the new learner for their understanding to help in their learning process so,
that is the main purpose of create this module.
1.3 Scope of project
The related scopes of this project are basic application of image processing and
MATLAB software. It involves data collection, image acquisition, image processing,
3
classification and decision. The data collection involves collecting the image consists of
different shape or color. Image processing consist of shape detection and color
recognition that can be many type of techniques but we used edge detection and
histogram for the two applications.
MATLAB Software is utilized where .m file as the location to write program and
form linkages between main program and sub programs, also, as the platform where
ANN program is trained to be accurate, efficient and user friendly.
1.3 Thesis Outline
This thesis is organized as below:
Chapter 1 will describes the introduction of this system, the purpose of this project,
problem statement, the work scope and brief explanation of this project.
In Chapter 2, the reviews about the information find on all the material or data used
include the software in the development of this project will be shown.
Chapter 3 will explain about all the methods use in development of this system and also
step by step on develop the module for training purpose and lastly described about the
execution part.
Chapter 4 will show all the results followed by the explanation and discussion about the
results from the beginning step until the end of development module.
Last chapter of Chapter 5 will have a summary to describe the overall part of this
project and come up with some recommendations and improvement.

4
Chapter 2
LITERATURE REVIEW
This chapter will review on the information gathered in developing the simple
system or module for object detection and color recognition. The information is the
entire basic introduction to develop that system for learning purpose including the basic
knowledge about the image processing, creating standalone file and also interfacing
MATLAB with GUI.
2.1 Image processing
Image processing is the analysis of a picture using techniques that can identify
shades, color and relationships that cannot be perceived by the human eye. Image
processing is used to solve identification problems, such as in forensic medicine or in
creating weather maps from satellite pictures. [1] It deals with images in bitmapped
graphics format that have been scanned in or captured with digital cameras.

5
Image processing typically attempts to accomplish into three parts that is
restoring images, enhancing images and understanding images. Restoration process
takes a corrupted image and attempts to recreate a clean original image which removing
sensor noise and restoring old, archived film and images. [1]
Figure 2.1: Example of restoration image
Enhancement process alters an image to make its meaning clearer to human observers
which often user used to increase the contrast in images that are overly dark or light.
Figure 2.2: Example of enhancement image
6
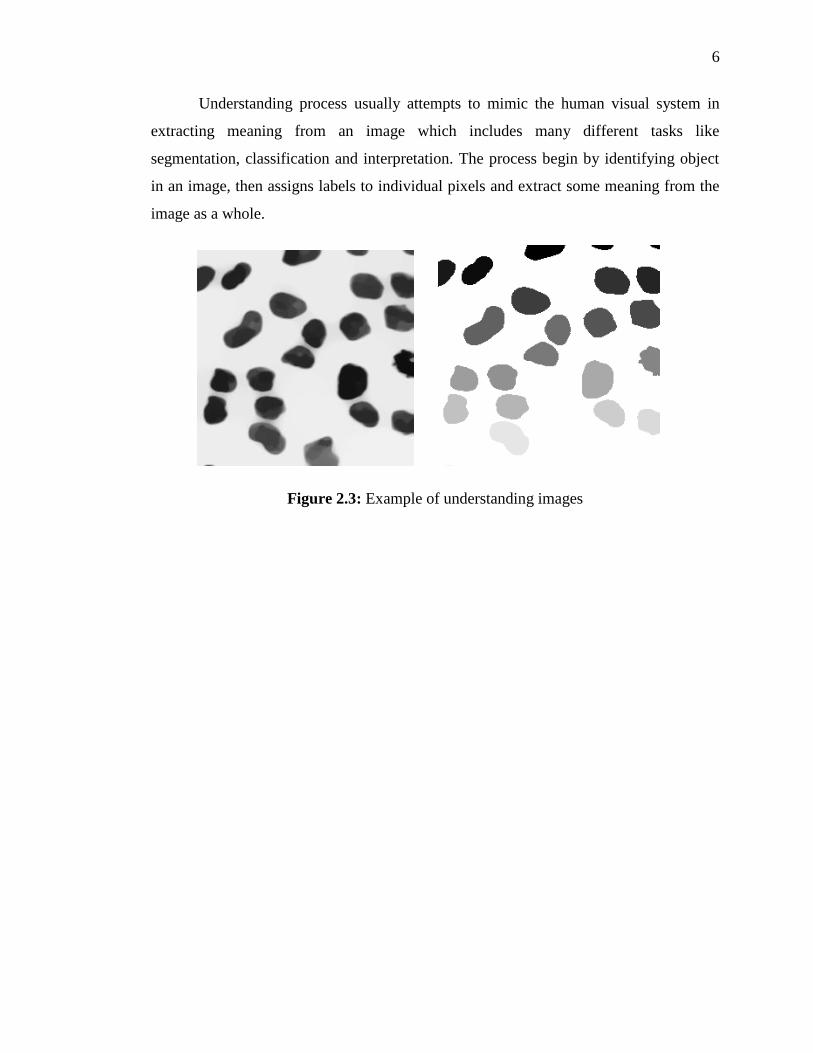
Understanding process usually attempts to mimic the human visual system in
extracting meaning from an image which includes many different tasks like
segmentation, classification and interpretation. The process begin by identifying object
in an image, then assigns labels to individual pixels and extract some meaning from the
image as a whole.
Figure 2.3: Example of understanding images
7
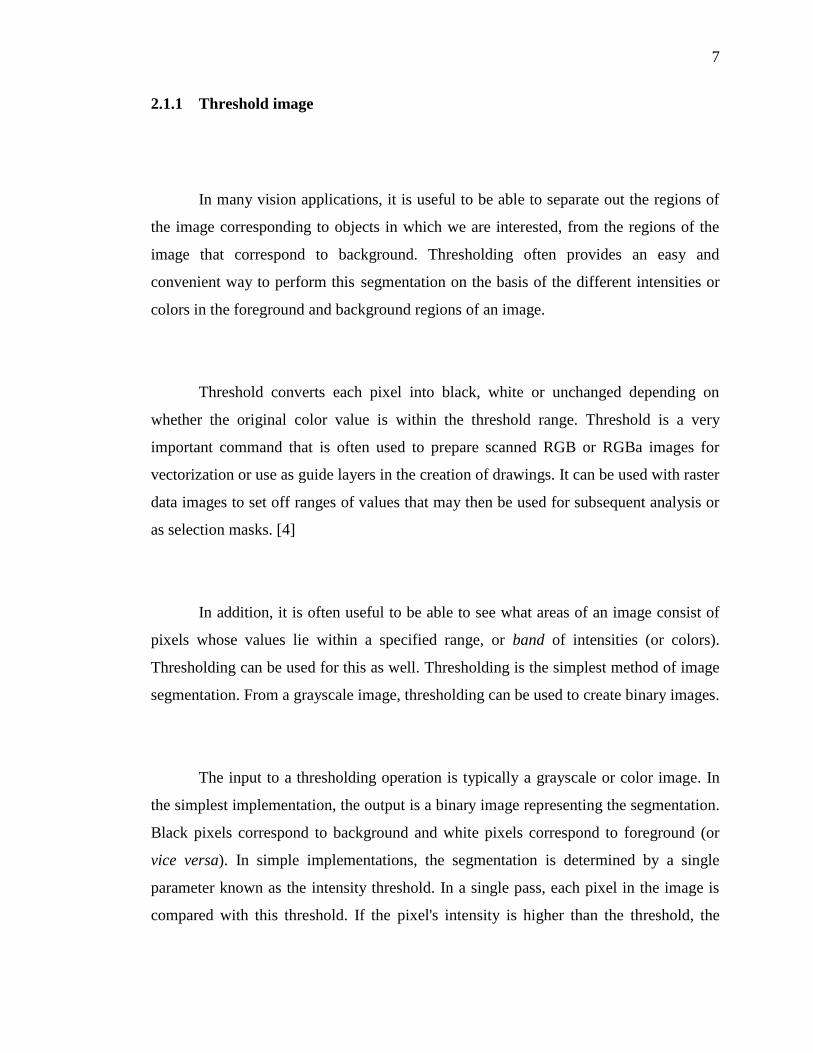
2.1.1 Threshold image
In many vision applications, it is useful to be able to separate out the regions of
the image corresponding to objects in which we are interested, from the regions of the
image that correspond to background. Thresholding often provides an easy and
convenient way to perform this segmentation on the basis of the different intensities or
colors in the foreground and background regions of an image.
Threshold converts each pixel into black, white or unchanged depending on
whether the original color value is within the threshold range. Threshold is a very
important command that is often used to prepare scanned RGB or RGBa images for
vectorization or use as guide layers in the creation of drawings. It can be used with raster
data images to set off ranges of values that may then be used for subsequent analysis or
as selection masks. [4]
In addition, it is often useful to be able to see what areas of an image consist of
pixels whose values lie within a specified range, or band of intensities (or colors).
Thresholding can be used for this as well. Thresholding is the simplest method of image
segmentation. From a grayscale image, thresholding can be used to create binary images.
The input to a thresholding operation is typically a grayscale or color image. In
the simplest implementation, the output is a binary image representing the segmentation.
Black pixels correspond to background and white pixels correspond to foreground (or
vice versa). In simple implementations, the segmentation is determined by a single
parameter known as the intensity threshold. In a single pass, each pixel in the image is
compared with this threshold. If the pixel's intensity is higher than the threshold, the

8
pixel is set to, say, white in the output. If it is less than the threshold, it is set to black.
[4]
Figure 2.4: Original image Figure 2.5: RGB to gray scale
Figure 2.6: Threshold to binary image Figure 2.7: Inverse binary image
In more sophisticated implementations, multiple thresholds can be specified, so
that a band of intensity values can be set to white while everything else is set to black.
For color or multi-spectral images, it may be possible to set different thresholds for each
color channel, and so select just those pixels within specified cuboids in RGB space.
Another common variant is to set to black all those pixels corresponding to background,
9
but leave foreground pixels at their original color/intensity (as opposed to forcing them
to white), so that that information is not lost.
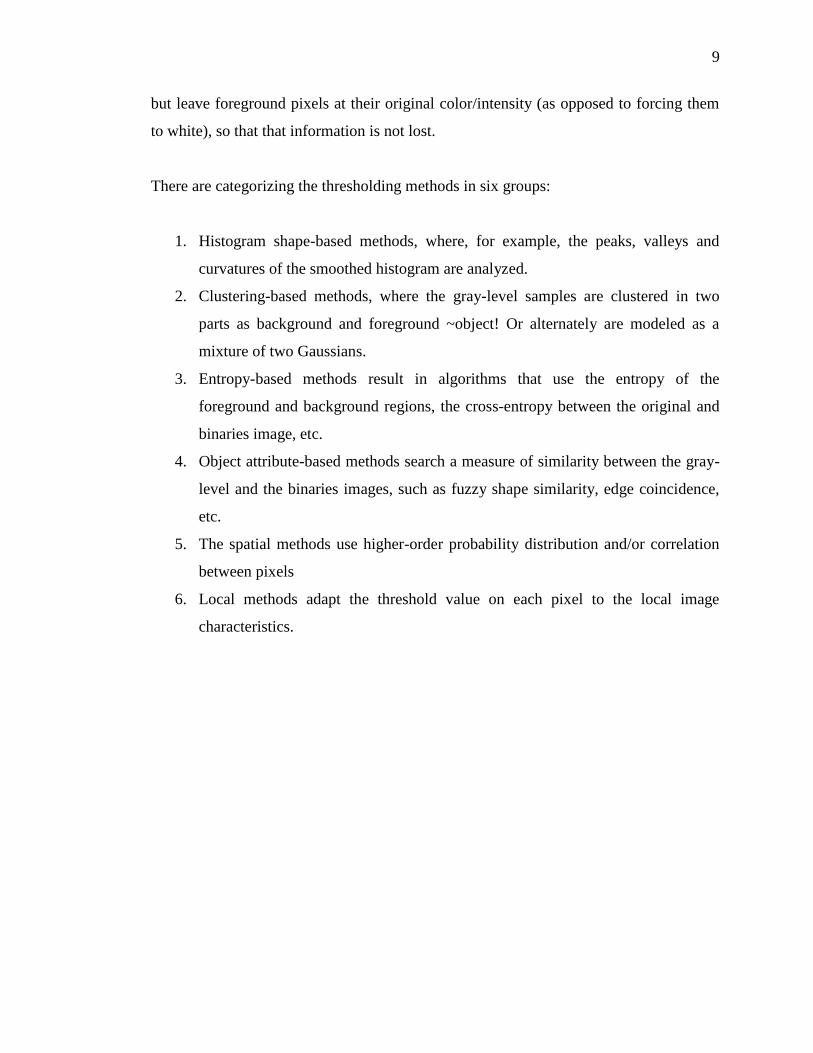
There are categorizing the thresholding methods in six groups:
1. Histogram shape-based methods, where, for example, the peaks, valleys and
curvatures of the smoothed histogram are analyzed.
2. Clustering-based methods, where the gray-level samples are clustered in two
parts as background and foreground ~object! Or alternately are modeled as a
mixture of two Gaussians.
3. Entropy-based methods result in algorithms that use the entropy of the
foreground and background regions, the cross-entropy between the original and
binaries image, etc.
4. Object attribute-based methods search a measure of similarity between the gray-
level and the binaries images, such as fuzzy shape similarity, edge coincidence,
etc.
5. The spatial methods use higher-order probability distribution and/or correlation
between pixels
6. Local methods adapt the threshold value on each pixel to the local image
characteristics.
10
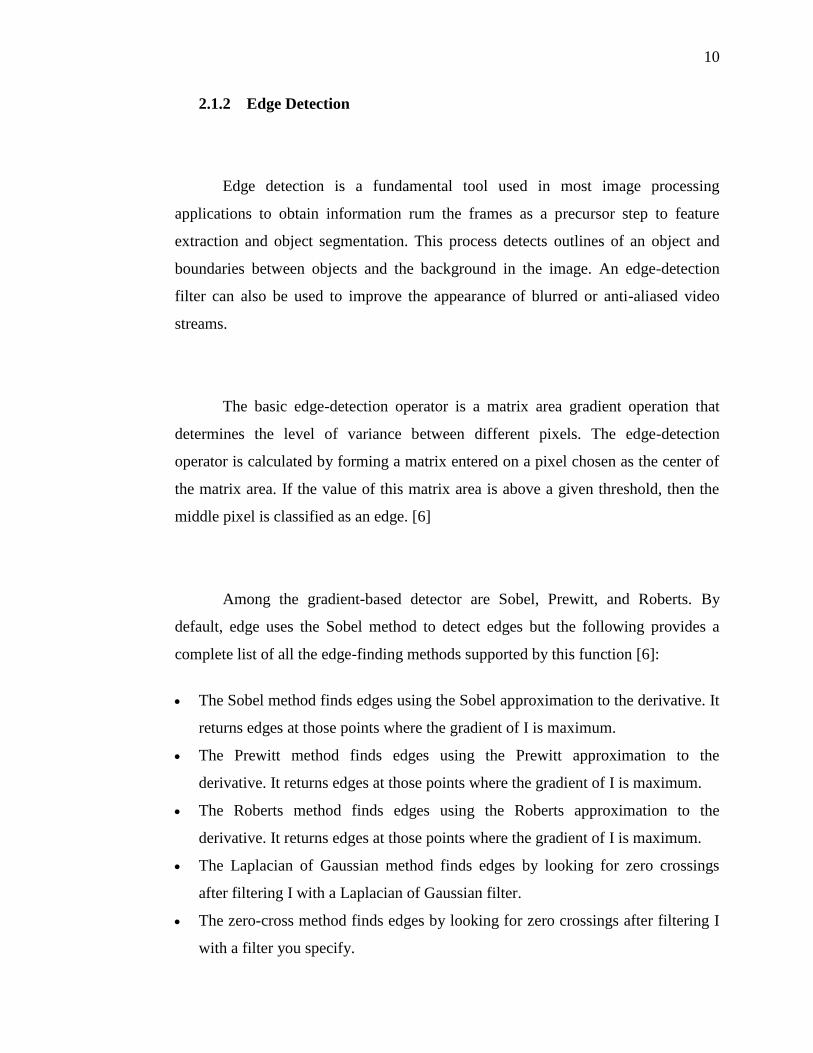
2.1.2 Edge Detection
Edge detection is a fundamental tool used in most image processing
applications to obtain information rum the frames as a precursor step to feature
extraction and object segmentation. This process detects outlines of an object and
boundaries between objects and the background in the image. An edge-detection
filter can also be used to improve the appearance of blurred or anti-aliased video
streams.
The basic edge-detection operator is a matrix area gradient operation that
determines the level of variance between different pixels. The edge-detection
operator is calculated by forming a matrix entered on a pixel chosen as the center of
the matrix area. If the value of this matrix area is above a given threshold, then the
middle pixel is classified as an edge. [6]
Among the gradient-based detector are Sobel, Prewitt, and Roberts. By
default, edge uses the Sobel method to detect edges but the following provides a
complete list of all the edge-finding methods supported by this function [6]:
The Sobel method finds edges using the Sobel approximation to the derivative. It
returns edges at those points where the gradient of I is maximum.
The Prewitt method finds edges using the Prewitt approximation to the
derivative. It returns edges at those points where the gradient of I is maximum.
The Roberts method finds edges using the Roberts approximation to the
derivative. It returns edges at those points where the gradient of I is maximum.
The Laplacian of Gaussian method finds edges by looking for zero crossings
after filtering I with a Laplacian of Gaussian filter.
The zero-cross method finds edges by looking for zero crossings after filtering I
with a filter you specify.

11
The Canny method finds edges by looking for local maxima of the gradient of I.
The gradient is calculated using the derivative of a Gaussian filter. The method
uses two thresholds, to detect strong and weak edges, and includes the weak
edges in the output only if they are connected to strong edges. This method is
therefore less likely than the others to be fooled by noise, and more likely to
detect true weak edges.
The Prewitt operator measures two components. The vertical edge
component is calculated with kernel Kx and the horizontal edge component is
calculated with kernel Ky. |Kx| + |Ky| gives an indication of the intensity of the
gradient in the current pixel.
Kx =
-1 0 1
-1 0 1
-1 0 1
Ky =
1 1 1
0 0 0
-1 -1 -1
Figure 2.8: Prewitt horizontal and vertical operators
Depending on the noise characteristics of the image or streaming video, edge
detection results can vary. Gradient-based algorithms such as the Prewitt filter have a
major drawback of being very sensitive to noise. The size of the kernel filter and
coefficients are fixed and cannot be adapted to a given image. An adaptive edge-detection
algorithm is necessary to provide a robust solution that is adaptable to the varying noise
levels of these images to help distinguish valid image content from visual artifacts
introduced by noise.