Hypoxia & living resources: Perspectives from Chesapeake ...Hypoxia & living resources: Perspectives...
41
Hypoxia & living resources: Perspectives from Chesapeake Bay and cross-system comparisons Denise Breitburg Smithsonian Environmental Research Center
Transcript of Hypoxia & living resources: Perspectives from Chesapeake ...Hypoxia & living resources: Perspectives...

Hypoxia & living resources:
Perspectives from Chesapeake Bay and
cross-system comparisons
Denise Breitburg
Smithsonian Environmental Research Center

Productive Fisheries
Contrasting effects of
nutrient enrichment
Atlantic menhaden in Narragansett Bay
Fish kills

Declining water quality
Declining fisheries landings
& health of fish populations
Long history of concern
Time
Mid 20th century
& health of fish populations
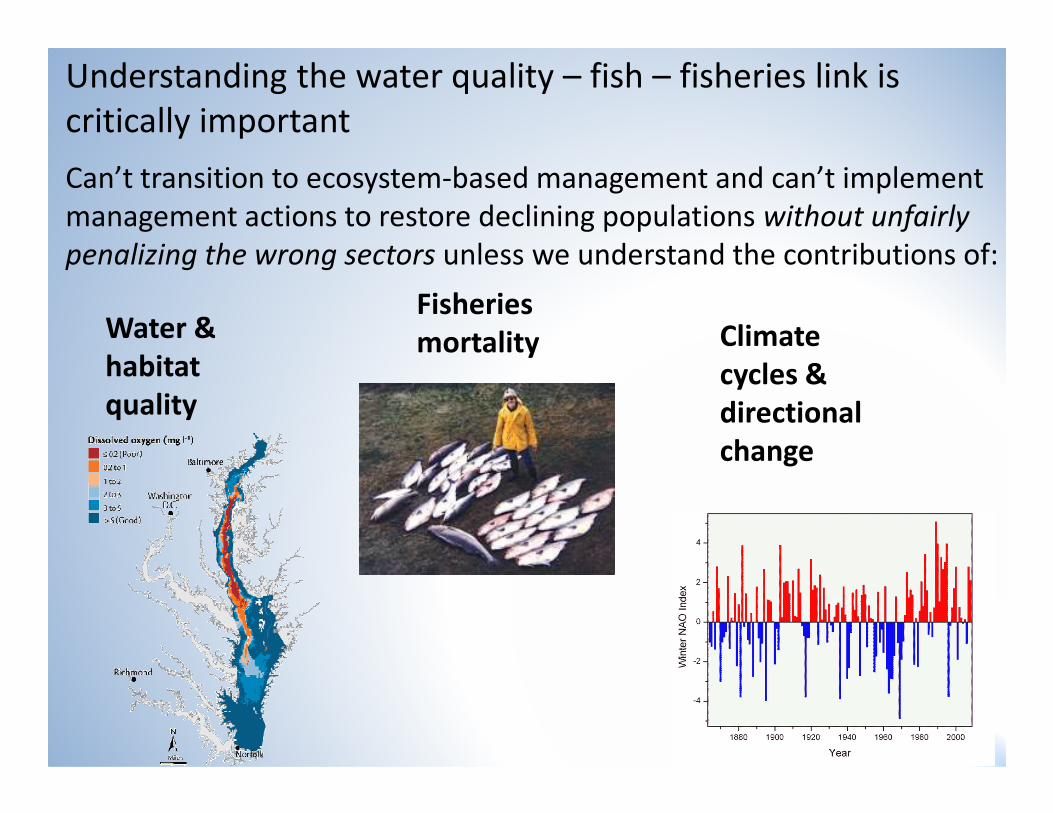
Understanding the water quality – fish – fisheries link is
critically important
Can’t transition to ecosystem-based management and can’t implement
management actions to restore declining populations without unfairly
penalizing the wrong sectors unless we understand the contributions of:
Water &
habitat
quality
Fisheries
mortality Climate
cycles &
directional quality directional
change

Chesapeake & beyond - outline
•What we know from experiments & field sampling about
effects on mobile consumers
•Why it’s hard to scale up to population-level effects
•Cross system comparisons
•Diel cycling hypoxia – mostly oysters
•Scaling up•Scaling up
•The other acidification problem

In Chesapeake Bay:
• Favors gelatinous zooplankton
• Reduces growth rates
Effects of hypoxia
at the local scale:
Mortality
Altered Trophic
Reduced Growth/Avoidance
• Reduces growth rates
• Forces fish (sturgeon, striped bass) into
• surface waters with high temperatures
• Compromises immune response of oysters
• High mortality of bay anchovy and
• maybe weakfish eggs
• Fish kills, mortality of newly settled oyster spat
• Important temperature * hypoxia interactions
…lost habitat, lost production, mortality
Altered Trophic
Interactions
Reduced
Reproduction
Reduced Immune
Response
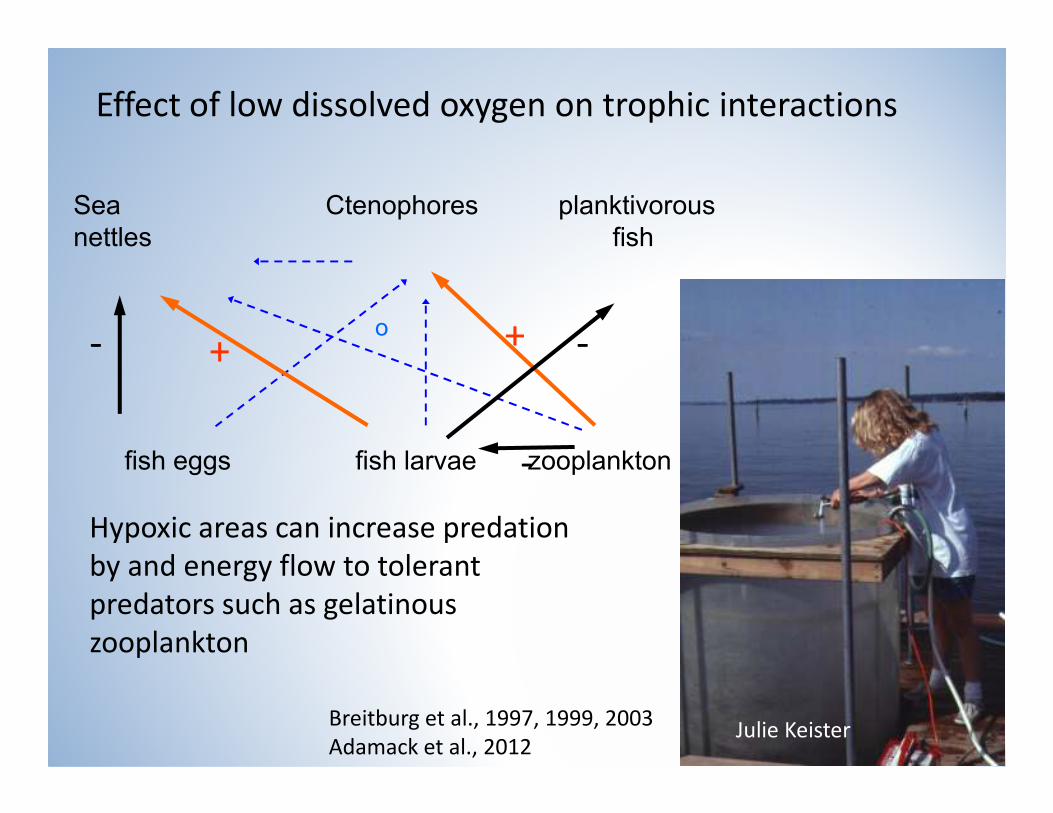
Sea Ctenophores planktivorous
nettles fish
+ +- -o
Effect of low dissolved oxygen on trophic interactions
Hypoxic areas can increase predation
by and energy flow to tolerant
predators such as gelatinous
zooplankton
fish eggs fish larvae zooplankton-
Julie KeisterBreitburg et al., 1997, 1999, 2003
Adamack et al., 2012
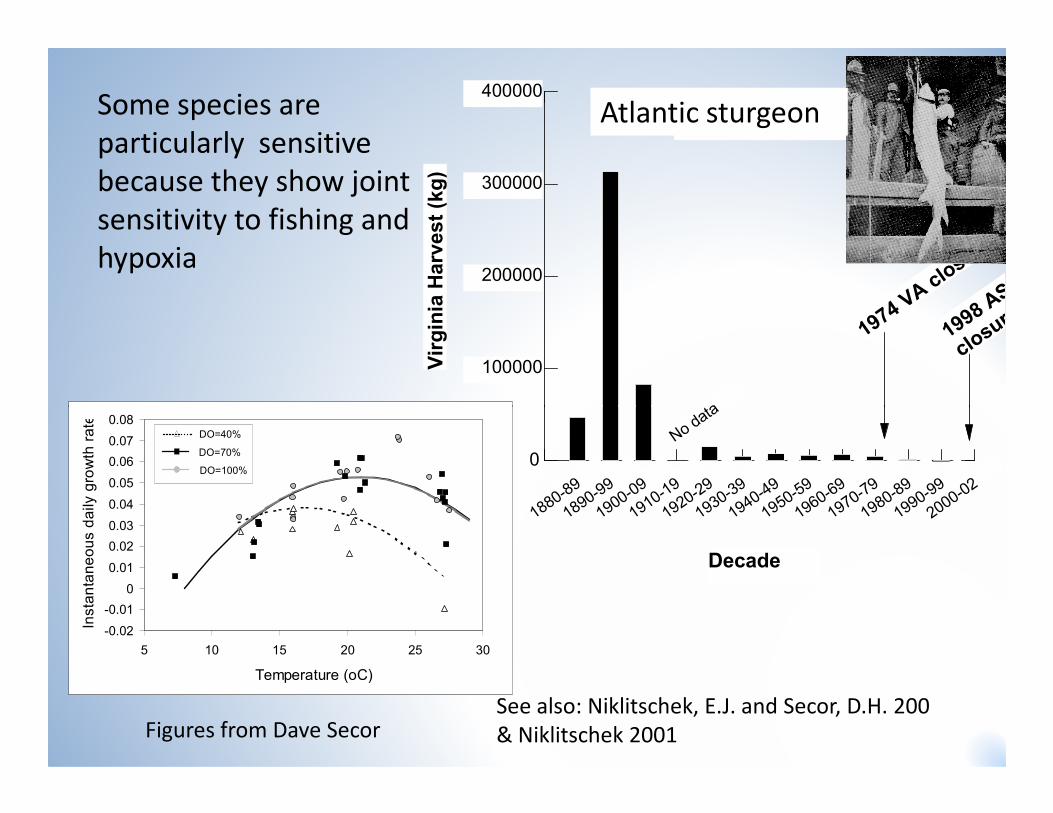
Some species are
particularly sensitive
because they show joint
sensitivity to fishing and
hypoxia
100000
200000
300000
400000
Virginia Harvest (kg)
No data
1974 VA closure
1998 ASMFC
closure
Atlantic SturgeonAtlantic sturgeon
1880-89
1890-99
1900-09
1910-19
1920-29
1930-39
1940-49
1950-59
1960-69
1970-79
1980-89
1990-99
2000-02
Decade
0
No data
Figures from Dave SecorSee also: Niklitschek, E.J. and Secor, D.H. 200
& Niklitschek 2001
-0.02
-0.01
0
0.01
0.02
0.03
0.04
0.05
0.06
0.07
0.08
5 10 15 20 25 30
Temperature (oC)
Instantaneous daily growth rate
DO=40%
DO=70%
DO=100%
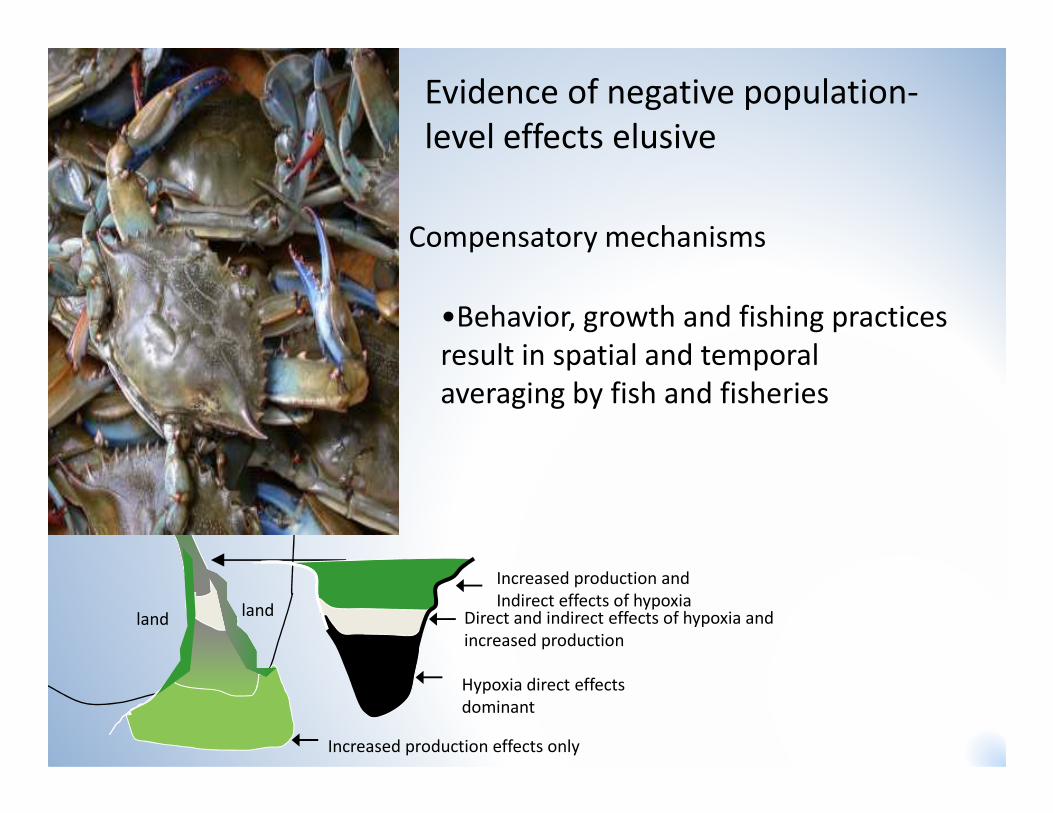
Compensatory mechanisms
•Behavior, growth and fishing practices
result in spatial and temporal
averaging by fish and fisheries
Evidence of negative population-
level effects elusive
averaging by fish and fisheries
Hypoxia direct effects
dominant
Direct and indirect effects of hypoxia and
increased production
Increased production and
Indirect effects of hypoxia
Increased production effects only
landland

•turbidity as a substitute refuge for
submerged macrophytes
Compensatory mechanisms
•Behavior, growth and fishing practices
result in spatial and temporal averaging by
fish and fisheries
Abundant Solomons Island
SAV during May 1938
submerged macrophytes
compared to Summer 1999

Strong effect of turbidity on piscivore
Lack of turbidity effect on 2
planktivores at high and low light
Figure from: http://www.bio.uib.no/modelling/files/fishvision_515x222.bmp
De Robertis et al. 2003

http://www.statesymbolsusa.org/IMAGES/New_Hampshire/striped_bass_art_380.jpg

Compensatory mechanisms
•Behavior, growth and fishing practices
result in spatial and temporal averaging by
fish and fisheries
•overfishing keeps populations below
•turbidity as a substitute refuge for
submerged macrophytes
•overfishing keeps populations below
habitat-determined carrying capacity –
therefore little effect of
decreased habitat
effects strongest when pops high and
affected habitat is critical and limited
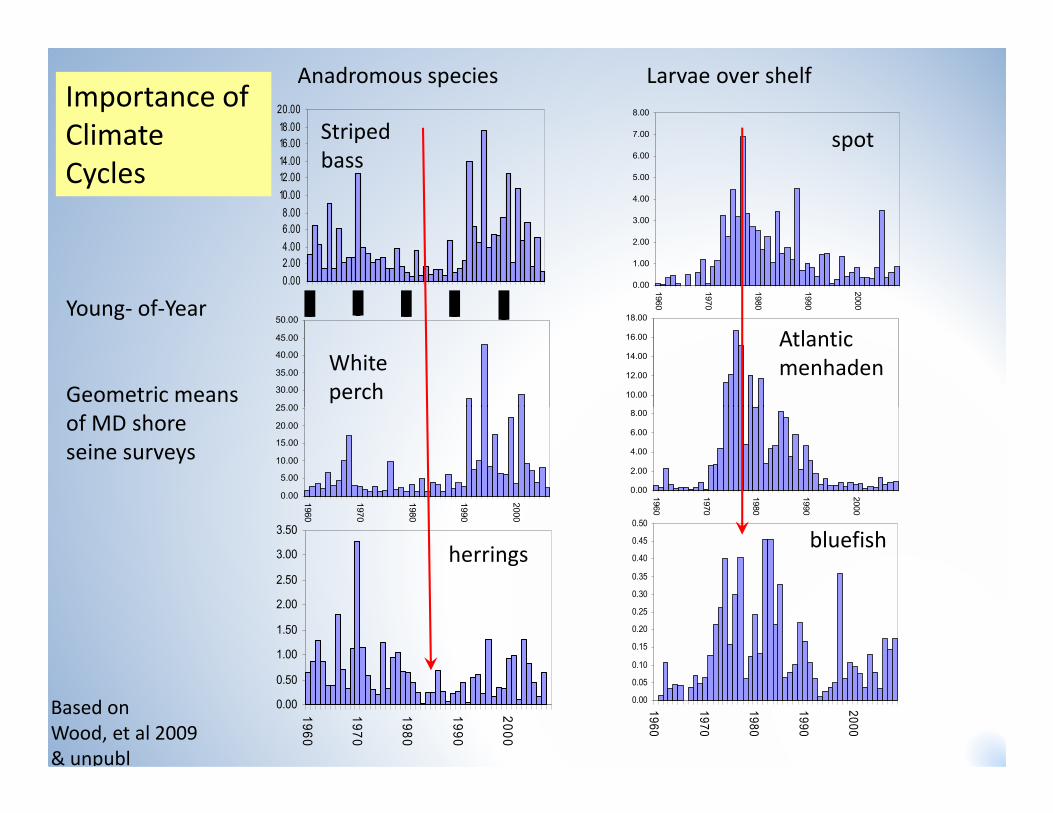
Anadromous species Larvae over shelf
0.00
1.00
2.00
3.00
4.00
5.00
6.00
7.00
8.00
1960
1970
1980
1990
2000
10.00
12.00
14.00
16.00
18.00
spot
Atlantic
menhaden
0.00
2.00
4.00
6.00
8.00
10.00
12.00
14.00
16.00
18.00
20.00
25.00
30.00
35.00
40.00
45.00
50.00
Striped
bass
White
perch
Young- of-Year
Geometric means
Importance of
Climate
Cycles
0.00
2.00
4.00
6.00
8.00
1960
1970
1980
1990
2000
0.00
0.05
0.10
0.15
0.20
0.25
0.30
0.35
0.40
0.45
0.50
1960
1970
1980
1990
2000
bluefish
0.00
5.00
10.00
15.00
20.00
25.00
1960
1970
1980
1990
2000
0.00
0.50
1.00
1.50
2.00
2.50
3.00
3.50
1960
1970
1980
1990
2000
herrings
of MD shore
seine surveys
Based on
Wood, et al 2009
& unpubl

Commercial Landings
0.0
1.0
2.0
3.0
4.0
5.0
6.0
1960
1970
1980
1991
2001
million pounds
striped
bass1.0
3.0
5.0
7.0
9.0
11.0
13.0
1960
1970
1980
1990
2000
million pounds
Atlantic
menhaden
600
800
1000
1200
thousand pounds
bluefish
0
500
1,000
1,500
2,000
2,500
1960
1970
1980
1990
2000
thousand pounds
white perch
0
200
400
1960
1970
1980
1990
2000
thousand pounds
10
20
30
40
50
60
70
1960
1970
1980
1990
2000
million pounds
blue crab
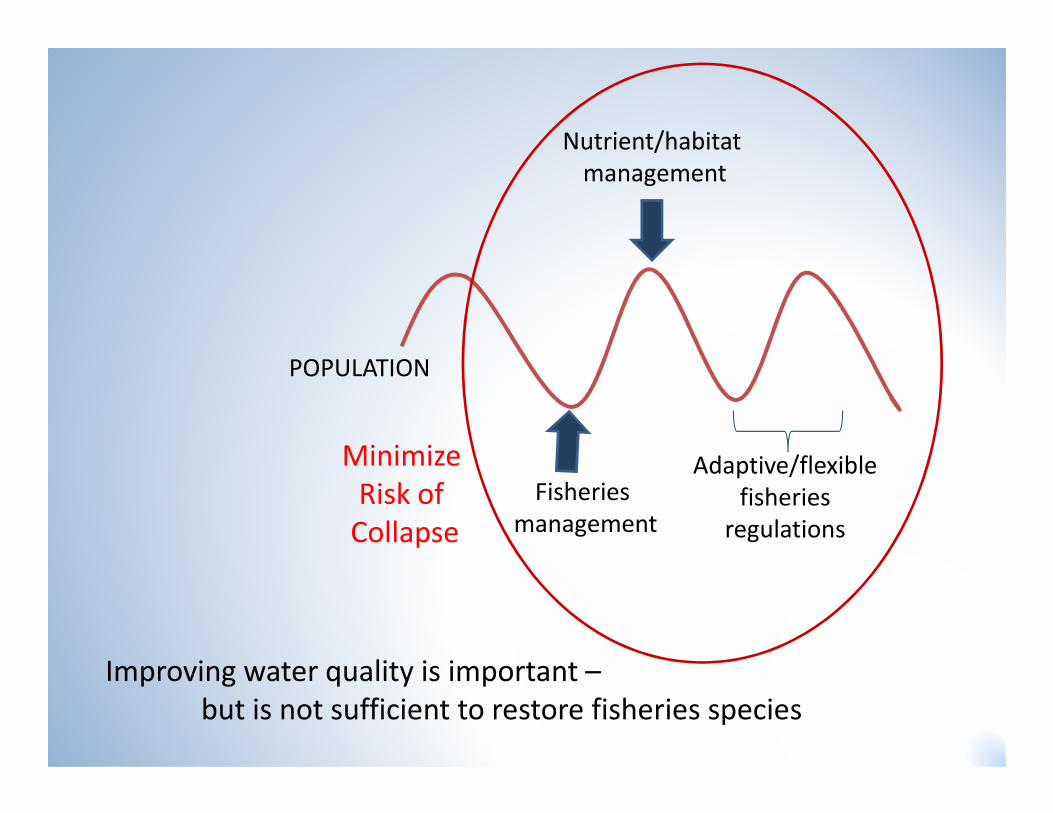
POPULATION
Nutrient/habitat
management
Fisheries
management
Adaptive/flexible
fisheries
regulations
Minimize
Risk of
Collapse
Improving water quality is important –
but is not sufficient to restore fisheries species

Landings fish and mobile invertebrates (log10 kg km-2 year -1)
2.6
2.8
3.0
3.2
3.4
3.6
3.8
4.0
4.2
4.4
4.4
Basin + atmos NBasin + Atmos N
<2 % hypoxia
Scaling up-
cross-system comparisons
Chesapeake BayLandings fish and mobile invertebrates (log10 kg km
N loadings (log10 kg km-2 surface area year -1)
2.5 3.0 3.5 4.0 4.5 5.0
2.6
2.8
3.0
3.2
3.4
3.6
3.8
4.0
4.2 Total N <2 % hypoxia
4-19% hypoxia
22-31% hypoxia
40-77% hypoxia
Breitburg et al., 2009. Ann
Rev Mar Sci

Is the problem relying on fisheries data to ask
questions about populations & food webs?
f
Mobile consumers
Food web
characteristics
NITROGEN
LOICZ
other system-specific models
Global NEWS model
Global atmospheric deposition
models
OCEANIC INPUTS
models results SYSTEM CHARACTERISTICS
ECOPATH FOOD WEB MODELS
biomasses
fisheries removals
food web composition
food web & ecosystem
metrics
HYPOXIA
persistence
extent
HYPOFIN working group
Bob Christian, John Harrison, Roman Zajac, Dave Chagaris,
Howard Townsend, Lori Davias, Behzad Mahmoudi, Sheila
Heymans, Olle Hjerne, Dennis Swaney, Denise Breitburg,
Karin Limburg, Lyne Morissette, Marta Coll, Kenny Rose, Mike
Frisk, Bob Diaz, Carrie Byron
characteristicsmodels results
system openness
upwelling
SYSTEM CHARACTERISTICS
area, depth
temperature
tidal range
chl a
primary productivity
additional recreational &
commercial landings data
Over 80 systems in database
Over 70 with full data from Ecopath models

log10 basin+atmospheric TN (kg km-2)
2 3 4 5 6 7
percent bottom area <3 m
g/L
0
20
40
60
80
100
120
diel-cycling hypoxia
log10 basin+atmospheric TN (kg km-2)
2 3 4 5 6 7
percent bottom area <3 mg/L
0
20
40
60
80
100
120
seasonalhypoxia
log10 basin+atmospheric TN (kg km-2)
2 3 4 5 6 7
percent bottom area <3 m
g/L
0
20
40
60
80
100
120
persistent deep basins
major upwelling systems Model R2= 0.72 p<0.003
Source of variation p upwelling_category 0.0392 log10 (openness) 0.0237 log10 basin+atmosTN 0.0472 warmest month mean oC 0.078

Systems with seasonal hypoxia
log10 m
obile consumer biomass (t km2)
0.8
1.0
1.2
1.4
1.6
Chesapeake
Bay ~ 23 T/km2
percent bottom < 3 mg L-1
0 10 20 30 40 50 60 70
log10 m
obile consumer biomass (t km
-0.2
0.0
0.2
0.4
0.6
0.8
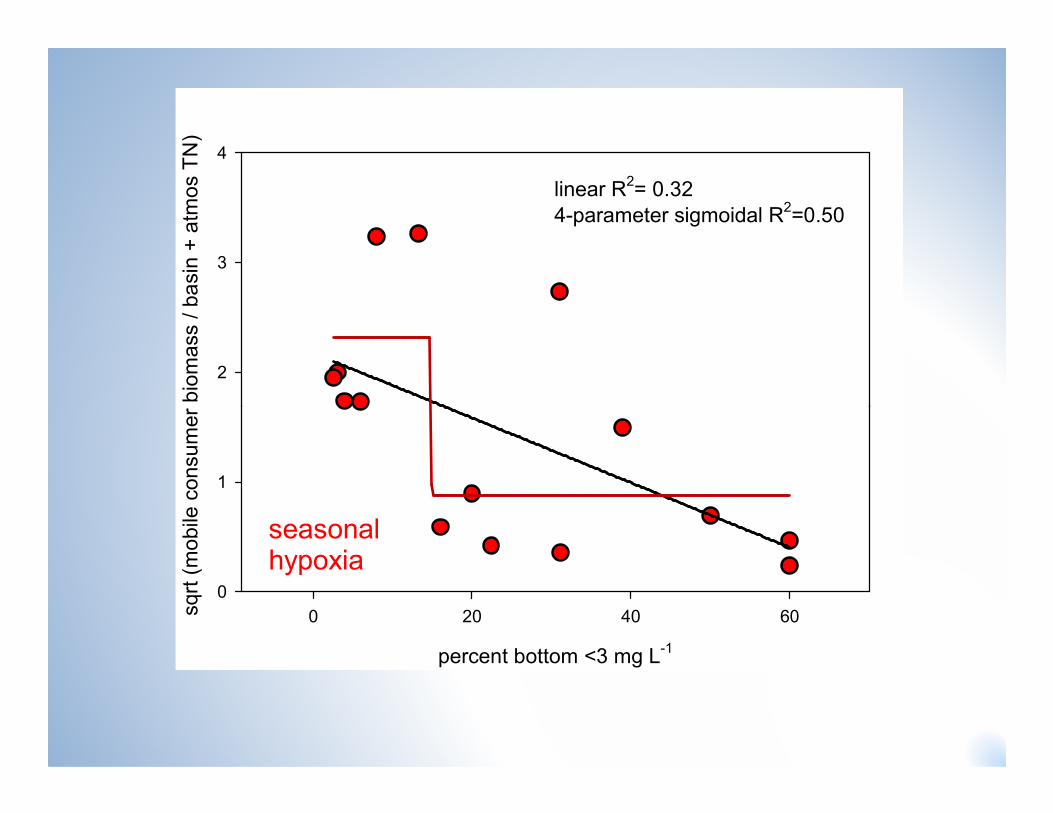
sqrt (mobile consumer biomass / basin + atm
os TN)
2
3
4
linear R2= 0.32
4-parameter sigmoidal R2=0.50
percent bottom <3 mg L-1
0 20 40 60sqrt (mobile consumer biomass / basin + atm
os TN)
0
1
seasonalhypoxia

Mean trophic level of catch
3.5
4.0
4.5
R2=0.27
HYPOFINMean trophic level of catch ~
Basin+atmospheric TN (p<0.001)
Upwelling category (p=.06)
Annual average temperature (p=0.02)
ln basin + atmospheric TN (kg km-3)
0 2 4 6 8 10 12 14
Mean trophic level of catch
1.5
2.0
2.5
3.0

mobile consumer catch (T km2)
6
8
10
12
14
16
mobile consumer biomass (T km2)
40
60
80
100
120
140
none-or-minima
l
diel-cycling
upwelling
seasonal
persiste
nt
mobile consumer catch (T km
0
2
4
6
Type of hypoxia
none-or-minimaldiel-cycling upwelling seasonal persistent
mobile consumer biomass (T km
0
20

Diel cycling hypoxia
dissolved oxygen (mg/L)
10
12
Natural phenomenon
Exacerbated by
• anthropogenic nutrient enrichment
• local hydrodynamics
• weather
dissolved oxygen (mg/L)
0
2
4
6
8
10
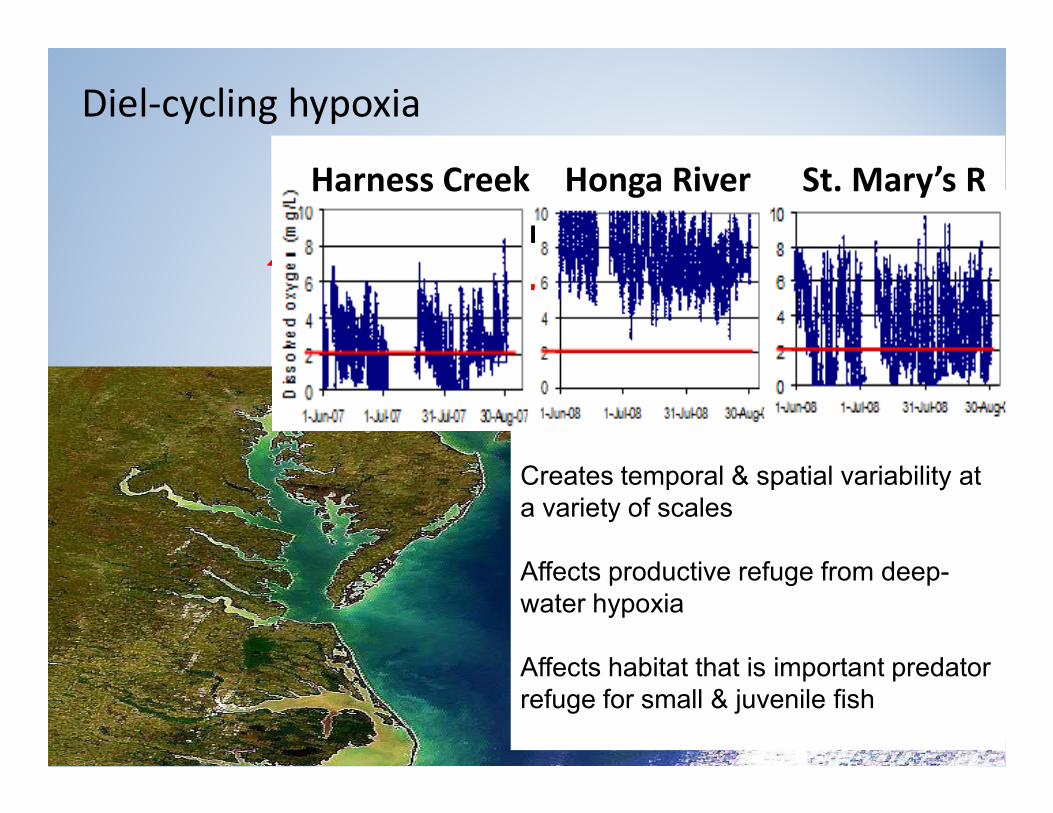
Diel-cycling hypoxia
Harness Creek, MD
Harness Creek Honga River
St. Mary’s River
Harness Creek Honga River St. Mary’s R
Creates temporal & spatial variability at
a variety of scales
Affects productive refuge from deep-
water hypoxia
Affects habitat that is important predator
refuge for small & juvenile fish
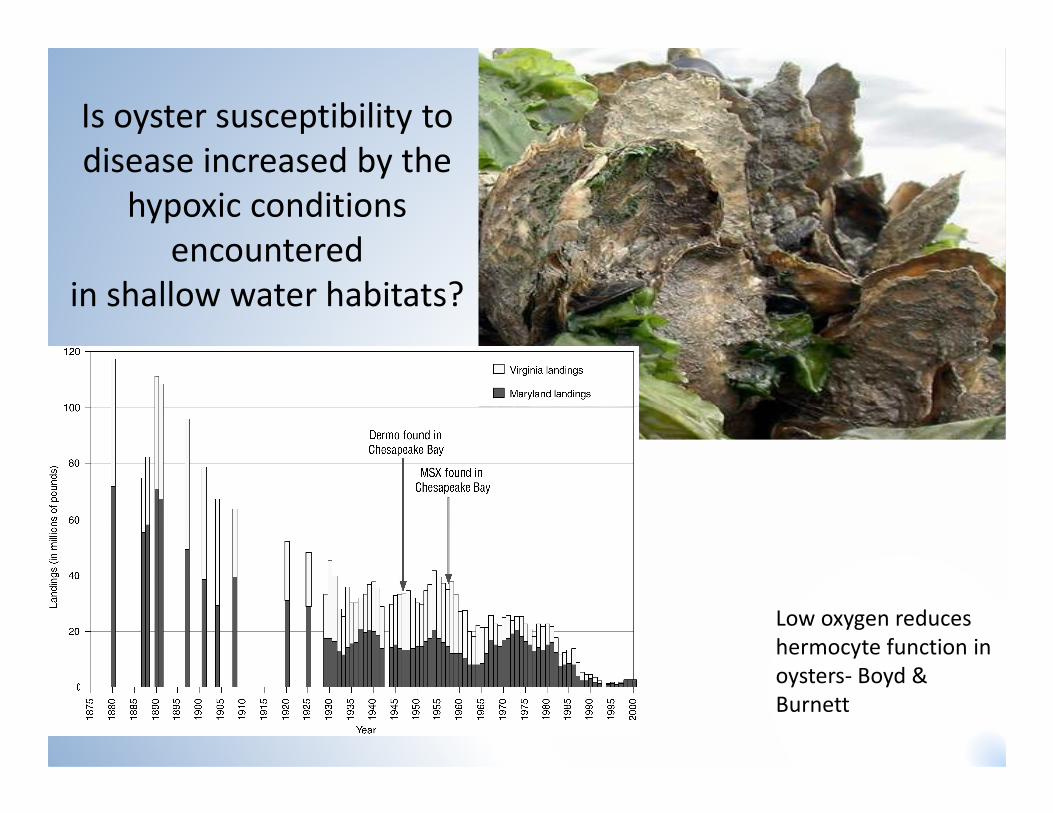
Is oyster susceptibility to
disease increased by the
hypoxic conditions
encountered
in shallow water habitats?
Low oxygen reduces
hermocyte function in
oysters- Boyd &
Burnett

2009
Infection prevalence (mean + SE)
0.3
0.4
0.5
2010
0.6
0.8
1 yr old 1 yr old
Diel-cycling hypoxia increases
acquisition of P. marinus infections
in experimental oysters
Jun 25
Oct 13
0.0
0.2
0.4
0.6
0.8Infection prevalence (mean + SE)
0.0
0.1
0.2
0.3
0.5 mg L-1
1.5 mg L-1
high oxygen control
0.0
0.2
0.4
Jun 25
Oct 13
0
2
4
6
8
8 12 4 8 12 4
Dis
solv
ed
oxy
ge
n (
mg
/L)
AM PM
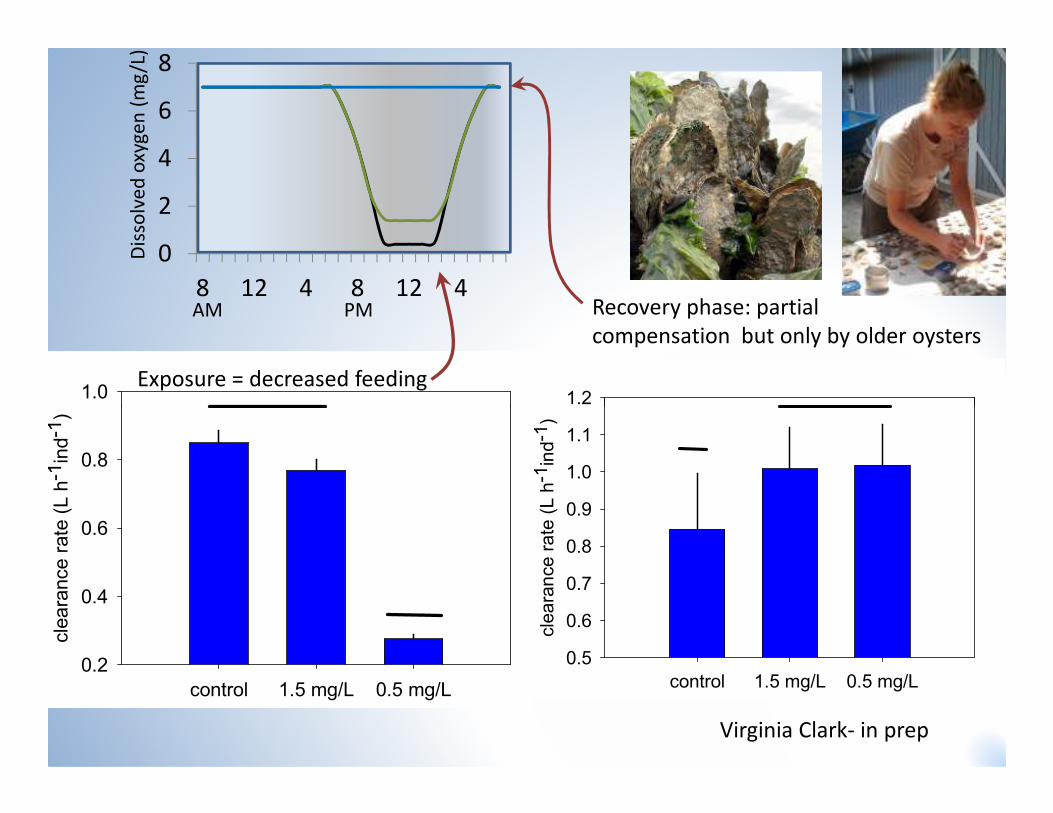
1.21.0Exposure = decreased feeding
Recovery phase: partial
compensation but only by older oysters
control 1.5 mg/L 0.5 mg/L
clearance rate (L h-1ind-1)
0.5
0.6
0.7
0.8
0.9
1.0
1.1
1.2
control 1.5 mg/L 0.5 mg/L
clearance rate (L h-1ind-1)
0.2
0.4
0.6
0.8
Virginia Clark- in prep

Field experiment (2008-09)
} 2008
2009
Pa
tuxe
nt
10.0Jun Jul Aug OctSep
Darryl Hodorp
(USGS) , in prep
julian day
160 180 200 220 240 260 280 300
Daily m
inimum [DO] (m
g l-1)
0.0
2.0
4.0
6.0
8.0
10.0
HCR
HPL
LMN
MUL
SERC
Jun Jul Aug OctSep
3 mg/l
2 mg/l
1 mg/l

Prevalence Intensity
1 yr olds: P= 0.009 P= 0.02
R2 = 0.53 R2 = 0.44
2-3 yr olds: ns P= 0.014
R2 = 0.51
Increased disease
Prevalence & intensity

Decreased growthPercent increase in shell height
35
40
45
50
Frequency of days with minimum [DO] <= 2.0 mg/L
0 10 20 30 40
Percent increase in shell height
15
20
25
30
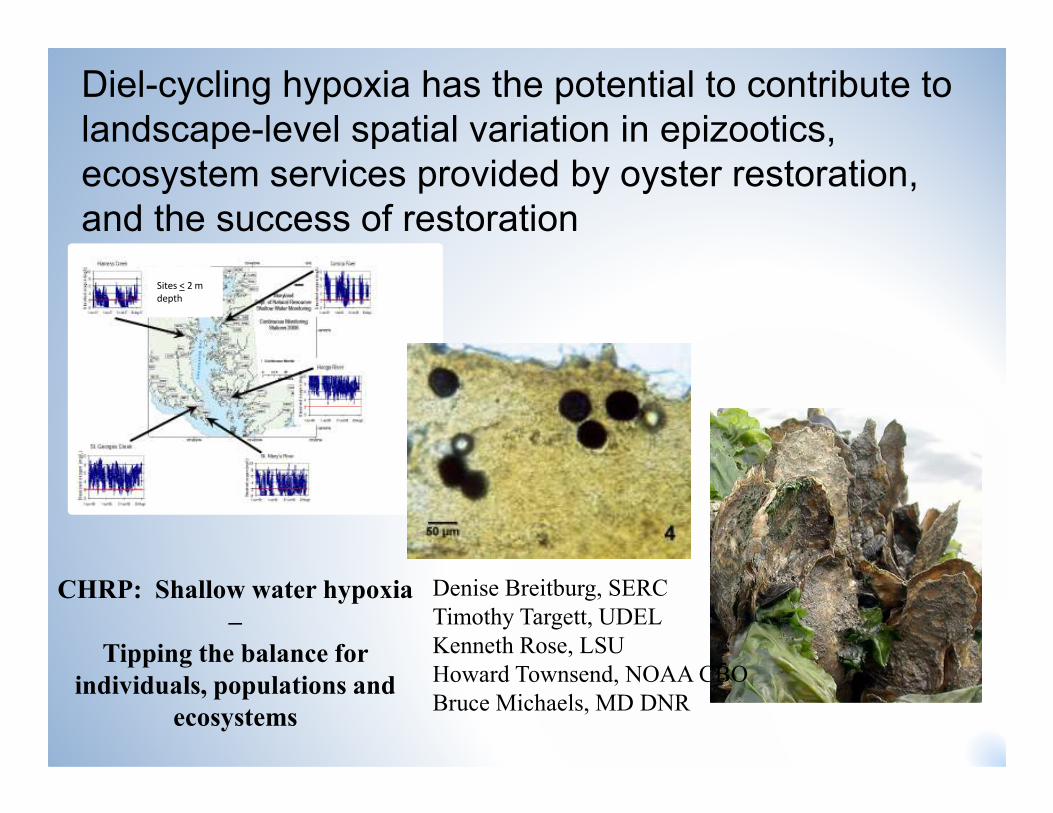
Sites < 2 m
depth
Diel-cycling hypoxia has the potential to contribute to
landscape-level spatial variation in epizootics,
ecosystem services provided by oyster restoration,
and the success of restoration
CHRP: Shallow water hypoxia
–
Tipping the balance for
individuals, populations and
ecosystems
Denise Breitburg, SERC
Timothy Targett, UDEL
Kenneth Rose, LSU
Howard Townsend, NOAA CBO
Bruce Michaels, MD DNR
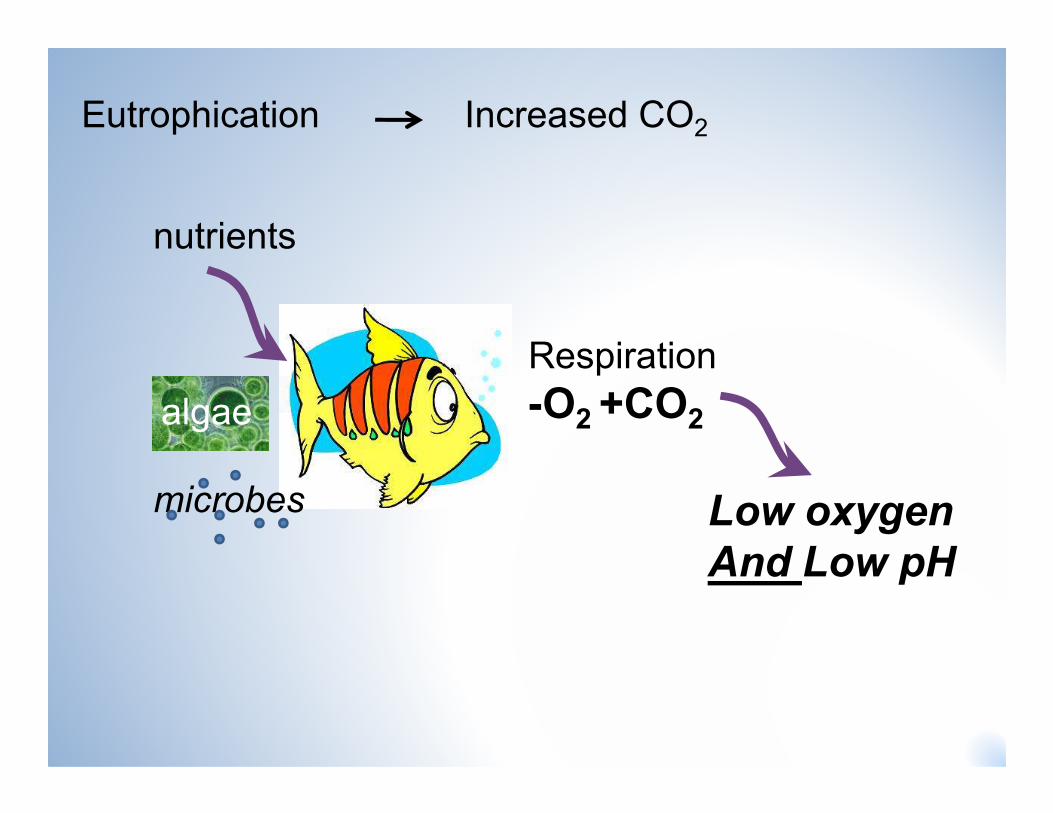
Eutrophication Increased CO2
nutrients
Respiration
-O2 +CO2algae -O2 +CO2
microbes Low oxygen
And Low pH
algae

dissolved oxygen (mg/L)
0
2
4
6
8
10
12
8.0
8.5
Oxygen and pH daily cycles
UNEP/GRID-Arendal. Global Ocean Acidification. UNEP/GRID-
Arendal Maps and Graphics Library. 2009. Available at:
http://maps.grida.no/go/graphic/global-ocean-acidification.
time of daypH
6.5
7.0
7.5
8.0

y = 0.1557x + 6.7573
R² = 0.7186
7.2
7.4
7.6
7.8
8M
ea
n d
ail
y m
inim
um
pH
hypoxia and pH in shallow water
June – August 2004-2009
6.8
7
7.2
0 1 2 3 4 5 6 7 8
Me
an
da
ily
min
imu
m p
H
Mean daily minimum dissolved oxygen (mg/L)
Data from MD-DNR shallow water monitoring
program continuous monitoring sites with mean
summer salinity >7.0
eyes on the bay

Experimental set-up for testing effects individual and interactive effects of diel-cycling
hypoxia and pH on oyster disease dynamics, growth and filtration
Master
(1 rep/trt)
Slave
(5 reps/trt)
Dissolved
Oxygen
(mg/L)pH
Treatments
control control
7.0 7.0 –– 8.08.0control
LabView program
NIT
RO
GE
NN
ITR
O
GE
NN
ITR
O
GE
NN
ITR
O
GE
NN
ITR
O
GE
NN
ITR
O
GE
NC
O2
OX
YG
EN
NIT
RO
GE
N
Mass flow
controllers
(Dakota)
Air compressorsCO2
analyzer
Raw
Estuarine
water
Raw
Estuarine
water
Adult infected oysters
7.0 7.0 –– 8.08.01.5 - 10
control0.5 - 10
7.0 7.0 –– 8.08.00.5 - 10
Barometric pressure
Perkinsus
Raw
Estuarine
water
RawRaw
Estuarine
water
Extra algae
Dissolved oxygen (Oxyguard)
pH (Durafet)
Temperature
Salinity

Is oyster susceptibility to disease increased by the
hypoxic, acidic conditions encountered
in shallow water habitats?
Why focus on shallow water is important?
•Memory of oysters in knee deep water
•Shallow water restoration may have largest effect on •Shallow water restoration may have largest effect on
water quality
•Shallow water restoration may have largest effect on
shoreline protection
•Shallow water restoration has greatest potential for
co-restoration of bivalves & SAV
•Shallow water is a refuge from deep water persistent low
oxygen

Major need to consider
co-occurring stressors –
fisheries, pH, etc. - and
develop tools to integrate
across time, space and
species
Large persistent dead zones are dramatic, but short-
lived hypoxia and constantly changing oxygen may
have important effects relevant to management &
restoration
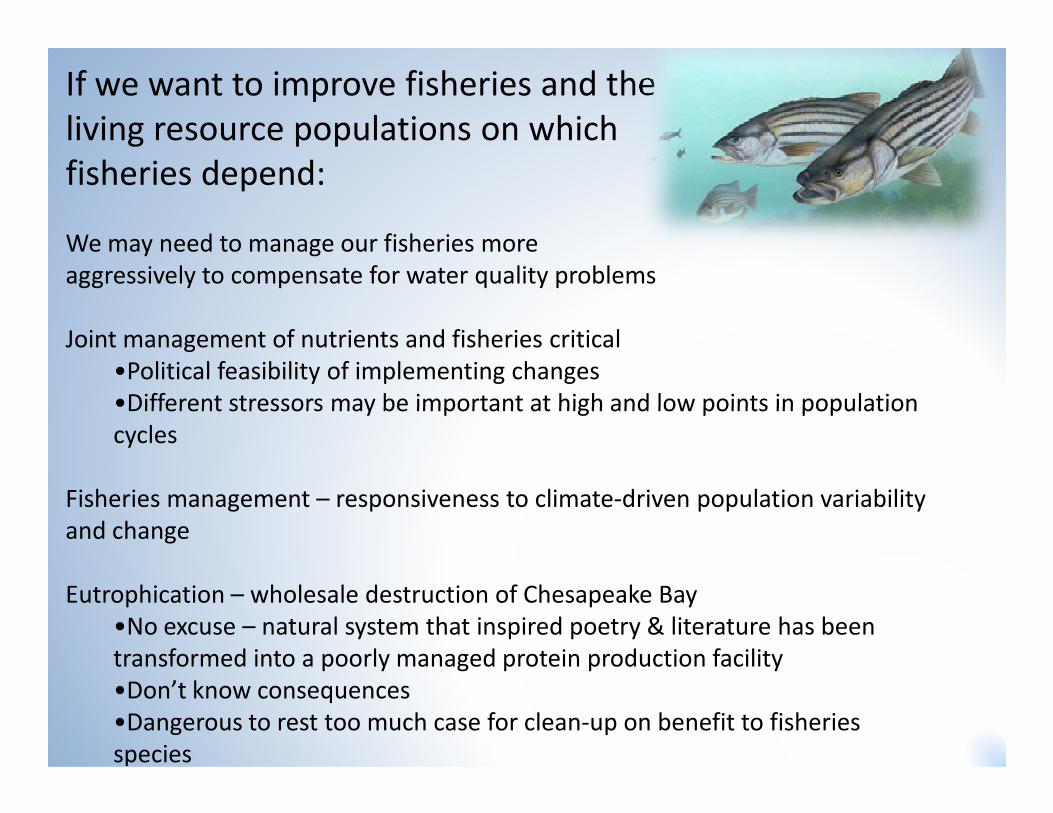
If we want to improve fisheries and the
living resource populations on which
fisheries depend:
We may need to manage our fisheries more
aggressively to compensate for water quality problems
Joint management of nutrients and fisheries critical
•Political feasibility of implementing changes
•Different stressors may be important at high and low points in population •Different stressors may be important at high and low points in population
cycles
Fisheries management – responsiveness to climate-driven population variability
and change
Eutrophication – wholesale destruction of Chesapeake Bay
•No excuse – natural system that inspired poetry & literature has been
transformed into a poorly managed protein production facility
•Don’t know consequences
•Dangerous to rest too much case for clean-up on benefit to fisheries
species

Relating community composition, abundance, growth, and condition of
aquatic macrofauna to watershed land use and shoreline alteration in
Chesapeake Bay.
Denise Breitburg
Matthew S. Kornis
Rochelle D. Seitz
Donna M. Bilkovic
Richard Balouskus
Timothy E. Targett
Ryan S. King
Steve Giordano
Shoreline alteration
Steve Giordano
Jim Uphoff
John M. Jacobs
Lori A. Davias
Keira Heggie
Heather Soulen
Part of Jordan et al. mid-Atlantic
stressors grant
Land use
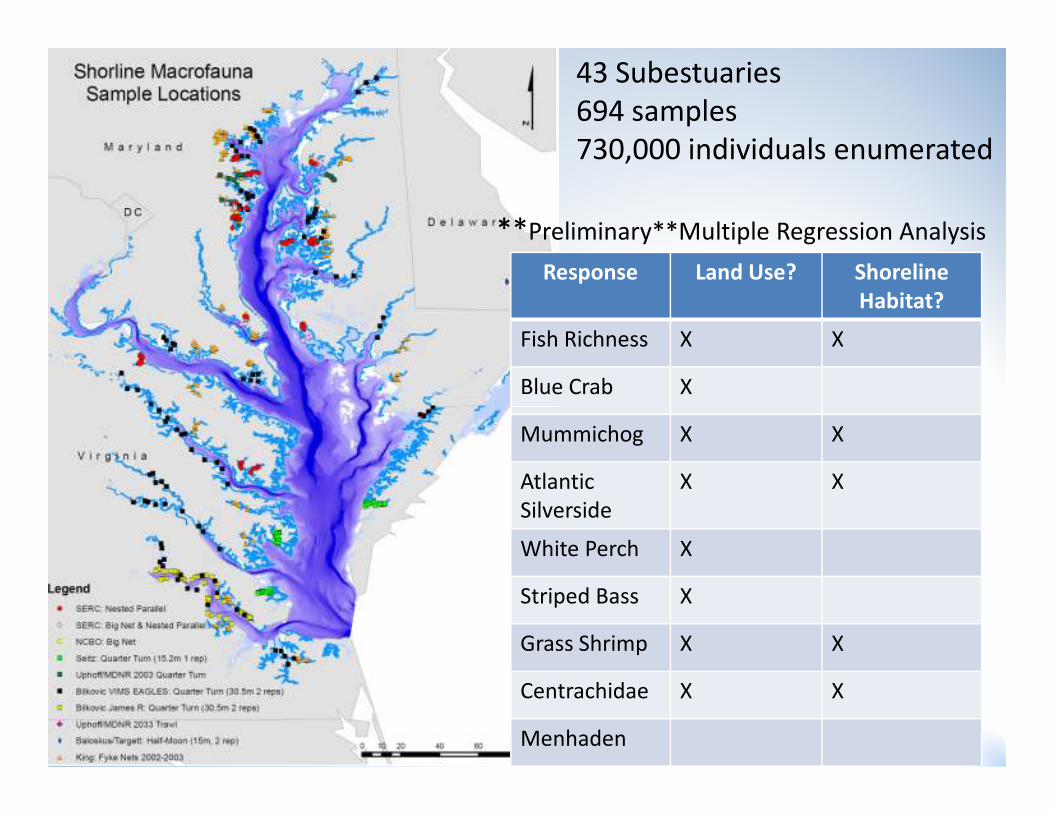
43 Subestuaries
694 samples
730,000 individuals enumerated
**Preliminary**Multiple Regression Analysis
Response Land Use? Shoreline
Habitat?
Fish Richness X X
Blue Crab X
Mummichog X X
Atlantic
Silverside
X X
White Perch X
Striped Bass X
Grass Shrimp X X
Centrachidae X X
Menhaden