Hypermarket Competition and the Diffusion of Retail - DIW Berlin
36
Jonathan Beck Michal Grajek Christian Wey Hypermarket Competition and the Diffusion of Retail Checkout Barcode Scanning Discussion Papers Berlin, November 2005
Transcript of Hypermarket Competition and the Diffusion of Retail - DIW Berlin

Jonathan Beck Michal Grajek Christian Wey
Hypermarket Competition and theDiffusion of Retail Checkout Barcode Scanning
Discussion Papers
Berlin, November 2005

IMPRESSUM
© DIW Berlin, 2005
DIW Berlin German Institute for Economic ResearchKönigin-Luise-Str. 5 14195 Berlin Tel. +49 (30) 897 89-0 Fax +49 (30) 897 89-200 www.diw.de
ISSN print edition 1433-0210 ISSN electronic edition 1619-4535
All rights reserved. Reproduction and distribution in any form, also in parts, requires the express written permission of DIW Berlin.
.

Hypermarket competition and the diffusion
of retail checkout barcode scanning
Jonathan Becka,b,∗ Michal Grajeka,b Christian Weyc,d,e
November 2005
Abstract
This paper presents a set of panel data to study the diffusion of retail checkout bar-code scanning in ten European countries over the period 1981-1996. Estimates froma standard diffusion model suggest that countries differ most in the long-run dif-fusion level of barcode scanning and less in timing or diffusion speed. We presentevidence that the emergence of hypermarkets raises competitive intensity and usehypermarket data, among other variables, in a pooled estimation. Results suggestthat hypermarket competition reduces long-run adoption of information technology(IT) in retailing. In particular, the emergence of hypermarkets seems to deepen retailsegmentation by inducing potential adopters (e.g. supermarkets) to exit the marketand/or by discouraging adoption by other retail formats. Consistent with expecta-tions, scale and income effects spur IT diffusion and there is a classic substitutioneffect: when wages rise, diffusion of a labor-saving technology such as barcode scan-ning is more intense. We do not find a significant impact of employment protectionlegislation.
JEL classification: L5, L81, O33.Keywords: IT diffusion; retail competition; hypermarkets.
Affiliations: aWissenschaftszentrum Berlin (WZB), bHumboldt Universitat zu Berlin,cDeutsches Institut fur Wirtschaftsforschung (DIW), dTechnische Universitat Berlin,eCEPR, London.
∗Corresponding author ([email protected]; postal address: WZB, Reichpietschufer 50, D-10785 Berlin).Thanks to Joe Clougherty, Lapo Filistrucchi, Oz Shy, Irina Suleymanova and participants at the EARIE con-ference in Porto, the 5th ZEW Conference on the Economics of ICT in Mannheim, the BDPEMS workshop,the InterVal yearly meeting and the WZB seminar for comments and helpful discussions. Anna Kalbererand Kemal Azun provided able research assistance. Financial support from the German Federal Ministry ofEducation and Research, project InterVal – Internet and value chains (01AK702A), is gratefully acknowledged.The authors are responsible for all remaining errors.

1 Introduction
The retail sector has recently gained attention from two rather independent research
streams: a literature devoted to productivity effects of information technology (IT) on
the one hand, and a literature concerning the industrial organization and regulation of
retail markets on the other hand. First, cross-country productivity studies attribute large
post-1995 productivity gains in the United States to increased IT usage mainly in the
distribution sector. Some even identify a ‘retail revolution’ (Ark et al., 2005; Nakamura,
1999). Most European countries, however, have not experienced such a manifest develop-
ment in retail productivity (Timmer and Inklaar, 2005). Second, industrial organization
scholars – alarmed by the growth of globally organised retailers such as Wal-Mart, Car-
refour and Tesco – analyse the emergence of large-scale retailing, particularly in the form
of hypermarkets, and the associated increase in market power (Dobson and Waterson,
1999; European Commission, 1999; FTC, 2001; Competition Commission, 2000).
A closer look reveals that both research streams are strongly related. Most prominently,
insufficient productivity performances are often ascribed to anti-competitive retail regu-
lation (McKinsey Global Institute, 2002; Scarpetta et al., 2002). Yet, despite a rich parallel
literature on the link between retail regulation and employment (Bertrand and Kramarz,
2002, for example), empirical studies of the relationship between retail regulation or com-
petition on the one hand and retail innovation or productivity on the other hand are rare.
We are only aware of studies based on firm-level data, for example Foster et al. (2002) and
Levin et al. (1992). Firm-level data, however, typically lack variation in the regulatory en-
vironment and hence provide little opportunity to examine important policy issues.
In this paper, we take a cross-country perspective to analyse the relationship between
a distinct form of regulated retail competition (hypermarket competition) and diffusion
of a distinct retail IT (barcode scanning). We abstract from productivity concerns: given
that IT investments are productive, why is their intensity so different across industri-
alised countries? Using data on the diffusion of barcode scanning in retail outlets of ten
European countries, we first obtain country-specific estimates for a standard diffusion
model. Results indicate substantial cross-country differences in the long-run diffusion
level of barcode scanning, corroborating the findings in the productivity literature. Then,
2
we add data on a number of explanatory factors and assess their effect on IT diffusion in
a pooled estimation.
Our particular focus is on the role of hypermarkets in retail competition and IT diffusion.
While we present evidence that the emergence of hypermarkets represents an increase in
the intensity of competition in retailing, results from the pooled estimation suggest that
such competition has reduced the long-run IT diffusion level. We identify two – poten-
tially independent – effects that may drive this result. First, hypermarket competition
induces a selection effect: hypermarket entry seems to cause exit of potential IT adopters,
namely smaller-sized supermarkets. Second, there is an encouragement effect: hypermar-
kets presumably adopt barcode scanning early and thereby dis- or encourage subsequent
adoptions of rival retail formats.
We also consider other explanatory factors. In particular, we find evidence for a clas-
sic substitution effect: when wages rise, diffusion of a labor-saving technology such as
barcode scanning is more intense. Scale and income effects are also important determi-
nants of IT diffusion, results which may explain the U.S.-Europe divide in IT usage. We
do not find a significant impact of employment protection legislation. While relevant in
their own right, the above results may also help predict the upcoming “revolution at the
checkout counter” (Brown, 1997), which will involve the replacement of barcode scan-
ning by radio frequency identification (RFID).
The rest of the paper is organised as follows. In the following section, we present the
data on checkout barcode scanning, our analytical approach to estimating a diffusion
function, and results from country-wise estimations. In section 3, we introduce and dis-
cuss a number of determinants of IT diffusion and provide some precursory evidence
on hypermarket competition. In section 4, we propose an econometric specification for
pooled estimation and report respective results, including a number of robustness checks.
Section 5 concludes the paper.
3

2 Checkout barcode scanning across Europe
We begin with a first glance at the data on barcode scanning in Europe. In contrast to the
United States, where the first retail outlet was equipped with a barcode scanner already
in 1974 (Nelson, 2001, and table 2), diffusion of barcode scanning in Europe did not take
off before the 1980s. Until 1997, the national member organizations of the European
Article Numbering Association (EAN) collected data on the number of retail outlets with
scanner installations. These data are published for the years 1981 to 1996 in the yearly
reports of the EAN. We combine this information with data on the total number of retail
outlets in order to obtain a measure of the relative intensity of barcode scanning within a
country.1
Accordingly, figure 1 indicates how many retail outlets use barcode scanning (in %, scat-
ter points), separately for six of the ten countries we study. Figure 2 in the appendix plots
the data for the remaining countries. Lines represent fitted values from a country-specific
estimation of a logistic growth function (discussed below). While all series accord with
a sigmoid-shaped curve common to diffusion processes, countries differ significantly in
the intensity of barcode scanning. Our objective is to shed some light on the factors un-
derlying these differences by means of a pooled estimation.
Yet, absolute cross-country differences should not be taken too literally. Countries may
differ in measurement of the total number of retail outlets. For example, some coun-
tries may include mobile outlets (‘street traders’), others not. In our pooled estimation
described in section 4, we account for such potential differences. Nevertheless, coun-
try differences pertain if we relate the number of barcode scanning stores to population
instead of outlet figures.
From today’s perspective, these figures also appear to exhibit implausibly low adoption
rates. After all, our daily grocery shopping experience suggests that barcode scanners are
ubiquitous. Yet, notice that we consider not only grocery retailing, but the whole retail
sector; which includes types of retailers who simply are not potential users of barcode
1The earliest EAN report available is the 1983 report, which also gives figures for 1981 and 1982 formost countries (or indicates that there were no scanning stores before 1983 in a particular country). TheEAN reports include data for more than the ten countries we study. Our sample results from other datalimitations. Section 3.1 presents the data and its sources in more detail.
4

Figure 1: Number of barcode scanning stores (in %, by country)
scanning – for example flower shops, repair shops or bakeries. Furthermore, the EAN
data concern only fixed scanners in checkout counters. Many smaller retailers now work
with hand-held or mobile barcode scanners. The way the EAN data is presented strongly
suggests that it does not include such hand-held scanners: the 1994 report attempts to
distinguish between fixed and hand-held scanners, but most countries (including those
in our sample) only report the total number of scanning stores or relatively low figures
for stores with hand-held scanners. Apparently, the EAN stopped data collection in 1997
not only because barcode scanning was considered a standard technology by then, but
5

also because the increasing number of scanner types was hard to manage.2 We argue
below that – since it is restricted to checkout barcode scanning – for most countries in the
sample our dataset is sufficient for an econometric study.
2.1 Analytical framework
In line with most empirical studies of aggregate data on diffusion, we employ the logistic
function as analytical tool.3 We use it in a reduced-form manner, although a number of
theoretical models of new technology adoption generate diffusion patterns represented
by the logistic or related functions (Geroski, 2000; Stoneman, 2002). The logistic function
captures the typical sigmoid shape through three interpretable parameters:
St =S∗
1 + exp(−β(t− τ)),
where S∗ = γNt.(1)
St indicates the number of adopters (outlets with a checkout barcode scanner) at time
t. S∗ is the potential number of adopters: the ‘ceiling’ or saturation level to which St
converges. It is a fraction γ of the total number of outlets Nt.
Since the logistic function is symmetric, St equals half of its saturation level at the curve’s
inflection point: the date t at which the growth rate of the number of adopters is no
longer increasing. τ indicates this inflection point and is hence a measure for the timing
of adoption – it shifts the S-curve forwards or backwards on the timeline. Too see this,
consider tk, the moment in time where a share k of the saturation level is reached:
S∗
1 + exp(−β(tk − τ))= kS∗
or tk = τ − β−1log(k−1 − 1).
At k =.5, tk = τ. Differentiating equation 1 with respect to time shows that coefficient β is
a measure for the speed of adoption. It gives the growth rate of St, relative to its distance
2In a telephone conversation with German EAN representatives, we were told that collection of thesedata became increasingly difficult during the mid-1990s.
3With micro data, discrete choice and hazard rate models are commonly used, for example see Karshenasand Stoneman (1993), Astebro (2004), and the references therein.
6

to the saturation level: dStdt
1St
= β S∗−StS∗ . The growth rate of St attains it’s maximum, β
2 , at
the inflection point t = τ.
Our approach differs from earlier diffusion studies in two respects. First, these studies
often follow the seminal work by Griliches (1957) and use another version of equation 1,
where St = S∗1+exp(−α−βt) . Whereas the advantage of that approach is that it lends itself
easily to log-linearisation, its disadvantage is that α is erroneously interpreted as a pure
timing indicator. Instead, equation 1 shows that α = βτ and hence ‘timing’ estimates for
α resulting from the traditional approach are strongly correlated with respective ‘speed’
estimates for β. Second, most other studies relate the speed or timing coefficients of
equation 1 to independent variables (Gruber and Verboven, 2001, for example), whereas
we focus on the saturation level γ in our pooled estimation (section 4). Actually, in a late
comment on his earlier work, Zvi Griliches proposed to do exactly that:
“Adding parameters to the curve itself or fiddling with the functional form is
not an attractive alternative, in my opinion. What one gains in fit one loses in
interpretability. Instead, I would now respecify the model so that the ceiling
is itself a function of economic variables that change over time.”
(Griliches, 1980, p. 1463)
2.2 Country-wise estimation
We obtain the fitted values shown in figure 1 from country-specific nonlinear least squares
(NLS) estimations of equation 1 with an additive i.i.d. error term. Nt – the number of out-
lets – is counted in hundreds such that γ indicates the saturation level as the percentage
of barcode scanning stores. Table 1 provides more detailed results on these estimations.
In line with the productivity studies cited before, cross-country differences seem to be
most pronounced with respect to the saturation level of IT adoption as measured by γi.
For example, Austria is estimated to have about 24% of outlets with barcode scanning
in the long run but Italy only 1%. Again, these differences arise not only from different
adoption patterns (St) but also from different underlying retail market structures (Nt).
The Italian retail market, for example, is still highly segmented, with many small but
specialized retailers selling goods that in other countries are sold jointly by larger retail-
7

Table 1: Estimates from country-wise regressions∗
Country γi βi τi Observations R2
Austria 24.2a .50a 1994.0 14 .999Belgium 16.0a .39 1994.1 12 .999Denmark 10.7 .42 1992.1 15 .992France 10.7 .41 1994.4 13 .996Germany 5.2a .41 1992.7a 15 .999Ireland 1.3a .48 1992.7a 16 .998Italy 1.1a .45 1992.0 15 .986Netherlands 7.6 .31a 1994.8 14 .997Spain 3.9a .39 1995.1 16 .978United Kingdom 15.4 .41 1995.8 16 .995
Cross-country average 9.6 .42 1993.8 10∗Parameter estimates from country-wise NLS estimation of equation 1.aCoefficient differs significantly from cross-country average(95% confidence level, F-test based on asymptotic standard errors).
ers. Cross-country differences with respect to timing and speed of diffusion seem less
pronounced. Only in two cases do estimates for βi and τi differ significantly from the
cross-country average (which implies 20% growth in the number of barcode scanning
stores around year 1994). We therefore focus on explaining differences in γi with a joint
regression analysis of the panel.
The estimated saturation level for Ireland also deserves a note. In contrast to the Italian
case, we are rather surprised by the low value, since Ireland’s retail structure is more
comparable to the UK’s (cf. table 7 in the appendix). As Ireland has developed strongly
throughout the 1990s, we presume that our data cover only the very beginning of a corre-
sponding diffusion process. In other words, our series for Ireland may lack its inflection
point, which would lead to unreliable estimates (Debecker and Modis, 1994). We get back
to this point in section 4.
Regarding all other countries in our sample, a comparison of these estimates to U.S. fig-
ures suggests that our data should cover a sufficient part of the diffusion process. U.S.
trade magazines stopped reporting detailed adoption figures already in 1985. Table 2,
which compiles U.S. data from various sources, shows that the number of barcode scan-
ning stores started to rise slowly in the mid-1970s and quickly went up in the late 1970s
8

and early 1980s.4 But at least within the group of food retailers – the main users of fixed
checkout scanners – U.S. growth appears to have come to a halt by the end of the 1980s.
With Europe’s time lag being roughly a decade, we should expect diffusion of fixed scan-
ner installations in Europe to slow down by the end of the 1990s, with the series’ inflection
points in the early 1990s, as reflected by the τ-estimates in the above table.
Table 2: Percentage of barcode scanning stores: U.S. data, 1974-1984∗
Year Scanning storesa Outlets with Scanning stores Scanning food(number) payrollb (%) stores (%)c
1974 6 726940 <.000011976 97 744780 <.000011980 2483 738100 .000031982 5902 784700 .000081984 9278 831300 .000111988 59.71989 57.7
∗Sources: aEuromonitor (1986), which cites trade publication Chain Store Age.bU.S. Bureau of the Census (1978, and later issues). cFood MarketingInstitute (1989,1990), based on a survey of approx. 10,000 food retailers.
2.3 Functional form and autocorrelation
The logistic is probably the simplest functional form available to study sigmoid-shaped
diffusion patterns, however, it may not be the most appropriate. In particular, erro-
neously assumed symmetry around the inflection point may bias estimates. We there-
fore re-estimated country-specific saturation levels using the Gompertz function, which
is similar to the logistic but asymmetric around the inflection point (Franses, 2002, for
example). For five countries, these estimates and the respective fit statistics do not differ
much from those based on the logistic function. For the other five countries, however,
the estimated inflection point lies beyond the year 2003, fit statistics are poorer than or
comparable to those for the logistic function, and the estimated saturation level is very
large – in three cases even larger than 100% (results available upon request). We conclude
that the logistic function is the more appropriate functional form for our data.
4Das and Mulligan (2004) argue that frequent vintage changes of fixed scanners between 1975 and 1985affect U.S. diffusion estimates. As post-1980 vintages were sold for relatively long time periods, we do notconsider this a significant problem for our dataset.
9
Another issue in estimating growth curves is potential autocorrelation. Following the
procedure proposed by Franses (2002), in unreported test regressions we reject the null
hypothesis of no autocorrelation against the alternative of AR(1) errors only for two coun-
tries. Yet, re-estimating a logistic function with an AR(1) error term for these countries
leads to autocorrelation coefficients which are not significantly different from zero. We
therefore retain the assumption of an AR(0) error term throughout the rest of the paper.
3 Explaining country differences
In this section, we present our set of independent variables and relate them to theoretical
explanations for differences in the diffusion of barcode scanning. In particular, we assess
technology-specific factors (section 3.2), employment protection legislation (section 3.3),
as well as hypermarket competition and product market regulation (section 3.4). Related
literature is discussed along the way. We also present and discuss some precursory ev-
idence. In section 4, we present our econometric specification for the pooled estimation
and the corresponding results.
3.1 Retail sector data
Publicly available information on the retail sector is scarce, even on a country-year ba-
sis. Although we compile data from various sources, various limitations make us restrict
attention to the 10 countries listed in table 1. Table 3 gives a description of the main inde-
pendent variables used in section 4. For more detailed cross-country summary statistics,
see table 7 in the appendix. Source of GDP and population figures is the World Bank
(2003). Data on the number of hypermarkets and the total number of retail outlets are
from various issues of ”Retail trade international”, a publication by market research firm
Euromonitor. The most recent issue is Euromonitor (2002).
As a measure for the severity of labor market restrictions, we use version 1 of the revised
OECD indicator of the strictness of employment protection legislation (OECD, 2004). The
indicator of retail sales volume (VOL) is also from the OECD.5 The retail WAGE index
5For Italy and Spain, this indicator does not cover the whole sample period. For these two countries, wetherefore constructed a comparable indicator based on Euromonitor and GGDC data (see appendix).
10
is constructed using data from the 60-Industry Database of the Groningen Growth and
Development Centre (GGDC). Pre-1990 values for unified Germany for the variables VOL
and WAGE were constructed by applying pre-1990 trends for Western Germany to 1990
values for unified Germany. We also had to replace some missing values with univariate
procedures. Appendix A provides a detailed list of all data manipulations.
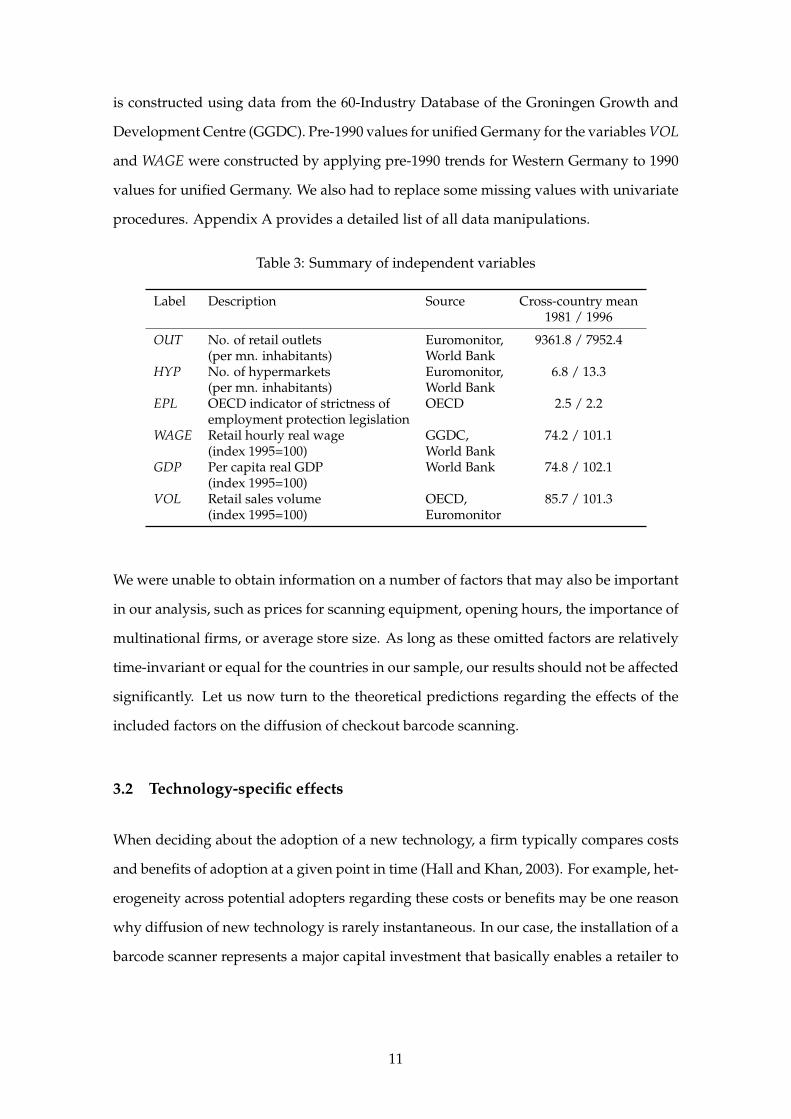
Table 3: Summary of independent variables
Label Description Source Cross-country mean1981 / 1996
OUT No. of retail outlets Euromonitor, 9361.8 / 7952.4(per mn. inhabitants) World Bank
HYP No. of hypermarkets Euromonitor, 6.8 / 13.3(per mn. inhabitants) World Bank
EPL OECD indicator of strictness of OECD 2.5 / 2.2employment protection legislation
WAGE Retail hourly real wage GGDC, 74.2 / 101.1(index 1995=100) World Bank
GDP Per capita real GDP World Bank 74.8 / 102.1(index 1995=100)
VOL Retail sales volume OECD, 85.7 / 101.3(index 1995=100) Euromonitor
We were unable to obtain information on a number of factors that may also be important
in our analysis, such as prices for scanning equipment, opening hours, the importance of
multinational firms, or average store size. As long as these omitted factors are relatively
time-invariant or equal for the countries in our sample, our results should not be affected
significantly. Let us now turn to the theoretical predictions regarding the effects of the
included factors on the diffusion of checkout barcode scanning.
3.2 Technology-specific effects
When deciding about the adoption of a new technology, a firm typically compares costs
and benefits of adoption at a given point in time (Hall and Khan, 2003). For example, het-
erogeneity across potential adopters regarding these costs or benefits may be one reason
why diffusion of new technology is rarely instantaneous. In our case, the installation of a
barcode scanner represents a major capital investment that basically enables a retailer to
11
check out more retail items in less labor time.6 Following the discussion by Levin et al.
(1987, 1992), a number of factors can make barcode scanning more or less valuable in
different countries.7
First, the financial returns to such a capital investment depend on future market con-
ditions. Since return-on-investment is quicker in growing markets, retailers there will
adopt more intensely than retailers in stagnating or contracting markets. In addition, bar-
code scanning may introduce or increase economies of scale in retailing. In both cases,
we expect adoption intensity to increase with market volume (VOL). Second, barcode
scanning is likely to reduce customer waiting time at the checkout. Customers in high-
income countries have a higher opportunity cost of waiting. Using per capita GDP as
income measure, we expect diffusion of barcode scanning to increase with GDP. No-
tice that in this interpretation, barcode scanning is a product-enhancing innovation: it
increases the quality of retailing for the costumer.
Another, rather classical interpretation regards barcode scanning as a process-enhancing
innovation that reduces the costs of retailing. Most prominently, barcode scanning may
be a labor-saving technology that reduces total labor demand. In addition to this classic
capital-labor substitution effect, barcode scanning may allow retailers to substitute un-
skilled for costly skilled labor. Clerks at scanner checkouts need neither know prices nor
be able to type quickly. In both cases of substitution, we therefore expect countries with
rising retail wages – as measured by variable WAGE – to invest more in a labor-saving
technology such as barcode scanning.
3.3 Employment protection legislation
A related question is whether labor market restraints hinder IT diffusion. For example,
strict employment protection legislation (EPL) may prohibit retailers from substituting
barcode scanners for labor as extensively as the technology might allow. Accordingly,
a conventional wisdom has been that less flexible labor markets (with stricter EPL) im-
6Clearly, barcode scanning also facilitates other potentially productivity-enhancing practices, e.g. sophis-ticated logistics systems (‘efficient consumer response’, ‘category management’); but these systems did notdevelop before the mid-1990s and still represent “untapped potential” (Haberman, 2001).
7Levin et al. (1987, 1992) study the adoption of barcode scanning in U.S. retailing. They analyse firm-specific data relating to the early years of the technology (1974-1985).
12

pede IT adoption (IMF, 2001, for example); with corresponding policy recommendations.
Yet, the literature on the relationship between labor market regulation such as EPL and
innovation provides mixed results (Bassanini and Ernst, 2002, for a review).
In support of the conventional view, Gust and Marquez (2004) analyse a panel of cross-
country data and find that IT investments are lower in countries with higher EPL. In
contrast, Koeniger (2005) finds a positive effect of EPL on innovative activity – at least in
the short- and medium-term – for a panel of OECD countries. He also shows theoreti-
cally, that EPL in the form of collective dismissal costs may increase innovative activities.
Accordingly, Agell (1999) argues that labor market regulations, in particular EPL, need
not reduce investment incentives and productive efficiency, as they provide insurance
against adverse economic shocks or structural shifts in labor demand. Haucap and Wey
(2004) show that labor market rigidities can increase firms investment incentives when
they tend to enforce egalitarian wage structures.
3.4 Product market regulation and hypermarket competition
In the industrial organization literature, retail markets have typically been regarded as
more or less perfectly competitive. This perception has led scholars to abstract from the
retail level and concentrate on the manufacturers’ side. Yet, fragmented retail structures
are most often the direct result of entry restrictions. In general, these restrictions tend to
favor small retailing in downtown areas against large scale retail formats as exemplified
by Wal-Mart. Most prominently, planning and construction restrictions have been used
in all European countries to ban large retailing formation; e.g., by not granting construc-
tion permissions or by limiting store size. See Faini et al. (2004) for a recent account of
retail restrictions in the UK, Italy and Germany. Bertrand and Kramarz (2002) provide
empirical evidence for France. These restrictions have been eased first in the U.K. by the
Thatcher government and later in other European countries as well.8
With these developments, hypermarkets have become an integral element of European
retail markets. According to a widely used definition, hypermarkets have a minimum
size of 2,500 square meters, and sell both food and non-food items. Hypermarkets often
8In 1996, hence at the very end of our sample period, U.K. retail regulation turned towards a more re-strictive approach favoring city centres (Haskel and Sadun, 2005).
13

locate in peripheral areas which are easily accessible by car. In most European countries,
the hypermarket retail format emerged in the 1970s and 1980s, parallel to an increase in
motorization.9
We claim that the number of hypermarkets per capita (HYP) is an inverse indicator of en-
try restrictions. An increasing number of hypermarkets is a result from less restrictive en-
try regulations, and hence a proxy for increasing competitive intensity due to regulatory
change. Moreover, hypermarkets may reflect competitive intensity on other grounds.
They can be regarded as low-cost competitors who exploit the cost benefits of out-of-
town locations, sophisticated logistics, and economies of scale (Basker, 2004). One may
also view retail competition as competition of retail channels or formats (Michael, 1994;
Smith and Hay, 2005). In that sense, the emergence and growth of a new format, like the
hypermarket, intensifies retail competition as such.
Table 4 presents some evidence in support of our claim. Since retail competition essen-
tially works through entry and exit of firms (Foster et al., 2002), the appearance of com-
petitive hypermarkets should have led to increased exit rates. We therefore regress the
number of non-hypermarket outlets on the number of hypermarkets: (OUT - HYP) on
HYP (all in per capita terms). Two countries in our sample – Germany and Denmark –
apply a slightly broader hypermarket definition which includes superstores (supermar-
kets with a floor space between 1,500 and 2,500 square meters). Accordingly, we allow
for a different effect for these two countries, the difference measured by the coefficient
for D*HYP.
As expected, an increase in the number of hypermarkets is estimated to lead to a de-
crease in the number of other retail outlets. The first column of table 4 provides results
under the assumption that there are country fixed effects but no time trends in the num-
ber of outlets time series. The coefficient for the standard hypermarket definition (HYP)
implies that an additional hypermarket outlet per million inhabitants is estimated to in-
duce almost 197 other retail outlets per million inhabitants to exit the market. Yet, the
estimated coefficient for the broader definition employed by Germany and Denmark is
significantly positive (-196.9+298.3). We interpret this result as an indication that Ger-
9The French retail group Carrefour claims to have invented the concept. It opened its first hypermarketin 1963 near Paris, “with a floor space of 2,500 square meters, 12 checkouts and 400 parking spaces” (seewww.carrefour.com/english/groupecarrefour/annees60.jsp).
14

Table 4: Regression results on hypermarket competition∗
Dependent variable:(OUT - HYP) (OUT - HYP) (OUT - HYP) (OUT - SUPHYP)
Independent Coefficient Coefficient Coefficient Coefficientvariable
HYP -196.921a -196.921a -31.204(25.898) (26.881) (48.340)
D*HYP 298.300a 103.574 -68.124(60.212) (122.356) (121.573)
SUPHYP -.972(1.052)
Country excluded: Germany GermanyCountry fixed effects: yes yes yes yesCountry time trend: no no yes yesTime span (max.) 1980-2001 1980-2001 1980-2001 1980-2001
Observations 215 193 215 182R2 .959 .958 .991 .991∗OLS estimates (country fixed effects and time trends omitted). Standard errors inparentheses (a indicates significance with 95% confidence). D is a dummy variableequal to one for Germany and Denmark, who use a different hypermarket definitionthan the other countries. SUPHYP is the number of super- and hypermarkets permn. inhabitants (Source: Euromonitor; 12 obs. missing, see data appendix).
many’s series for outlets and hypermarkets are somewhat special. They seem heavily
affected by two rather independent post-1990 developments following re-unification: (i)
an overall catch-up in the number of outlets in former East Germany and (ii) the construc-
tion of large retail sites – namely superstores and hypermarkets – outside of former East
German cities. Indeed, when we exclude Germany from the sample (second column), the
estimated difference between the Danish-German and the standard hypermarket defin-
ition (D*HYP) is no longer significantly different from zero, suggesting that the overall
hypermarket effect is negative for Denmark as well. The estimate for all other countries
(HYP) by definition remains unchanged.
The inclusion of country-specific time trends somewhat improves fit, as measured by R2
(third column). The average hypermarket effect is then smaller, but negative for both
hypermarket definitions. An additional hypermarket per million inhabitants (HYP) is
estimated to induce exit of 31 other retailers (99 for Denmark), although the effect is not
significant. Also, the Denmark-specific insignificance in column two suggests that hy-
permarkets indeed imply more competitive threat than smaller modern retail formats
like superstores or supermarkets, which are partially included in Denmark’s hypermar-
15

ket figures. In order to assess this hypothesis in more detail, we looked at results with the
joint number of hyper- and supermarkets (SUPHYP) as an alternative regressor (fourth
column).10 The estimated average effect of SUPHYP on the number of other outlets is
close to zero. We conclude that the number of hypermarkets is a valid proxy for the
intensity of retail competition and a better indicator than the number of superstores or
supermarkets.11
Having established that emerging hypermarkets represent more intense competition,
what should we expect regarding their effect on the diffusion of barcode scanning? We
are not aware of theoretical or empirical work that relates particularly to retail deregula-
tion or hypermarket retailing and IT diffusion. But the relationship between competition
and technology diffusion has been studied on a more general level (for a review see, in
particular, Stoneman, 2002). Gotz (1999) studies the diffusion of new technology in a mo-
nopolistically competitive industry. He finds that increased competition often promotes
diffusion. In contrast, Boucekkine et al. (2004) study a differentiated-products Cournot
duopoly and find an inversely U-shaped relationship between competition and diffu-
sion. In their model, an increase in competition (a decrease in product differentiation)
stimulates diffusion only when products are sufficiently substitutable.
The closely related literature on the relationship between market structure and innova-
tion incentives has also delivered contradictory results. While the Schumpeterian (1942)
idea has been that there is a positive relationship between innovation incentives and
concentration or large firms, others have emphasised the negative effects of monopoly
power on innovation. Borrowing from the parallel literature on market structure and
product quality, one may also claim that the influence of market structure on innovation
is neutral, or in general ambiguous (Swan, 1970; Spence, 1975).
Empirical results mirror this theoretical ambiguity (Geroski, 2000; Karshenas and Stone-
man, 1995, for reviews). For example, Levin et al. (1987, 1992) find that retailers adopt
earlier and that intra-firm diffusion of barcode scanning is faster in markets that are less
concentrated, but these effects partially bare significance. More importantly, as we ar-
10In this case, we do not have to distinguish between definitions, since it does not matter how stores at themargin between super- and hypermarkets are classified.
11Due to a number of problems associated with the supermarket data (see appendix), we regard thesesupermarket-specific results as complementary, but refrain from using respective data in more detail.
16
gued above, concentration measures are not necessarily good proxies for competitive
intensity in retail markets.
In our particular case, hypermarket competition may have two – potentially independent
– effects on IT adoption by other retailers. On the one hand, we find that hypermarket
entry induces exit of other retailers. If the exiting retailers predominantly belong to the
group of (potential) IT adopters, this selection effect reduces the share of adopters in the
group of remaining retailers. On the other hand, hypermarket competition can have an
encouragement effect on the group of remaining retailers, for example when hypermarket
entry leads former non-adopters to become (potential) adopters. With aggregate data
on IT diffusion, we can only identify the joint impact of these two effects, which can be
positive or negative.
Consider a simple numerical example as illustration. Imagine a country with 100 retail-
ers, 50 of which are potential adopters of barcode scanning. There are no hypermarkets
yet. While barcode scanning diffuses, one of the retailers decides to transform into a hy-
permarket, which drives 10 other retailers out of business. Depending on whether these
10 quitting retailers were potential adopters or not, the selection effect of the hypermarket
on long-run diffusion of barcode scanning can be negative or positive. In case all quit-
ters were non-adopters, the long-run diffusion level of barcode scanning increases from
.5 to .56 (50 out of 90). In case they had been (potential) adopters, it reduces from .5 to
.44 (40 out of 90). Moreover, an encouragement effect of increased competition could be
that some of the previous non-adopters become potential adopters of barcode scanning,
which raises its long-run diffusion level.
3.5 Bivariate correlations
For a first idea on how the discussed factors might relate to cross-country differences in
barcode scanning, a useful approach is the one pioneered by Zvi Griliches (1957). He
relates group-specific parameter estimates to independent statistics. In this vein, we as-
sess how the countries’ separately estimated saturation levels correlate with trends of the
proposed variables in the respective time period. Table 5 lists the correlation coefficients.
17

Table 5: Bivariate correlations between γi and independent variables∗
Correlation betweentrend coefficient for
log(HYP) log(EPL) log(WAGE) log(GDP) log(VOL)
and γi -.526 .512 .501 .015 .581∗Based on nine observations (one per country, excluding Ireland):γi and trend coefficient from country-wise regression oflog(independent variable) on time. Trend coefficients are significantwith 95% confidence for all countries and variables except for twocountries with variable VOL.
All bivariate correlation coefficients are in line with the above theoretical discussions. Es-
timated saturation levels are higher in countries with larger growth of GDP, retail sales
volume, retail wages and employment protection, and lower in countries with larger
hypermarket growth.12 A negative hypermarket effect is surprisingly clear in the data:
between 1981 and 1996, 5 out of 10 countries have an average yearly growth in the per-
capita number of hypermarkets below 3% – as proxied by a trend coefficient in a regres-
sion of log(HYP). Average estimated saturation level is 12.7% for these countries (Austria,
Belgium, Denmark, Germany, Netherlands), but only 6.5% for the other five countries
that had stronger hypermarket growth. Yet, these bivariate correlations neither account
for country-specific fixed effects in γi, which may arise solely from differences in count-
ing retail outlets, nor for year-to-year and multivariate correlations.
4 Pooled estimation
In order to assess the effects of the proposed variables and at the same time account
for time-invariant country-specific effects on the saturation level, we pool countries to
estimate a joint diffusion function, in which we parameterise γ as follows:
γ = γi + Xitγx, (2)
12When we include Ireland in calculating these correlation coefficients, only the coefficient for GDPchanges qualitatively, resulting from Ireland’s combination of strong GDP growth with a low γ-estimate.
18
where Xit contains the variables HYP, EPL, VOL, GDP, WAGE and D*HYP. As before D
is a dummy variable equal to one for Germany and Denmark to account for the different
hypermarket definition, and the number of outlets (Nt) is given in hundreds. Subscript
i = 1, ..., 10 indicates countries and t = 1981, ..., 1996 indicates periods.
The coefficients γi account for time-invariant country-specific effects, as well as for time-
invariant cross-country differences in measurement of the independent variables. Hence,
γx estimates the average marginal effect of variable x on the country-specific saturation
level. The speed and timing coefficients of equation 1 are allowed to vary across coun-
tries, hence we specify β = βi and τ = τi. In other words, we retain the full flexibility
of the country-wise regressions and use the specification of equation 2 to ask whether
the independent variables contain additional information regarding the diffusion of bar-
code scanning. After inserting equation 2 and an additive i.i.d. error term, we estimate
equation 1 by NLS.13
Unreported regressions based on the full sample exhibited convergence problems and led
to large and unstable estimates for Ireland’s country-specific estimates (γi,βi,τi). We actu-
ally find this result reaffirming in two respects. First, this seems to confirm the suspicion
that the data for Ireland do not cover a sufficiently large portion of its diffusion of bar-
code scanning. Second, it suggests that the independent variables do contain additional
information, since Ireland-specific estimates without these variables spuriously appeared
stable. In what follows, we therefore present estimation results excluding Ireland. The
independent variables’ coefficients are virtually unaffected, compared to estimates in-
cluding Ireland, but convergence is smoother and all country-specific estimates are now
stable.
4.1 Results
The first column of Table 6 presents the results for our baseline specification (I). In addi-
tion, we present results for three alternative specifications: in specifications II, III and IV
we exclude Germany; in specification III, we also exclude the variables EPL and D*HYP;
13We use the estimates from the country-wise regressions as initial values for country-specific effects. Forthe independent variables’ coefficients, we set initial values equal to 0.
19

in specification IV, we exclude D*HYP and add an interaction term for the variables EPL
and HYP.
Table 6: NLS estimation results∗
Dependent variable:Number of barcode scanning stores
Specification (I) (II) (III) (IV)
HYP -1.852a -1.744a -1.756a -2.153a
(.426) (.408) (.425) (.596)D*HYP 6.668a 1.837
(2.505) (2.154)EPL -1.333 -1.154 -1.807
(2.287) (2.108) (2.311)HYP*EPL .203
(.179)WAGE .119a .123a .116a .126a
(.032) (.031) (.028) (.033)GDP .394a .385a .408a .368a
(.069) (.069) (.061) (.070)VOL .087b .072 .062 .101a
(.048) (.047) (.047) (.048)
Country excluded: Ireland Ireland Ireland IrelandGermany Germany Germany
Time span (max.) 1981-1996 1981-1996 1981-1996 1981-1996Observations 130 115 115 115Adj. R2 .994 .994 .994 .994Root MSE 494.6 504.2 499.4 499.8∗Estimates for γi, βi and τi omitted. Asymptotic standard errorsin parentheses. Significance levels: a 95%, b 90%
The effects for variables WAGE, GDP and VOL vary little across specifications and are for
the most part significantly estimated. A 10-point increase in the retail wage index is es-
timated to raise the saturation percentage of barcode scanning stores by about 1.2 points
on average. A 10-point increase in real GDP per capita and retail sales volume raises
the saturation percentage by about 4 and 1 points, respectively. All three results confirm
initial expectations. First, investment in labor-saving retail IT can be interpreted as a reac-
tion to changes in labor costs. Second, income, scale and returns-to-investment effects are
important. Although the income effect measured by GDP seems more important than the
scale effect measured by VOL, both effects are hard to distinguish empirically since the
two variables are highly correlated by definition. Nevertheless, these estimated effects
already can explain why the U.S. is ahead of most European countries when it comes to
20

IT diffusion in the retail sector and the resulting productivity gains throughout the 1990s:
strong overall economic growth driven by a surge in consumer spending.14
Consistent with the bivariate correlation found before, an increase in the number of hy-
permarkets by one per million inhabitants is estimated to decrease the saturation per-
centage of barcode scanning stores by about 2 points. In aggregate terms, hypermarket
competition therefore seems to reduce long-run IT usage in the retail sector. The question
whether this hypermarket effect works by discouraging existing retailers from adoption
(encouragement effect) or rather by driving potential adopters out of the market (selection
effect) is one we cannot address with the data at hand. We suspect that both effects are
at play. The impact of the selection effect may be more important, however, since hy-
permarkets mainly compete with supermarkets – the main group of potential adopters –
and less with other, smaller retailers.
Yet, the negative result seems to hold only for the standard hypermarket definition. In
our baseline specification I, the estimate for the Danish/German definition is positive
(-1.9+6.7). As with our precursory results on hypermarket competition, this effect pre-
sumably arises from German re-unification efforts, where a large number of newly built
retail outlets in East Germany have been equipped with barcode scanners from the start.
We therefore re-estimated the model excluding Germany and find that Germany indeed
seems to be a special case. The estimated difference between the broad hypermarket
definition and the standard one, now a Denmark-specific effect, is much lower and not
significantly different from zero. Accordingly, an estimation which ignores different hy-
permarket definitions by excluding the interaction term D*HYP (specification III) leads
to an essentially unchanged hypermarket effect, as long as Germany remains excluded.
In specification III we also exclude the EPL indicator, whose effect has the commonly ex-
pected negative sign but is insignificant in all estimations. Other estimates remain largely
the same.14Comparable OECD data for the retail volume indicator VOL indicate that, between 1990 and 2000, U.S.
retail volume increased by about 67%, whereas it increased by about 30% in the U.K. and by about 7% inFrance. In Germany, retail volume decreased by about 1% between 1990 and 2000.
21

4.2 Robustness
All findings remain qualitatively unchanged in a number of robustness checks. First,
complementarities between labor and product market conditions may affect our results.
We therefore looked at results including an interaction term HYP*EPL (specification IV
in table 6) or EPL*WAGE (results omitted). In both cases, the interaction term coefficients
are rather close to and not significantly different from zero, while some other estimates
slightly change in magnitude and precision but are otherwise unaffected.
A potential source of endogeneity bias is the presumption that every new hypermarket
built from the mid-1980s increases the number of scanning outlets by one. Although not
necessarily, since hypermarkets operated long before the introduction of barcode scan-
ning and hence the technology may not be as crucial for them as it might appear from
today’s perspective. In any case, the negative estimates in table 6 already suggest that
this endogeneity bias cannot be very influential. By deducting the number of hyper-
markets from both the number of barcode scanning stores and the number of outlets, it
is nevertheless possible to focus on the effect of hypermarket competition on the adop-
tion of barcode scanning by all other retailers. The corresponding unreported results for
specifications I to IV are virtually identical to those in table 6.
One may also suspect that there are effects driving reverse causality, namely that barcode
scanning leads to an increase in average store size and eventually to more “superstores”
or hypermarkets (Holmes, 2001). Yet, the facts that (i) hypermarkets existed long before
barcode scanning was introduced and (ii) Holmes (2001) model predicts a positive corre-
lation while we find a negative one lead us to believe that reverse causality is not a severe
issue in our case.
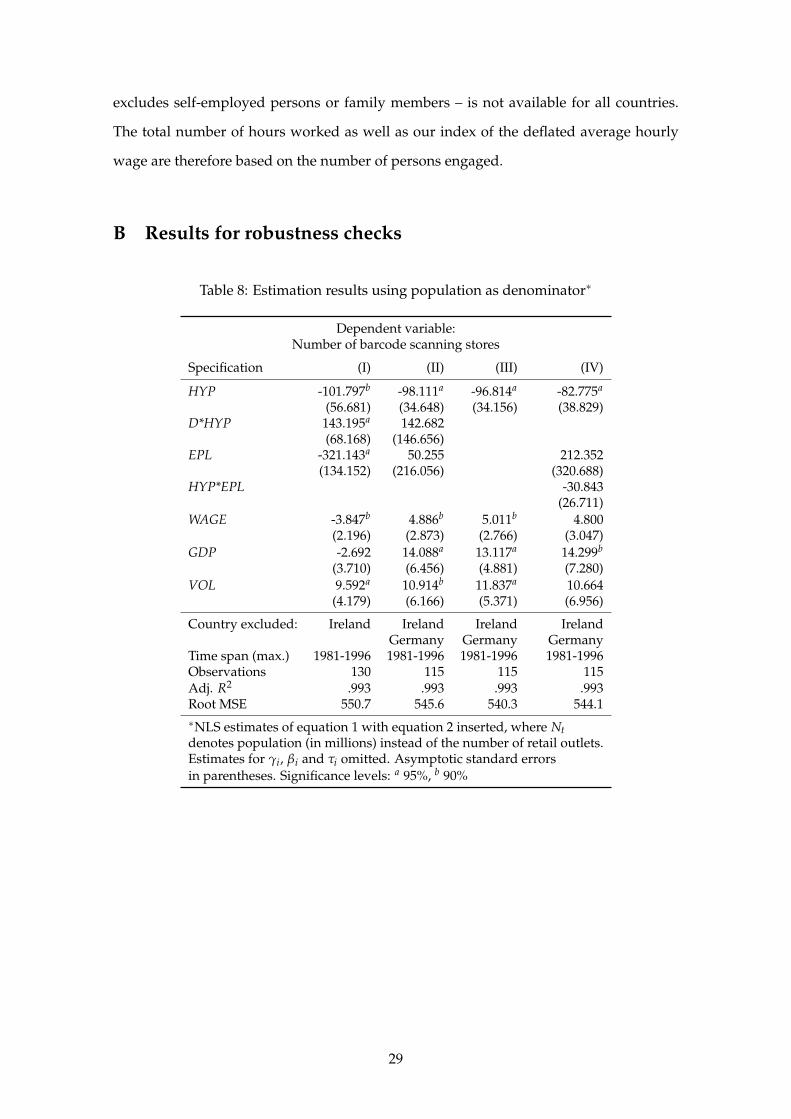
Another potential source of error are the implicit assumptions in our method to construct
time series for the total number of retail outlets (see data appendix). We therefore esti-
mated specifications I to IV with a country’s population (in millions) replacing the num-
ber of outlets in equation 1. Table 8 in the appendix presents the corresponding results.
For specifications II to IV, all variables yield estimates with the same qualitative effects
on the long-run number of barcode scanning stores per capita; except EPL, whose coef-
ficients change sign but are again insignificant. Only for specification I, which includes
22

the special case of Germany, some results differ. We infer that our results are not crucially
affected by the data manipulations that were necessary to obtain a workable time series
for the number of retail outlets.
Finally, our conclusions regarding the effect of EPL may be premature. Given substan-
tial manipulations necessary to obtain a complete time series (see appendix), and other
measurement problems associated with the OECD EPL index (Blanchard and Wolfers,
2000), there are reasons to doubt the validity of the indicator used. In order to cross-
check results, we replaced the EPL indicator with variables constructed using data from
the Social Reforms Database of the Fondazione Rodolfo DeBenedetti. Amongst other in-
formation, this database provides a list of EPL reforms for all countries in our sample,
and classifies them as flexibility-increasing or -decreasing.15 From this information, we
constructed two time series on the cumulative number of EPL reforms for each country.
When replaced for our initial EPL indicator in specification II, these variables also yield
insignificant results (available upon request).
5 Conclusion
Barcode scanning, a critical information technology in the retail sector, has diffused to
different saturation levels across European countries. Econometric results based on data
from various sources suggest that, as expected, this retail technology diffuses more in-
tensely in countries with large and growing retail sectors and economies. It is therefore
not surprising that the United States is ahead of most European countries when it comes
to IT diffusion in the retail sector and the resulting productivity gains in the 1990s. With
respect to an upcoming ‘retail revolution’ that relies on RFID technology, our results lead
us to expect stronger RFID diffusion in countries that allow retailers to exploit scale ef-
fects. In line with classic theory, we also find that raising labor costs induce retailers to
substitute barcode scanners for labor. In contrast, we do not find employment protection
legislation to significantly impact retail IT diffusion.
15There is also a classification into marginal and structural reforms, but as most listed reforms are marginalwe did not use this distinction. See http://www.frdb.org/documentazione/scheda.php?id=55&doc_pk=
9027 for more detail.
23
Our results concerning the impact of competitive intensity seem to differ with conven-
tional wisdom. We find that the emergence of hypermarkets represents increased retail
competition and that such competition reduces long-run retail IT diffusion. This effect,
which is robust in a variety of specifications, has two potential explanations. First, hyper-
market competition may very well cause exit of potential IT adopters, namely smaller-
sized supermarkets. Second, hypermarkets – which are most likely to adopt barcode
scanning early – discourage subsequent adoptions of rival retail formats. Overall, these
results suggest that liberalisation of retail market entry and the associated emergence of
hypermarkets deepens retail segmentation such that hypermarkets on the one hand and
small down town retailing (including shopping mall retailing) prevail. In contrast, inter-
mediate retail formats – in particular medium-sized supermarkets – are likely to suffer
from market liberalization.
One should notice, however, that the productivity implications of these findings are not
evident: depending on how much retail volume goes through barcode scanning retailers,
IT productivity may increase even though aggregate IT intensity decreases. Also, our
data are not directly comparable to measures of retail IT investments, since they count
the number of barcode scanning stores, not the number of scanner installations. In our
data, a smaller supermarket with, say, one scanner checkout has the same weight as a
larger one with multiple scanner checkouts.
Further research may include measures of foreign direct investments in order to assess
the role of large multinational retail firms in IT diffusion. Given data on the emergence
of one-stop-shopping (e.g., motorization and demographics), it may also be possible to
address the potential endogeneity of hypermarket development more rigorously. Finally,
the present results are based on a rather small number of observations. It should be
interesting to include more countries and explanatory variables. Reviewing our efforts
to put together the present dataset, we however fear such a task is more demanding than
it seems at first sight.
24

A Data appendix
Figure 2: Number of barcode scanning stores (in %, by country)
Scanning outlets. Data source are the statistical appendices of the European Article
Numbering Association’s (EAN) yearly reports for 1983 through 1997 (available at www.
ean-int.org). They give the number of barcode scanning outlets per country for the
years 1981 through 1996, although this period is not entirely covered for all countries.
Data for Belgium include Luxembourg. In the cases of Austria, Denmark, Ireland and
Spain, it was clear from the text in the country sections of the reports that the number
of scanning outlets was zero before 1984, although it is reported as missing in the re-
spective appendix table. Missing observations in the series for Italy (1982) and Ireland
(1989) were replaced by linear interpolation using adjacent observations. Data for the
last years of observation, 1995 and/or 1996, seemed inconsistent with data for preceding
years in the cases of Austria, Italy and the Netherlands. They indicated either a decrease
of the the number of scanning outlets (Netherlands, 1995; Italy, 1996) or an overly strong
increase (Austria, 1995 and 1996).16 In a telephone interview, we were told by German
EAN representatives that collection of these data became increasingly difficult during the
mid-1990s, as barcode scanners became standard technology, different types of scanner
16According to the original figures, the number of scanning outlets in Austria rose from 4,670 to 13,827(hence by 300%) between 1994 and 1995. In relation to the total number of retail outlets in Austria, whichEuromonitor International estimates at 38,546 for 1995, this would imply an increase in penetration from 12 to36% in one year. We believe that the post-1994 figures refer to the number of scanner checkouts rather thanthe number of scanning outlets.
25
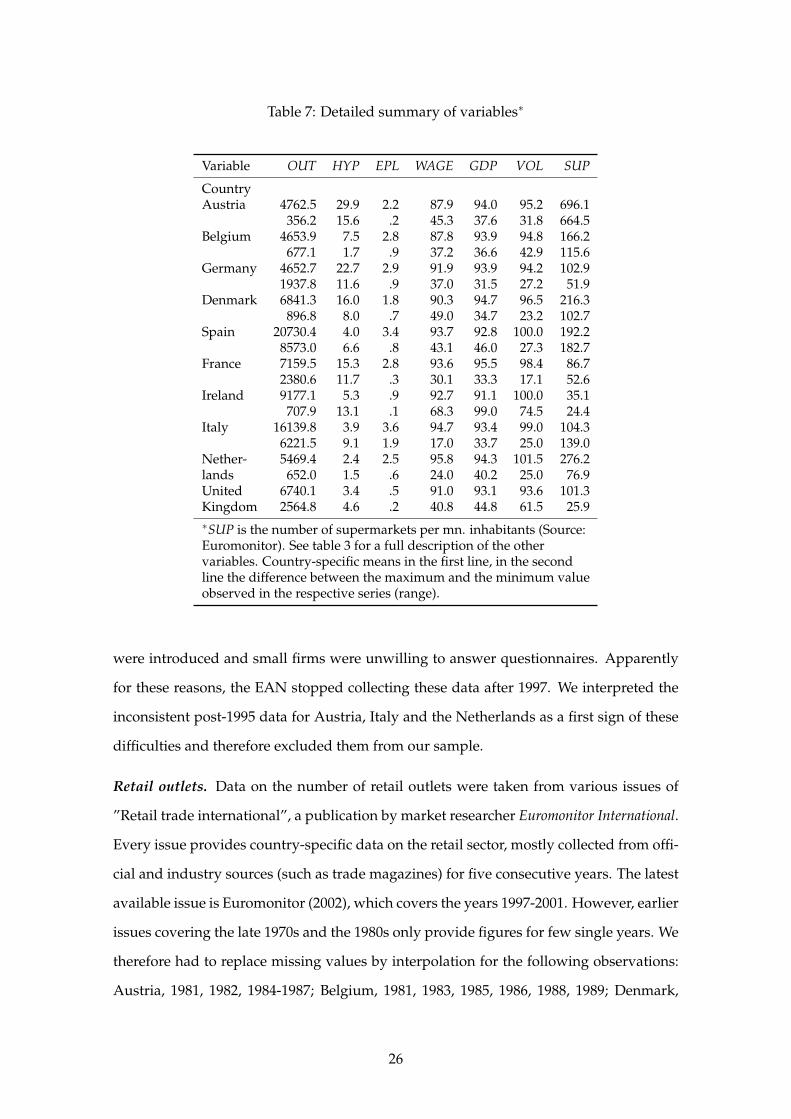
Table 7: Detailed summary of variables∗
Variable OUT HYP EPL WAGE GDP VOL SUP
CountryAustria 4762.5 29.9 2.2 87.9 94.0 95.2 696.1
356.2 15.6 .2 45.3 37.6 31.8 664.5Belgium 4653.9 7.5 2.8 87.8 93.9 94.8 166.2
677.1 1.7 .9 37.2 36.6 42.9 115.6Germany 4652.7 22.7 2.9 91.9 93.9 94.2 102.9
1937.8 11.6 .9 37.0 31.5 27.2 51.9Denmark 6841.3 16.0 1.8 90.3 94.7 96.5 216.3
896.8 8.0 .7 49.0 34.7 23.2 102.7Spain 20730.4 4.0 3.4 93.7 92.8 100.0 192.2
8573.0 6.6 .8 43.1 46.0 27.3 182.7France 7159.5 15.3 2.8 93.6 95.5 98.4 86.7
2380.6 11.7 .3 30.1 33.3 17.1 52.6Ireland 9177.1 5.3 .9 92.7 91.1 100.0 35.1
707.9 13.1 .1 68.3 99.0 74.5 24.4Italy 16139.8 3.9 3.6 94.7 93.4 99.0 104.3
6221.5 9.1 1.9 17.0 33.7 25.0 139.0Nether- 5469.4 2.4 2.5 95.8 94.3 101.5 276.2lands 652.0 1.5 .6 24.0 40.2 25.0 76.9United 6740.1 3.4 .5 91.0 93.1 93.6 101.3Kingdom 2564.8 4.6 .2 40.8 44.8 61.5 25.9∗SUP is the number of supermarkets per mn. inhabitants (Source:Euromonitor). See table 3 for a full description of the othervariables. Country-specific means in the first line, in the secondline the difference between the maximum and the minimum valueobserved in the respective series (range).
were introduced and small firms were unwilling to answer questionnaires. Apparently
for these reasons, the EAN stopped collecting these data after 1997. We interpreted the
inconsistent post-1995 data for Austria, Italy and the Netherlands as a first sign of these
difficulties and therefore excluded them from our sample.
Retail outlets. Data on the number of retail outlets were taken from various issues of
”Retail trade international”, a publication by market researcher Euromonitor International.
Every issue provides country-specific data on the retail sector, mostly collected from offi-
cial and industry sources (such as trade magazines) for five consecutive years. The latest
available issue is Euromonitor (2002), which covers the years 1997-2001. However, earlier
issues covering the late 1970s and the 1980s only provide figures for few single years. We
therefore had to replace missing values by interpolation for the following observations:
Austria, 1981, 1982, 1984-1987; Belgium, 1981, 1983, 1985, 1986, 1988, 1989; Denmark,
26

1982-1984, 1986; France, 1982, 1983, 1985-1987; Germany, 1981-1983, 1987, 1989, 1991; Ire-
land, 1981-1987, 1989-1991; Italy, 1982-194; Netherlands, 1981, 1983, 1985, 1986; Spain,
1981-1984, 1988; United Kingdom, 1981, 1983, 1985, 1989, 1991. For every country cov-
ered, not all time series published in the various Euromonitor issues were consistent in
overlapping years of coverage. Most probably, this is due to varying (non-)inclusion of
gas stations, automobile dealers and mobile retail outlets. We therefore used the most
recent available series (Euromonitor, 2002) for absolute values and projected this series
back to 1981 using the trends from preceding series.17 Whenever two issues gave in-
consistent figures for the same year, we used the figure from the more recent publica-
tion. This approach entails the implicit assumption that the outlet share of whatever
type of retail format included (not included) in the Euromonitor (2002) figures but not
included (included) in the earlier figures has remained constant over time. Then, our
constructed time series reflect changes in the number of retail outlets accurately, and dif-
ferences across countries regarding the inclusion of a certain retail format in the time
series are accounted for in estimation by the country-specific coefficients.
Hypermarkets. Data on the number of hypermarkets were also taken from the Euromon-
itor publications cited above. The following missing values for single years have been
replaced by interpolation: Belgium, 1982, 1983; Denmark, 1984; Ireland, 1991; Italy, 1985;
United Kingdom, 1983. Missing values for Italy, 1987 and 1988, and the United King-
dom, 1981, were replaced by data from the European Commission (1997, p. 21-17, ta-
ble 9), which are consistent with the Euromonitor data for subsequent years. In the cases
of Austria, Belgium, Denmark, the Netherlands and the United Kingdom, the time series
published in the various Euromonitor issues were not always consistent in overlapping
years of coverage. This may be due to changes in original industry sources. In these
cases, the series from Euromonitor (2002) was projected back, in a similar way than de-
scribed for the outlets series, using trends from preceding series. In the cases of Denmark
and Germany, the figures base on a different hypermarket definition, which considers as
hypermarkets food retailers who also sell non-food items (as in the standard definition)
and have more than 1,500 square meters of retail space (as opposed to 2,500 square meters
in the standard definition).
17In the cases of Austria and France, the series covering the late 1980s did not overlap with the subsequentseries. We therefore extrapolated the earlier series, using information for 1985-1988, to obtain a value for1989 which we could compare with the 1989 value of the following series.
27

Supermarkets. The Euromonitor publications also include data on the number of super-
markets, but with many missing values. Moreover, supermarket definitions are not as
comparable across countries as hypermarket definitions. For example, Austria defines
as supermarkets stores with a retail space between 400 and 1000 square meters, whereas
France and Spain defines as supermarkets stores with a retail space between 400 and
2,500 square meters but Spain only counts such stores as supermarkets that additionally
have at least 5 checkouts (Euromonitor, 1989). We therefore used respective data only
in an auxiliary regression (table 4). Before, we replaced the following missing values for
single years by interpolation: Austria, 1984; Belgium, 1981-1982, 1987-1988, 1990-1991;
Denmark, 1984, 1990-1991; Ireland, 1980-1987, 1989, 1991-1992; Netherlands, 1988; Spain,
1989-1990. Data for the Netherlands, 1980-1986, and the United Kingdom, 1980-1984, re-
main missing. In all cases except Denmark and Germany, the time series published in the
various Euromonitor issues were not always consistent in overlapping years of coverage.
In these cases, the series from Euromonitor (2002) was projected back, in a similar way
than described for the outlets series, using trends from preceding series.
Employment protection legislation. The revised OECD indicator for employment pro-
tection legislation (EPL) is published by the OECD (2004) for three moments in time: the
‘late 1980s’ (1989), the ‘late 1990s’ (1998), and 2003. We followed Blanchard and Wolfers
(2000) in order to construct a time series from these data: for the years 1990-1997, we re-
placed missing values by linear interpolation and we assumed that EPL has not changed
significantly throughout the 1980s. The fact that the Social Reforms Database of the Fon-
dazione Rodolfo DeBenedetti lists only three marginal EPL reforms prior to 1989 – two
for France, 1986, and one for Italy, 1987 – reconfirms this assertion.
Sales volume. The OECD indicator of the volume of retail sales is not available for Spain,
1981-1990 and for Italy, 1981-1985. We constructed a comparable indicator using Eu-
romonitor data on retail sales and data from the GGDC 60-industry database on retail
value added deflators. For Italy and Spain, we used this indicator instead of the OECD
indicator for the whole sample period.
Wages and hours worked. The GGDC database contains information on the number of
persons employed, annual hours worked and labor compensation per employee, and a
value deflator for the retail sector. Unfortunately, the number of retail employees – which
28
excludes self-employed persons or family members – is not available for all countries.
The total number of hours worked as well as our index of the deflated average hourly
wage are therefore based on the number of persons engaged.
B Results for robustness checks
Table 8: Estimation results using population as denominator∗
Dependent variable:Number of barcode scanning stores
Specification (I) (II) (III) (IV)
HYP -101.797b -98.111a -96.814a -82.775a
(56.681) (34.648) (34.156) (38.829)D*HYP 143.195a 142.682
(68.168) (146.656)EPL -321.143a 50.255 212.352
(134.152) (216.056) (320.688)HYP*EPL -30.843
(26.711)WAGE -3.847b 4.886b 5.011b 4.800
(2.196) (2.873) (2.766) (3.047)GDP -2.692 14.088a 13.117a 14.299b
(3.710) (6.456) (4.881) (7.280)VOL 9.592a 10.914b 11.837a 10.664
(4.179) (6.166) (5.371) (6.956)
Country excluded: Ireland Ireland Ireland IrelandGermany Germany Germany
Time span (max.) 1981-1996 1981-1996 1981-1996 1981-1996Observations 130 115 115 115Adj. R2 .993 .993 .993 .993Root MSE 550.7 545.6 540.3 544.1∗NLS estimates of equation 1 with equation 2 inserted, where Ntdenotes population (in millions) instead of the number of retail outlets.Estimates for γi, βi and τi omitted. Asymptotic standard errorsin parentheses. Significance levels: a 95%, b 90%
29

References
Agell, Jonas (1999), On the benefits from rigid labour markets: norms, market failures,
and social insurance, The Economic Journal, 109 (127), pp. F143–64.
Ark, Bart van, Robert H. McGuckin and Matthew Spiegelman (2005), The retail revolu-
tion – can Europe match U.S. productivity performance?, Report 1358, The Conference
Board.
Astebro, Thomas (2004), Sunk costs and the depth and probability of technology adop-
tion, Journal of Industrial Economics, 52 (3), pp. 381–399.
Basker, Emek (2004), Selling a cheaper mousetrap: Entry and competition in the retail
sector, Working Papers 0401, Department of Economics, University of Missouri.
Bassanini, Andrea and Ekkehard Ernst (2002), Labour market institutions, product mar-
ket regulation, and innovation: Cross-country evidence, Working Paper 316, OECD
Economics Department.
Bertrand, Marianne and Francis Kramarz (2002), Does entry regulation hinder job cre-
ation? Evidence from the French retail industry, The Quarterly Journal of Economics,
117 (4), pp. 1369–1413.
Blanchard, Olivier and Justin Wolfers (2000), The role of shocks and institutions in the rise
of European unemployment: The aggregate evidence, The Economic Journal, 110 (462),
pp. C1–33.
Boucekkine, Raouf, Omar Licandro and Antonio Minniti (2004), Adoption and diffusion
of cost reducing innovations : Cournot competition in duopoly, mimeo.
Brown, Stephen A. (1997), Revolution at the checkout counter (Harvard Univ. Press, Cam-
bridge, Mass.).
Competition Commission (2000), Supermarkets: a report on the supply of groceries from
multiple stores in the United Kingdom, Report Cm-4842.
Das, Nilotpal and James G. Mulligan (2004), Vintage effects and the diffusion of time-
saving technological innovations : The adoption of optical scanners by U.S. supermar-
kets, Working Paper 04-06, University of Delaware, Department of Economics.
30

Debecker, Alain and Theodore Modis (1994), Determination of the uncertainties in S-
curve logistic fits, Technological Forecasting & Social Change, 46, pp. 153–173.
Dobson, Paul and Michael Waterson (1999), Retailer power: how regulators should re-
spond to greater concentration in retailing, Economic Policy, 14 (28), pp. 133–164.
Euromonitor (1989), Retail Trade International: 1989 Edition (Euromonitor International
Plc., London).
— (2002), Retail Trade International: 2002 Edition (Euromonitor International Plc., London).
European Commission (1997), Panorama of EU Industry (European Commission).
— (1999), Buying power and its impact on competition in the food retail distribution
sector of the European Union, Report produced for the European Commission, DG IV,
Brussels.
Faini, Ricardo, Jonathan Haskel, Giorgio B. Navaretti, Carlo Scarpa and Christian Wey
(2004), Contrasting Europes decline: do product market reforms help?, mimeo.
Food Marketing Institute (1989), The food marketing industry speaks, 1989. Detailed tabula-
tions (Food Marketing Institute).
— (1990), The food marketing industry speaks, 1990. Detailed tabulations (Food Marketing
Institute).
Foster, Lucia, John Haltiwanger and C. J. Krizan (2002), The link between aggregate and
micro productivity growth: Evidence from retail trade, NBER Working Paper Series,
No. 9120.
Franses, Philip Hans (2002), Testing for residual autocorrelation in growth curve models,
Technological Forecasting & Social Change, 69, pp. 195–204.
FTC (2001), Report on the Federal Trade Commission workshop on slotting allowances
and other marketing practices in the grocery industry, Report by the Federal Trade
Commission staff, Washington D.C.
Geroski, Paul A. (2000), Models of technology diffusion, Research Policy, 29, pp. 603–625.
31
Gotz, Georg (1999), Monopolistic competition and the diffusion of new technology,
RAND Journal of Economics, 30 (4), pp. 679–693.
Griliches, Zvi (1957), Hybrid corn: an exploration in the economics of technological
change, Econometrica, 25 (4), pp. 501–522.
— (1980), Hybrid corn revisited: a reply, Econometrica, 48 (6), pp. 1463–1465.
Gruber, Harald and Frank Verboven (2001), The diffusion of mobile telecommunications
in the European Union, European Economic Review, 45, pp. 577–588.
Gust, Christopher J. and Jamie Marquez (2004), International comparisons of productiv-
ity growth: The role of information technology and regulatory practices, Labour Eco-
nomics, 11, pp. 33–58.
Haberman, Alan L. (2001), Appendix: 17 billion reasons to say thanks, in: Alan L. Haber-
man (ed.), Twenty-five years behind bars, pp. 113–151 (Harvard University Press), Pro-
ceedings of the Twenty-fifth anniversary of the U.P.C. at the Smithsonian Institution,
September 30, 1999.
Hall, Bronwyn H. and Beethika Khan (2003), Adoption of new technology, in: Derek C.
Jones (ed.), New Economy Handbook (Academic Press).
Haskel, Jonathan and Raffaella Sadun (2005), Entry, exit and labour productivity in U.K.
retailing: evidence from micro data, mimeo.
Haucap, Justus and Christian Wey (2004), Unionisation structures and innovation incen-
tives, The Economic Journal, 114 (127), pp. C149–C165.
Holmes, Thomas J (2001), Bar codes lead to frequent deliveries and superstores, RAND
Journal of Economics, 32 (4), pp. 708–25.
IMF (2001), The Information Technology Revolution, chapter III, pp. 105–144 (International
Monetary Fund).
Karshenas, Massoud and Paul L. Stoneman (1993), Rank, stock, order, and epidemic ef-
fects in the diffusion of new process technologies: An empirical model, RAND Journal
of Economics, 24 (4), pp. 503–528.
32

— (1995), Technological diffusion, in: Paul L. Stoneman (ed.), Handbook of the economics of
innovation and technological change, pp. 265–297 (Blackwell).
Koeniger, Winfried (2005), Dismissal costs and innovation, Economics Letters, 88 (1), pp.
79–84.
Levin, Sharon G., Stanford L. Levin and John B. Meisel (1987), A dynamic analysis of the
adoption of a new technology: the case of optical scanners, The Review of Economics and
Statistics, 69, pp. 12–17.
— (1992), Market structure, uncertainty, and intrafirm diffusion: The case of optical scan-
ners in grocery stores, The Review of Economics and Statistics, 74 (2), pp. 345–50.
McKinsey Global Institute (2002), How IT Enables Productivity Growth, MGI Reports (McK-
insey & Company).
Michael, Steven C. (1994), Competition in organizational form: Mail order versus retail
stores, 1910-1940, Journal of Economic Behavior & Organization, 23 (3), pp. 269–286.
Nakamura, Leonard I. (1999), The measurement of retail output and the retail revolution,
Canadian Journal of Economics, 32 (2), pp. 408–425.
Nelson, John E. (2001), Scanning’s silver celebration, in: Alan L. Haberman (ed.), Twenty-
five years behind bars, pp. 25–33 (Harvard University Press), Proceedings of the Twenty-
fifth anniversary of the U.P.C. at the Smithsonian Institution, September 30, 1999.
OECD (2004), Employment outlook (Organisation for Economic Co-operation and Devel-
opment).
Scarpetta, Stefano, Philip Hemmings, Thierry Tressel and Jaejoon Woo (2002), The role of
policy and institutions for productivity and firm dynamics: evidence from micro and
industry data, Technical report, OECD Economics Department.
Schumpeter, Joseph A. (1942), Capitalism, socialism and democracy (Routledge, London and
New York), 5th edition, reprinted 1968.
Smith, Howard and Donald Hay (2005), Streets, malls, and supermarkets, Journal of Eco-
nomics & Management Strategy, 14 (1), pp. 29–59.
33
Spence, A. Michael (1975), Monopoly, quality, and regulation, Bell Journal of Economics,
6 (2), pp. 417–429.
Stoneman, Paul (2002), The economics of technological diffusion (Blackwell, Oxford).
Swan, Peter L.. (1970), Market structure and technological progress: The influence of
monopoly on product innovation, The Quarterly Journal of Economics, 84 (4), pp. 627–38.
Timmer, M. and R. Inklaar (2005), Productivity differentials in the U.S. and EU distrib-
utive trade sector: Statistical myth or reality?, GGDC Research Memorandum GD-76,
Groningen Growth and Development Centre, University of Groningen.
World Bank (2003), World development indicators CD-ROM (World Bank).
34