Hydrology and Trophic Ecology of Walden Pond, Concord ... · PDF fileU.S. DEPARTMENT OF THE...
1
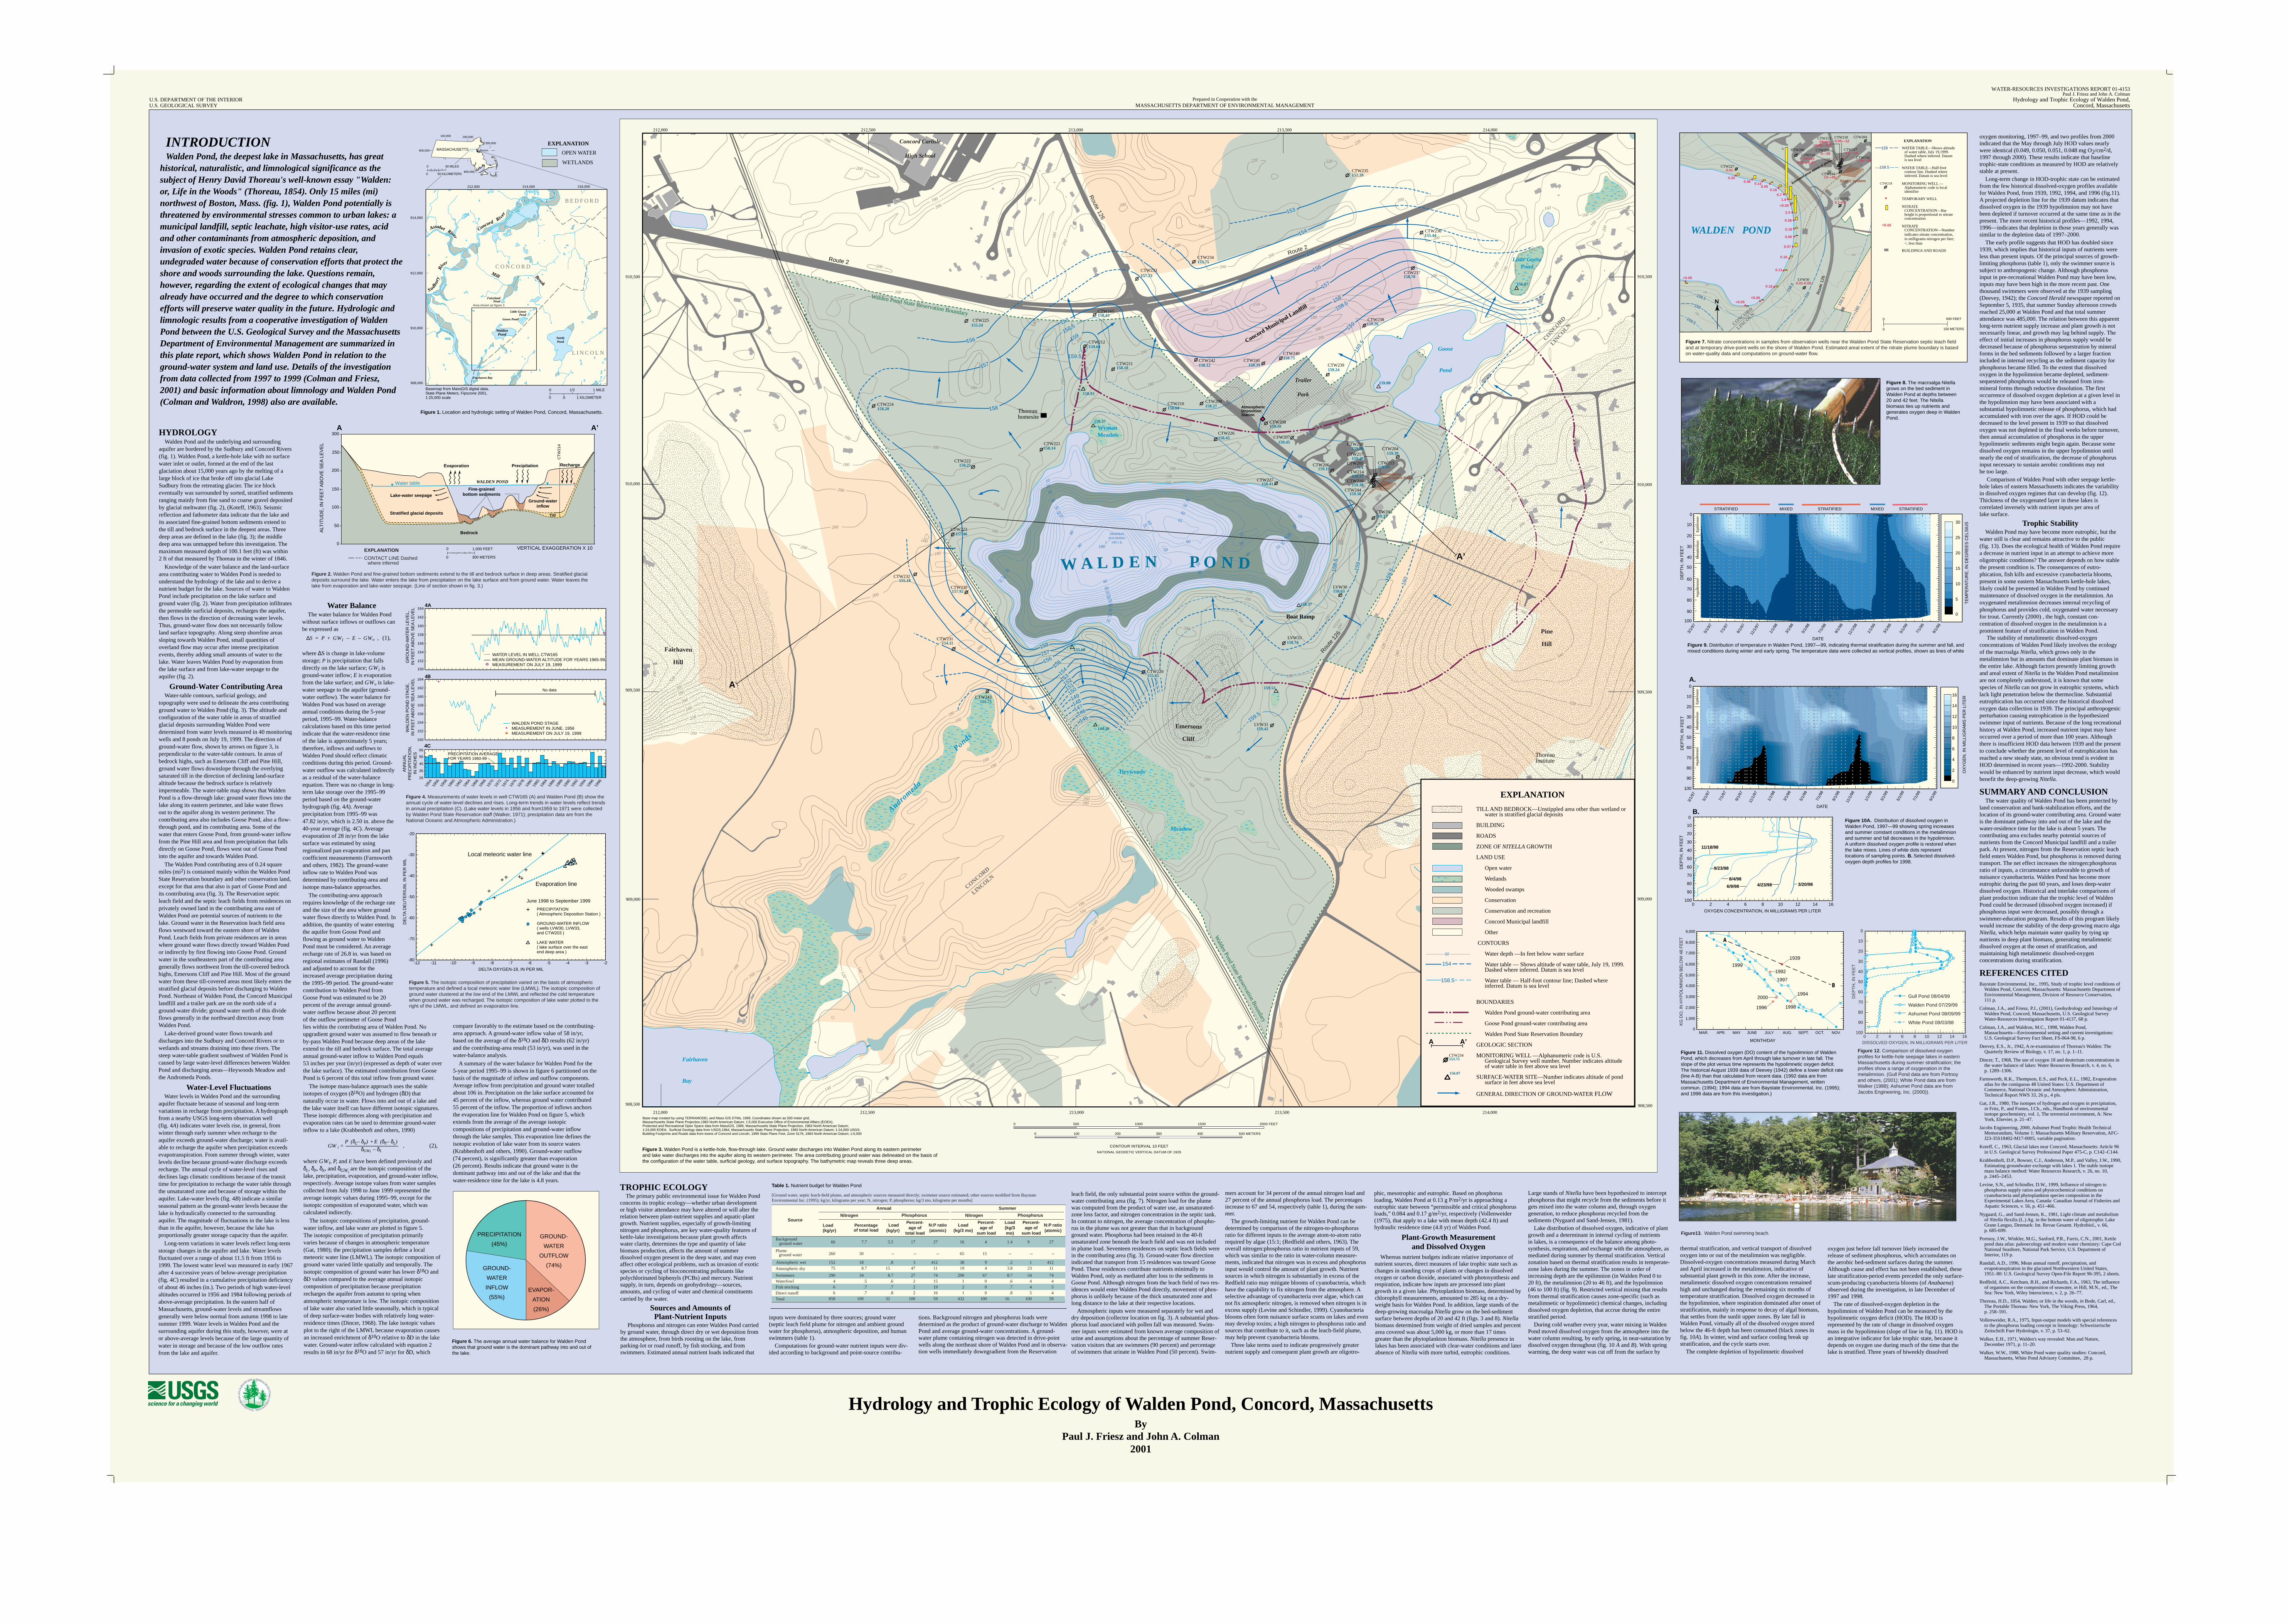
U.S. DEPARTMENT OF THE INTERIOR U.S. GEOLOGICAL SURVEY WATER-RESOURCES INVESTIGATIONS REPORT 01-4153 Paul J. Friesz and John A. Colman Hydrology and Trophic Ecology of Walden Pond, Concord, Massachusetts Prepared in Cooperation with the MASSACHUSETTS DEPARTMENT OF ENVIRONMENTAL MANAGEMENT Hydrology and Trophic Ecology of Walden Pond, Concord, Massachusetts By Paul J. Friesz and John A. Colman 2001 Walden Pond State Reservation Boundary Walden Pond State Reservation Boundary Pine Hill Concord Carlisle High School Trailer Park Route 2 Route 126 Route 126 145 146 147 148 149 150 151 152 153 156 157 158 154 155 158 157 156 159 158.5 159.5 158 158 158.5 159 159.5 157 156 155 154 153 158.5 159.5 159 160 159.5 LINCOLN CONCORD LINCOLN CONCORD A’ A Little Goose Pond Goose Pond Boat Ramp Heywoods Meadow Thoreau homesite Wyman Meadow Thoreau Institute Andromeda Ponds Fairhaven Bay Route 2 160 180 200 220 160 180 200 220 260 240 160 180 200 220 240 160 180 160 180 160 180 180 160 160 180 140 120 140 160 180 120 140 160 180 200 220 240 260 280 300 320 200 160 180 200 180 180 200 180 200 200 200 200 180 140 160 180 140 120 180 200 200 200 200 200 200 200 200 200 200 220 240 180 180 220 240 260 280 300 320 340 200 200 180 180 200 220 240 160 160 160 180 200 280 180 200 220 240 260 280 300 320 340 360 220 220 220 220 200 200 200 220 200 180 200 180 220 220 200 200 180 200 180 200 180 200 200 180 180 180 180 200 180 180 180 180 200 200 200 200 200 200 200 200 200 180 200 180 180 180 180 340 Fairhaven Hill Emersons Cliff 10 20 30 40 50 40 50 60 50 100 90 80 60 70 50 40 30 10 40 30 55 35 30 20 10 20 10 20 30 40 50 60 70 80 90 60 40 50 55 60 65 DEEPEST SOUNDING 100.1 ft. 159.26 159.24 158.12 158.75 158.39 158.18 159.64 158.43 158.63 159.39 NA 159.19 159.45 159.10 158.27 158.64 159.39 159.35 159.37 157.23 152.39 155.44 158.70 153.75 159.38 159.38 159.40 159.38 158.74 155.65 151.75 158.14 158.25 157.46 155.24 158.20 158.45 158.41 157.92 154.11 155.18 159.42 156.07 158.37 155.68 144.30 158.37 158.93 159.80 159.53 Reservation Septic Leach Field CTW204 CTW218 CTW217 CTW213 CTW203 CTW244 CTW216 CTW205 LVW30 CTW206 CTW207 CTW208 CTW227 CTW214 CTW238 CTW239 CTW240 CTW241 LVW33 LVW31 CTW232 CTW231 CTW230 CTW224 CTW222 CTW221 CTW223 CTW225 CTW212 CTW211 CTW165 CTW233 CTW234 CTW235 CTW236 CTW237 CTW210 CTW226 CTW209 CTW242 CTW243 CTW220 Atmospheric Deposition Station Concord Municipal Landfill 910,500 910,000 909,500 909,000 908,500 213,500 214,000 213,000 212,500 212,000 910,500 910,000 909,500 909,000 908,500 213,500 214,000 213,000 212,500 212,000 W A L D E N P O N D CTW234 153.75 156.07 154 158.5 TILL AND BEDROCK—Unstippled area other than wetland or water is stratified glacial deposits BUILDING ROADS ZONE OF NITELLA GROWTH LAND USE Open water Wetlands Wooded swamps Conservation Conservation and recreation Concord Municipal landfill Other CONTOURS Water depth —In feet below water surface Water table — Shows altitude of water table, July 19, 1999. Dashed where inferred. Datum is sea level Water table — Half-foot contour line; Dashed where inferred. Datum is sea level BOUNDARIES Walden Pond ground-water contributing area Goose Pond ground-water contributing area Walden Pond State Reservation Boundary GEOLOGIC SECTION MONITORING WELL —Alphanumeric code is U.S. Geological Survey well number. Number indicates altitude of water table in feet above sea level SURFACE-WATER SITE—Number indicates altitude of pond surface in feet above sea level GENERAL DIRECTION OF GROUND-WATER FLOW EXPLANATION A’ A 60 Base map created by using TERRAMODEL and Mass GIS DTMs, 1999, Coordinates shown as 500 meter grid, Massachusetts State Plane Projection,1983 North American Datum; 1:5,000 Executive Office of Environmental Affairs (EOEA); Protected and Recreational Open Space data from MassGIS, 1989, Massachusetts State Plane Projection, 1983 North American Datum; 1:24,000 EOEA; Surficial Geology data from USGS,1964, Massachusetts State Plane Projection, 1983 North American Datum; 1:24,000 USGS; Building Footprints and Roads data from towns of Concord and Lincoln, 1999 State Plane Feet, Zone 5176, 1983 North American Datum; 1:5,000 Figure 3. Walden Pond is a kettle-hole, flow-through lake. Ground water discharges into Walden Pond along its eastern perimeter and lake water discharges into the aquifer along its western perimeter. The area contributing ground water was delineated on the basis of the configuration of the water table, surficial geology, and surface topography. The bathymetric map reveals three deep areas. INTRODUCTION Walden Pond, the deepest lake in Massachusetts, has great historical, naturalistic, and limnological significance as the subject of Henry David Thoreau's well-known essay "Walden: or, Life in the Woods" (Thoreau, 1854). Only 15 miles (mi) northwest of Boston, Mass. (fig. 1), Walden Pond potentially is threatened by environmental stresses common to urban lakes: a municipal landfill, septic leachate, high visitor-use rates, acid and other contaminants from atmospheric deposition, and invasion of exotic species. Walden Pond retains clear, undegraded water because of conservation efforts that protect the shore and woods surrounding the lake. Questions remain, however, regarding the extent of ecological changes that may already have occurred and the degree to which conservation efforts will preserve water quality in the future. Hydrologic and limnologic results from a cooperative investigation of Walden Pond between the U.S. Geological Survey and the Massachusetts Department of Environmental Management are summarized in this plate report, which shows Walden Pond in relation to the ground-water system and land use. Details of the investigation from data collected from 1997 to 1999 (Colman and Friesz, 2001) and basic information about limnology and Walden Pond (Colman and Waldron, 1998) also are available. Figure 6. The average annual water balance for Walden Pond shows that ground water is the dominant pathway into and out of the lake. PRECIPITATION (45%) GROUND- WATER INFLOW (55%) EVAPOR- ATION (26%) GROUND- WATER OUTFLOW (74%) Figure13. Walden Pond swimming beach. Figure 12. Comparison of dissolved-oxygen profiles for kettle-hole seepage lakes in eastern Massachusetts during summer stratification; the profiles show a range of oxygenation in the metalimnion. (Gull Pond data are from Portnoy and others, (2001); White Pond data are from Walker (1988); Ashumet Pond data are from Jacobs Engineering, Inc. (2000)). Gull Pond 08/04/99 Walden Pond 07/29/99 Ashumet Pond 08/09/99 White Pond 08/03/88 100 90 80 70 60 50 40 30 20 10 0 0 2 4 6 8 10 12 14 16 DEPTH, IN FEET DISSOLVED OXYGEN, IN MILLIGRAMS PER LITER MAR. APR. MAY JUNE JULY AUG. SEPT. OCT. NOV. 9,000 8,000 7,000 6,000 5,000 4,000 3,000 2,000 1,000 0 MONTH/DAY B A 1999 1992 1997 1996 2000 1994 1939 1998 Figure 11. Dissolved oxygen (DO) content of the hypolimnion of Walden Pond, which decreases from April through lake turnover in late fall. The slope of the plot versus time represents the hypolimnetic oxygen deficit. The historical August 1939 data of Deevey (1942) define a lower deficit rate (line A-B) than that calculated from recent data. (1992 data are from Massachusetts Department of Environmental Management, written commun. (1994); 1994 data are from Baystate Environmental, Inc. (1995); and 1996 data are from this investigation.) 0 0 2 4 6 8 10 12 14 16 DEPTH, IN FEET OXYGEN CONCENTRATION, IN MILLIGRAMS PER LITER OXYGEN, IN MILLIGRAMS PER LITER 3/20/98 4/23/98 9/23/98 8/4/98 6/9/98 11/18/98 0 2 4 6 8 10 12 14 16 100 90 80 70 60 50 40 30 20 10 0 3/1/97 5/1/97 7/1/97 9/1/97 11/1/97 1/1/98 3/1/98 5/1/98 7/1/98 9/1/98 11/1/98 1/1/99 3/1/99 5/1/99 7/1/99 9/1/99 DEPTH, IN FEET DATE 100 90 80 70 60 50 40 30 20 10 Metalimnion Epilimnion Hypolimnion A. B. Figure 10A. Distribution of dissolved oxygen in Walden Pond, 1997—99 showing spring increases and summer constant conditions in the metalimnion and summer and fall decreases in the hypolimnion. A uniform dissolved oxygen profile is restored when the lake mixes. Lines of white dots represent locations of sampling points. B. Selected dissolved- oxygen depth profiles for 1998. Figure 9. Distribution of temperature in Walden Pond, 1997—99, indicating thermal stratification during the summer and fall, and mixed conditions during winter and early spring. The temperature data were collected as vertical profiles, shown as lines of white Metalimnion Epilimnion Hypolimnion 0 5 10 15 20 25 30 TEMPERATURE, IN DEGREES CELSIUS 100 90 80 70 60 50 40 30 20 10 0 DATE STRATIFIED MIXED STRATIFIED MIXED STRATIFIED 3/1/97 5/1/97 7/1/97 9/1/97 11/1/97 1/1/98 3/1/98 5/1/98 7/1/98 9/1/98 11/1/98 1/1/99 3/1/99 5/1/99 7/1/99 9/1/99 DEPTH, IN FEET Figure 8. The macroalga Nitella grows on the bed sediment in Walden Pond at depths between 20 and 42 feet. The Nitella biomass ties up nutrients and generates oxygen deep in Walden Pond. Figure 1. Location and hydrologic setting of Walden Pond, Concord, Massachusetts. 216,000 214,000 212,000 914,000 912,000 910,000 908,000 LINCOLN CONCORD Sandy Pond Goose Pond Fairyland Pond Brook S u d b u r y R i v e r C o n c o r d R i v er M ill A s s a b e t R iv e r Fairhaven Bay Walden Pond Little Goose Pond BEDFORD Basemap from MassGIS digital data, State Plane Meters, Fipszone 2001, 1:25,000 scale 0 1/2 1 MILE 0 1 KILOMETER .5 EXPLANATION WETLANDS OPEN WATER 300,000 200,000 100,000 900,000 800,000 Boston 0 MASSACHUSETTS 0 50 KILOMETERS 50 MILES Area shown as figure 3 , GW i = P(δ L δ P ) – E(δ E δ L ) – + δ GW i δ L – ∆S = P + GW i – E – GW o , KG DO, IN HYPOLIMNION BELOW 48 FEET HYDROLOGY Walden Pond and the underlying and surrounding aquifer are bordered by the Sudbury and Concord Rivers (fig. 1). Walden Pond, a kettle-hole lake with no surface water inlet or outlet, formed at the end of the last glaciation about 15,000 years ago by the melting of a large block of ice that broke off into glacial Lake Sudbury from the retreating glacier. The ice block eventually was surrounded by sorted, stratified sediments ranging mainly from fine sand to coarse gravel deposited by glacial meltwater (fig. 2), (Koteff, 1963). Seismic reflection and fathometer data indicate that the lake and its associated fine-grained bottom sediments extend to the till and bedrock surface in the deepest areas. Three deep areas are defined in the lake (fig. 3); the middle deep area was unmapped before this investigation. The maximum measured depth of 100.1 feet (ft) was within 2 ft of that measured by Thoreau in the winter of 1846. Knowledge of the water balance and the land-surface area contributing water to Walden Pond is needed to understand the hydrology of the lake and to derive a nutrient budget for the lake. Sources of water to Walden Pond include precipitation on the lake surface and ground water (fig. 2). Water from precipitation infiltrates the permeable surficial deposits, recharges the aquifer, then flows in the direction of decreasing water levels. Thus, ground-water flow does not necessarily follow land surface topography. Along steep shoreline areas sloping towards Walden Pond, small quantities of overland flow may occur after intense precipitation events, thereby adding small amounts of water to the lake. Water leaves Walden Pond by evaporation from the lake surface and from lake-water seepage to the aquifer (fig. 2). Ground-Water Contributing Area Water-table contours, surficial geology, and topography were used to delineate the area contributing ground water to Walden Pond (fig. 3). The altitude and configuration of the water table in areas of stratified glacial deposits surrounding Walden Pond were determined from water levels measured in 40 monitoring wells and 8 ponds on July 19, 1999. The direction of ground-water flow, shown by arrows on figure 3, is perpendicular to the water-table contours. In areas of bedrock highs, such as Emersons Cliff and Pine Hill, ground water flows downslope through the overlying saturated till in the direction of declining land-surface altitude because the bedrock surface is relatively impermeable. The water-table map shows that Walden Pond is a flow-through lake: ground water flows into the lake along its eastern perimeter, and lake water flows out to the aquifer along its western perimeter. The contributing area also includes Goose Pond, also a flow- through pond, and its contributing area. Some of the water that enters Goose Pond, from ground-water inflow from the Pine Hill area and from precipitation that falls directly on Goose Pond, flows west out of Goose Pond into the aquifer and towards Walden Pond. The Walden Pond contributing area of 0.24 square miles (mi 2 ) is contained mainly within the Walden Pond State Reservation boundary and other conservation land, except for that area that also is part of Goose Pond and its contributing area (fig. 3). The Reservation septic leach field and the septic leach fields from residences on privately owned land in the contributing area east of Walden Pond are potential sources of nutrients to the lake. Ground water in the Reservation leach field area flows westward toward the eastern shore of Walden Pond. Leach fields from private residences are in areas where ground water flows directly toward Walden Pond or indirectly by first flowing into Goose Pond. Ground water in the southeastern part of the contributing area generally flows northwest from the till-covered bedrock highs, Emersons Cliff and Pine Hill. Most of the ground water from these till-covered areas most likely enters the stratified glacial deposits before discharging to Walden Pond. Northeast of Walden Pond, the Concord Municipal landfill and a trailer park are on the north side of a ground-water divide; ground water north of this divide flows generally in the northward direction away from Walden Pond. Lake-derived ground water flows towards and discharges into the Sudbury and Concord Rivers or to wetlands and streams draining into these rivers. The steep water-table gradient southwest of Walden Pond is caused by large water-level differences between Walden Pond and discharging areas—Heywoods Meadow and the Andromeda Ponds. Water-Level Fluctuations Water levels in Walden Pond and the surrounding aquifer fluctuate because of seasonal and long-term variations in recharge from precipitation. A hydrograph from a nearby USGS long-term observation well (fig. 4A) indicates water levels rise, in general, from winter through early summer when recharge to the aquifer exceeds ground-water discharge; water is avail- able to recharge the aquifer when precipitation exceeds evapotranspiration. From summer through winter, water levels decline because ground-water discharge exceeds recharge. The annual cycle of water-level rises and declines lags climatic conditions because of the transit time for precipitation to recharge the water table through the unsaturated zone and because of storage within the aquifer. Lake-water levels (fig. 4B) indicate a similar seasonal pattern as the ground-water levels because the lake is hydraulically connected to the surrounding aquifer. The magnitude of fluctuations in the lake is less than in the aquifer, however, because the lake has proportionally greater storage capacity than the aquifer. Long-term variations in water levels reflect long-term storage changes in the aquifer and lake. Water levels fluctuated over a range of about 11.5 ft from 1956 to 1999. The lowest water level was measured in early 1967 after 4 successive years of below-average precipitation (fig. 4C) resulted in a cumulative precipitation deficiency of about 46 inches (in.). Two periods of high water-level altitudes occurred in 1956 and 1984 following periods of above-average precipitation. In the eastern half of Massachusetts, ground-water levels and streamflows generally were below normal from autumn 1998 to late summer 1999. Water levels in Walden Pond and the surrounding aquifer during this study, however, were at or above-average levels because of the large quantity of water in storage and because of the low outflow rates from the lake and aquifer. Water Balance The water balance for Walden Pond without surface inflows or outflows can be expressed as (1), where ∆S is change in lake-volume storage; P is precipitation that falls directly on the lake surface; GW i is ground-water inflow; E is evaporation from the lake surface; and GW o is lake- water seepage to the aquifer (ground- water outflow). The water balance for Walden Pond was based on average annual conditions during the 5-year period, 1995–99. Water-balance calculations based on this time period indicate that the water-residence time of the lake is approximately 5 years; therefore, inflows and outflows to Walden Pond should reflect climatic conditions during this period. Ground- water outflow was calculated indirectly as a residual of the water-balance equation. There was no change in long- term lake storage over the 1995–99 period based on the ground-water hydrograph (fig. 4A). Average precipitation from 1995–99 was 47.82 in/yr, which is 2.50 in. above the 40-year average (fig. 4C). Average evaporation of 28 in/yr from the lake surface was estimated by using regionalized pan evaporation and pan coefficient measurements (Farnsworth and others, 1982). The ground-water inflow rate to Walden Pond was determined by contributing-area and isotope mass-balance approaches. The contributing-area approach requires knowledge of the recharge rate and the size of the area where ground water flows directly to Walden Pond. In addition, the quantity of water entering the aquifer from Goose Pond and flowing as ground water to Walden Pond must be considered. An average recharge rate of 26.8 in. was based on regional estimates of Randall (1996) and adjusted to account for the increased average precipitation during the 1995–99 period. The ground-water contribution to Walden Pond from Goose Pond was estimated to be 20 percent of the average annual ground- water outflow because about 20 percent of the outflow perimeter of Goose Pond lies within the contributing area of Walden Pond. No upgradient ground water was assumed to flow beneath or by-pass Walden Pond because deep areas of the lake extend to the till and bedrock surface. The total average annual ground-water inflow to Walden Pond equals 53 inches per year (in/yr) (expressed as depth of water over the lake surface). The estimated contribution from Goose Pond is 6 percent of this total inflow from ground water. The isotope mass-balance approach uses the stable isotopes of oxygen (δ 18 O) and hydrogen (δD) that naturally occur in water. Flows into and out of a lake and the lake water itself can have different isotopic signatures. These isotopic differences along with precipitation and evaporation rates can be used to determine ground-water inflow to a lake (Krabbenhoft and others, 1990) (2), where GW i , P, and E have been defined previously and δ L , δ P , δ E , and δ GW i are the isotopic composition of the lake, precipitation, evaporation, and ground-water inflow, respectively. Average isotope values from water samples collected from July 1998 to June 1999 represented the average isotopic values during 1995–99, except for the isotopic composition of evaporated water, which was calculated indirectly. The isotopic compositions of precipitation, ground- water inflow, and lake water are plotted in figure 5. The isotopic composition of precipitation primarily varies because of changes in atmospheric temperature (Gat, 1980); the precipitation samples define a local meteoric water line (LMWL). The isotopic composition of ground water varied little spatially and temporally. The isotopic composition of ground water has lower δ 18 O and δD values compared to the average annual isotopic composition of precipitation because precipitation recharges the aquifer from autumn to spring when atmospheric temperature is low. The isotopic composition of lake water also varied little seasonally, which is typical of deep surface-water bodies with relatively long water- residence times (Dincer, 1968). The lake isotopic values plot to the right of the LMWL because evaporation causes an increased enrichment of δ 18 O relative to δD in the lake water. Ground-water inflow calculated with equation 2 results in 68 in/yr for δ 18 O and 57 in/yr for δD, which compare favorably to the estimate based on the contributing- area approach. A ground-water inflow value of 58 in/yr, based on the average of the δ 18 O and δD results (62 in/yr) and the contributing-area result (53 in/yr), was used in the water-balance analysis. A summary of the water balance for Walden Pond for the 5-year period 1995–99 is shown in figure 6 partitioned on the basis of the magnitude of inflow and outflow components. Average inflow from precipitation and ground water totalled about 106 in. Precipitation on the lake surface accounted for 45 percent of the inflow, whereas ground water contributed 55 percent of the inflow. The proportion of inflows anchors the evaporation line for Walden Pond on figure 5, which extends from the average of the average isotopic compositions of precipitation and ground-water inflow through the lake samples. This evaporation line defines the isotopic evolution of lake water from its source waters (Krabbenhoft and others, 1990). Ground-water outflow (74 percent), is significantly greater than evaporation (26 percent). Results indicate that ground water is the dominant pathway into and out of the lake and that the water-residence time for the lake is 4.8 years. TROPHIC ECOLOGY The primary public environmental issue for Walden Pond concerns its trophic ecology—whether urban development or high visitor attendance may have altered or will alter the relation between plant-nutrient supplies and aquatic-plant growth. Nutrient supplies, especially of growth-limiting nitrogen and phosphorus, are key water-quality features of kettle-lake investigations because plant growth affects water clarity, determines the type and quantity of lake biomass production, affects the amount of summer dissolved oxygen present in the deep water, and may even affect other ecological problems, such as invasion of exotic species or cycling of bioconcentrating pollutants like polychlorinated biphenyls (PCBs) and mercury. Nutrient supply, in turn, depends on geohydrology—sources, amounts, and cycling of water and chemical constituents carried by the water. Sources and Amounts of Plant-Nutrient Inputs Phosphorus and nitrogen can enter Walden Pond carried by ground water, through direct dry or wet deposition from the atmosphere, from birds roosting on the lake, from parking-lot or road runoff, by fish stocking, and from swimmers. Estimated annual nutrient loads indicated that inputs were dominated by three sources; ground water (septic leach field plume for nitrogen and ambient ground water for phosphorus), atmospheric deposition, and human swimmers (table 1). Computations for ground-water nutrient inputs were div- ided according to background and point-source contribu- tions. Background nitrogen and phosphorus loads were determined as the product of ground-water discharge to Walden Pond and average ground-water concentrations. A ground- water plume containing nitrogen was detected in drive-point wells along the northeast shore of Walden Pond and in observa- tion wells immediately downgradient from the Reservation leach field, the only substantial point source within the ground- water contributing area (fig. 7). Nitrogen load for the plume was computed from the product of water use, an unsaturated- zone loss factor, and nitrogen concentration in the septic tank. In contrast to nitrogen, the average concentration of phospho- rus in the plume was not greater than that in background ground water. Phosphorus had been retained in the 40-ft unsaturated zone beneath the leach field and was not included in plume load. Seventeen residences on septic leach fields were in the contributing area (fig. 3). Ground-water flow direction indicated that transport from 15 residences was toward Goose Pond. These residences contribute nutrients minimally to Walden Pond, only as mediated after loss to the sediments in Goose Pond. Although nitrogen from the leach field of two res- idences would enter Walden Pond directly, movement of phos- phorus is unlikely because of the thick unsaturated zone and long distance to the lake at their respective locations. Atmospheric inputs were measured separately for wet and dry deposition (collector location on fig. 3). A substantial phos- phorus load associated with pollen fall was measured. Swim- mer inputs were estimated from known average composition of urine and assumptions about the percentage of summer Reser- vation visitors that are swimmers (90 percent) and percentage of swimmers that urinate in Walden Pond (50 percent). Swim- mers account for 34 percent of the annual nitrogen load and 27 percent of the annual phosphorus load. The percentages increase to 67 and 54, respectively (table 1), during the sum- mer. The growth-limiting nutrient for Walden Pond can be determined by comparison of the nitrogen-to-phosphorus ratio for different inputs to the average atom-to-atom ratio required by algae (15:1; (Redfield and others, 1963). The overall nitrogen:phosphorus ratio in nutrient inputs of 59, which was similar to the ratio in water-column measure- ments, indicated that nitrogen was in excess and phosphorus input would control the amount of plant growth. Nutrient sources in which nitrogen is substantially in excess of the Redfield ratio may mitigate blooms of cyanobacteria, which have the capability to fix nitrogen from the atmosphere. A selective advantage of cyanobacteria over algae, which can not fix atmospheric nitrogen, is removed when nitrogen is in excess supply (Levine and Schindler, 1999). Cyanobacteria blooms often form nuisance surface scums on lakes and even may develop toxins; a high nitrogen to phosphorus ratio and sources that contribute to it, such as the leach-field plume, may help prevent cyanobacteria blooms. Three lake terms used to indicate progressively greater nutrient supply and consequent plant growth are oligotro- phic, mesotrophic and eutrophic. Based on phosphorus loading, Walden Pond at 0.13 g P/m 2 /yr is approaching a eutrophic state between “permissible and critical phosphorus loads,” 0.084 and 0.17 g/m 2 /yr, respectively (Vollenweider (1975), that apply to a lake with mean depth (42.4 ft) and hydraulic residence time (4.8 yr) of Walden Pond. Plant-Growth Measurement and Dissolved Oxygen Whereas nutrient budgets indicate relative importance of nutrient sources, direct measures of lake trophic state such as changes in standing crops of plants or changes in dissolved oxygen or carbon dioxide, associated with photosynthesis and respiration, indicate how inputs are processed into plant growth in a given lake. Phytoplankton biomass, determined by chlorophyll measurements, amounted to 285 kg on a dry- weight basis for Walden Pond. In addition, large stands of the deep-growing macroalga Nitella grow on the bed-sediment surface between depths of 20 and 42 ft (figs. 3 and 8). Nitella biomass determined from weight of dried samples and percent area covered was about 5,000 kg, or more than 17 times greater than the phytoplankton biomass. Nitella presence in lakes has been associated with clear-water conditions and later absence of Nitella with more turbid, eutrophic conditions. Large stands of Nitella have been hypothesized to intercept phosphorus that might recycle from the sediments before it gets mixed into the water column and, through oxygen generation, to reduce phosphorus recycled from the sediments (Nygaard and Sand-Jensen, 1981). Lake distribution of dissolved oxygen, indicative of plant growth and a determinant in internal cycling of nutrients in lakes, is a consequence of the balance among photo- synthesis, respiration, and exchange with the atmosphere, as mediated during summer by thermal stratification. Vertical zonation based on thermal stratification results in temperate- zone lakes during the summer. The zones in order of increasing depth are the epilimnion (in Walden Pond 0 to 20 ft), the metalimnion (20 to 46 ft), and the hypolimnion (46 to 100 ft) (fig. 9). Restricted vertical mixing that results from thermal stratification causes zone-specific (such as metalimnetic or hypolimnetic) chemical changes, including dissolved oxygen depletion, that accrue during the entire stratified period. During cold weather every year, water mixing in Walden Pond moved dissolved oxygen from the atmosphere into the water column resulting, by early spring, in near-saturation by dissolved oxygen throughout (fig. 10 A and B). With spring warming, the deep water was cut off from the surface by thermal stratification, and vertical transport of dissolved oxygen into or out of the metalimnion was negligible. Dissolved-oxygen concentrations measured during March and April increased in the metalimnion, indicative of substantial plant growth in this zone. After the increase, metalimnetic dissolved oxygen concentrations remained high and unchanged during the remaining six months of temperature stratification. Dissolved oxygen decreased in the hypolimnion, where respiration dominated after onset of stratification, mainly in response to decay of algal biomass, that settles from the sunlit upper zones. By late fall in Walden Pond, virtually all of the dissolved oxygen stored below the 46-ft depth has been consumed (black zones in fig. 10A). In winter, wind and surface cooling break up stratification, and the cycle starts over. The complete depletion of hypolimnetic dissolved oxygen just before fall turnover likely increased the release of sediment phosphorus, which accumulates on the aerobic bed-sediment surfaces during the summer. Although cause and effect has not been established, these late stratification-period events preceded the only surface- scum-producing cyanobacteria blooms (of Anabaena) observed during the investigation, in late December of 1997 and 1998. The rate of dissolved-oxygen depletion in the hypolimnion of Walden Pond can be measured by the hypolimnetic oxygen deficit (HOD). The HOD is represented by the rate of change in dissolved oxygen mass in the hypolimnion (slope of line in fig. 11). HOD is an integrative indicator for lake trophic state, because it depends on oxygen use during much of the time that the lake is stratified. Three years of biweekly dissolved oxygen monitoring, 1997–99, and two profiles from 2000 indicated that the May through July HOD values nearly were identical (0.049, 0.050, 0.051, 0.048 mg O 2 /cm 2 /d, 1997 through 2000). These results indicate that baseline trophic-state conditions as measured by HOD are relatively stable at present. Long-term change in HOD-trophic state can be estimated from the few historical dissolved-oxygen profiles available for Walden Pond, from 1939, 1992, 1994, and 1996 (fig.11). A projected depletion line for the 1939 datum indicates that dissolved oxygen in the 1939 hypolimnion may not have been depleted if turnover occurred at the same time as in the present. The more recent historical profiles—1992, 1994, 1996—indicates that depletion in those years generally was similar to the depletion data of 1997–2000. The early profile suggests that HOD has doubled since 1939, which implies that historical inputs of nutrients were less than present inputs. Of the principal sources of growth- limiting phosphorus (table 1), only the swimmer source is subject to anthropogenic change. Although phosphorus input in pre-recreational Walden Pond may have been low, inputs may have been high in the more recent past. One thousand swimmers were observed at the 1939 sampling (Deevey, 1942); the Concord Herald newspaper reported on September 5, 1935, that summer Sunday afternoon crowds reached 25,000 at Walden Pond and that total summer attendance was 485,000. The relation between this apparent long-term nutrient supply increase and plant growth is not necessarily linear, and growth may lag behind supply. The effect of initial increases in phosphorus supply would be decreased because of phosphorus sequestration by mineral forms in the bed sediments followed by a larger fraction included in internal recycling as the sediment capacity for phosphorus became filled. To the extent that dissolved oxygen in the hypolimnion became depleted, sediment- sequestered phosphorus would be released from iron- mineral forms through reductive dissolution. The first occurrence of dissolved oxygen depletion at a given level in the hypolimnion may have been associated with a substantial hypolimnetic release of phosphorus, which had accumulated with iron over the ages. If HOD could be decreased to the level present in 1939 so that dissolved oxygen was not depleted in the final weeks before turnover, then annual accumulation of phosphorus in the upper hypolimnetic sediments might begin again. Because some dissolved oxygen remains in the upper hypolimnion until nearly the end of stratification, the decrease of phosphorus input necessary to sustain aerobic conditions may not be too large. Comparison of Walden Pond with other seepage kettle- hole lakes of eastern Massachusetts indicates the variability in dissolved oxygen regimes that can develop (fig. 12). Thickness of the oxygenated layer in these lakes is correlated inversely with nutrient inputs per area of lake surface. Trophic Stability Walden Pond may have become more eutrophic, but the water still is clear and remains attractive to the public (fig. 13). Does the ecological health of Walden Pond require a decrease in nutrient input in an attempt to achieve more oligotrophic conditions? The answer depends on how stable the present condition is. The consequences of eutro- phication, fish kills and excessive cyanobacteria blooms, present in some eastern Massachusetts kettle-hole lakes, likely could be prevented in Walden Pond by continued maintenance of dissolved oxygen in the metalimnion. An oxygenated metalimnion decreases internal recycling of phosphorus and provides cold, oxygenated water necessary for trout. Currently (2000) , the high, constant con- centration of dissolved oxygen in the metalimnion is a prominent feature of stratification in Walden Pond. The stability of metalimnetic dissolved-oxygen concentrations of Walden Pond likely involves the ecology of the macroalga Nitella, which grows only in the metalimnion but in amounts that dominate plant biomass in the entire lake. Although factors presently limiting growth and areal extent of Nitella in the Walden Pond metalimnion are not completely understood, it is known that some species of Nitella can not grow in eutrophic systems, which lack light penetration below the thermocline. Substantial eutrophication has occurred since the historical dissolved oxygen data collection in 1939. The principal anthropogenic perturbation causing eutrophication is the hypothesized swimmer input of nutrients. Because of the long recreational history at Walden Pond, increased nutrient input may have occurred over a period of more than 100 years. Although there is insufficient HOD data between 1939 and the present to conclude whether the present level of eutrophication has reached a new steady state, no obvious trend is evident in HOD determined in recent years—1992-2000. Stability would be enhanced by nutrient input decrease, which would benefit the deep-growing Nitella. SUMMARY AND CONCLUSION The water quality of Walden Pond has been protected by land conservation and bank-stabilization efforts, and the location of its ground-water contributing area. Ground water is the dominant pathway into and out of the lake and the water-residence time for the lake is about 5 years. The contributing area excludes nearby potential sources of nutrients from the Concord Municipal landfill and a trailer park. At present, nitrogen from the Reservation septic leach field enters Walden Pond, but phosphorus is removed during transport. The net effect increases the nitrogen:phosphorus ratio of inputs, a circumstance unfavorable to growth of nuisance cyanobacteria. Walden Pond has become more eutrophic during the past 60 years, and loses deep-water dissolved oxygen. Historical and interlake comparisons of plant production indicate that the trophic level of Walden Pond could be decreased (dissolved oxygen increased) if phosphorus input were decreased, possibly through a swimmer-education program. Results of this program likely would increase the stability of the deep-growing macro alga Nitella, which helps maintain water quality by tying up nutrients in deep plant biomass, generating metalimnetic dissolved oxygen at the onset of stratification, and maintaining high metalimnetic dissolved-oxygen concentrations during stratification. REFERENCES CITED Baystate Environmental, Inc., 1995, Study of trophic level conditions of Walden Pond, Concord, Massachusetts: Massachusetts Department of Environmental Management, Division of Resource Conservation, 111 p. Colman, J.A., and Friesz, P.J., (2001), Geohydrology and limnology of Walden Pond, Concord, Massachusetts, U.S. Geological Survey Water-Resources Investigation Report 01-4137, 68 p. Colman, J.A., and Waldron, M.C., 1998, Walden Pond, Massachusetts—Environmental setting and current investigations: U.S. Geological Survey Fact Sheet, FS-064-98, 6 p. Deevey, E.S., Jr., 1942, A re-examination of Thoreau's Walden: The Quarterly Review of Biology, v. 17, no. 1, p. 1–11. Dincer, T., 1968, The use of oxygen 18 and deuterium concentrations in the water balance of lakes: Water Resources Research, v. 4, no. 6, p. 1289–1306. Farnsworth, R.K., Thompson, E.S., and Peck, E.L., 1982, Evaporation atlas for the contiguous 48 United States: U.S. Department of Commerce, National Oceanic and Atmospheric Administration, Technical Report NWS 33, 26 p., 4 pls. Gat, J.R., 1980, The isotopes of hydrogen and oxygen in precipitation, in Fritz, P., and Fontes, J.Ch., eds., Handbook of environmental isotope geochemistry, vol. 1, The terrestrial environment, A: New York, Elsevier, p. 21–47. Jacobs Engineering, 2000, Ashumet Pond Trophic Health Technical Memorandum, Volume 1: Massachusetts Military Reservation, AFC- J23-35S18402-M17-0005, variable pagination. Koteff, C., 1963, Glacial lakes near Concord, Massachusetts: Article 96 in U.S. Geological Survey Professional Paper 475-C, p. C142–C144. Krabbenhoft, D.P., Bowser, C.J., Anderson, M.P., and Valley, J.W., 1990, Estimating groundwater exchange with lakes 1. The stable isotope mass balance method: Water Resources Research, v. 26, no. 10, p. 2445–2453. Levine, S.N., and Schindler, D.W., 1999, Influence of nitrogen to phosphorus supply ratios and physicochemical conditions on cyanobacteria and phytoplankton species composition in the Experimental Lakes Area, Canada: Canadian Journal of Fisheries and Aquatic Sciences, v. 56, p. 451–466. Nygaard, G., and Sand-Jensen, K., 1981, Light climate and metabolism of Nitella flexilis (L.) Ag. in the bottom water of oligotrophic Lake Grane Langso, Denmark: Int. Revue Gesamt. Hydrobiol., v. 66, p. 685-699. Portnoy, J.W., Winkler, M.G., Sanford, P.R., Farris, C.N., 2001, Kettle pond data atlas: paleoecology and modern water chemistry: Cape Cod National Seashore, National Park Service, U.S. Department of Interior, 119 p. Randall, A.D., 1996, Mean annual runoff, precipitation, and evapotranspiration in the glaciated Northwestern United States, 1951–80: U.S. Geological Survey Open-File Report 96-395, 2 sheets. Redfield, A.C., Ketchum, B.H., and Richards, F.A., 1963, The influence of organisms on the composition of seawater, in Hill, M.N., ed., The Sea: New York, Wiley Interscience, v. 2, p. 26–77. Thoreau, H.D., 1854, Walden; or life in the woods, in Bode, Carl, ed., The Portable Thoreau: New York, The Viking Press, 1964, p. 258–591. Vollenweider, R.A., 1975, Input-output models with special references to the phosphorus loading concept in limnology: Schweizerische Zeitschrift Fuer Hydrologie, v. 37, p. 53–62. Walker, E.H., 1971, Walden's way revealed: Man and Nature, December 1971, p. 11–20. Walker, W.W., 1988, White Pond water quality studies: Concord, Massachusetts, White Pond Advisory Committee, 28 p. CONTOUR INTERVAL 10 FEET NATIONAL GEODETIC VERTICAL DATUM OF 1929 1000 1500 500 500 METERS 0 2000 FEET 0 100 200 300 400 1,000 FEET 0 300 METERS 0 Figure 2. Walden Pond and fine-grained bottom sediments extend to the till and bedrock surface in deep areas. Stratified glacial deposits surround the lake. Water enters the lake from precipitation on the lake surface and from ground water. Water leaves the lake from evaporation and lake-water seepage. (Line of section shown in fig. 3.) ? ? Till 0 50 100 150 200 ALTITUDE, IN FEET ABOVE SEA LEVEL VERTICAL EXAGGERATION X 10 300 CTW214 WALDEN POND Fine-grained bottom sediments Bedrock Water table Lake-water seepage 250 A A’ EXPLANATION CONTACT LINE Dashed where inferred Evaporation Precipitation Recharge Ground-water inflow Stratified glacial deposits Figure 4. Measurements of water levels in well CTW165 (A) and Walden Pond (B) show the annual cycle of water-level declines and rises. Long-term trends in water levels reflect trends in annual precipitation (C). (Lake water levels in 1956 and from1959 to 1971 were collected by Walden Pond State Reservation staff (Walker, 1971); precipitation data are from the National Oceanic and Atmospheric Administration.) WATER LEVEL IN WELL CTW165 MEAN GROUND-WATER ALTITUDE FOR YEARS 1965-99 MEASUREMENT ON JULY 19, 1999 WALDEN POND STAGE MEASUREMENT IN JUNE, 1956 MEASUREMENT ON JULY 19, 1999 GROUND-WATER LEVEL, IN FEET ABOVE SEA LEVEL WALDEN POND STAGE, IN FEET ABOVE SEA LEVEL 4A 4B 150 164 152 154 156 158 160 162 150 164 152 154 156 158 160 162 ANNUAL PRECIPITATION, IN INCHES No data PRECIPITATION AVERAGE FOR YEARS 1960-99 4C 1954 1956 1958 1960 1962 1964 1966 1968 1970 1972 1974 1976 1978 1980 1982 1984 1986 1988 1990 1992 1994 1996 1998 25 65 35 45 55 -12 -2 -11 -10 -9 -8 -7 -6 -5 -4 -3 DELTA OXYGEN-18, IN PER MIL DELTA DEUTERIUM, IN PER MIL Local meteoric water line Evaporation line PRECIPITATION ( Atmospheric Deposition Station ) GROUND-WATER INFLOW ( wells LVW30, LVW33, and CTW203 ) LAKE WATER ( lake surface over the east end deep area ) June 1998 to September 1999 Figure 5. The isotopic composition of precipitation varied on the basis of atmospheric temperature and defined a local meteoric water line (LMWL). The isotopic composition of ground water clustered at the low end of the LMWL and reflected the cold temperature when ground water was recharged. The isotopic composition of lake water plotted to the right of the LMWL, and defined an evaporation line. -80 -20 -70 -60 -50 -40 -30 Table 1. Nutrient budget for Walden Pond [Ground water, septic leach-field plume, and atmospheric sources measured directly; swimmer source estimated; other sources modified from Baystate Environmental Inc. (1995); kg/yr, kilograms per year; N, nitrogen; P, phosphorus; kg/3 mo, kilograms per months] Source Annual Summer Nitrogen Phosphorus Nitrogen Phosphorus Load (kg/yr) Percentage of total load Load (kg/yr) Percent- age of total load N:P ratio (atomic) Load (kg/3 mo) Percent- age of sum load Load (kg/3 mo) Percent- age of sum load N:P ratio (atomic) Background ground water 66 7.7 5.5 17 27 16 4 1.4 9 27 Plume ground water 260 30 -- -- -- 65 15 -- -- -- Atmospheric wet 152 18 .8 3 412 38 9 .2 1 412 Atmospheric dry 75 8.7 15 47 11 19 4 3.8 23 11 Swimmers 290 34 8.7 27 74 290 67 8.7 54 74 Waterfowl 4 .5 .6 2 15 1 0 .6 4 4 Fish stocking 6 .7 .7 2 19 2 0 .7 4 5 Direct runoff 6 .7 .8 2 16 1 0 .8 5 4 Total 858 100 32 100 59 432 100 16 100 59 160 180 200 200 180 WALDEN POND 0.32—0.47 5—36 0.05—12 2.5—14 <0.05—0.5 (deep) (deep) 26—38 13—45 0.14 0.05 0.18 6.7 1.9 <0.05 2.5 0.39 3.1-4.9 0.01 0.16 0.06 0.57 0.16 0.01-0.05 0.11 0.16 <0.05 <0.05 <0.05 0.20 0.46 Septic system 158.5 158.5 159.5 159 160 159.5 159 Figure 7. Nitrate concentrations in samples from observation wells near the Walden Pond State Reservation septic leach field and at temporary drive-point wells on the shore of Walden Pond. Estimated areal extent of the nitrate plume boundary is based on water-quality data and computations on ground-water flow. N Estimated areal extent of plume CTW204 CTW218 CTW217 CTW214 CTW244 CTW216 CTW205 LVW30 CTW203 CTW206 CTW227 CTW213 Route 126 0 0 500 FEET 150 METERS LINCOLN CONCORD <0.05 158.5 159 EXPLANATION CTW218 WATER TABLE—Shows altitude of water table, July 19,1999. Dashed where inferred. Datum is sea level WATER TABLE—Half-foot contour line. Dashed where inferred. Datum is sea level MONITORING WELL — Alphanumeric code is local identifier TEMPORARY WELL NITRATE CONCENTRATION—Bar height is proportional to nitrate concentration NITRATE CONCENTRATION—Number indicates nitrate concentration, in milligrams nitrogen per liter; <, less than BUILDINGS AND ROADS
-
Upload
nguyenkiet -
Category
Documents
-
view
213 -
download
0
Transcript of Hydrology and Trophic Ecology of Walden Pond, Concord ... · PDF fileU.S. DEPARTMENT OF THE...
U.S. DEPARTMENT OF THE INTERIORU.S. GEOLOGICAL SURVEY
WATER-RESOURCES INVESTIGATIONS REPORT 01-4153Paul J. Friesz and John A. Colman
Hydrology and Trophic Ecology of Walden Pond,Concord, Massachusetts
Prepared in Cooperation with theMASSACHUSETTS DEPARTMENT OF ENVIRONMENTAL MANAGEMENT
Hydrology and Trophic Ecology of Walden Pond, Concord, MassachusettsBy
Paul J. Friesz and John A. Colman2001
Walden Pond State Reservation Boundary
Walden P
ond State R
eservation Boundary
Pine
Hill
Concord Carlisle
High School
Trailer
Park
Route 2
Route 126
Route
126
145146147148149150151152153
156157158
154
155
158
157
156 159158.5
159.5
158
158
158.5
159
159.
5
157
156
155
154
153
158.
5
159.
5159
160
159.5
LINCOLN
CONCORD
LINCOLN
CONCORD
A’
A
Little GoosePond
Goose
Pond
Boat Ramp
Heywoods
Meadow
Thoreauhomesite
WymanMeadow
ThoreauInstitute
Androm
eda
Ponds
Fairhaven
Bay
Route 2
160
180
200
220
160
180
200
220
260
240
160
180
200
220
240
160180
160180
160
180
180
160
160
180
140
120
140
160
180
120
140160
180
200
220
240
260280
300
320
200
160
180
200
180
180
200180
200
200
200
200
180
140160
180
140
120
18020
0
200
200
200
200
200
200 200
200
200
220
240
180
180
220
240
260
280
300
320
340
200
200
180
180 200 220 240
160
160
160
180
200
280
180
200
220
240
260
280
300
320
340
360
220
220 220
220
200
200
200
220
200
180
200
180
220
220
200
200
180
200
180
200
180
200
200
180
180
180
180
20
0
180180
180
180
200
200
200
200
200
200
200200
200
180
200
180
180
180
180
34
0Fairhaven
Hill
Emersons
Cliff
10
20
304050
40
50
60
50100
90
80
6070
5040
30
10
40
3055
35
3020
10
2010
20
30
40
50
6070
80
90
60
4050
55
60
65
DEEPESTSOUNDING
100.1 ft.
159.26
159.24158.12
158.75
158.39158.18
159.64
158.43
158.63
159.39
NA159.19
159.45
159.10
158.27158.64
159.39
159.35
159.37
157.23
152.39
155.44
158.70
153.75
159.38
159.38
159.40
159.38
158.74
155.65
151.75
158.14
158.25
157.46
155.24
158.20
158.45
158.41
157.92
154.11
155.18
159.42
156.07
158.37
155.68
144.30
158.37
158.93
159.80
159.53
Reservation Septic Leach Field
CTW204CTW218
CTW217
CTW213
CTW203
CTW244
CTW216
CTW205
LVW30
CTW206
CTW207
CTW208
CTW227
CTW214
CTW238
CTW239
CTW240
CTW241
LVW33
LVW31
CTW232
CTW231
CTW230
CTW224
CTW222
CTW221
CTW223
CTW225
CTW212
CTW211
CTW165
CTW233
CTW234
CTW235
CTW236
CTW237
CTW210
CTW226
CTW209
CTW242
CTW243
CTW220
AtmosphericDepositionStation
Concord Municipal Landfill
910,500
910,000
909,500
909,000
908,500
213,500 214,000213,000212,500212,000
910,500
910,000
909,500
909,000
908,500
213,500 214,000213,000212,500212,000
W A L D E N P O N D
CTW234153.75
156.07
154
158.5
TILL AND BEDROCK—Unstippled area other than wetland orwater is stratified glacial deposits
BUILDING
ROADS
ZONE OF NITELLA GROWTH
LAND USE
Open water
Wetlands
Wooded swamps
Conservation
Conservation and recreation
Concord Municipal landfill
Other
CONTOURS
Water depth —In feet below water surface
Water table — Shows altitude of water table, July 19, 1999.Dashed where inferred. Datum is sea level
Water table — Half-foot contour line; Dashed whereinferred. Datum is sea level
BOUNDARIES
Walden Pond ground-water contributing area
Goose Pond ground-water contributing area
Walden Pond State Reservation Boundary
GEOLOGIC SECTION
MONITORING WELL —Alphanumeric code is U.S.Geological Survey well number. Number indicates altitudeof water table in feet above sea level
SURFACE-WATER SITE—Number indicates altitude of pond surface in feet above sea level
GENERAL DIRECTION OF GROUND-WATER FLOW
EXPLANATION
A’A
60
Base map created by using TERRAMODEL and Mass GIS DTMs, 1999, Coordinates shown as 500 meter grid,Massachusetts State Plane Projection,1983 North American Datum; 1:5,000 Executive Office of Environmental Affairs (EOEA);Protected and Recreational Open Space data from MassGIS, 1989, Massachusetts State Plane Projection, 1983 North American Datum; 1:24,000 EOEA; Surficial Geology data from USGS,1964, Massachusetts State Plane Projection, 1983 North American Datum; 1:24,000 USGS;Building Footprints and Roads data from towns of Concord and Lincoln, 1999 State Plane Feet, Zone 5176, 1983 North American Datum; 1:5,000
Figure 3. Walden Pond is a kettle-hole, flow-through lake. Ground water discharges into Walden Pond along its eastern perimeterand lake water discharges into the aquifer along its western perimeter. The area contributing ground water was delineated on the basis ofthe configuration of the water table, surficial geology, and surface topography. The bathymetric map reveals three deep areas.
INTRODUCTIONWalden Pond, the deepest lake in Massachusetts, has great
historical, naturalistic, and limnological significance as the subject of Henry David Thoreau's well-known essay "Walden: or, Life in the Woods" (Thoreau, 1854). Only 15 miles (mi) northwest of Boston, Mass. (fig. 1), Walden Pond potentially is threatened by environmental stresses common to urban lakes: a municipal landfill, septic leachate, high visitor-use rates, acid and other contaminants from atmospheric deposition, and invasion of exotic species. Walden Pond retains clear, undegraded water because of conservation efforts that protect the shore and woods surrounding the lake. Questions remain, however, regarding the extent of ecological changes that may already have occurred and the degree to which conservation efforts will preserve water quality in the future. Hydrologic and limnologic results from a cooperative investigation of Walden Pond between the U.S. Geological Survey and the Massachusetts Department of Environmental Management are summarized in this plate report, which shows Walden Pond in relation to the ground-water system and land use. Details of the investigation from data collected from 1997 to 1999 (Colman and Friesz, 2001) and basic information about limnology and Walden Pond (Colman and Waldron, 1998) also are available.
Figure 6. The average annual water balance for Walden Pond shows that ground water is the dominant pathway into and out of the lake.
PRECIPITATION
(45%)
GROUND-
WATER
INFLOW
(55%)EVAPOR-
ATION
(26%)
GROUND-
WATER
OUTFLOW
(74%)
Figure13. Walden Pond swimming beach.
Figure 12. Comparison of dissolved-oxygen profiles for kettle-hole seepage lakes in eastern Massachusetts during summer stratification; the profiles show a range of oxygenation in the metalimnion. (Gull Pond data are from Portnoy and others, (2001); White Pond data are from Walker (1988); Ashumet Pond data are from Jacobs Engineering, Inc. (2000)).
Gull Pond 08/04/99
Walden Pond 07/29/99
Ashumet Pond 08/09/99
White Pond 08/03/88
100
90
80
70
60
50
40
30
20
10
0
0 2 4 6 8 10 12 14 16
DE
PT
H, I
N F
EE
T
DISSOLVED OXYGEN, IN MILLIGRAMS PER LITER
MAR. APR. MAY JUNE JULY AUG. SEPT. OCT. NOV.
9,000
8,000
7,000
6,000
5,000
4,000
3,000
2,000
1,000
0
MONTH/DAY
B
A
19991992
1997
1996
20001994
1939
1998
Figure 11. Dissolved oxygen (DO) content of the hypolimnion of Walden Pond, which decreases from April through lake turnover in late fall. The slope of the plot versus time represents the hypolimnetic oxygen deficit. The historical August 1939 data of Deevey (1942) define a lower deficit rate (line A-B) than that calculated from recent data. (1992 data are from Massachusetts Department of Environmental Management, written commun. (1994); 1994 data are from Baystate Environmental, Inc. (1995); and 1996 data are from this investigation.)
0
0 2 4 6 8 10 12 14 16
DE
PT
H, I
N F
EE
T
OXYGEN CONCENTRATION, IN MILLIGRAMS PER LITER
OX
YG
EN
, IN
MIL
LIG
RA
MS
PE
R L
ITE
R
3/20/984/23/98
9/23/98
8/4/98
6/9/98
11/18/98
0
2
4
6
8
10
12
14
16
100
90
80
70
60
50
40
30
20
10
0
3/1/
97
5/1/
97
7/1/
97
9/1/
97
11/1
/97
1/1/
98
3/1/
98
5/1/
98
7/1/
98
9/1/
98
11/1
/98
1/1/
99
3/1/
99
5/1/
99
7/1/
99
9/1/
99
DE
PT
H, I
N F
EE
T
DATE
100
90
80
70
60
50
40
30
20
10
Met
alim
nion
Epi
limni
onH
ypol
imni
on
A.
B.Figure 10A. Distribution of dissolved oxygen in Walden Pond, 1997—99 showing spring increases and summer constant conditions in the metalimnion and summer and fall decreases in the hypolimnion. A uniform dissolved oxygen profile is restored when the lake mixes. Lines of white dots represent locations of sampling points. B. Selected dissolved-oxygen depth profiles for 1998.
Figure 9. Distribution of temperature in Walden Pond, 1997—99, indicating thermal stratification during the summer and fall, and mixed conditions during winter and early spring. The temperature data were collected as vertical profiles, shown as lines of white
Met
alim
nion
Epi
limni
onH
ypol
imni
on
0
5
10
15
20
25
30
TE
MP
ER
AT
UR
E, I
N D
EG
RE
ES
CE
LSIU
S
100
90
80
70
60
50
40
30
20
10
0
DATE
STRATIFIED MIXED STRATIFIED MIXED STRATIFIED
3/1/
97
5/1/
97
7/1/
97
9/1/
97
11/1
/97
1/1/
98
3/1/
98
5/1/
98
7/1/
98
9/1/
98
11/1
/98
1/1/
99
3/1/
99
5/1/
99
7/1/
99
9/1/
99
DE
PT
H, I
N F
EE
T
Figure 8. The macroalga Nitella grows on the bed sediment in Walden Pond at depths between 20 and 42 feet. The Nitella biomass ties up nutrients and generates oxygen deep in Walden Pond.
Figure 1. Location and hydrologic setting of Walden Pond, Concord, Massachusetts.
216,000214,000212,000
914,000
912,000
910,000
908,000
L I N C O L N
C O N C O R D
SandyPond
Goose Pond
FairylandPond
Brook
Sudbur
yRi
ver
Concord Ri ver
Mill
Assabet River
Fairhaven Bay
WaldenPond
Little GoosePond
B E D F O R D
Basemap from MassGIS digital data, State Plane Meters, Fipszone 2001,1:25,000 scale
0 1/2 1 MILE
0 1 KILOMETER.5
EXPLANATION
WETLANDS
OPEN WATER
300,000
200,000100,000
900,000
800,000
Boston
0
MASSACHUSETTS
0
50 KILOMETERS
50 MILES
Area shown as figure 3
,GW i =P (δL δP)– E (δE δL)–+
δGWi δL–
∆S = P + GWi – E – GWo ,
KG
DO
, IN
HY
PO
LIM
NIO
N B
ELO
W 4
8 F
EE
T
HYDROLOGYWalden Pond and the underlying and surrounding
aquifer are bordered by the Sudbury and Concord Rivers (fig. 1). Walden Pond, a kettle-hole lake with no surface water inlet or outlet, formed at the end of the last glaciation about 15,000 years ago by the melting of a large block of ice that broke off into glacial Lake Sudbury from the retreating glacier. The ice block eventually was surrounded by sorted, stratified sediments ranging mainly from fine sand to coarse gravel deposited by glacial meltwater (fig. 2), (Koteff, 1963). Seismic reflection and fathometer data indicate that the lake and its associated fine-grained bottom sediments extend to the till and bedrock surface in the deepest areas. Three deep areas are defined in the lake (fig. 3); the middle deep area was unmapped before this investigation. The maximum measured depth of 100.1 feet (ft) was within2 ft of that measured by Thoreau in the winter of 1846.
Knowledge of the water balance and the land-surfacearea contributing water to Walden Pond is needed to understand the hydrology of the lake and to derive anutrient budget for the lake. Sources of water to Walden Pond include precipitation on the lake surface and ground water (fig. 2). Water from precipitation infiltrates the permeable surficial deposits, recharges the aquifer, then flows in the direction of decreasing water levels. Thus, ground-water flow does not necessarily follow land surface topography. Along steep shoreline areas sloping towards Walden Pond, small quantities of overland flow may occur after intense precipitation events, thereby adding small amounts of water to the lake. Water leaves Walden Pond by evaporation fromthe lake surface and from lake-water seepage to theaquifer (fig. 2).
Ground-Water Contributing AreaWater-table contours, surficial geology, and
topography were used to delineate the area contributing ground water to Walden Pond (fig. 3). The altitude and configuration of the water table in areas of stratified glacial deposits surrounding Walden Pond were determined from water levels measured in 40 monitoring wells and 8 ponds on July 19, 1999. The direction of ground-water flow, shown by arrows on figure 3, is perpendicular to the water-table contours. In areas of bedrock highs, such as Emersons Cliff and Pine Hill, ground water flows downslope through the overlying saturated till in the direction of declining land-surface altitude because the bedrock surface is relatively impermeable. The water-table map shows that Walden Pond is a flow-through lake: ground water flows into the lake along its eastern perimeter, and lake water flowsout to the aquifer along its western perimeter. The contributing area also includes Goose Pond, also a flow-through pond, and its contributing area. Some of the water that enters Goose Pond, from ground-water inflow from the Pine Hill area and from precipitation that falls directly on Goose Pond, flows west out of Goose Pond into the aquifer and towards Walden Pond.
The Walden Pond contributing area of 0.24 square miles (mi2) is contained mainly within the Walden Pond State Reservation boundary and other conservation land, except for that area that also is part of Goose Pond and its contributing area (fig. 3). The Reservation septic leach field and the septic leach fields from residences on privately owned land in the contributing area east of Walden Pond are potential sources of nutrients to the lake. Ground water in the Reservation leach field area flows westward toward the eastern shore of Walden Pond. Leach fields from private residences are in areas where ground water flows directly toward Walden Pond or indirectly by first flowing into Goose Pond. Ground water in the southeastern part of the contributing area generally flows northwest from the till-covered bedrock highs, Emersons Cliff and Pine Hill. Most of the ground water from these till-covered areas most likely enters the stratified glacial deposits before discharging to Walden Pond. Northeast of Walden Pond, the Concord Municipal landfill and a trailer park are on the north side of a ground-water divide; ground water north of this divide flows generally in the northward direction away from Walden Pond.
Lake-derived ground water flows towards and discharges into the Sudbury and Concord Rivers or to wetlands and streams draining into these rivers. The steep water-table gradient southwest of Walden Pond is caused by large water-level differences between Walden Pond and discharging areas—Heywoods Meadow and the Andromeda Ponds.
Water-Level FluctuationsWater levels in Walden Pond and the surrounding
aquifer fluctuate because of seasonal and long-term variations in recharge from precipitation. A hydrograph from a nearby USGS long-term observation well(fig. 4A) indicates water levels rise, in general, from winter through early summer when recharge to the aquifer exceeds ground-water discharge; water is avail-able to recharge the aquifer when precipitation exceeds evapotranspiration. From summer through winter, water levels decline because ground-water discharge exceeds recharge. The annual cycle of water-level rises and declines lags climatic conditions because of the transit time for precipitation to recharge the water table through the unsaturated zone and because of storage within the aquifer. Lake-water levels (fig. 4B) indicate a similar seasonal pattern as the ground-water levels because the lake is hydraulically connected to the surrounding aquifer. The magnitude of fluctuations in the lake is less than in the aquifer, however, because the lake has proportionally greater storage capacity than the aquifer.
Long-term variations in water levels reflect long-term storage changes in the aquifer and lake. Water levels fluctuated over a range of about 11.5 ft from 1956 to 1999. The lowest water level was measured in early 1967 after 4 successive years of below-average precipitation (fig. 4C) resulted in a cumulative precipitation deficiency of about 46 inches (in.). Two periods of high water-level altitudes occurred in 1956 and 1984 following periods of above-average precipitation. In the eastern half of Massachusetts, ground-water levels and streamflows generally were below normal from autumn 1998 to late summer 1999. Water levels in Walden Pond and the surrounding aquifer during this study, however, were at or above-average levels because of the large quantity of water in storage and because of the low outflow rates from the lake and aquifer.
Water BalanceThe water balance for Walden Pond
without surface inflows or outflows can be expressed as
(1),
where ∆S is change in lake-volume storage; P is precipitation that falls directly on the lake surface; GWi is ground-water inflow; E is evaporation from the lake surface; and GWo is lake-water seepage to the aquifer (ground-water outflow). The water balance for Walden Pond was based on average annual conditions during the 5-year period, 1995–99. Water-balance calculations based on this time period indicate that the water-residence time of the lake is approximately 5 years; therefore, inflows and outflows to Walden Pond should reflect climatic conditions during this period. Ground-water outflow was calculated indirectly as a residual of the water-balance equation. There was no change in long-term lake storage over the 1995–99 period based on the ground-water hydrograph (fig. 4A). Average precipitation from 1995–99 was47.82 in/yr, which is 2.50 in. above the 40-year average (fig. 4C). Average evaporation of 28 in/yr from the lake surface was estimated by using regionalized pan evaporation and pan coefficient measurements (Farnsworth and others, 1982). The ground-water inflow rate to Walden Pond was determined by contributing-area and isotope mass-balance approaches.
The contributing-area approach requires knowledge of the recharge rate and the size of the area where ground water flows directly to Walden Pond. In addition, the quantity of water entering the aquifer from Goose Pond and flowing as ground water to Walden Pond must be considered. An average recharge rate of 26.8 in. was based on regional estimates of Randall (1996) and adjusted to account for the increased average precipitation during the 1995–99 period. The ground-water contribution to Walden Pond from Goose Pond was estimated to be 20 percent of the average annual ground-water outflow because about 20 percent of the outflow perimeter of Goose Pond lies within the contributing area of Walden Pond. No upgradient ground water was assumed to flow beneath or by-pass Walden Pond because deep areas of the lake extend to the till and bedrock surface. The total average annual ground-water inflow to Walden Pond equals53 inches per year (in/yr) (expressed as depth of water over the lake surface). The estimated contribution from Goose Pond is 6 percent of this total inflow from ground water.
The isotope mass-balance approach uses the stable isotopes of oxygen (δ18O) and hydrogen (δD) that naturally occur in water. Flows into and out of a lake and the lake water itself can have different isotopic signatures. These isotopic differences along with precipitation and evaporation rates can be used to determine ground-water inflow to a lake (Krabbenhoft and others, 1990)
(2),
where GWi, P, and E have been defined previously andδL, δP, δE, and δGWi
are the isotopic composition of thelake, precipitation, evaporation, and ground-water inflow, respectively. Average isotope values from water samples collected from July 1998 to June 1999 represented the average isotopic values during 1995–99, except for the isotopic composition of evaporated water, which was calculated indirectly.
The isotopic compositions of precipitation, ground-water inflow, and lake water are plotted in figure 5.The isotopic composition of precipitation primarilyvaries because of changes in atmospheric temperature(Gat, 1980); the precipitation samples define a local meteoric water line (LMWL). The isotopic composition of ground water varied little spatially and temporally. The isotopic composition of ground water has lower δ18O and δD values compared to the average annual isotopic composition of precipitation because precipitation recharges the aquifer from autumn to spring when atmospheric temperature is low. The isotopic composition of lake water also varied little seasonally, which is typical of deep surface-water bodies with relatively long water-residence times (Dincer, 1968). The lake isotopic values plot to the right of the LMWL because evaporation causes an increased enrichment of δ18O relative to δD in the lake water. Ground-water inflow calculated with equation 2 results in 68 in/yr for δ18O and 57 in/yr for δD, which
compare favorably to the estimate based on the contributing-area approach. A ground-water inflow value of 58 in/yr, based on the average of the δ18O and δD results (62 in/yr) and the contributing-area result (53 in/yr), was used in the water-balance analysis.
A summary of the water balance for Walden Pond for the 5-year period 1995–99 is shown in figure 6 partitioned on the basis of the magnitude of inflow and outflow components. Average inflow from precipitation and ground water totalled about 106 in. Precipitation on the lake surface accounted for 45 percent of the inflow, whereas ground water contributed 55 percent of the inflow. The proportion of inflows anchors the evaporation line for Walden Pond on figure 5, which extends from the average of the average isotopic compositions of precipitation and ground-water inflow through the lake samples. This evaporation line defines the isotopic evolution of lake water from its source waters (Krabbenhoft and others, 1990). Ground-water outflow(74 percent), is significantly greater than evaporation(26 percent). Results indicate that ground water is the dominant pathway into and out of the lake and that thewater-residence time for the lake is 4.8 years.
TROPHIC ECOLOGYThe primary public environmental issue for Walden Pond
concerns its trophic ecology—whether urban development or high visitor attendance may have altered or will alter the relation between plant-nutrient supplies and aquatic-plant growth. Nutrient supplies, especially of growth-limiting nitrogen and phosphorus, are key water-quality features of kettle-lake investigations because plant growth affects water clarity, determines the type and quantity of lake biomass production, affects the amount of summer dissolved oxygen present in the deep water, and may even affect other ecological problems, such as invasion of exotic species or cycling of bioconcentrating pollutants like polychlorinated biphenyls (PCBs) and mercury. Nutrient supply, in turn, depends on geohydrology—sources, amounts, and cycling of water and chemical constituents carried by the water.
Sources and Amounts ofPlant-Nutrient Inputs
Phosphorus and nitrogen can enter Walden Pond carried by ground water, through direct dry or wet deposition from the atmosphere, from birds roosting on the lake, fromparking-lot or road runoff, by fish stocking, and from swimmers. Estimated annual nutrient loads indicated that
inputs were dominated by three sources; ground water(septic leach field plume for nitrogen and ambient ground water for phosphorus), atmospheric deposition, and human swimmers (table 1).
Computations for ground-water nutrient inputs were div-ided according to background and point-source contribu-
tions. Background nitrogen and phosphorus loads weredetermined as the product of ground-water discharge to Walden Pond and average ground-water concentrations. A ground-water plume containing nitrogen was detected in drive-point wells along the northeast shore of Walden Pond and in observa-tion wells immediately downgradient from the Reservation
leach field, the only substantial point source within the ground-water contributing area (fig. 7). Nitrogen load for the plume was computed from the product of water use, an unsaturated-zone loss factor, and nitrogen concentration in the septic tank. In contrast to nitrogen, the average concentration of phospho-rus in the plume was not greater than that in background ground water. Phosphorus had been retained in the 40-ftunsaturated zone beneath the leach field and was not included in plume load. Seventeen residences on septic leach fields were in the contributing area (fig. 3). Ground-water flow direction indicated that transport from 15 residences was toward Goose Pond. These residences contribute nutrients minimally toWalden Pond, only as mediated after loss to the sediments in Goose Pond. Although nitrogen from the leach field of two res-idences would enter Walden Pond directly, movement of phos-phorus is unlikely because of the thick unsaturated zone and long distance to the lake at their respective locations.
Atmospheric inputs were measured separately for wet and dry deposition (collector location on fig. 3). A substantial phos-phorus load associated with pollen fall was measured. Swim-mer inputs were estimated from known average composition of urine and assumptions about the percentage of summer Reser-vation visitors that are swimmers (90 percent) and percentage of swimmers that urinate in Walden Pond (50 percent). Swim-
mers account for 34 percent of the annual nitrogen load and 27 percent of the annual phosphorus load. The percentages increase to 67 and 54, respectively (table 1), during the sum-mer.
The growth-limiting nutrient for Walden Pond can be determined by comparison of the nitrogen-to-phosphorus ratio for different inputs to the average atom-to-atom ratio required by algae (15:1; (Redfield and others, 1963). The overall nitrogen:phosphorus ratio in nutrient inputs of 59, which was similar to the ratio in water-column measure-ments, indicated that nitrogen was in excess and phosphorus input would control the amount of plant growth. Nutrient sources in which nitrogen is substantially in excess of the Redfield ratio may mitigate blooms of cyanobacteria, which have the capability to fix nitrogen from the atmosphere. A selective advantage of cyanobacteria over algae, which can not fix atmospheric nitrogen, is removed when nitrogen is in excess supply (Levine and Schindler, 1999). Cyanobacteria blooms often form nuisance surface scums on lakes and even may develop toxins; a high nitrogen to phosphorus ratio and sources that contribute to it, such as the leach-field plume, may help prevent cyanobacteria blooms.
Three lake terms used to indicate progressively greater nutrient supply and consequent plant growth are oligotro-
phic, mesotrophic and eutrophic. Based on phosphorusloading, Walden Pond at 0.13 g P/m2/yr is approaching a eutrophic state between “permissible and critical phosphorus loads,” 0.084 and 0.17 g/m2/yr, respectively (Vollenweider (1975), that apply to a lake with mean depth (42.4 ft) andhydraulic residence time (4.8 yr) of Walden Pond.
Plant-Growth Measurementand Dissolved Oxygen
Whereas nutrient budgets indicate relative importance of nutrient sources, direct measures of lake trophic state such as changes in standing crops of plants or changes in dissolved oxygen or carbon dioxide, associated with photosynthesis and respiration, indicate how inputs are processed into plant growth in a given lake. Phytoplankton biomass, determined by chlorophyll measurements, amounted to 285 kg on a dry-weight basis for Walden Pond. In addition, large stands of the deep-growing macroalga Nitella grow on the bed-sediment surface between depths of 20 and 42 ft (figs. 3 and 8). Nitella biomass determined from weight of dried samples and percent area covered was about 5,000 kg, or more than 17 times greater than the phytoplankton biomass. Nitella presence in lakes has been associated with clear-water conditions and later absence of Nitella with more turbid, eutrophic conditions.
Large stands of Nitella have been hypothesized to intercept phosphorus that might recycle from the sediments before it gets mixed into the water column and, through oxygen generation, to reduce phosphorus recycled from the sediments (Nygaard and Sand-Jensen, 1981).
Lake distribution of dissolved oxygen, indicative of plant growth and a determinant in internal cycling of nutrientsin lakes, is a consequence of the balance among photo-synthesis, respiration, and exchange with the atmosphere, as mediated during summer by thermal stratification. Vertical zonation based on thermal stratification results in temperate-zone lakes during the summer. The zones in order of increasing depth are the epilimnion (in Walden Pond 0 to20 ft), the metalimnion (20 to 46 ft), and the hypolimnion(46 to 100 ft) (fig. 9). Restricted vertical mixing that results from thermal stratification causes zone-specific (such as metalimnetic or hypolimnetic) chemical changes, including dissolved oxygen depletion, that accrue during the entire stratified period.
During cold weather every year, water mixing in Walden Pond moved dissolved oxygen from the atmosphere into the water column resulting, by early spring, in near-saturation by dissolved oxygen throughout (fig. 10 A and B). With spring warming, the deep water was cut off from the surface by
thermal stratification, and vertical transport of dissolved oxygen into or out of the metalimnion was negligible. Dissolved-oxygen concentrations measured during March and April increased in the metalimnion, indicative of substantial plant growth in this zone. After the increase, metalimnetic dissolved oxygen concentrations remained high and unchanged during the remaining six months of temperature stratification. Dissolved oxygen decreased in the hypolimnion, where respiration dominated after onset of stratification, mainly in response to decay of algal biomass, that settles from the sunlit upper zones. By late fall in Walden Pond, virtually all of the dissolved oxygen stored below the 46-ft depth has been consumed (black zones infig. 10A). In winter, wind and surface cooling break up stratification, and the cycle starts over.
The complete depletion of hypolimnetic dissolved
oxygen just before fall turnover likely increased the release of sediment phosphorus, which accumulates on the aerobic bed-sediment surfaces during the summer. Although cause and effect has not been established, these late stratification-period events preceded the only surface-scum-producing cyanobacteria blooms (of Anabaena) observed during the investigation, in late December of 1997 and 1998.
The rate of dissolved-oxygen depletion in the hypolimnion of Walden Pond can be measured by the hypolimnetic oxygen deficit (HOD). The HOD is represented by the rate of change in dissolved oxygen mass in the hypolimnion (slope of line in fig. 11). HOD is an integrative indicator for lake trophic state, because it depends on oxygen use during much of the time that the lake is stratified. Three years of biweekly dissolved
oxygen monitoring, 1997–99, and two profiles from 2000 indicated that the May through July HOD values nearly were identical (0.049, 0.050, 0.051, 0.048 mg O2/cm2/d, 1997 through 2000). These results indicate that baseline trophic-state conditions as measured by HOD are relatively stable at present.
Long-term change in HOD-trophic state can be estimated from the few historical dissolved-oxygen profiles available for Walden Pond, from 1939, 1992, 1994, and 1996 (fig.11). A projected depletion line for the 1939 datum indicates that dissolved oxygen in the 1939 hypolimnion may not have been depleted if turnover occurred at the same time as in the present. The more recent historical profiles—1992, 1994, 1996—indicates that depletion in those years generally was similar to the depletion data of 1997–2000.
The early profile suggests that HOD has doubled since 1939, which implies that historical inputs of nutrients were less than present inputs. Of the principal sources of growth-limiting phosphorus (table 1), only the swimmer source is subject to anthropogenic change. Although phosphorus input in pre-recreational Walden Pond may have been low, inputs may have been high in the more recent past. One thousand swimmers were observed at the 1939 sampling (Deevey, 1942); the Concord Herald newspaper reported on September 5, 1935, that summer Sunday afternoon crowds reached 25,000 at Walden Pond and that total summer attendance was 485,000. The relation between this apparent long-term nutrient supply increase and plant growth is not necessarily linear, and growth may lag behind supply. The effect of initial increases in phosphorus supply would be decreased because of phosphorus sequestration by mineral forms in the bed sediments followed by a larger fraction included in internal recycling as the sediment capacity for phosphorus became filled. To the extent that dissolved oxygen in the hypolimnion became depleted, sediment- sequestered phosphorus would be released from iron-mineral forms through reductive dissolution. The first occurrence of dissolved oxygen depletion at a given level in the hypolimnion may have been associated with a substantial hypolimnetic release of phosphorus, which had accumulated with iron over the ages. If HOD could be decreased to the level present in 1939 so that dissolved oxygen was not depleted in the final weeks before turnover, then annual accumulation of phosphorus in the upper hypolimnetic sediments might begin again. Because some dissolved oxygen remains in the upper hypolimnion until nearly the end of stratification, the decrease of phosphorus input necessary to sustain aerobic conditions may notbe too large.
Comparison of Walden Pond with other seepage kettle-hole lakes of eastern Massachusetts indicates the variability in dissolved oxygen regimes that can develop (fig. 12). Thickness of the oxygenated layer in these lakes is correlated inversely with nutrient inputs per area oflake surface.
Trophic StabilityWalden Pond may have become more eutrophic, but the
water still is clear and remains attractive to the public(fig. 13). Does the ecological health of Walden Pond require a decrease in nutrient input in an attempt to achieve more oligotrophic conditions? The answer depends on how stable the present condition is. The consequences of eutro-phication, fish kills and excessive cyanobacteria blooms, present in some eastern Massachusetts kettle-hole lakes, likely could be prevented in Walden Pond by continued maintenance of dissolved oxygen in the metalimnion. An oxygenated metalimnion decreases internal recycling of phosphorus and provides cold, oxygenated water necessary for trout. Currently (2000) , the high, constant con-centration of dissolved oxygen in the metalimnion is a prominent feature of stratification in Walden Pond.
The stability of metalimnetic dissolved-oxygen concentrations of Walden Pond likely involves the ecology of the macroalga Nitella, which grows only in the metalimnion but in amounts that dominate plant biomass in the entire lake. Although factors presently limiting growth and areal extent of Nitella in the Walden Pond metalimnion are not completely understood, it is known that some species of Nitella can not grow in eutrophic systems, which lack light penetration below the thermocline. Substantial eutrophication has occurred since the historical dissolved oxygen data collection in 1939. The principal anthropogenic perturbation causing eutrophication is the hypothesized swimmer input of nutrients. Because of the long recreational history at Walden Pond, increased nutrient input may have occurred over a period of more than 100 years. Although there is insufficient HOD data between 1939 and the present to conclude whether the present level of eutrophication has reached a new steady state, no obvious trend is evident in HOD determined in recent years—1992-2000. Stability would be enhanced by nutrient input decrease, which would benefit the deep-growing Nitella.
SUMMARY AND CONCLUSIONThe water quality of Walden Pond has been protected by
land conservation and bank-stabilization efforts, and the location of its ground-water contributing area. Ground water is the dominant pathway into and out of the lake and the water-residence time for the lake is about 5 years. The contributing area excludes nearby potential sources of nutrients from the Concord Municipal landfill and a trailer park. At present, nitrogen from the Reservation septic leach field enters Walden Pond, but phosphorus is removed during transport. The net effect increases the nitrogen:phosphorus ratio of inputs, a circumstance unfavorable to growth of nuisance cyanobacteria. Walden Pond has become more eutrophic during the past 60 years, and loses deep-water dissolved oxygen. Historical and interlake comparisons of plant production indicate that the trophic level of Walden Pond could be decreased (dissolved oxygen increased) if phosphorus input were decreased, possibly through a swimmer-education program. Results of this program likely would increase the stability of the deep-growing macro alga Nitella, which helps maintain water quality by tying up nutrients in deep plant biomass, generating metalimnetic dissolved oxygen at the onset of stratification, and maintaining high metalimnetic dissolved-oxygen concentrations during stratification.
REFERENCES CITEDBaystate Environmental, Inc., 1995, Study of trophic level conditions of
Walden Pond, Concord, Massachusetts: Massachusetts Department of Environmental Management, Division of Resource Conservation,111 p.
Colman, J.A., and Friesz, P.J., (2001), Geohydrology and limnology of Walden Pond, Concord, Massachusetts, U.S. Geological Survey Water-Resources Investigation Report 01-4137, 68 p.
Colman, J.A., and Waldron, M.C., 1998, Walden Pond, Massachusetts—Environmental setting and current investigations: U.S. Geological Survey Fact Sheet, FS-064-98, 6 p.
Deevey, E.S., Jr., 1942, A re-examination of Thoreau's Walden: The Quarterly Review of Biology, v. 17, no. 1, p. 1–11.
Dincer, T., 1968, The use of oxygen 18 and deuterium concentrations in the water balance of lakes: Water Resources Research, v. 4, no. 6,p. 1289–1306.
Farnsworth, R.K., Thompson, E.S., and Peck, E.L., 1982, Evaporation atlas for the contiguous 48 United States: U.S. Department of Commerce, National Oceanic and Atmospheric Administration, Technical Report NWS 33, 26 p., 4 pls.
Gat, J.R., 1980, The isotopes of hydrogen and oxygen in precipitation, in Fritz, P., and Fontes, J.Ch., eds., Handbook of environmental isotope geochemistry, vol. 1, The terrestrial environment, A: New York, Elsevier, p. 21–47.
Jacobs Engineering, 2000, Ashumet Pond Trophic Health Technical Memorandum, Volume 1: Massachusetts Military Reservation, AFC-J23-35S18402-M17-0005, variable pagination.
Koteff, C., 1963, Glacial lakes near Concord, Massachusetts: Article 96 in U.S. Geological Survey Professional Paper 475-C, p. C142–C144.
Krabbenhoft, D.P., Bowser, C.J., Anderson, M.P., and Valley, J.W., 1990, Estimating groundwater exchange with lakes 1. The stable isotope mass balance method: Water Resources Research, v. 26, no. 10,p. 2445–2453.
Levine, S.N., and Schindler, D.W., 1999, Influence of nitrogen to phosphorus supply ratios and physicochemical conditions on cyanobacteria and phytoplankton species composition in the Experimental Lakes Area, Canada: Canadian Journal of Fisheries and Aquatic Sciences, v. 56, p. 451–466.
Nygaard, G., and Sand-Jensen, K., 1981, Light climate and metabolism of Nitella flexilis (L.) Ag. in the bottom water of oligotrophic Lake Grane Langso, Denmark: Int. Revue Gesamt. Hydrobiol., v. 66,p. 685-699.
Portnoy, J.W., Winkler, M.G., Sanford, P.R., Farris, C.N., 2001, Kettle pond data atlas: paleoecology and modern water chemistry: Cape Cod National Seashore, National Park Service, U.S. Department of Interior, 119 p.
Randall, A.D., 1996, Mean annual runoff, precipitation, and evapotranspiration in the glaciated Northwestern United States, 1951–80: U.S. Geological Survey Open-File Report 96-395, 2 sheets.
Redfield, A.C., Ketchum, B.H., and Richards, F.A., 1963, The influence of organisms on the composition of seawater, in Hill, M.N., ed., The Sea: New York, Wiley Interscience, v. 2, p. 26–77.
Thoreau, H.D., 1854, Walden; or life in the woods, in Bode, Carl, ed., The Portable Thoreau: New York, The Viking Press, 1964,p. 258–591.
Vollenweider, R.A., 1975, Input-output models with special references to the phosphorus loading concept in limnology: Schweizerische Zeitschrift Fuer Hydrologie, v. 37, p. 53–62.
Walker, E.H., 1971, Walden's way revealed: Man and Nature,December 1971, p. 11–20.
Walker, W.W., 1988, White Pond water quality studies: Concord, Massachusetts, White Pond Advisory Committee, 28 p.
CONTOUR INTERVAL 10 FEET
NATIONAL GEODETIC VERTICAL DATUM OF 1929
1000 1500500
500 METERS
0 2000 FEET
0 100 200 300 400
1,000 FEET0
300 METERS0
Figure 2. Walden Pond and fine-grained bottom sediments extend to the till and bedrock surface in deep areas. Stratified glacial deposits surround the lake. Water enters the lake from precipitation on the lake surface and from ground water. Water leaves the lake from evaporation and lake-water seepage. (Line of section shown in fig. 3.)
??
Till
0
50
100
150
200
ALT
ITU
DE
, IN
FE
ET
AB
OV
E S
EA
LE
VE
L
VERTICAL EXAGGERATION X 10
300
CT
W21
4
WALDEN POND
Fine-grainedbottom sediments
Bedrock
Water table
Lake-water seepage
250
A A’
EXPLANATION
CONTACT LINE Dashedwhere inferred
Evaporation Precipitation Recharge
Ground-waterinflow
Stratified glacial deposits
Figure 4. Measurements of water levels in well CTW165 (A) and Walden Pond (B) show the annual cycle of water-level declines and rises. Long-term trends in water levels reflect trends in annual precipitation (C). (Lake water levels in 1956 and from1959 to 1971 were collected by Walden Pond State Reservation staff (Walker, 1971); precipitation data are from the National Oceanic and Atmospheric Administration.)
WATER LEVEL IN WELL CTW165MEAN GROUND-WATER ALTITUDE FOR YEARS 1965-99MEASUREMENT ON JULY 19, 1999
WALDEN POND STAGEMEASUREMENT IN JUNE, 1956MEASUREMENT ON JULY 19, 1999
GR
OU
ND
-WA
TE
R L
EV
EL,
IN
FE
ET
AB
OV
E S
EA
LE
VE
LW
ALD
EN
PO
ND
STA
GE
, IN
FE
ET
AB
OV
E S
EA
LE
VE
L
4A
4B
150
164
152
154
156
158
160
162
150
164
152
154
156
158
160
162
AN
NU
AL
PR
EC
IPIT
AT
ION
,IN
INC
HE
S
No data
PRECIPITATION AVERAGEFOR YEARS 1960-99
4C
1954
1956
1958
1960
1962
1964
1966
1968
1970
1972
1974
1976
1978
1980
1982
1984
1986
1988
1990
1992
1994
1996
1998
25
65
35
45
55
-12 -2-11 -10 -9 -8 -7 -6 -5 -4 -3
DELTA OXYGEN-18, IN PER MIL
DE
LTA
DE
UT
ER
IUM
, IN
PE
R M
IL
Local meteoric water line
Evaporation line
PRECIPITATION ( Atmospheric Deposition Station )
GROUND-WATER INFLOW ( wells LVW30, LVW33,and CTW203 )
LAKE WATER ( lake surface over the eastend deep area )
June 1998 to September 1999
Figure 5. The isotopic composition of precipitation varied on the basis of atmospheric temperature and defined a local meteoric water line (LMWL). The isotopic composition of ground water clustered at the low end of the LMWL and reflected the cold temperature when ground water was recharged. The isotopic composition of lake water plotted to the right of the LMWL, and defined an evaporation line.
-80
-20
-70
-60
-50
-40
-30
Table 1. Nutrient budget for Walden Pond
[Ground water, septic leach-field plume, and atmospheric sources measured directly; swimmer source estimated; other sources modified from BaystateEnvironmental Inc. (1995); kg/yr, kilograms per year; N, nitrogen; P, phosphorus; kg/3 mo, kilograms per months]
Source
Annual Summer
Nitrogen Phosphorus Nitrogen Phosphorus
Load(kg/yr)
Percentage of total load
Load (kg/yr)
Percent-age of
total load
N:P ratio (atomic)
Load(kg/3 mo)
Percent-age of
sum load
Load (kg/3 mo)
Percent-age of
sum load
N:P ratio (atomic)
Background ground water 66 7.7 5.5 17 27 16 4 1.4 9 27
Plumeground water 260 30 -- -- -- 65 15 -- -- --
Atmospheric wet 152 18 .8 3 412 38 9 .2 1 412
Atmospheric dry 75 8.7 15 47 11 19 4 3.8 23 11
Swimmers 290 34 8.7 27 74 290 67 8.7 54 74Waterfowl 4 .5 .6 2 15 1 0 .6 4 4Fish stocking 6 .7 .7 2 19 2 0 .7 4 5Direct runoff 6 .7 .8 2 16 1 0 .8 5 4Total 858 100 32 100 59 432 100 16 100 59
160
180
200
200
180
WALDEN POND
0.32—0.47
5—36
0.05—12
2.5—14
<0.05—0.5(deep)
(deep)26—38
13—45
0.140.05
0.186.7
1.9
<0.05
2.5
0.39
3.1-4.9
0.01
0.16
0.06
0.57
0.16
0.01-0.05
0.11
0.16
<0.05<0.05
<0.05
0.200.46 Septic system
158.
5
158.5
159.
5159
160
159.5
159
Figure 7. Nitrate concentrations in samples from observation wells near the Walden Pond State Reservation septic leach field and at temporary drive-point wells on the shore of Walden Pond. Estimated areal extent of the nitrate plume boundary is based on water-quality data and computations on ground-water flow.
N
Estimated areal extent of plume
CTW204CTW218
CTW217
CTW214
CTW244
CTW216
CTW205
LVW30
CTW203
CTW206
CTW227
CTW213
Rou
te 1
26
0
0
500 FEET
150 METERSLINCOLN
CONCORD
<0.05
158.5
159
EXPLANATION
CTW218
WATER TABLE—Shows altitudeof water table, July 19,1999.Dashed where inferred. Datumis sea level
WATER TABLE—Half-footcontour line. Dashed whereinferred. Datum is sea level
MONITORING WELL —Alphanumeric code is localidentifier
TEMPORARY WELL
NITRATECONCENTRATION—Barheight is proportional to nitrateconcentration
NITRATE CONCENTRATION—Number
indicates nitrate concentration,in milligrams nitrogen per liter;<, less than
BUILDINGS AND ROADS


![4153/01 S17-4153-01 DRAMA 2017 Ex… · • your choice of set and props ... You should refer to the character’s tone and tempo, giving reasons for your answer. [4] (ii) Discuss](https://static.fdocuments.us/doc/165x107/5f86a05fb2fb0f4e9e7448e2/415301-s17-4153-01-drama-2017-ex-a-your-choice-of-set-and-props-you-should.jpg)