
Hydrological simulation approaches for BMPs and LID ... · e-mail: [email protected] ... RECARGA,...
12
Water Science and Engineering, 2014, 7(2): 143-154 doi:10.3882/j.issn.1674-2370.2014.02.003 http://www.waterjournal.cn e-mail: [email protected] This work was supported by the National Natural Science Foundation of China (Grants No. 51279064 and 51209090). *Corresponding author (e-mail: [email protected]) Received Nov. 23, 2012; accepted Nov. 28, 2013 Hydrological simulation approaches for BMPs and LID practices in highly urbanized area and development of hydrological performance indicator system Yan-wei SUN*, Qing-yun LI, Lei LIU, Cun-dong XU, Zhong-pei LIU Department of Hydraulic Engineering, North China University of Water Resources and Electric Power, Zhengzhou 450011, P. R. China Abstract: Urbanization causes hydrological change and increases stormwater runoff volumes, leading to flooding, erosion, and the degradation of instream ecosystem health. Best management practices (BMPs), like detention ponds and infiltration trenches, have been widely used to control flood runoff events for the past decade. However, low impact development (LID) options have been proposed as an alternative approach to better mimic the natural flow regime by using decentralized designs to control stormwater runoff at the source, rather than at a centralized location in the watershed. For highly urbanized areas, LID stormwater management practices such as bioretention cells and porous pavements can be used to retrofit existing infrastructure and reduce runoff volumes and peak flows. This paper describes a modeling approach to incorporate these LID practices and the two BMPs of detention ponds and infiltration trenches in an existing hydrological model to estimate the impacts of BMPs and LID practices on the surface runoff. The modeling approach has been used in a parking lot located in Lenexa, Kansas, USA, to predict hydrological performance of BMPs and LID practices. A performance indicator system including the flow duration curve, peak flow frequency exceedance curve, and runoff coefficient have been developed in an attempt to represent impacts of BMPs and LID practices on the entire spectrum of the runoff regime. Results demonstrate that use of these BMPs and LID practices leads to significant stormwater control for small rainfall events and less control for flood events. Key words: hydrological simulation approach; best management practices; low impact development; flow duration curve; peak flow frequency exceedance curve; runoff coefficient 1 Introduction Land use change, especially urbanization, has profound impacts on the runoff characteristics of the land where it takes place and, consequently, on the aquatic environments of the urban streams to which the runoff drains (Booth and Jackson 1997; Chadwick et al. 2012; Misra 2011; Nagy et al. 2012). Structural best management practices (BMPs) and low impact development (LID) stormwater management practices utilizing detention and infiltration are widely used to reduce the negative impacts of urban stormwater runoff
Transcript of Hydrological simulation approaches for BMPs and LID ... · e-mail: [email protected] ... RECARGA,...
Water Science and Engineering, 2014, 7(2): 143-154 doi:10.3882/j.issn.1674-2370.2014.02.003 http://www.waterjournal.cn
e-mail: [email protected]
This work was supported by the National Natural Science Foundation of China (Grants No. 51279064 and
51209090). *Corresponding author (e-mail: [email protected]) Received Nov. 23, 2012; accepted Nov. 28, 2013
Hydrological simulation approaches for BMPs and LID practices in highly urbanized area and development of
hydrological performance indicator system
Yan-wei SUN*, Qing-yun LI, Lei LIU, Cun-dong XU, Zhong-pei LIU
Department of Hydraulic Engineering, North China University of Water Resources and Electric Power, Zhengzhou 450011, P. R. China
Abstract: Urbanization causes hydrological change and increases stormwater runoff volumes, leading to flooding, erosion, and the degradation of instream ecosystem health. Best management practices (BMPs), like detention ponds and infiltration trenches, have been widely used to control flood runoff events for the past decade. However, low impact development (LID) options have been proposed as an alternative approach to better mimic the natural flow regime by using decentralized designs to control stormwater runoff at the source, rather than at a centralized location in the watershed. For highly urbanized areas, LID stormwater management practices such as bioretention cells and porous pavements can be used to retrofit existing infrastructure and reduce runoff volumes and peak flows. This paper describes a modeling approach to incorporate these LID practices and the two BMPs of detention ponds and infiltration trenches in an existing hydrological model to estimate the impacts of BMPs and LID practices on the surface runoff. The modeling approach has been used in a parking lot located in Lenexa, Kansas, USA, to predict hydrological performance of BMPs and LID practices. A performance indicator system including the flow duration curve, peak flow frequency exceedance curve, and runoff coefficient have been developed in an attempt to represent impacts of BMPs and LID practices on the entire spectrum of the runoff regime. Results demonstrate that use of these BMPs and LID practices leads to significant stormwater control for small rainfall events and less control for flood events. Key words: hydrological simulation approach; best management practices; low impact development; flow duration curve; peak flow frequency exceedance curve; runoff coefficient
1 Introduction
Land use change, especially urbanization, has profound impacts on the runoff characteristics of the land where it takes place and, consequently, on the aquatic environments of the urban streams to which the runoff drains (Booth and Jackson 1997; Chadwick et al. 2012; Misra 2011; Nagy et al. 2012). Structural best management practices (BMPs) and low impact development (LID) stormwater management practices utilizing detention and infiltration are widely used to reduce the negative impacts of urban stormwater runoff

Yan-wei SUN et al. Water Science and Engineering, Apr. 2014, Vol. 7, No. 2, 143-154 144
associated with increased impervious surfaces and have become essential tools of urban stormwater management (Emerson and Traver 2008; Williams and Wise 2006).
As far as performance of the BMPs and LID practices is concerned, the monitoring approach is most widely used, but it is limited to the long-term monitoring data and the availability of the data (Asleson et al. 2009). Simulation based on realistic models, however, provides an approach to predicting the hydrological performances of future BMPs and LID practices. A substantial amount of studies have been conducted on the hydrological simulation approaches of different stormwater management practices based on physical or mathematical models. Both independent models and models incorporated into the watershed-scale models like the Bay Area Hydrology Model (BAHM), Hydrological Modeling System (HEC-HMS), EPA Sustain, EPA Stormwater Management Model (SWMM) (Lucas 2010), HydroCad (Lucas 2010), and Soil and Water Assessment Tool (SWAT) have been applied in different areas. Of all the hydrological models, SWMM is considered one of the most promising models for representing the profoundly different hydrological characteristics of undeveloped and urban lands equally well based on analysis of the currently most-used hydrological models (Bosley 2008). Therefore, SWMM was used in this study to simulate hydrological performances of different BMPs and LID practices.
Existing empirical evaluation approaches for performance of BMPs and LID practices are valuable, but have limited applicability in predicting their performance over extended durations with a variety of storm types. In addition, current hydrological performance evaluation indicators such as curve number (CN), runoff volume, and peak runoff reduction, and time to peak runoff are targeted to single rainfall events, ignoring the goal of LID of maintaining the natural flow regime (Chapman and Horner 2010; Davis 2008a, 2008b). These hydrological performance indicators cannot be used when long-term rainfall data are applied. A hydrological performance indicator system representing impacts of BMPs and LID practices on the entire spectrum of rainfall events may provide more information for the hydrological performance evaluation of the stormwater management practices, especially for LID (Palhegyi 2010).
The main objective of this study was to present hydrological simulation approaches for typical BMPs and LID practices in a highly urbanized area by using different modules of SWMM. A second important study objective was to develop a series of hydrological performance indicators attempting to represent the entire spectrum of rainfall events and to use them to evaluate hydrologic impacts of BMPs and LID practices.
2 Methodology
The study area is located within the Little Mill Creek Watershed in Lenexa, Kansas, USA. The Kansas City region is generally characterized by Soil Conservation Service (SCS) Type II storm distribution. The study area here is located to the north of West 87th street in Lenexa and

Yan-wei SUN et al. Water Science and Engineering, Apr. 2014, Vol. 7, No. 2, 143-154 145
composed of a parking lot and buildings, shown in Fig. 1. The study area is 0.017 km2, moderately sloped at a 3% grade with a high imperviousness percentage of 86%. Soils are characterized as hydrologic soil group C with a low infiltration rate. The area where the proposed detention pond, infiltration trench or bioretention cell is being implemented is 846 m2.
Fig. 1 Study area
2.1 Hydrological modeling
A hydrological model of the study area without BMPs and LID practices has been developed and implemented using SWMM (Karuppasamy et al. 2009; Postel et al. 2009). Main parameters are listed in Table 1. The model with BMPs and LID practices used in this study was developed based on the previous model. In this study, SWMM simulated the sub-catchment runoff with the usual procedures and routed it downstream to the stormwater management practice locations simulated by nodes and links of SWMM or other external models, discussed below.
Table 1 Input parameters of SWMM sub-catchment
Parameter Value Parameter Value
Area 0.017 km2 Depression depth on pervious area 1.27 cm
Imperviousness percentage 86% Maximum infiltration rate of Horton infiltration parameters 11.43 cm/h
Width 120 m Minimum infiltration rate of Horton infiltration parameters 0.76 cm/h
Slope 3% Decay constant of Horton infiltration parameters 4.14
Depression depth on impervious area 0.15 cm
Hourly rainfall data extending from August 1948 to February 2010 for the Kansas City Downtown (KCD) Airport (gage number 234359) are available on the website for the United States National Climatic Data Center (NCDC). Considering the data gap, large rainfall event distribution, and total rainfall depth, the 10-year period of record spanning from 1968 to 1977 was chosen for the continuous simulation analysis. Table 2 shows the monthly average evaporation rates used for this study.

Yan-wei SUN et al. Water Science and Engineering, Apr. 2014, Vol. 7, No. 2, 143-154 146
Table 2 Monthly average evaporation rates
Month Jan. Feb. Mar. Apr. May Jun. Jul. Aug. Sep. Oct. Nov. Dec.
Evaporation rate (mm/d) 1.0 0.8 1.3 1.3 3.0 5.1 7.1 9.4 9.7 6.9 6.6 4.3
2.2 Modeled scenarios
A set of scenarios were modeled to test the application of BMPs and LID practices for managing stormwater in the study area. BMPs and LID scenarios were compared to an undeveloped condition and a developed uncontrolled condition. These and other conditions are discussed below. Through BMPs scenarios, we investigated the implementation of a detention pond and infiltration trench, and through LID scenarios we explored options of bioretention cells and retrofitting the parking lot with permeable concrete. The scenarios are as follows:
(1) Undeveloped scenario: The study area was simulated as a parcel of pastureland with 5% impervious area, where runoff was modeled to travel as overland flow to the outlet.
(2) Developed uncontrolled scenario: This scenario described the current condition of the study area. In this scenario, the study area was modeled as a high-density commercial development area with 86% impervious area. No stormwater management practices were applied to the study area in this scenario.
(3) Detention pond scenario: In this scenario, runoff from the study area was routed through a detention pond in the BMPs/LID area. A detention pond is a typical storage structure used to store water temporarily and then release it according to the design criteria. In this study, a detention pond was simulated to release a 100-year storm within 48 hours. The surface area of the detention pond was 846 m2, with a maximum depth of 2.2 m. The simulation of the detention pond scenario in SWMM is illustrated in Fig. 2(a).
(4) Infiltration trench scenario: Runoff from the study area was routed through an infiltration trench in the BMPs/LID area. Infiltration trenches are excavations backfilled with stone aggregate used to capture runoff and infiltrate it into the ground. They can be simulated as a rectangular, fully pervious sub-catchment whose depression storage depth equals the equivalent depth of the pore space available within the trench. In this study, the infiltration trench was simulated as a 100% pervious rectangular area of 846 m2. For comparison purposes, the simulated depths of the infiltration trench and detention pond were the same. The typical porosity of infiltration trench fillings was 0.4, which generated a valid depression storage depth of 88 cm for the infiltration trench. The schematic diagram of the infiltration trench in SWMM is shown in Fig. 2(b).
(5) Porous pavement scenario: In this scenario, the design retrofitted the parking lot using 15.85 cm-thick porous pavement. Four sub-catchments were delineated: S1, S2, S3, and S4, as illustrated in Fig. 2(c). S3 was used to simulate the porous pavement and received the runoff from S1 and S2. The runoff of S3 was then routed to S4, a 100% pervious area. The areas of S1, S2, S3, and S4 were 6 232 m2, 850 m 2, 8 700 m2, and 1 012 m2, respectively.

Yan-wei SUN et al. Water Science and Engineering, Apr. 2014, Vol. 7, No. 2, 143-154 147
Fig. 2 Schematic representation of three scenarios in SWMM
(6) Bioretention cell scenario: In the bioretention cell scenario, runoff from the study area was routed through a bioretention cell in the BMPs/LID area. Due to the complicated process of water movement in bioretention cells, simulation of bioretention cells with SWMM is limited (Lucas 2010). As a consequence, we used an external model, RECARGA, to simulate the water movement in the bioretention cell and incorporated the results into SWMM using an outlet structure for further analysis (Sun et al. 2011). Table 3 lists the design elements of the bioretention cell.
Table 3 Design elements of bioretention cell
Description of parameter Value Description of parameter Value
Bioretention surface area 846 m2 Saturated infiltration rate of gravel layer 15.0 cm/h
Ponding depth 15 cm Depth of gravel layer 30 cm
Saturated infiltration rate of planting soil 6.12 cm/h Saturated infiltration rate of native soil 21.01 cm/h
Depth of planting soil 122 cm
2.3 Hydrological performance indicator system
Hydrological performance evaluation indicators widely used in current studies include peak discharge reduction, runoff volume reduction, the runoff coefficient, and time to peak. Although these indicators can be used to evaluate the performances of any stormwater management practices towards single rainfall events, they cannot be effectively used to predict the long-term hydrological performances. In addition, these indicators are focused on traditional stormwater management practices and ignore the goals of LID, which are maintaining or replicating the undeveloped hydrologic regimes. In order to best evaluate hydrological performances of LID practices, it is necessary to develop a hydrological performance indicator system representing the hydrologic regimes. In this study, we tried to use the runoff regime to represent the hydrologic regime altered by BMPs and LID practices. We developed a hydrological performance indicator system composed of a quantified flow duration curve, a peak flow frequency exceedance curve, and runoff coefficients based on the long-term simulation with the purpose of expressing the whole spectrum of runoff regimes, as described below.
Yan-wei SUN et al. Water Science and Engineering, Apr. 2014, Vol. 7, No. 2, 143-154 148
2.3.1 Flow duration curve The flow duration curve depicts the percentage of time that a particular flow was equaled
or exceeded over a period of interest (a month, season, year, or entire period of record). More recently, it has been used as a useful tool in evaluating impacts of stormwater management practices (Palhegyi 2010; Pomeroy 2007). The flow duration curve is used as one hydrological performance indicator because it expresses the whole spectrum of flows, including low flows, high flows, and flood events. It gives a direct indication of the magnitude, duration, and frequency of the flow, which are three fundamental elements of the runoff regime. Since a flow duration curve may often contain thousands of flow data and a wealth of hydrological information, one expects it to be easy to discern the statistics of the flow data. Therefore, to further demonstrate flow characteristics of duration, magnitude, and frequency under different scenarios and for the quantification purpose, the flow duration curves can be divided into several sections according to their shapes. In this study, the flow intervals corresponding to the time percentage intervals of less than 0.1%, 0.1% to 1%, 1% to 10%, and 10% to 100% under the developed uncontrolled scenario were applied. It is noted that the flow duration curve does not have to be divided into four sections; it can be divided into any number of parts for comparison purposes. 2.3.2 Peak flow frequency exceedance curve
The peak flow frequency exceedance curve is a graph of flow peaks and their exceedances in terms of times per year or over the whole simulation period. It depicts the frequency of occurrence of peak flow of rainfall events. Peak flow frequency exceedance curves were developed from the partial duration series of peak flows in this study. In contrast to the examination of the annual maximum series, this approach was used in this study because it allowed for the analysis of high-frequency and low runoff-producing storms. In addition, this approach describes the true frequency with which a given flow occurs as opposed to simply describing the annual maximum flow. This is important because erosion potential and biotic response of instream fauna are determined by how often a given flow is equaled or exceeded, not just the annual high flow (Pomeroy 2007).
To demonstrate the magnitude and frequency of peak flow occurrence under different scenarios, we quantified peak flow frequency exceedance curves in three sections. The peak flow thresholds corresponding to the frequency intervals of less than 1%, 1% to 10%, and 10% to 100% of the developed uncontrolled condition were applied as the standards to show the performances of the peak flow and frequency reductions. A statistical analysis was then conducted based on the existing times of peak flow in each flow interval for all the scenarios. 2.3.3 Runoff coefficient
Prince George’s County (1999) recommends use of the runoff coefficient as the indicator to examine the performances of LID practices since the typical site runoff coefficient can be maintained at the undeveloped level by compensating for the loss of abstraction (interception, infiltration, and depression storage) through both site planning and design considerations. To

Yan-wei SUN et al. Water Science and Engineering, Apr. 2014, Vol. 7, No. 2, 143-154 149
express direct knowledge of performances of stormwater management practices on the runoff coefficient, we introduced a parameter, Rc , to express the ratio of runoff coefficients under different scenarios to the runoff coefficient under the undeveloped scenario, shown in Eq. (1):
Rc = Cp Cpre (1)
where Rc is an indicator used to evaluate the performances of different stormwater management practices, Cp is the runoff coefficient under different stormwater management practice scenarios, and Cpre is the runoff coefficient under the undeveloped condition. A smaller Rc indicated a better hydrological performance of the stormwater management practices.
3 Results and discussion 3.1 Flow duration curve
Detailed information on development of a flow duration curve was given by Davis (2008b). In this study, a time step of 15 minutes was used. Fig. 3 displays the percentage of time that flows were equaled or exceeded for the six scenarios examined. In this figure, 1% represents one percent of the 10-year simulation period, or approximately 36.5 days, and 10% represents 365 days (one year), etc. Obviously, Fig. 3 shows that, of all the scenarios, the porous pavement scenario best matches the flow duration curve of the undeveloped scenario in mimicking the magnitude and duration. Other stormwater practices, in contrast, did not match the undeveloped condition well and had flows with greater magnitude and duration. According to the statistics, for the developed uncontrolled scenario, the flows were greater in magnitude than in the undeveloped condition for approximately 40% of the overall time period examined, which was an average of 146 days per year. Taking a closer look at the flow duration curves of all examined scenarios when the percentage was greater than 1%, it can be found from Fig. 3(b) that magnitudes of flow controlled by the infiltration trench and porous pavement
Fig. 3 Flow duration curves of six scenarios
Yan-wei SUN et al. Water Science and Engineering, Apr. 2014, Vol. 7, No. 2, 143-154 150
were even smaller than those for the undeveloped scenario, indicating an over-control condition. Magnitudes of the bioretention cell curve were smaller than those of the detention pond curve but remained greater than for the undeveloped scenario.
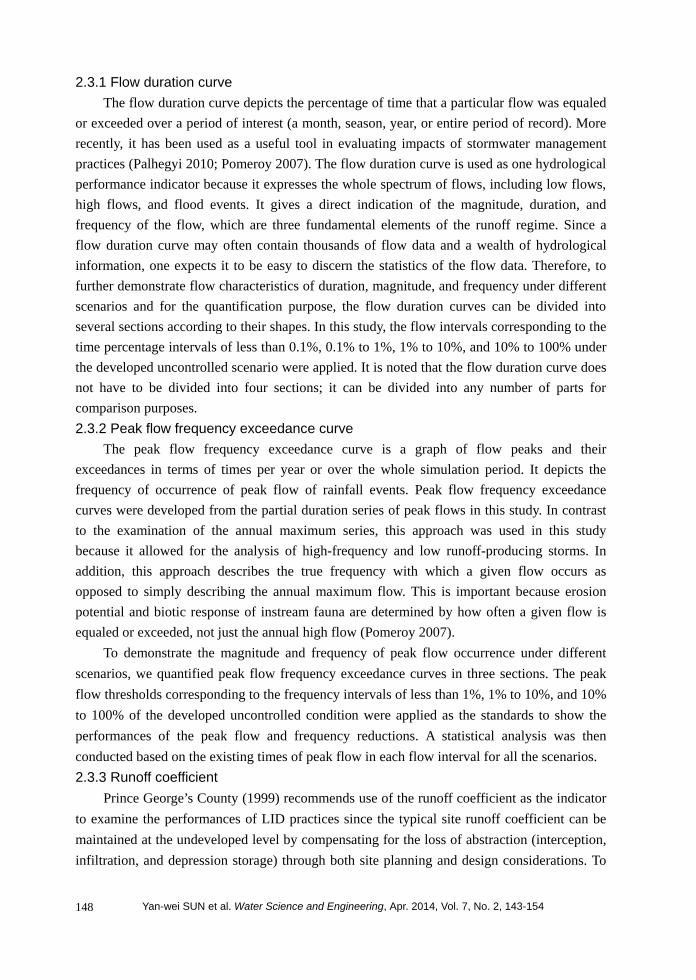
To further demonstrate the hydrological performances of different stormwater management practices on the flow magnitude and duration, we quantified the flow duration curves by dividing them into five sections according to the methods described earlier in this paper. Percentage intervals of less than 0.01%, 0.01% to 0.1%, 0.1% to 1%, 1% to 10%, and 10% to 100% under the developed uncontrolled scenario corresponding to the flow intervals of larger than 0.220 m3/s, 0.106 to 0.220 m3/s, 0.031 to 0.106 m3/s, 0.004 to 0.031 m3/s, and 0 to 0.004 m3/s, respectively, were applied. The duration in the flow intervals for each scenario were then calculated and are summarized in Table 4.
Table 4 Flow durations in different flow intervals of different scenarios
Scenario Flow duration in different flow intervals (h)
> 0.220 m3/s 0.106 to 0.220 m3/s
0.031 to 0.106 m3/s
0.004 to 0.031 m3/s 0 to 0.004 m3/s > 0 m3/s
Undeveloped 0 0 1.00 83.00 3 167.25 3 251.25
Developed uncontrolled 1.75 16.50 147.50 1 479.75 5 834.75 7 480.25
Detention pond 0.25 3.50 61.25 1 534.25 14 784.00 16 383.25
Infiltration trench 1.00 6.00 33.50 91.75 71.75 204.00
Porous pavement 0 0 1.50 14.75 43.50 59.75
Bioretention cell 0.25 6.25 61.25 255.00 2 308.75 2 631.50
By dividing the flow duration curves into different flow intervals, Table 4 demonstrates the hydrological performances of the BMPs and LID practices examined. All the BMPs and LID practices reduced the flow duration to a great extent. The detention pond scenario, limited by its outlet structure, increased the flow duration for the small flows. When the flow was larger than 0.106 m3/s, the porous pavement scenario was closest to the undeveloped scenario, followed by the detention pond, bioretention cell, and infiltration trench scenarios. It should be noted that it is not rational to jump to the conclusion that a certain stormwater management technique shows a better hydrological performance due to the different structures and construction areas. However, the results presented herein were obtained with typical designs for all the stormwater management practices, and, consequently, showed a great potential to represent hydrological performances of the stormwater management practices applied.
Taking a closer look at Table 4, it can be seen that the six scenarios showed different performances. Differences between the undeveloped and developed uncontrolled scenarios were easily explained since development increased surface runoff by increasing the impervious area. Though the detention pond, infiltration trench, and bioretention cell shared the same surface area and native soil, they performed differently, due to their different design elements. The detention pond used orifices and weirs to drain its storage, which decreased the outflow. As opposed to the detention pond, the infiltration trench and bioretention cell store

Yan-wei SUN et al. Water Science and Engineering, Apr. 2014, Vol. 7, No. 2, 143-154 151
runoff temporarily and infiltrate runoff into the ground. Consequently, when the rainfall is low, the runoff can be stored in the storage layer of the infiltration trench or bioretention cell and generate a small amount of overflow. However, when the rainfall is high enough to exceed the storage capacity and native soil infiltration rate, the excessive runoff will overflow, which explains why the infiltration trench and bioretention cell do not perform as well as the detention pond for large rainfall events. Compared with the infiltration trench, the planting soil layer of the bioretention cell has a smaller infiltration rate and generates a larger overflow. There is no doubt that the porous pavement shows the best hydrological performance due to its special material promoting very fast infiltration. On the other hand, the porous pavement changes the impervious area to pervious area, which reduces the surface runoff significantly.
3.2 Peak flow frequency exceedance curve
Fig. 4 shows the peak flow frequency exceedance curves for the six scenarios. A threshold of 0.006 m3/s was applied to the partial peak flow series in order to ignore the rainfall events producing amounts of runoff that were too small. The total existing times of peak flow greater than 0.006 m3/s for all the scenarios are listed in Table 5. Obviously, here, the developed uncontrolled scenario had the maximum number of rainfall events with a peak flow greater than 0.006 m3/s while the porous pavement had the minimum number.
Fig. 4 Peak flow frequency exceedance curves of examined scenarios
Table 5 Numbers of peak flow in different flow intervals for different scenarios
Scenario Numbers of peak flow in different flow intervals
Total number > 0.207 m3/s 0.066 to 0.207 m3/s 0.006 to 0.066 m3/s
Undeveloped 0 0 23 23
Developed uncontrolled 3 33 329 365
Detention pond 1 8 34 43
Infiltration trench 2 10 16 28
Porous pavement 0 0 7 7
Bioretention cell 1 11 11 23

Yan-wei SUN et al. Water Science and Engineering, Apr. 2014, Vol. 7, No. 2, 143-154 152
Peak flow frequency exceedance curves provide direct knowledge about the peak flows and their frequency distribution for all the rainfall events, which are also represented by the shape of the curve and the ranges of x axis and y axis values. The x axis values indicate the occurrence frequency of peak flow for a certain scenario. The y axis values, on the other hand, represent the magnitude of peak flows. Like the flow duration curve, the shape and ranges of the x and y axes can be used to evaluate the performances of stormwater management practices. The one matching the curve of the undeveloped scenario is supposed to have the best performance. Obviously, the porous pavement had the best performance in peak flow control while other stormwater management practices did not match the peak flow frequency exceedance curve very well. These results were consistent with the flow duration curves.
To further analyze the effects of different stormwater management practices on the peak flow and frequency, the peak flow frequency exceedance curves were divided into three sections using the undeveloped scenario as the standard. The frequencies of less than 1%, 1% to 10%, and greater than 10%, corresponding to large rainfall events, moderate rainfall events, and small rainfall events, respectively, were applied. The peak flow intervals fell into categories of greater than 0.207 m3/s, 0.066 to 0.207 m3/s, and 0.006 to 0.066 m3/s individually. Table 5 summarizes the numbers of the peak flows occurring within the flow intervals for all the scenarios.
It can be seen from Table 5 that the total numbers of peak flows greater than 0.006 m3/s for the six scenarios were 23, 365, 43, 28, 7, and 23. These numbers demonstrated that the BMPs and LID practices reduced the magnitude and frequency of peak flow. For the small flows between 0.006 and 0.066 m3/s, the detention pond, infiltration trench, porous pavement, and bioretention cell scenarios reduced the numbers of peak flows to 34, 16, 7, and 11, respectively, which were 10.3%, 4.9%, 2.1%, and 3.3% of the number for the developed uncontrolled scenario. However, for larger flows between 0.066 and 0.207, the four practices reduced the numbers to 24.2%, 30.3%, 0, and 33.3%. Except for porous pavement, the BMPs and LID practices showed that their hydrological performances were more significant for small flows. Since peak flow frequency exceedance curves depict the runoff regime from another aspect, the differences in performance of the detention pond, infiltration trench, bioretention cell, and porous pavement displayed for the large rainfall events can be explained by their structure, which was described in detail in section 2.2. However, it is noted that the detention pond does not perform as well as the infiltration trench or bioretention cell for small rainfall events. This is because both infiltration trenches and bioretention cells have infiltrated most of the runoff generated by small rainfall events, while detention ponds release it slowly.
3.3 Runoff coefficient
The runoff coefficient, actually, is an indicator of the infiltration performances of stormwater management practices. Rc , as shown in Table 6, demonstrated that infiltration

Yan-wei SUN et al. Water Science and Engineering, Apr. 2014, Vol. 7, No. 2, 143-154 153
trenches, porous pavement, and bioretention cells reduced the runoff coefficient significantly. Detention ponds, however, are unable to increase infiltration to the groundwater and will not change the total surface runoff. They just reallocate the distribution of frequency, magnitude, and duration. Therefore, the practices using detention ponds will not change the runoff coefficient. On the other hand, the runoff coefficient after the practices using porous pavement was even less than the undeveloped runoff coefficient, which can be referred to as over-control. However, it is noted that the over-control phenomenon is not always beneficial to the ecology of the receiving water. The small magnitude, frequency, and duration of flow might not allow for the maintenance of the minimum ecological water demand and result in sedimentation due to the low flow. In addition, the high flow is also necessary in supplying habitat for the biota and maintaining the proper hydrologic condition, dissolved oxygen, and water chemistry characteristics.
Table 6 Runoff coefficients and cR of simulated scenarios
Scenario Infiltration (cm) Runoff (cm) Runoff coefficient cR
Undeveloped 813.47 46.71 0.049 1.00
Developed uncontrolled 115.32 641.59 0.676 13.80
Detention pond 115.32 641.59 0.676 13.80
Infiltration trench 655.80 58.07 0.091 1.86
Porous pavement 803.47 5.75 0.006 0.12
Bioretention cell 461.19 262.64 0.277 5.65
4 Conclusions
With a simulation approach in SWMM, we have attempted to examine and characterize the long-term hydrological performances of detention ponds, infiltration trenches, porous pavements, and bioretention cells, and provide recommendations for one simulation methodology used to understand the hydrological performances of site-scale stormwater management practices. A new indicator system of flow duration curves, peak flow frequency exceedance curves, and runoff coefficients fully describing the runoff regime characteristics by depicting the magnitude, duration, and frequency of flows and the overall infiltration performances was developed. Based on the long-term simulation, it was useful in evaluating the hydrological performances of BMPs and LID stormwater management practices.
References Asleson, B. C., Nestingen, R. S., Gulliver, J. S., Hozalski, R. M., and Nieber, J. L. 2009. Performance
assessment of rain gardens. Journal of the American Water Resources Association, 45(4), 1019-1031. [doi:10.1111/j.1752-1688.2009.00344.x]
Booth, D. B., and Jackson, C. R. 1997. Urbanization of aquatic systems: Degradation thresholds, stormwater detection, and the limits of mitigation. Journal of the American Water Resources Association, 33(5), 1077-1090. [doi:10.1111/j.1752-1688.1997.tb04126.x].
Bosley, E. K. 2008. Hydrologic Evaluation of Low Impact Development Using a Continuous,

Yan-wei SUN et al. Water Science and Engineering, Apr. 2014, Vol. 7, No. 2, 143-154 154
Spatially-Distributed Model. M. S. Dissertation. Blacksburg: Virginia Polytechnic Institute and State University.
Chadwick, M. A., Thiele, J. E., Huryn, A. D., Benke, A. C., and Dobberfuhl, D. R. 2012. Effects of urbanization on macroinvertebrates in tributaries of the St. Johns River, Florida, USA. Urban Ecosystems, 15(2), 347-365. [doi:10.1007/s11252-011-0217-0]
Chapman, C., and Horner, R. R. 2010. Performance assessment of a street-drainage bioretention system. Water Environment Research, 82(2), 109-119. [doi:10.2175/106143009X426112]
Davis, A. P. 2008a. Field performance of bioretention: Hydrology impacts. Journal of Hydrologic Engineering, 13(2), 90-95. [doi:10.1061/(ASCE)1084-0699(2008)13:2(90)]
Davis, J. R. 2008b. Guidance for Rural Watershed Calibration with EPA SWMM. 2008. M. E. Dissertation. Fort Collins: Colorado State University.
Emerson, C. H., and Traver, R. G. 2008. Multiyear and seasonal variation of infiltration from storm-water best management practices. Journal of Irrigation and Drainage Engineering, 134(5), 598-605. [doi:10.1061/ (ASCE)0733-9437(2008)134:5(598)]
Karuppasamy, E., Postel, N., Pomeroy, C. A., and Jacobs, T. A. 2009. The impact of smaller detention basins on flood hazard areas in Lenexa, Kansas. Proceedings of the 2009 World Environmental and Water Resources Congress, 1-10. Kansas City: American Society of Civil Engineers. [doi:10.1061/ 41036(342)459]
Lucas, W. C. 2010. Design of integrated bioinfiltration-detention urban retrofits with design storm and continuous simulation methods. Journal of Hydrologic Engineering, 15(6), 486-498. [doi:10.1061/ (ASCE)HE.1943-5584.0000137]
Misra, A. K. 2011. Impact of urbanization on the hydrology of Ganga Basin (India). Water Resources Management, 25(2), 705-719. [doi:10.1007/s11269-010-9722-9].
Nagy, R. C., Lockaby, B. G., Kalin, L., and Anderson, C. 2012. Effects of urbanization on stream hydrology and water quality: the Florida Gulf Coast. Hydrological Processes, 26(13), 2019-2030. [doi:10. 1002/hyp.8336].
Palhegyi, G. E. 2010. Modeling and sizing bioretention using flow duration control. Journal of Hydrologic Engineering, 15(6), 417-425. [doi:10.1061/(ASCE)HE.1943-5584.0000205]
Pomeroy, C. A. 2007. Evaluating the Impacts of Urbanization and Stormwater Management Practices on Stream Response. Ph. D. Dissertation. Fort Collins: Colorado State University.
Postel, N. A., Pomeroy, C. A., Jacobs, T. A., and Karuppasamy, E. 2009. Analyzing the impacts of a retrofit detention basin flow control strategy on biodiversity in an urban stream system. Proceedings of the 2009 World Environmental and Water Resources Congress. Kansas City: American Society of Civil Engineering. [doi:10.1061/41036(342)85]
Prince George’s County. 1999. Low Impact Development Hydrologic Analysis. Prince George’s County, Maryland, Department of Environmental Resources, Programs and Planning Division.
Sun, Y. W., Wei, X. M., and Pomeroy, C. A. 2011. Global analysis of sensitivity of bioretention cell design elements to hydrologic performance. Water Science and Engineering, 4(3), 246-257. [doi:10.3882/j.issn. 1674-2370.2011.03.002]
Williams, E. S., and Wise, W. R. 2006. Hydrologic impacts of alternative approaches to storm water management and land development. Journal of the American Water Resources Association, 42(2), 443-455. [doi:10.1111/j.1752-1688.2006.tb03849.x]
(Edited by Yun-li YU)


![Bioretention Brownbag 072412.pptx [Read-Only]iswm.nctcog.org/training/Bioretention_PPT/Bioretention_booklet.pdfJuly 23, 2011 Bioretention Design 2 Basics of Bioretention • Also called](https://static.fdocuments.us/doc/165x107/5ae800237f8b9ae1578fcfc3/bioretention-brownbag-read-onlyiswmnctcogorgtrainingbioretentionpptbioretentionbookletpdfjuly.jpg)