
Hydrogen-air deflagrations in open atmosphere: LES analysis of experimental data
27
Hydrogen-air deflagrations in Hydrogen-air deflagrations in open atmosphere: LES analysis open atmosphere: LES analysis of experimental data of experimental data V. Molkov*, D. Makarov*, H. Schneider** V. Molkov*, D. Makarov*, H. Schneider** 7-10 September 2005, Pisa - Italy 7-10 September 2005, Pisa - Italy First International Conference on First International Conference on HYDROGEN SAFETY HYDROGEN SAFETY * - University of Ulster, UK; * - University of Ulster, UK; ** - Fraunhofer Institut Chemische Technologie, GERMANY ** - Fraunhofer Institut Chemische Technologie, GERMANY
-
Upload
lee-humphrey -
Category
Documents
-
view
18 -
download
3
description
First International Conference on HYDROGEN SAFETY. Hydrogen-air deflagrations in open atmosphere: LES analysis of experimental data. V. Molkov*, D. Makarov*, H. Schneider**. * - University of Ulster, UK; ** - Fraunhofer Institut Chemische Technologie, GERMANY. - PowerPoint PPT Presentation
Transcript of Hydrogen-air deflagrations in open atmosphere: LES analysis of experimental data
Hydrogen-air deflagrations in open Hydrogen-air deflagrations in open atmosphere: LES analysis of atmosphere: LES analysis of
experimental dataexperimental data
V. Molkov*, D. Makarov*, H. Schneider**V. Molkov*, D. Makarov*, H. Schneider**
7-10 September 2005, Pisa - Italy7-10 September 2005, Pisa - Italy
First International Conference onFirst International Conference on
HYDROGEN SAFETYHYDROGEN SAFETY
* - University of Ulster, UK; * - University of Ulster, UK;
** - Fraunhofer Institut Chemische Technologie, GERMANY** - Fraunhofer Institut Chemische Technologie, GERMANY

ContentsContents• ExperimentExperiment in 2094-m in 2094-m33
hemispherehemisphere 11• Theoretical background for modellingTheoretical background for modelling
22• The Large Eddy Simulation modelThe Large Eddy Simulation model
33• Theory versus experimentTheory versus experiment 44

EXPERIMENTEXPERIMENT
11

Experimental detailsExperimental details
Experiment:Schneider H., Pförtner H. PNP-
Sichcrheitssofortprogramm,
Prozebgasfreisetzung-Explosion in
der gasfabrik und auswirkungen von
Druckwellen auf das Containment,
Dezember 1983.
Geometryhemisphere on the ground
(polyethylene foil + wires net)Size/Volume D=20 m; V=2094 m3
Mixture quiescent 29.7% H2 in AirOperating conditions Po=98.9 kPa, To=283 K
Ignition source base centered pills, 150 J
20 meters20 meters

Side and top view moviesSide and top view movies
20 m20 m
10 m10 m
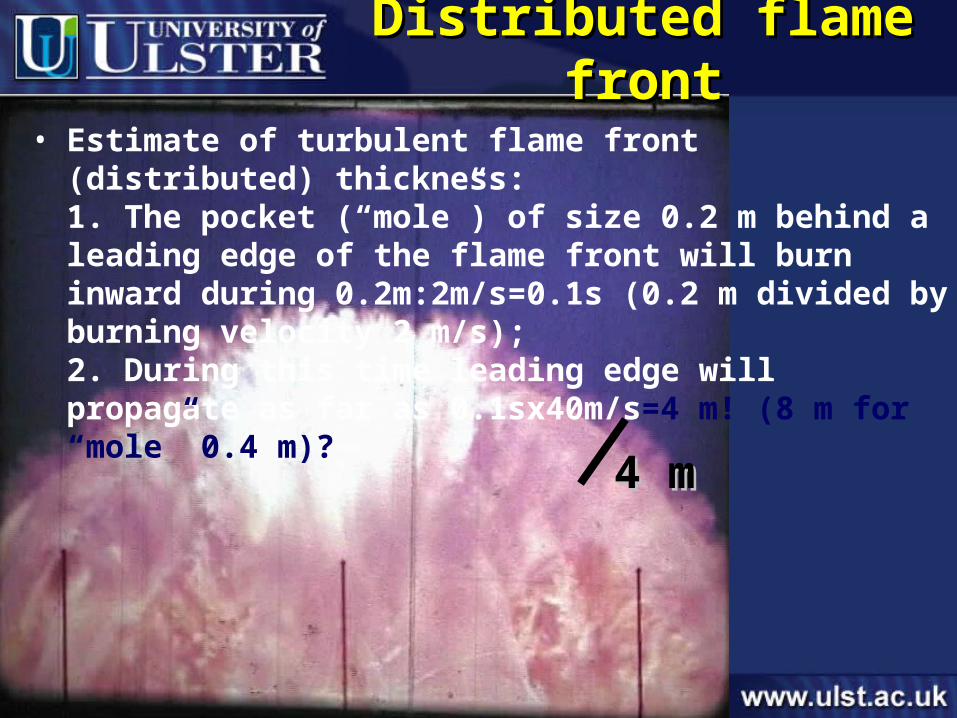
• Estimate of turbulent flame front (distributed) thickness:1. The pocket (“mole”) of size 0.2 m behind a leading edge of the flame front will burn inward during 0.2m:2m/s=0.1s (0.2 m divided by burning velocity 2 m/s);2. During this time leading edge will propagate as far as 0.1sx40m/s=4 m! (8 m for “mole” 0.4 m)?
4 m4 m
Distributed flame frontDistributed flame front

• Flame propagation velocity was independent upon ignition energy in the investigated energy range (10-1000 J or pyrotechnical charge).
• The resulting flames propagated in almost hemispherical form with a developed structure.
• The maximum visible flame velocity occurs between the original radius of the balloon R0 and radius 1.5R0.
• The maximum flame radius reached about 2R0. • No transition to detonation was observed. • The maximum visible flame velocity reached 84 m/s.• At a sufficient distance from the explosion the maximum
pressure decayed inversely proportional to the distance. • The positive pressure wave was followed by a negative
pressure phase.
Experimental resultsExperimental results

THEORETICAL THEORETICAL BACKGROUND FOR BACKGROUND FOR
MODELLINGMODELLING
22

Gostintsev et al (1988) analysed about 20 experiments on large-scale unconfined deflagrations and concluded that the hydrodynamic flame instability leads to accelerating, self-similar regime of fully developed turbulent flame propagation. According to this analysis, the flame front surface obeys the fractal theory after self-similar regime is established. The authors found that the transition to the self-similar turbulent regime of flame propagation occurs after the critical value of the flame front radius R* is achieved, which was found to be R*=1.0-1.2 m for near stoichiometric premixed hydrogen-air flames.
Self-similarity (fractals)Self-similarity (fractals)
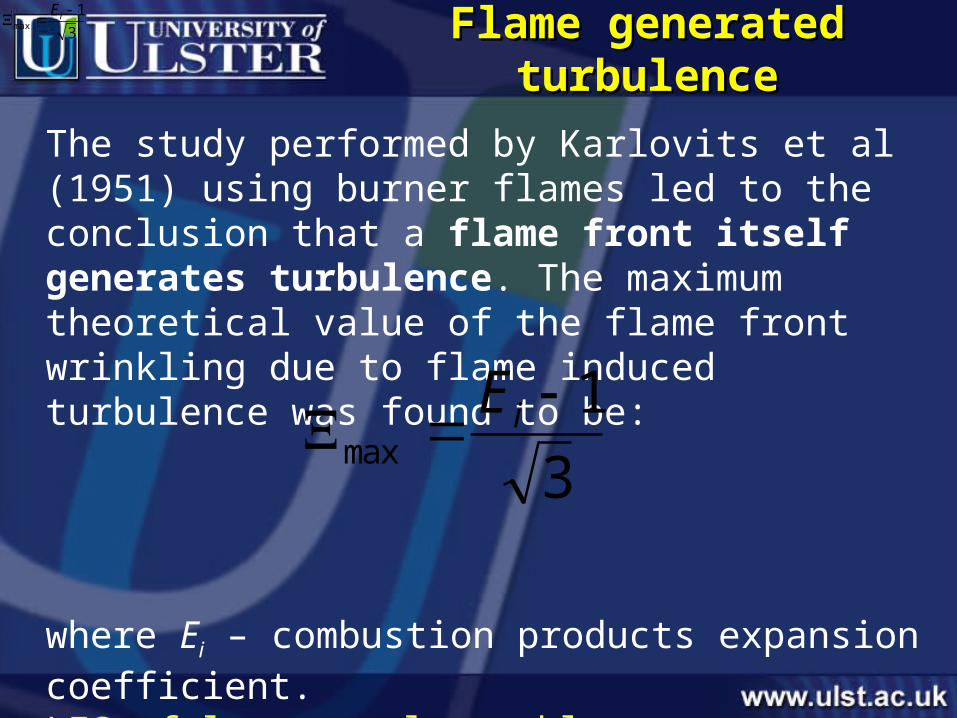
The study performed by Karlovits et al (1951) using burner flames led to the conclusion that a flame front itself generates turbulence. The maximum theoretical value of the flame front wrinkling due to flame induced turbulence was found to be:
where Ei – combustion products expansion coefficient.LES of large scale problems can not at foreseen future resolve all details of flame front structure and this can be modelled only.
Flame generated turbulenceFlame generated turbulence3
1max
iE
3
1max
iE

The Ulster LES The Ulster LES modelmodel
33
S. Pope (2004):S. Pope (2004):
- Physical LES (Physical LES (filter size is filter size is ARTIFICIAL parameterARTIFICIAL parameter ))
- Numerical LES (filter size is cell size)Numerical LES (filter size is cell size)
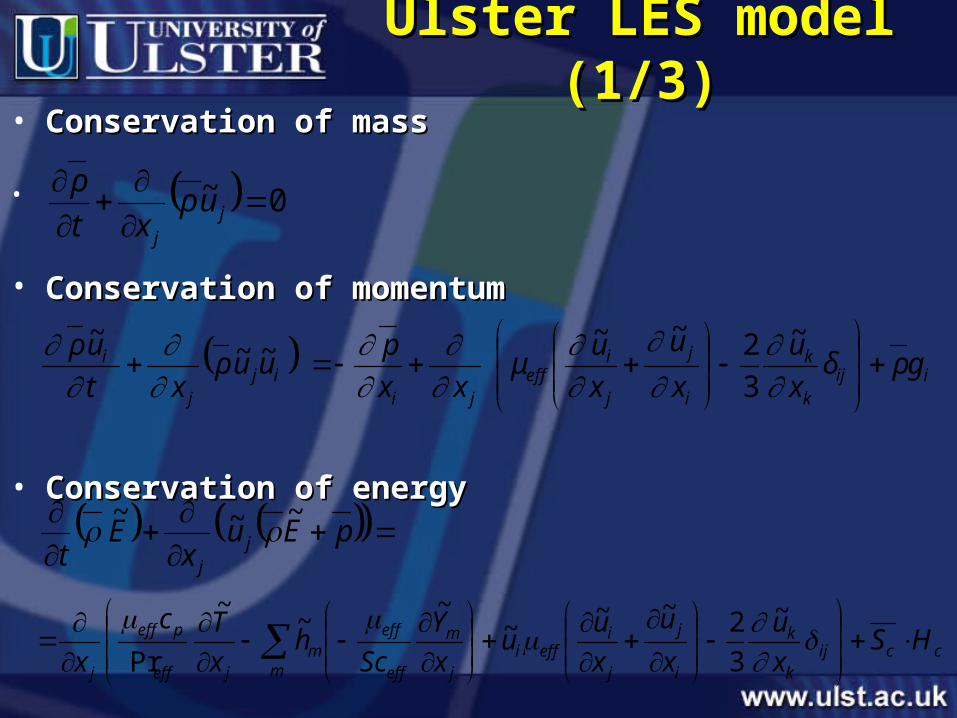
• Conservation of massConservation of mass
•
• Conservation of momentumConservation of momentum
• Conservation of energyConservation of energy
Ulster LES model (1/3)Ulster LES model (1/3)
0~
jj
uρxt
ρ
iijk
k
i
j
j
ieff
jii j
j
i gρδx
u
x
u
x
uμ
xx
p uuρ
xt
uρ
~
3
2~~~~
~
pEux
Et j
j
~~~
ccijk
k
i
j
j
ieffi
m j
m
eff
effm
jeff
peff
j
HSx
u
x
u
x
uu
x
Y
Sch
x
Tc
x
~
3
2~~~
~~
~
Pr

• Premixed flame front propagation (progress variable)Premixed flame front propagation (progress variable)
• Gradient method for the source termGradient method for the source term
• Yakhot’s RNG like turbulent premixed combustion (inflow)Yakhot’s RNG like turbulent premixed combustion (inflow)
where where u’u’ – residual SGS velocity – residual SGS velocity
• Karlovitz turbulence generated by flame front itself (SGS)Karlovitz turbulence generated by flame front itself (SGS)
• Chemistry is in burning velocity (dependence on Chemistry is in burning velocity (dependence on T,T, p, p, ))
Ulster LES model (2/3)Ulster LES model (2/3)
22exp tSGStt SuSS
~
)(cgradSS tuc
c
jeff
eff
jj
j
Sx
c
Sc
μ
xcuρ
xcρ
t
~
~~~
umnm
iui
n
i
m
uiiuiuiu p
pS
p
p
T
TpTSpTS
/
),,(),,(
TGFIuSGSt SS smSu /91.1
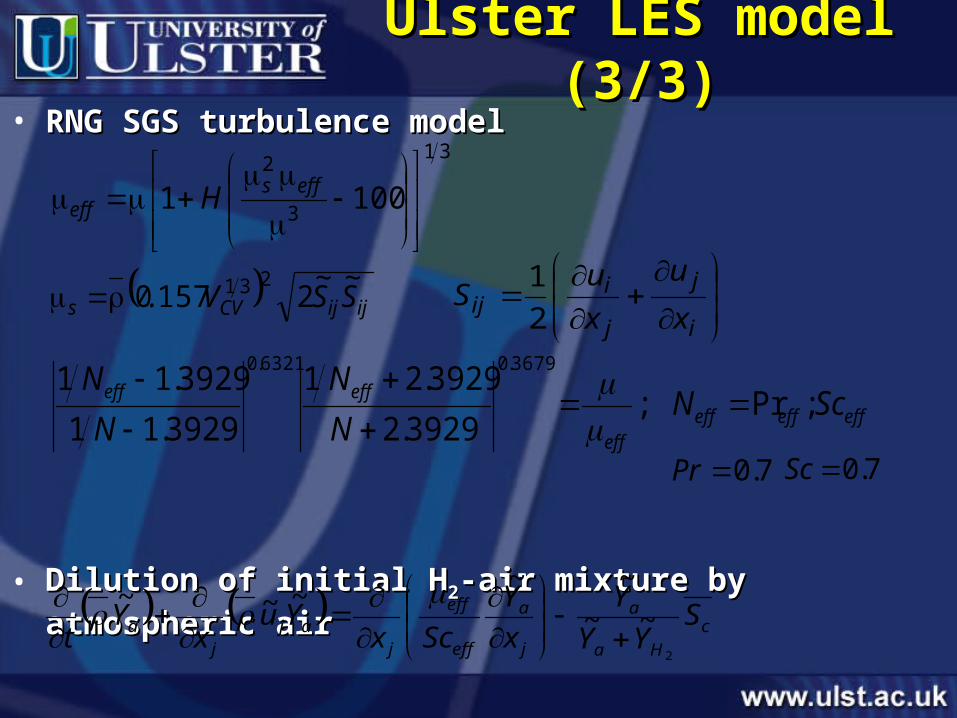
• RNG SGS turbulence modelRNG SGS turbulence model
• Dilution of initial HDilution of initial H22-air mixture by atmospheric air-air mixture by atmospheric air
Ulster LES model (3/3)Ulster LES model (3/3)
31
3
2
1001
effs
eff H
ijijCVs S~
S~
V. 21570231
effeffeffeff
effeff ScNN
N
N
N;Pr;
3929.2
3929.21
3929.11
3929.113679.06321.0
i
j
j
iij x
u
x
uS
2
1
c
Ha
a
j
a
eff
eff
jaj
ja S
YY
Y
x
Y
ScxYu
xY
t2
~~
~~~~~
7.0Pr 7.0Sc
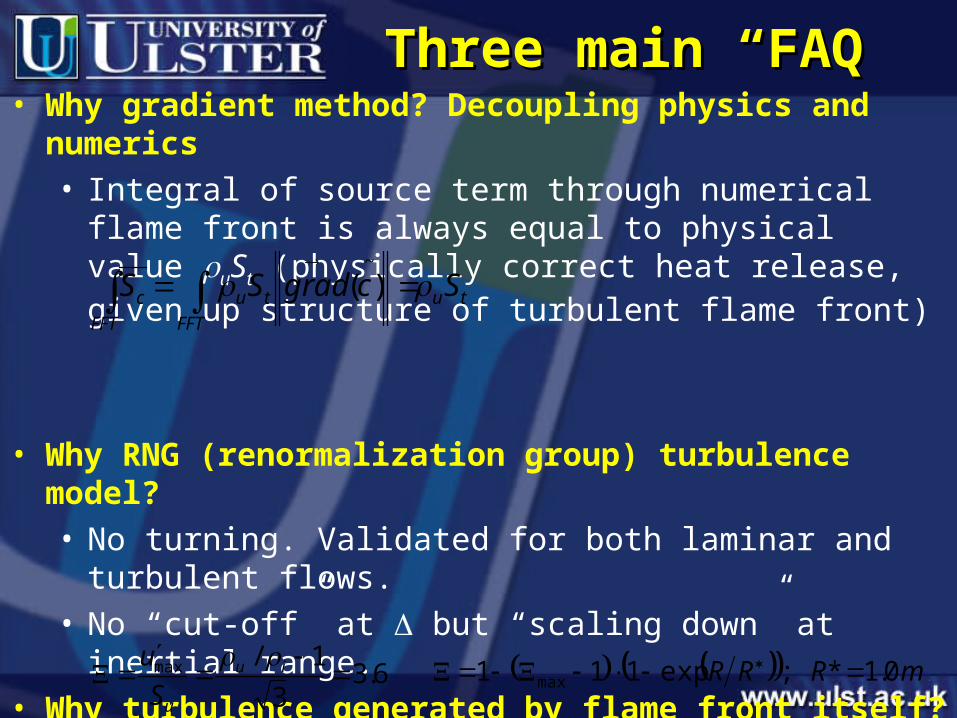
• Why gradient method? Decoupling physics and numerics• Integral of source term through numerical flame front is
always equal to physical value uSt (physically correct heat release, given up structure of turbulent flame front)
• Why RNG (renormalization group) turbulence model?• No turning. Validated for both laminar and turbulent flows.• No “cut-off” at but “scaling down” at inertial range.
• Why turbulence generated by flame front itself?• LES of large scale accidental combustion can not resolve
phenomena at scales comparable with flamelets thickness.• Existence of a theoretical maximum and critical radius:
Three main “FAQ”Three main “FAQ”
tu
FFT
tu
FFT
c ScgradSS ~
)(
6.33
1/max
iu
uS
u mRRR 0.1*;exp111 max
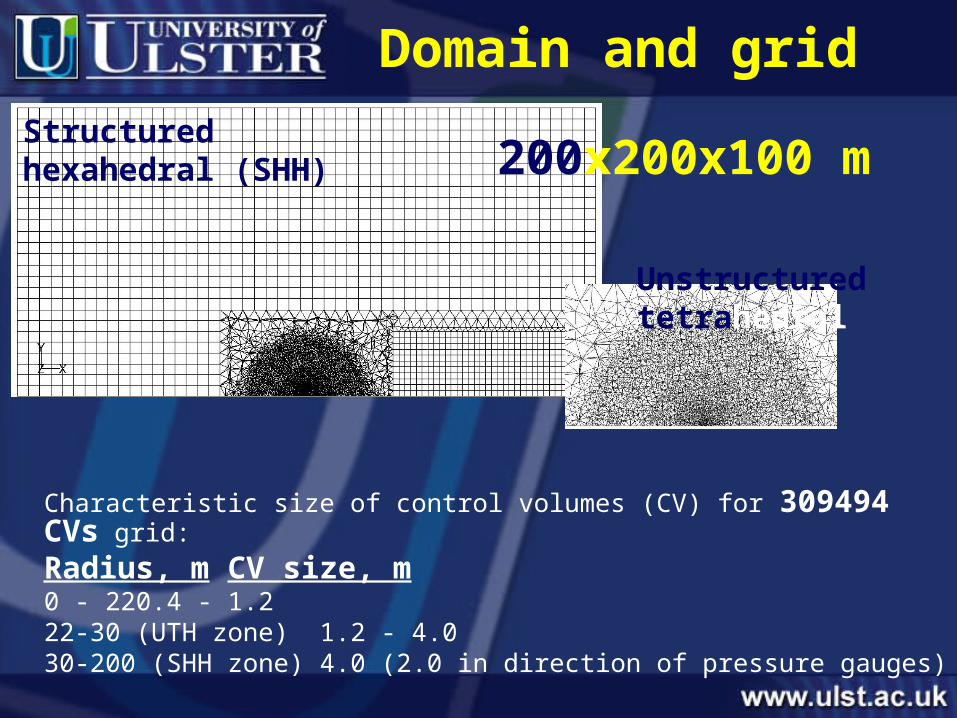
Characteristic size of control volumes (CV) for 309494 CVs grid:
Radius, m CV size, m0 - 22 0.4 - 1.222-30 (UTH zone) 1.2 - 4.030-200 (SHH zone) 4.0 (2.0 in direction of pressure gauges)
Domain and grid
200x200x100 m
Unstructured tetrahedral
Structured hexahedral (SHH)

• Initial conditions– initial temperature T=283 K; initial pressure p=98.9 kPa
– quiescent mixture; progress variable c=0.
– hydrogen concentration YH2=0.0287 at R10.0m (Ya=1 for R>10.0 m)
• Boundary conditions– no-slip impermeable adiabatic boundary on the ground
– non-reflecting boundary conditions in atmosphere
• Ignition: 15 ms increase of progress variable in 1 CV
• Numerical details– code: FLUENT
– explicit linearisation of the governing equations
– explicit time marching procedure
– second order accurate upwind scheme for convection terms, central-difference scheme for diffusion terms
– Courant-Friedrichs-Lewy number CFL=0.8
Numerical details
THEORY versus THEORY versus EXPERIMENTEXPERIMENT
44
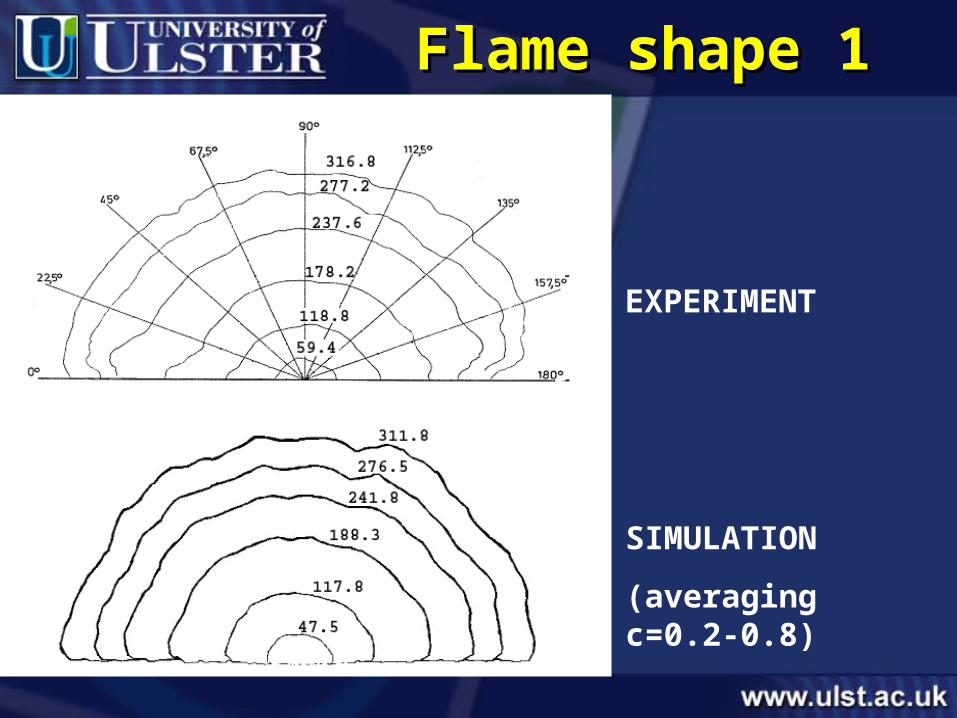
Flame shape 1Flame shape 1
SIMULATION
(averaging c=0.2-0.8)
EXPERIMENT

ExperimentExperiment
SimulationSimulation
Flame shape 2Flame shape 2

Flame propagationFlame propagation

Flame radiusFlame radius
Time, s
Rad
ius,
m
0 0.05 0.1 0.15 0.2 0.25 0.3 0.350
2
4
6
8
10
12
14
16
18
20
22
ExperimentSimulation

Burning velocity Burning velocity SStt
Time, s
Bu
rnin
g v
elo
city
, m/s
0 0.05 0.1 0.15 0.2 0.25 0.3 0.350
2
4
6
8
10
12
14
16
18
20
22
ExperimentSimulation
EEii=7.2=7.2
Balloon rupture at 5 m is a reason for flame acceleration?Balloon rupture at 5 m is a reason for flame acceleration?
Total flame wrinkling Total flame wrinkling factor is about 5,factor is about 5,of which RNG SGSof which RNG SGSis only Sis only Stt/S/Suu=1.2=1.2

Pressure dynamics 1Pressure dynamics 1
Time, s
Pre
ssu
re, P
a
0 0.1 0.2 0.3 0.4 0.5 0.6 0.7 0.8-10000
-8000
-6000
-4000
-2000
0
2000
4000
6000
8000
10000
R=2 mExperimentSimulation
Time, s
Pre
ssu
re, P
a
0 0.1 0.2 0.3 0.4 0.5 0.6 0.7 0.8-10000
-8000
-6000
-4000
-2000
0
2000
4000
6000
8000
10000
R=5 mExperimentSimulation
Time, s
Pre
ssu
re, P
a
0 0.1 0.2 0.3 0.4 0.5 0.6 0.7 0.8-10000
-8000
-6000
-4000
-2000
0
2000
4000
6000
8000
10000
R=8mExperimentSimulation
Time, s
Pre
ssu
re, P
a
0 0.1 0.2 0.3 0.4 0.5 0.6 0.7 0.8-10000
-8000
-6000
-4000
-2000
0
2000
4000
6000
8000
10000
R=18 mExperimentSimulation
Flame zone: 2 m, 5 m, 8 m, 18 mFlame zone: 2 m, 5 m, 8 m, 18 m
Gauge affected
by combustion
Gauge affected
by combustion
Gauge affected
by combustion

Pressure dynamics 2Pressure dynamics 2
Far-field: 35 m, 80 mFar-field: 35 m, 80 m
Time, s
Pre
ssu
re, P
a
0 0.1 0.2 0.3 0.4 0.5 0.6 0.7 0.8-10000
-8000
-6000
-4000
-2000
0
2000
4000
6000
8000
10000
R=35 mExperimentSimulation
Time, s
Pre
ssu
re, P
a
0 0.1 0.2 0.3 0.4 0.5 0.6 0.7 0.8-10000
-8000
-6000
-4000
-2000
0
2000
4000
6000
8000
10000
R=80 mExperimentSimulation
Similar to experiment:Similar to experiment: the positive pressure wave was followed by a negative the positive pressure wave was followed by a negative pressure phase. Usually the negative pressure wave was pressure phase. Usually the negative pressure wave was somewhat shorter than the positive one providing larger somewhat shorter than the positive one providing larger negative pressure peak.negative pressure peak.

ConclusionsConclusions• The Ulster LES model has been applied to study the dynamics
of the largest unconfined deflagration of stoichiometric
hydrogen-air mixture. The model has no adjustable parameters
and reasonably reproduced the experimental data on dynamics
of flame and pressure wave propagation.
• Effects of the hydrodynamic flow instabilities and the turbulence
induced by turbulent flame front itself on the burning velocity
acceleration are accounted separately in the model. It is
demonstrated that the main contributor to the turbulent flame
propagation is the turbulence generated by flame front itself.
• Further studies have to model under resolved fractal structure
of large-scale flames to reproduce in more detail the observed
monotonous acceleration of the flame front.


