Hydrodynamic Modeling: application of Delft3D … / 2014 . Author: Ph.D. SILENE CRISTINA BAPTISTELLI...
14
May / 2014 Author: Ph.D. SILENE CRISTINA BAPTISTELLI Presented by: Prof. Dr. TOBIAS BLENINGER Hydrodynamic Modeling: application of Delft3D-FLOW in Santos Bay, São Paulo State, Brazil International Conference on Desalination, Environment and Marine Outfall Systems
Transcript of Hydrodynamic Modeling: application of Delft3D … / 2014 . Author: Ph.D. SILENE CRISTINA BAPTISTELLI...

May / 2014
Author: Ph.D. SILENE CRISTINA BAPTISTELLI
Presented by: Prof. Dr. TOBIAS BLENINGER
Hydrodynamic Modeling: application of Delft3D-FLOW in Santos Bay, São Paulo State,
Brazil
International Conference on Desalination, Environment and Marine Outfall Systems
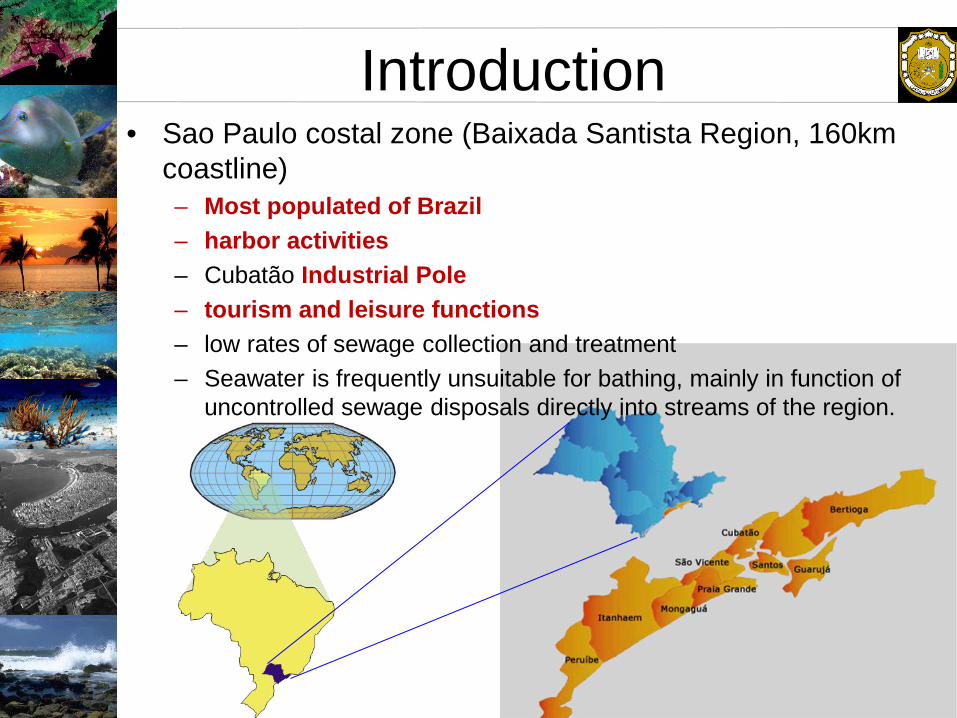
Introduction • Sao Paulo costal zone (Baixada Santista Region, 160km
coastline) – Most populated of Brazil – harbor activities – Cubatão Industrial Pole – tourism and leisure functions – low rates of sewage collection and treatment – Seawater is frequently unsuitable for bathing, mainly in function of
uncontrolled sewage disposals directly into streams of the region.

Study Area • All sewage goes to WWTP than to Santos Outfall:
– total length: 4,425 m – 425 m diffuser stretch: 79 risers, diameter: 0.24 m. – Two opposed ports with diameters of 0.11 m. – depth of discharge at aprox. 9.50 m – average flow is Qm = 3.34 m3 /s and maximum project is
Qmax = 5.3 m3 /s

Initial and boundary conditions, physical and numerical parameters used in modeling with DELFT3D
Horizontal spacing 300 m
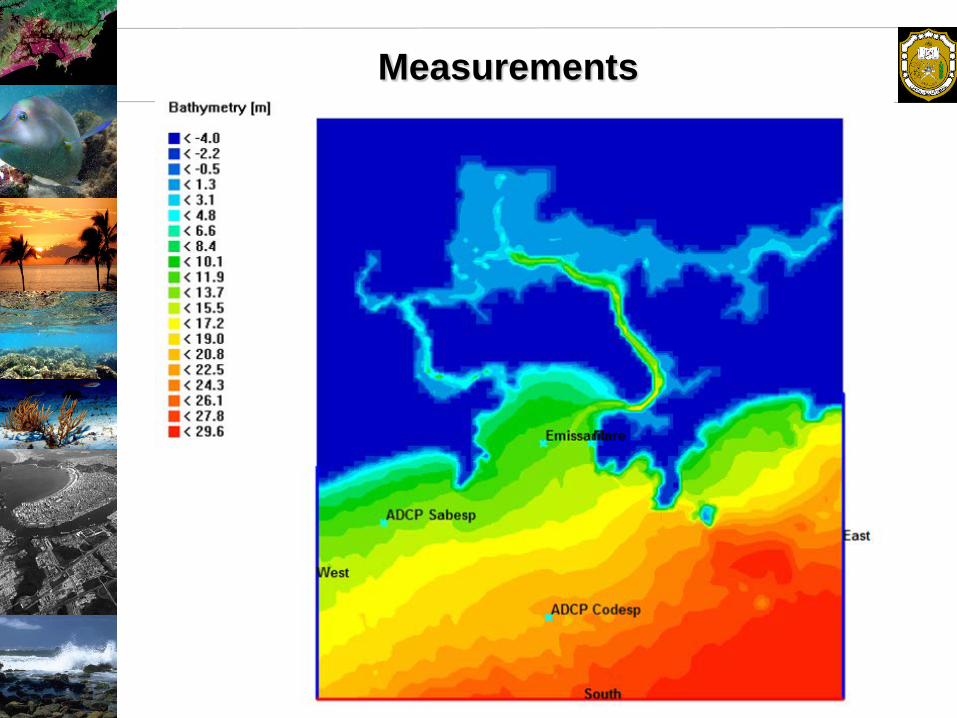
Measurements
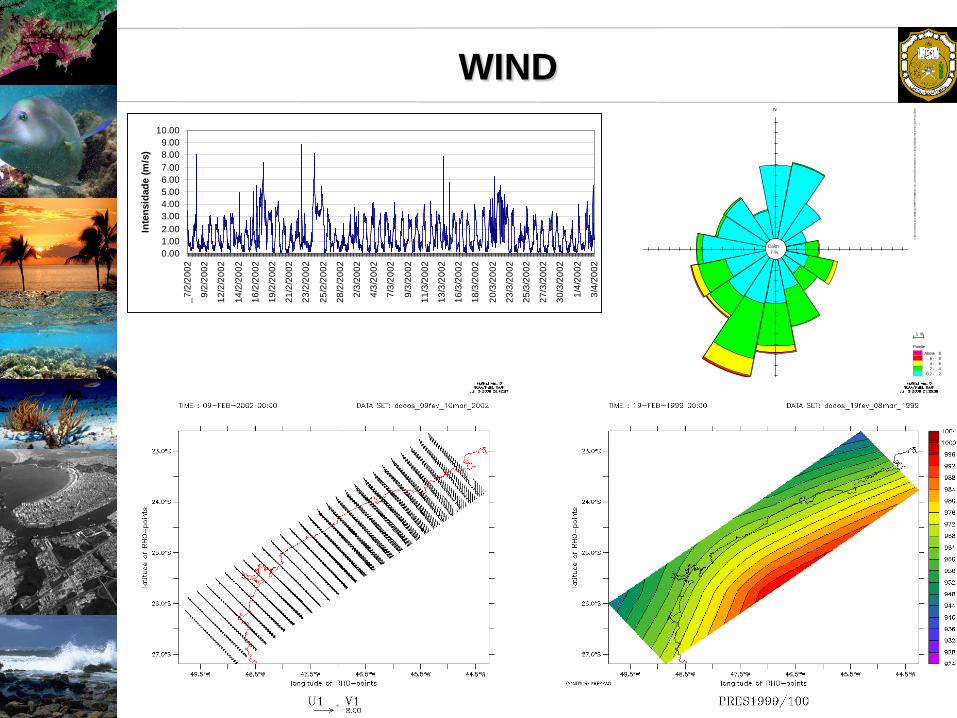
WIND
0.001.002.003.004.005.006.007.008.009.00
10.00
_7/2
/200
2
9/2/
2002
12/2
/200
2
14/2
/200
2
16/2
/200
2
19/2
/200
2
21/2
/200
2
23/2
/200
2
25/2
/200
2
28/2
/200
2
2/3/
2002
4/3/
2002
7/3/
2002
9/3/
2002
11/3
/200
2
13/3
/200
2
16/3
/200
2
18/3
/200
2
20/3
/200
2
23/3
/200
2
25/3
/200
2
27/3
/200
2
30/3
/200
2
1/4/
2002
3/4/
2002
Inte
nsid
ade
(m/s
)
PaletteAbove 8
6 - 84 - 62 - 4
0.2 - 2Below 0.2
C:\D
ocum
ents
and
Set
tings
\MAR
ITIM
A\M
eus
docu
men
tos\
Sile
ne\d
ados
de
cam
po\d
ados
de
vent
o_in
vern
o200
2.dN
1 %
Calm7 %

PaletteAbove 50
40 - 5030 - 4020 - 30
6 - 20Below 6
C:\D
ocum
ents
and
Set
tings
\MAR
ITIM
A\M
eus
docu
men
tos\
Sile
ne\d
ados
de
cam
po\d
ados
de
corr
ente
_inv
erno
2002
.dfs
0
N
2 %
Calm3 %
-0.500
0.000
0.500
1.000
1.500
2.000
2.500
_9/2
/200
2
11/2
/200
2
13/2
/200
2
15/2
/200
2
17/2
/200
2
18/2
/200
2
20/2
/200
2
22/2
/200
2
24/2
/200
2
26/2
/200
2
27/2
/200
2
1/3/
2002
3/3/
2002
5/3/
2002
7/3/
2002
8/3/
2002
10/3
/200
2
12/3
/200
2
14/3
/200
2
16/3
/200
2
18/3
/200
2
19/3
/200
2
21/3
/200
2
23/3
/200
2
25/3
/200
2
27/3
/200
2
Elev
ação
da
Supe
rfíc
ie (m
)
TIDES AND CURRENTS
TIDE
CURRENTS
0
20
40
60
80
100
.7/
11/2
005
10:
00
7/12
/05
11:0
0
7/13
/05
12:0
0
7/14
/05
13:0
0
7/15
/05
14:0
0
7/16
/05
15:0
0
7/17
/05
16:0
0
7/18
/05
17:0
0
7/19
/05
18:0
0
7/20
/05
19:0
0
7/21
/05
20:0
0
7/22
/05
21:0
0
7/23
/05
22:0
0
7/24
/05
23:0
0
7/26
/05
0:00
7/27
/05
1:00
7/28
/05
2:00
7/29
/05
3:00
7/30
/05
4:00
7/31
/05
5:00
8/1/
05 6
:00
8/2/
05 7
:00
8/3/
05 8
:00
8/4/
05 9
:00
8/5/
05 1
0:00
8/6/
05 1
1:00
8/7/
05 1
2:00
8/8/
05 1
3:00
8/9/
05 1
4:00
8/10
/05
15:0
0
8/11
/05
16:0
0
8/12
/05
17:0
0
8/13
/05
18:0
0
8/14
/05
19:0
0
Inte
nsity
(cm
/s)
Depth 1m Depth 5m Depth 10m
0
45
90
135
180
225
270
315
360
.7/
11/2
005
10:
00
7/12
/05
11:0
0
7/13
/05
12:0
0
7/14
/05
13:0
0
7/15
/05
14:0
0
7/16
/05
15:0
0
7/17
/05
16:0
0
7/18
/05
17:0
0
7/19
/05
18:0
0
7/20
/05
19:0
0
7/21
/05
20:0
0
7/22
/05
21:0
0
7/23
/05
22:0
0
7/24
/05
23:0
0
7/26
/05
0:00
7/27
/05
1:00
7/28
/05
2:00
7/29
/05
3:00
7/30
/05
4:00
7/31
/05
5:00
8/1/
05 6
:00
8/2/
05 7
:00
8/3/
05 8
:00
8/4/
05 9
:00
8/5/
05 1
0:00
8/6/
05 1
1:00
8/7/
05 1
2:00
8/8/
05 1
3:00
8/9/
05 1
4:00
8/10
/05
15:0
0
8/11
/05
16:0
0
8/12
/05
17:0
0
8/13
/05
18:0
0
8/14
/05
19:0
0
Dir
ectio
n (d
egre
e)
Depth 1m Depth 5m Depth 10m

Comparison between the results extracted from the simulation data and field measurements for surface elevation (tide).

RESULTS
Comparison between current
data field observations and simulation results with the Delft3D -
(Point 4) - Summer 2002 - Average
Speeds in Depth

Results Visualization - Flow of the currents of the period of July 29 to August 8
Conclusions
• The simulations with Delft3D showed that the results are satisfactorily in accordance with the field measurements data, demonstrating that the approach was appropriate for the study region.
• The forcing that determines the hydrodynamic in
Santos Bay is the tide. There are significant differences between ebb and flood periods and between syzygy and quadrature. Also, there are clear differences in the magnitude and direction of the surface currents and the currents in the other layers in depth.

In addition.... Despite the Santos Submarine Outfall to comply with the discharge conditions of the current legislation,
SABESP (Sanitation Company of State of São Paulo) has been studying a proposal for improving their performance, which assesses the increasing length of the outfall, an
attempt to identify a discharge point outside the center bay.
Current condition Extending 1 km
Extending 2 km

Current condition
Extending 2 km
Extending 1 km
Partial results of the study of environmental analysis of alternative
extension of the Santos outfall - SABESP 2013