Hydro Tasmania Annual Report 2015
128
annual report 2015
Transcript of Hydro Tasmania Annual Report 2015

annual report2015

cover image: Mrs Damcho Lhamo from Druk Green Power Corporation in Bhutan scaling the steps from the base of Gordon Dam (this page).
Mrs Lhamo and fourteen colleagues joined a training program delivered by the Entura clean energy and water institute. The group spent two weeks learning from Entura and Hydro Tasmania experts on hydropower technical and business leadership topics, as well as visiting our world class assets at Tarraleah, Tungatinah, Meadowbank, and Gordon power stations.

Directors’ statementTo the Honourable Matthew Groom MP, Minister for Energy, in compliance with the requirements of the Government Business Enterprises Act 1995.
In accordance with Section 55 of the Government Business Enterprises Act 1995, we hereby submit for your information and presentation to Parliament, the report of the Hydro-Electric Corporation for the year ended 30 June 2015. The report has been prepared in accordance with the provisions of the Government Business Enterprises Act 1995.
Grant Every-Burns Chairman, Hydro-Electric Corporation October 2015
Stephen Davy Director, Hydro-Electric Corporation October 2015
Hydro-Electric Corporation ABN 48 072 377 158

Our valuesWe put people’s health and safety first
We build value for our partners and customers through innovation and outstanding service
We behave with honesty and integrity
We work together, respect each other and value our diversity
We are accountable for our actions
We are committed to creating a sustainable future
Our visionAustralia’s leading clean energy business inspiring pride and building value for our owners, our customers and our people.

Contents
1Hydro Tasmania Annual Report 2015
The year at a glance .................................................................................................................................. 2
About this report ...............................................................................4
Material issues ...................................................................................5
Independent Assurer’s Statement .............................................6
Statement of Corporate Intent ....................................................9
Message from the Chairman
and Chief Executive Officer ..........................................................13
Economic............................................................................................17
Governance .......................................................................................21
Customers ..........................................................................................27
Infrastructure and resources .......................................................31
Environment ......................................................................................35
Community ........................................................................................39
People..................................................................................................43
Financial report ................................................................................45
Statistical summaries ................................................................... 112
Acronyms and glossary ............................................................... 117
Index .................................................................................................. 119
Global Reporting Index ............................................................... 121
2015

Achievements• Celebrating Hydro Tasmania’s
centenary with our community
• Financial performance better than forecast in a challenging market environment with a result before fair value of $62 million
• A business-wide cost saving initiative, resulting in over 100 ideas each with a saving of at least $20 000
• Successful contract renegotiation with all four of our major industrial customers in Tasmania
• More than $70 million capital expenditure on generation assets
• Signing of an agreement with Shenhua Group to investigate the construction of a small test site for Chinese wind turbine technology
• Signing of a Memorandum of Understanding between Entura and leading Chinese power and design consultants HydroChina, building on the skills and reputation of both parties
• Entura’s customer satisfaction in the top quartile of professional business service providers
• Diversification of Momentum Energy into selling gas in Victoria
• Hybrid Off-Grid Solutions team providing innovative low-emissions energy systems to remote areas, including Flinders Island and Coober Pedy
• Commencement of operation of Neusberg Power Station in South Africa
• The discovery in Woods Lake of the threatened fish Paragalaxias mesotes, previously thought to be locally extinct
Challenges• Managing difficult National Electricity
Market conditions, with depressed wholesale prices and intense retail competition
• Uncertainty in national renewable energy and climate change policies
• Restructuring the business to achieve improved customer outcomes
• Plateau in safety statistics (four lost time injuries), despite improved safety behaviour
• Entura continuing to compete in a challenging consulting market
• Low inflows to our water storages in the first half of the year, resulting in lower electricity generation
• Our decision not to proceed with the TasWind project on King Island due to economic factors
Awards• Momentum Energy won the Canstar
Blue Most Satisfied Customers Award — Electricity Provider, Victoria
• Hydro Tasmania awarded the Australian Canoeing President’s Award for our support of canoeing
• Hydro Tasmania’s Helen Locher recognised for her contribution to the hydropower industry as a joint winner of the International Hydropower Association 2015 Mosonyi Award for Excellence in Hydropower
The year at a glance
Left to right: Richard McClelland (Canstar Group Executive), Paul Geason (Managing Director of Momentum Energy), Jennifer Speed (Customer Care Manager of Momentum Energy) and Megan Doyle (Canstar Blue Business Unit Leader & Group Strategy Manager)
2 Annual Report 2015 Hydro Tasmania

$62 millionFINAL RESULT OF
+37Entura’s customer
satisfaction is in the top quartile of professional
business service providers
Momentum launching gas to Victoria (duel fuel)
>$120 million
New hybrid off-grid projects at Coober Pedy and on Flinders Island
solar flywheelwind
~180 times low
er emissions intensity com
pared to the National Electricity M
arket average
8 180GWh
Total generation
Staff volunteering % involvement
Total energy in storage at 1 July 2015
56.7%of spending on local suppliers
24.5
Lost-time injuries
increase from 4.52 last year
14.6Safety reporting index
29.6%
>$120m spent on our hydro-power assets
3Hydro Tasmania Annual Report 2015

Edgar Dam
4 Annual Report 2015 Hydro Tasmania
About this reportThis is Hydro Tasmania’s tenth annual report that integrates financial, environmental and social performance. It covers the financial year from 1 July 2014 to 30 June 2015.
This report provides a succinct summary of our performance, adhering to standards set by the Global Reporting Initiative (GRI) G4 guidelines and associated electric utility sector supplement. The structure of the annual report is aligned with the seven principles of Hydro Tasmania’s Sustainability Code outlined at the start of each chapter. A measure of our performance against the sustainability indicators for each principle is presented within each chapter as well as elsewhere in the report and on our website as appropriate. A full index of our GRI indicators can be found on page 121.
The Statement of Corporate Intent is an integral part of the report, providing background information about Hydro Tasmania, our operating environment and strategic direction.
Our primary audience is the people of Tasmania because this is where our operations have the most significant impact. Other stakeholder groups—those interested in our organisation and this report—are listed on page 40.
Our sustainability visionHydro Tasmania is Australia’s leading clean energy business; we believe that being committed to sustainability and acting sustainably makes good business sense. Our commitment is drawn from our values and our Sustainability Code, and is used to frame business activities, policies and procedures.
Sustainability drives our planning, as we consider the legacy we leave for future generations. Our chosen markets are undergoing significant change and, as a result, we incorporate resilience and adaptation within our approach to sustainability. Our long-held culture of innovation and future thinking will be crucial in navigating both imminent challenges and those beyond the horizon.
Measuring sustainability performanceHydro Tasmania’s sustainability performance indicators are selected from the GRI sustainability reporting standard and focus on our material issues. We identify issues material to external stakeholders and customers of the Hydro Tasmania group through media monitoring reports, surveys (suppliers, community and customers) and Tasmanian parliamentary committee hearings on Government Business Enterprises. Issues for internal stakeholders are sourced from executive interviews, risk management plans and employee surveys. Priorities are determined by assessing both frequency and significance of these issues to stakeholders.
The material issues are listed on page 5. Read more about the process for defining material issues at www.hydro.com.au/about-us/sustainability.
AssuranceAssurance provides a valuable source of feedback for improvement in Hydro Tasmania’s business performance, processes and systems, and greater confidence for our readers that our reporting is accurate, transparent and balanced. Hydro Tasmania engaged KPMG to conduct a limited assurance engagement in accordance with the Assurance Standard ASAE3000 in respect to certain elements of the report. The report arising from KPMG’s engagement is enclosed on page 6.
Application of the Global Reporting InitiativeHydro Tasmania has assessed that this report conforms to the ‘in accordance, core’ level of GRI reporting.
See the full GRI index on page 121.

Family fishing on Woods Lake. (Image courtesy of IFS)
5Hydro Tasmania Annual Report 2015
Table 1: Material issues for 2014–15Sustainability Code principle Material issue Source (internal/external) Page
Economic Our financial sustainability Internal and external 17
Climate change policy Internal and external 19
Governance and processes Managing our risk profile Internal 21
Shareholder and strategic relationships External 21
Information and knowledge management systems and process improvements
Internal and external 21
Customers Becoming a customer-focused utility of the future Internal and external 27
Momentum Energy’s branding and marketing activities External 27
Engaging with major industrial customers in Tasmania Internal and external 29
Entura’s depth of capability and unique offerings External 28
Infrastructure and resources Investment in renewable energy - TasWind decision and the Flinders Island Hybrid Energy Hub
External 31
Ensuring the sustainability of our asset portfolio Internal and external 31
Lake level management External 32
Environment Environmental and heritage stewardship Internal and external 35
Community Working closely with suppliers and contractors Internal and external 41
Engaging with our community Internal and external 39
People Changes to business structure Internal and external 43
Improving our safety habits Internal and external 43
Material issues

Independent limited assurance report to the Directors of the Hydro-Electric Corporation
Scope
We have undertaken a limited assurance engagement in relation to certain Global Reporting Initiative (GRI) indicators for Electric Utilities, incorporated into the Hydro-Electric Corporation’s (the Company) annual report for the year ended 30 June 2015.
Our procedures have been limited to reporting on the following nominated GRI indicators that have been identified by Management:
Indicator Report referenceG4 - 10 Workforce reporting Page 115
G4 - 24 Provide a list of stakeholder groups engaged by the organisation Page 40
G4 - EC9 Proportion of spending on local suppliers at significant locations of operation Page 41
G4 - EN8 Total water withdrawal by source Page 33
G4 - LA6 Type of injury and rates of injury, occupational diseases, lost days and absenteeism, and total number of work related fatalities by region and gender
Page 44
G4 - DMA Contingency planning measures, disaster/emergency management plan and training programs and recovery/restoration plans
Page 21
G4 - PR4 Total number of incidents of non-compliance with regulations and voluntary codes concerning product and service information and labelling, by type of outcomes
Page 29
G4 EU30 Average plant availability factor by energy source and by regulatory regime Page 33
We have not been engaged to provide an assurance opinion on any other GRI indicators that have been reported upon within the annual report.
Directors’ responsibility for preparation of the GRI indicators
The Directors of the Company are responsible for the measurement and presentation of the selected indicators including that the basis of measurement of each indicator is appropriate to meet their and the intended users’ needs. The responsibilities of the Directors also includes such internal control and processes as the Directors determine is necessary to enable the measurement and presentation of the indicators are free from material misstatement whether due to fraud or error.
Our responsibility
Our responsibility is to express a conclusion to the Directors on the measurement and presentation of the GRI indicators identified in the Scope section above.
We have performed our work in accordance with the Standard on Assurance Engagements ASAE 3000 Assurance Engagements Other than Audits or Reviews of Historical Financial Information, including complying with relevant ethical requirements relating to assurance engagements and planning and performing the engagement to obtain limited assurance whether the measurement and presentation of the GRI indicators identified above are free from material misstatement.
The procedures selected depend on our judgement, including the assessment of the risks of material misstatement of each indicator whether due to fraud or error. In making those risk assessments, we have developed an understanding of internal controls and processes relevant to the measurement and presentation of the
indicators in order to design assurance procedures that are appropriate in the circumstances, but not for the purposes of expressing a conclusion on the effectiveness of relevant internal controls.
Our procedures included obtaining an understanding of the internal controls and processes used to measure the indicators, to determine that the basis of preparation for each indicator is appropriate to meet their and the intended users’ needs.
A limited assurance engagement consists of making enquiries, primarily of persons responsible for the relevant activity addressed by each indicator, and applying analytical and other limited assurance procedures. These procedures have been undertaken to form a conclusion whether we have become aware of any matter that would lead us to believe that, in all material respects, each indicator has not been prepared and presented in accordance with the Regulatory Principles contained in the Global Reporting Initiative G4 Sustainability Reporting Guidelines – Implementation Manual.
6 Annual Report 2015 Hydro Tasmania

The procedures performed in a limited assurance engagement vary in nature and timing from, and are less in extent than for, a reasonable assurance engagement and consequently the level of assurance obtained in a limited assurance engagement is substantially lower than the assurance that would have been obtained had a reasonable assurance engagement been performed. Accordingly, we do not express a reasonable assurance opinion.
Inherent limitations
Because of the inherent limitations of any internal control structure, it is possible that errors or irregularities may occur and not be detected. Our limited assurance engagement is not designed to detect all weaknesses and errors in the measurement of the GRI indicators indicated above, as the engagement has not been performed continuously throughout the period and the procedures performed on the indicators were undertaken on a test basis.
Any projection of our conclusions and associated compliance with the GRI reporting principles to future periods is subject to the risk that the procedures may become inadequate because of changes in conditions, or that the degree of compliance with policies or procedures may deteriorate.
Our independence and quality control
In conducting our limited assurance engagement, we have complied with the independence requirements of the Accounting Professional and Ethical
Standards Board. In accordance with Auditing Standards (ASQC 1) Quality Control for Firms that Perform Audits and Reviews of Financial Reports and Other Financial Information, and Other Assurance Engagements, we maintain a comprehensive system of quality control including documented policies and procedures regarding compliance with ethical requirements, professional standards and applicable legal and regulatory requirements.
Basis for qualified conclusion
In Tables 17 and 18 on page 44 of the Annual Report, the Company does not comply with the GRI reporting requirements for G4-LA6 Type of injury and rates of injury, occupational diseases, lost days and absenteeism, and total number of work related fatalities by region and gender. As indicated in footnotes ‘b’ and ‘c’ to Table 17 and explanatory notes in Table 18, the Company’s non-compliance arises from:
• Failure of the Company to capture relevant data to provide required region and gender statistics.
• The use of an alternate methodology to calculate the presented lost time injury frequency table.
• The non-inclusion of the absentee rate for external contractors.
ConclusionThe limited assurance conclusion expressed in this report has been formed on the above basis.
Based on the procedures we have performed and the evidence we have obtained, except for the effects of the matter described in the ‘Basis for qualified conclusion’ paragraph, nothing has come to our attention that causes us to believe that, in all material respects, the Company has not measured and presented the GRI indicators identified in the Scope section above in accordance with the GRI Reporting Principles contained in the Global Reporting Initiative G4 Sustainability Reporting Guidelines – Implementation Manual for the year ended 30 June 2015.
Basis of preparation and restriction on distribution and use
The GRI indicators identified in the Scope section of this report have been selected, measured and reported by the Directors of the Company to inform users of its annual report of appropriate sustainability measures relevant to material issues to their needs. As a result these indicators may not be suitable for another purpose. We disclaim any assumption of responsibility for any reliance on this report, or on the indicators to which it relates, for any other purpose than that for which it was prepared.
KPMG
Hobart
17 September 2015
7Hydro Tasmania Annual Report 2015

8 Annual Report 2015 Hydro Tasmania

Opposite page: Penstocks feeding Tarraleah Power Station
Figure 1: Hydro Tasmania’s ownership structure
100% owned or controlled entities:• AETV Pty Ltd• Bell Bay Three Pty Ltd• Bell Bay Power Pty Ltd• Entura Hydro Tasmania India
Private Limited• HT Wind Developments Pty Ltd• HT Wind Operations Pty Ltd• Hydro Tasmania Consulting (Holding)
Pty Ltd• Hydro Tasmania Neusberg (Pty) Ltd
(92% owned entity)• Hydro Tasmania South Africa (Pty) Ltd• Lofty Ranges Power Pty Ltd• Momentum Energy Pty Ltd• RE Storage Project Holding Pty Ltd
25% joint ventures:• Kakamas Hydro Electric Power (RF)
(Pty) Ltd.• Woolnorth Wind Farm Holding Pty Ltd
Woolnorth JV subsidiary companies:• Musselroe Holdings Pty Ltd• Musselroe Wind Farm Pty Ltd• Woolnorth Bluff Point Wind Farm
Pty Ltd• Woolnorth Studland Bay Wind Farm
Pty Ltd• Woolnorth Wind Farm Finance Holding
Pty Ltd• Woolnorth Wind Farm Finance Pty Ltd
State of Tasmania
Hydro-Electric Corporation trading as Hydro Tasmania
50% joint ventures:• Cathedral Rocks Construction
and Management Pty Ltd • SA Water Corporation and
Lofty Ranges Power Pty Ltd (unincorporated joint venture)
The Board Corporation Secretary
Figure 2: Hydro Tasmania’s business structure
Chief Executive Officer
Corporate & People Services
Assets and Infrastructure
Information, Processes &
Systems
Strategy & Market
Development
Wholesale Energy
Services
Momentum Energy Entura
Hydro Tasmania is the trading name of the Hydro-Electric Corporation, an integrated energy business owned by the State of Tasmania. The Minister for Energy has portfolio responsibility for Hydro Tasmania. Hydro Tasmania operates under the Government Business Enterprises (GBE) Act 1995 and the Hydro-Electric Corporation Act 1995. The GBE Act requires Hydro Tasmania to prepare a Statement of Corporate Intent each year which provides an overview of the business and our strategic direction.
Our businessHydro Tasmania’s principal purpose is to ‘efficiently generate, trade and sell electricity in the National Electricity Market (NEM)’. Our principal objectives are to perform our functions and exercise our powers to:
• be a successful business by operating in accordance with sound commercial practice and as efficiently as possible
• achieve a sustainable rate of return that maximises value for the State of Tasmania in accordance with the Corporate Plan and having regard to the economic and social objectives of the state.
Building on 100 years of experience in the electricity industry, the Hydro Tasmania group operates as one business focused on delivering value to our customers through our three brands: Hydro Tasmania (electricity generation and trading),
Statement of Corporate IntentMomentum Energy (retail) and Entura (professional services). Each brand operates as part the integrated group to deliver the business strategy, enhance value and mitigate strategic risks so that Hydro Tasmania can deliver sustainable
financial returns to the Tasmanian Government.
The ownership structure of the Hydro-Electric Corporation is shown in Figure 1 and business structure is shown in Figure 2.
9Hydro Tasmania Annual Report 2015

Lower Lake Margaret Mini Hydro
MusselroeWind Farm
Studland BayWind Farm
WhitemarkPowerStation
King Island Advanced Hybrid Power Station
Reece
BURNIE
DEVONPORT
LAUNCESTON
HOBART
Paloona
Devil's GateTrevallyn
Poatina
Lake Margaret
John Butters
Butlers Gorge
Gordon
Meadowbank
ClunyRepulseCatagunya
WaytinahLiapootah
TungatinahLake Echo
Tods Corner
RowallanFisher
WilmotWilmot
Lemonthyme
BastyanMackintosh
Tods Corner
Reece Bastyan
John Butters
PoatinaTributeTribute
Gordon
Lake Margaret
Lower Lake Margaret Mini Hydro
Devil's GateTrevallyn
Liapootah
Tungatinah
Mackintosh
Meadowbank
Paloona
Lemonthyme
Lake Echo
CatagunyaCluny
Butlers Gorge
CethanaCethana
Fisher
Waytinah
TarraleahTarraleah
Rowallan
Repulse
GordonGordon
DerwentDerwent
KingKing
PiemanPieman MerseyForthMerseyForth
SouthEsk
SouthEsk
ParanganaMini HydroParanganaMini Hydro
WhitemarkPowerStation
DEVONPORT
BURNIE
LAUNCESTON
HOBART
MusselroeWind Farm
Studland BayWind Farm
King Island Advanced Hybrid Power Station
NieteranaMiniHydro
NieteranaMiniHydro
Blu� PointyWind FarmBlu� PointWind Farm
Tamar ValleyPower StationTamar ValleyPower Station
Storages volume (GL)
< 5050 to 100100 to 500500 to 5000> 5000
0 5025
Kilometres
Power Stations Joint venture partnershipHydro-electric district
Key
Our operationsHydro Tasmania’s main business is the generation of electricity from 30 hydropower stations and one gas-powered station and the sale of this electricity in the National Electricity Market. In 2015, 99.6 per cent of electricity generated was from hydropower and 0.4 per cent was from gas. Off-grid, the Bass Strait islands’ electricity supply is generated from diesel, wind and solar. Hydro Tasmania is Australia’s largest water manager, responsible for many significant lakes, rivers and smaller water bodies in six large catchments covering 35 per cent of Tasmania’s land area (Figure 3).
Momentum Energy is based in Melbourne and sells electricity and energy services to business and residential customers in Victoria, South Australia, the Australian Capital Territory, Queensland and New South Wales, and gas to customers in Victoria. Momentum Energy provides retail services to the Bass Strait islands. We also operate a telesales centre in Tasmania, employing 25 people.
Woolnorth Wind Farm Holding Pty Ltd is a joint venture with Shenhua Clean Energy Holdings Pty Ltd (owned by Chinese energy company Shenhua Group). Our share is 25 per cent. The joint venture owns the Studland Bay, Bluff Point and Musselroe wind farms, with a combined generating capacity of 308 MW.
Entura provides engineering, scientific and management services relating to water management and energy supply to national and international clients as well as to Hydro Tasmania for operational and capital programs associated with our generation infrastructure and developments. Based at Cambridge in Tasmania, Entura has offices in Melbourne, Brisbane, India and South Africa and project offices in South Australia and the Northern Territory. Entura’s international work extends across the Pacific Islands (including Papua New Guinea), New Zealand, Southeast Asia, South Asia (principally India and Nepal) and southern Africa.
Strategic challenges Hydro Tasmania operates in the highly dynamic and competitive NEM, which is undergoing a period of significant transformation. After a period of strong financial performance and record returns to Government, Hydro Tasmania is facing a period of reduced profitability largely arising from a number of external factors. These factors include:
• declining electricity demand and surplus supply in NEM
• changes in the Australian gas industry
• a highly competitive national market for electricity generation and retail
• changing customer preferences
• uncertainties and change in national renewable energy and climate change policies
• subdued national market for consultancy services.
Figure 3 - Hydro Tasmania’s Tasmanian operations
10 Annual Report 2015 Hydro Tasmania

Our strategic directionHydro Tasmania’s vision is to be Australia’s leading clean energy business, inspiring pride and building value for our owners, our customers and our people. Our strategy seeks to deliver on this vision by providing profitable revenue growth, ensuring a customer-first approach and maintaining our renewable energy generation assets for future generations.
Our strategy continues to evolve to ensure we can respond flexibly to the rapidly changing operating environment. We will pursue profitable revenue growth by increasing the value of our customer base in electricity, gas and energy services, and by reducing costs while continuing to manage business risks. Hydro Tasmania will continue to work closely with the Tasmanian Government to ensure we are as efficient as possible to assist the Tasmanian Government achieve its vision of restoring energy as a competitive advantage for Tasmania.
While our main focus will always be to meet the needs and expectations of our Tasmanian customers, our mainland retail brand Momentum Energy will continue to create value for all Tasmanians as we grow customer numbers on the mainland.
Hydro Tasmania is also pursuing emerging opportunities in hybrid off-grid solutions. Our King Island Renewable Energy Integration Project integrates technologies including wind, solar, energy storage, flywheels, dynamic load control and the use of biofuels, all managed by a fully automated proprietary control system. We will soon start work on developing a “Hybrid Energy Hub” on Flinders Island that will significantly increase renewable energy use on the island and reduce the use and importation of diesel. There is an international need for these renewable technologies to alleviate one of the world’s great challenges – energy poverty. The technological advancements developed for the King Island Renewable Energy Integration Project position Hydro Tasmania well to take advantage of these opportunities.
Table 2: Forecast key performance indicators
Key performance indicators (KPIs)
2015-16 2016-17 2017-18 2018-19
Financial IndicatorsResults before fair value movements and revaluations
$31m $50m $50m $80m
Capital expenditure Capital expenditure to be at or below budgetSatisfactory external validation of the ten year asset
management plan
Return on equitya 0.68% 1.68% 1.67% 2.68%
Cost savings target Non-customer
facing OPEX less than
$148m
Non-customer facing OPEX to increase at less than CPI
Retail profit before tax Profit before tax >=
budget
Profit before tax greater than previous year
Non-financial IndicatorsLost time injury 0
Employee engagement score Maintain engagement scores in the top quartile of the national benchmark
Hydro generation availability Availability target of 80% achieved
Regulatory compliance obligations
Zero breaches resulting in enforced regulatory undertakings or penalties
Returns to government (cash)Ordinary dividendb $25m $19m $31m $31m
Total other returns to government
$17m $20m $31m $25m
Total returns to government $42m $39m $62m $56m
a This calculation reflects Net Profit after Tax divided by Total Equityb Represents the dividend paid in the period, relating to performance in the previous period
The success of our business is underpinned by our people, the effective management of Hydro Tasmania’s water resource and generation assets, and the systems and processes in place to support our business operation. Efficiencies in each of these areas are an essential part of our strategy and we are committed to
making improvements in each of these areas so Hydro Tasmania can continue to be Australia’s leading clean energy business.
Key Performance Indicators for the business for the next five years are set out in Table 2.
11Hydro Tasmania Annual Report 2015

Directors’ Statement of Corporate Intent and Agreement of Shareholding Ministers
Key performance indicators (KPIs) 2015-16
Financial Indicators Results before fair value movements and revaluations $31 million
Capital expenditure Capital expenditure to be at or below budgetSatisfactory external validation of the ten year asset management plan
Return on equitya 0.68%
Cost savings target Non-customer facing OPEX less than $148m
Retail profit before tax Profit before tax >= budget
Non-financial IndicatorsLost time injury 0
Employee engagement score Maintain engagement scores in the top quartile of the national benchmark
Hydro generation availability Availability target of 80% achieved
Regulatory compliance obligations Zero breaches resulting in enforced regulatory undertakings or penalties
Returns to government (cash) Ordinary dividendb $25 million
Total other returns to government $17 million
Total returns to government $42 milliona This calculation reflects Net Profit after Tax divided by Total Equityb Represents the dividend paid in the period, relating to performance in the previous period
This Statement of Corporate Intent has been agreed between:
G.V. Every-Burns Chairman Hydro Tasmania on behalf of the Board
Hon Peter Gutwein MP Hon Matthew Groom MP Treasurer Minister for Energy
In signing this Statement of Corporate Intent, the Board of Hydro Tasmania commits to the targets proposed for 2015-16 on a best endeavours basis, subject to section 24 of the GBE Act. The Board of Hydro Tasmania agrees to provide the Shareholding Ministers with information on progress against the targets included in this Statement of Corporate Intent, as required under the Reporting Guidelines.
12 Annual Report 2015 Hydro Tasmania

Message from the Chairman and Chief Executive Officer
This has been an important year for Hydro Tasmania, one in which we have gone to great lengths to reset the business for the future it faces. It was also a year in which we acknowledged the role that a century of hydropower development in Tasmania played in helping shape the state’s economy, culture and society.
In parallel with significant work to reshape and refocus our business, we have worked with the Tasmanian Government on implementing its Energy Strategy. Both of these areas of focus will help ensure that Hydro Tasmania can support Tasmania’s economy now and into the future while delivering appropriate returns to our shareholder, the Tasmanian Government.
Along with the rest of the energy industry, Hydro Tasmania is dealing with a market affected by a range of domestic measures designed to reduce energy sector emissions and a volatile global trading environment for the sector’s largest customers.
Demand for energy has flattened across the National Electricity Market, there has been prolonged uncertainty and change in national renewable energy and climate change policy, and new technologies are starting to change the way consumers choose to source energy.
Our response to these issues has been to simplify our business, focusing on delivering to customers in Tasmania and elsewhere, which has in turn required a critical examination of our portfolio of activities and of the way we have traditionally operated.
Left to right: Hydro Tasmania's Chairman Grant Every-Burns and Chief Executive Officer Stephen Davy
13Hydro Tasmania Annual Report 2015

During 2014, we undertook a major restructure of our operations. This restructure positions us better to anticipate and respond to emerging market trends, but with it came job losses and the uncertainty that accompanies major change. The management team has worked hard to bring our people along on this change journey, and to be as clear as possible about the immediate future we face.
FinancialHydro Tasmania achieved a result of $62.3 million (before fair value adjustment and revaluations) in 2014–15. This is a strong result given the subdued operating environment and was well above expectations. This is expected to result in cash returns to the Tasmanian Government in 2015–16 of $42 million, including a dividend of $25 million. However, the following year will be much tougher. The business benefited in 2014–15 from revenue from renewable energy certificates linked to higher than normal generation during the latter part of 2014. This will not be repeated in 2015–16.
Compared with 2013–14, we received less revenue in 2014–15. Wholesale electricity prices, including for small Tasmanian customers, were significantly lower ($10 to $20 per MWh) without the carbon price. Hydro generation volumes were 31.5 per cent lower than for 2013–14 due partly to a return to more usual generation levels following the end of the carbon price, but more as a result of significantly lower rainfall than expected. The total energy in storage at the end of the year was 29.6 per cent compared to 28.1 per cent at the same time the previous year.
Despite these factors, the financial result was significantly better than forecast a year ago. This reflects efficiencies gained from the business restructure, a concerted focus on cost savings, and reduced financial costs as a result of the equity injection made during the year by the Tasmanian Government.
Momentum Energy Momentum Energy, our wholly-owned energy retail business, has reported another successful year, with a profit before tax of $37 million. Momentum Energy has begun selling gas to Victorian customers, focusing on a campaign to attract or convert ‘dual fuel’ customers. Momentum’s excellence in customer service was acknowledged with the Canstar Blue Most Satisfied Customers Award — Electricity Provider, Victoria, no small achievement in one of the world’s most competitive energy markets.
EnturaA strong end to the financial year saw Entura deliver a net contribution to Hydro Tasmania’s underlying result well above the original budget. The final result of $930 000 was a significant turnaround from last year’s loss and is a credit to the work of the Entura management team and all Entura employees. The result was driven by their collective efforts to nurture, engage and deliver to clients, and by strong cost leadership. A highlight of the year for Entura was entering into a Memorandum of Understanding in November 2014 with Chinese energy company HydroChina. This partnership has already borne fruit in the form of a jointly-bid project win in Australia for an innovative pumped hydropower project and we are now examining a more formal joint venture. Entura continues to undertake highly valued work for domestic and international customers, and is well placed to participate in, and add value to, increased investment in hydropower projects throughout the Asia-Pacific region.
AssetsHydro Tasmania’s renewable energy asset base includes dams, gas and hydro-generation facilities across Tasmania, along with our equity share in Tasmania’s wind farms. Our 10-year Asset Management Plan ensures this portfolio receives adequate investment and maintenance to sustain its performance and to maintain a prudent risk management position. It is designed to ensure the productive capability of our assets for decades to come, providing a competitive advantage while leaving a sustainable legacy for the future. For 2014–15, capital and operating expenditure in the order of $120 million has been invested to refurbish and maintain the hydropower portfolio.
Of particular note was completion of the complex and innovative refurbishment of Rowallan Dam. The two-stage refurbishment involved strengthening the spillway walls and improving the capacity of the dam to withstand large floods. It was the first time that a project of this complexity has been successfully undertaken on a live dam in Australia.
As outlined in the Tasmanian Energy Strategy, the Tasmanian Government has a target to increase energy production from existing hydropower assets by 10 per cent. Numerous opportunities to increase the output of the system have been identified, from capturing additional inflows to increasing generation efficiency. The 10-year Asset Management Plan may realise efficiency gains of approximately
two per cent in association with other core activities. In addition, we have worked with Tas Renewable Energy, a private consortium, to capture additional water for generation. Hydro Tasmania is also partnering with the State Government to look at the potential for a second electricity interconnector across Bass Strait. The project will assess the necessary pre-conditions under which a second interconnector would be viable.
Our community A highlight of 2014 was the celebration of the centenary of state-owned hydropower development in Tasmania. This milestone provided a series of opportunities to engage with the Tasmanian community and encourage people to share their ‘Hydro’ stories with us and the rest of the community. There was an enormous level of interest in the series of free events we hosted, particularly when we opened up our power stations for tours which attracted thousands of people.
Other significant activities in our community program included sustained involvement of our people in volunteering activities supporting community groups, and our partnership with Colony 47, which supports Mara House, a facility catering for vulnerable young Tasmanian women.
Our peopleWhile there has been a marked improvement in our Safety Reporting Index, it is disappointing not to have achieved our safety target of zero lost-time injuries. During the year there were four lost-time injuries, all of which were avoidable. Employees across Hydro Tasmania have this year participated in a behaviour-based safety program, SafeStart, and we are already seeing encouraging results in terms of safer workplace habits. It is our hope that these behavioural changes will become embedded in our business culture and will also transfer into the home lives of our people and their families.
InnovationHydro Tasmania and Entura continue to lead the way with development of energy solutions for remote and off-grid power systems. Building on the success of the world-leading King Island Renewable Energy Integration Project, we have started work on a similar hybrid energy system for Flinders Island that will increase renewable energy penetration and displace expensive diesel fuel. During the year we showcased this technology to
14 Annual Report 2015 Hydro Tasmania

Rowallan Dam refurbishment
energy providers throughout Australia and the Asia-Pacific region and we are actively working on a number of potential projects to deliver our solution in a tailored way to these clients.
The expertise of our people was also used in South Africa, with the Neusberg Hydropower Project commissioned in January 2015. Hydro Tasmania and Entura were involved in the entire lifecycle of the project, sharing valuable expertise from our own history in hydropower development, and taking advantage of a rare opportunity for our people to work on a dam construction project.
Contribution to the Tasmanian economyHydro Tasmania makes important contributions to the State, including the provision of secure electricity supply, returns to Government, support for Tasmanian businesses, employment, natural resource management and community support.
Of a total staff of more than 1050 at 30 June 2015, we currently employ 689 people in Tasmania, including 25 staff at Momentum Energy’s call centre at Cambridge. The business remains a significant purchaser of Tasmanian goods and services. In 2014–15 we spent $107 million with more than 900 Tasmanian suppliers.
During 2014–15 Hydro Tasmania entered into new arrangements with all four of our major industrial customers – Bell Bay Aluminium, Nyrstar, TEMCO and Norske Skog – which between them account for
approximately 55 per cent of Tasmania’s electricity load. The new arrangements will provide them with the confidence to invest in plant upgrades, stimulating regional economies.
ConclusionThe efforts of this past year are the result of commitment to the business by all our people. I would like to thank Hydro Tasmania’s management team, and all our employees, for their loyalty and contribution to the business through this challenging period.
Tasmania’s renewable energy will be a key advantage for the State and to Australia as the world moves towards lower-emissions economies. Hydro Tasmania will be well placed to benefit from this transition and to capitalise on the renewable energy opportunities that it will present, as long as we focus on delivering what is important to our customers, and on running our business efficiently.
Hydro Tasmania is, and will remain, an important contributor to Tasmania and a key part of a sustainable future for the State.
Stephen Davy Chief Executive Officer
I assumed the role of Chairman in 2014 as Hydro Tasmania celebrated 100 years of contribution to Tasmania and its people. The continuing value to Tasmania of the State’s hydropower assets is a testament to the ground-breaking innovation and back-breaking work of thousands of people over the past century. It is a privilege to work with the current directors and management and I thank them all for the skill and care they devote to Hydro Tasmania. I acknowledge the contribution of Dr David Crean, immediate past Chairman, who presided over a decade of growth and technological expansion of the business, including the undersea connection to the mainland. I look forward to the year ahead, confident that we can meet the challenges we face, for the benefit of our customers and our shareholders.
Grant Every-Burns Chairman
15Hydro Tasmania Annual Report 2015

16 Annual Report 2015 Hydro Tasmania
Hydro Tasmania’s business strategy is
focused on enhancing the value of our
existing assets in Tasmania

Meadowbank Power Station on full spill during its refurbishment
Opposite page: Woods Lake
17Hydro Tasmania Annual Report 2015
Our financial sustainabilityAfter a period of strong financial performance and record returns to government, Hydro Tasmania is facing a period of reduced profitability largely due to external factors. These include:
• the removal of the carbon price and continuing uncertainty about future carbon abatement policy in Australia,
• declining electricity demand and surplus supply in the NEM,
• changes in the Australian gas industry,
• a highly competitive market for electricity generation and retail,
• changing customer preferences,
• uncertainties and change in national renewable energy,
• climate change policies and
• reduced prices for electricity, including in Tasmania.
Hydro Tasmania actively monitors and manages the risks associated with these factors.
Hydro Tasmania’s business strategy is focused on enhancing the value of our existing assets in Tasmania by growing our mainland retail customer base in electricity, gas and energy solutions. This will allow the business to adapt to the rapidly changing market in which it operates and meet shareholder expectations. Substantial work has been undertaken to revise the business strategy to improve our financial sustainability.
Economic
Sustainability Code principlesWe make sound commercial and investment decisions in our chosen markets, to deliver long-term business value and meet shareholder expectations.
We leverage our low-carbon generation and competitive customer focus to create value for our shareholders, the people of Tasmania.

18 Annual Report 2015 Hydro Tasmania
Financial resultsHydro Tasmania delivered a result before fair value adjustment and revaluations of $62.3 million in 2014–15 (Table 3). This is a strong result given the subdued operating environment.
However, as expected, the result was lower than in the previous financial year. This financial year we received less carbon revenue, had much lower generation volumes and less revenue due to the wholesale price reduction to small Tasmanian customers. The lower hydropower generation is a result of significantly lower inflows over the early part of the financial year and reduced generation from the very high levels during the carbon price period. However, significant savings have been achieved in financing costs and the successful operation of our cost-saving initiatives.
Operating cash flows declined in 2014–15 to $25.5 million, down from $242.9 million in 2013–14. We are forecasting an improvement in our operating cash flow over the 2015–16 year.
Capital expenditures were $100 million in 2014–15, $18 million less than last year.
The total assets for the year were $5.2 billion compared with $5.0 billion in 2013–14. This increase was largely due to a reversal of previous impairments of Hydro Tasmania’s generation assets, reflecting an improvement in the forward outlook for profit compared with this time last year. This included better than expected performance on cost control and the optimisation of our AETV Pty Ltd assets.
Table 3: Financial results
Financial year ending 30 June 2011 $m
2012 $m
2013 $m
2014 $m
2015 $m
Result before fair value, impairment and tax
100.0 103.4 237.7 241.1 62.3
Profit/(loss) before tax 216.4 17.8a (248.5)a 182.7 183.5
Cash flow from operating activities 160.8 107.3 261.5 242.9 25.5
Net debt 964.0b 857.0 866.0 851.0 839.3
Weighted average cost of debt 7.18% 7.08% 6.88% 7.39% 6.67%
Capital expenditure 64.3 186.1 164.0 118.7 100.7
Other expansion and acquisitions 0 114.4c 0 0 0
Total assets 5507 5805 5123 5024 5195a Result before tax for 2012 and 2013 were adversely impacted by movements in the fair value of energy
derivatives, and in 2013 by the impairment of generation assets.b Significant increase because of the acquisition of $143.7 million of Roaring 40s debt following the end of
a joint venture with the CLP Group.c Musselroe Wind Farm construction.
Hydro Tasmania provides electricity services on the Bass Strait islands under a Community Service Obligation (CSO) funded by the Tasmanian Government. Retail services are provided by Momentum Energy. The CSO ensures that consumers on the Bass Strait islands receive electricity at a concessional and regulated price. In 2014–15 the net cost of the CSO to the Tasmanian Government was $9.6 million.
Returns to governmentTotal cash returns to government for 2014–15 were $211.5 million, a decrease of $23.9 million from 2013–14. This includes a dividend payment of $118.6 million, which was paid in 2014–15, but related to 2013–14 profit (Table 4).
Table 4: Returns to the Tasmanian Government (cash)
Financial year ending 30 June 2011 $m
2012 $m
2013 $m
2014 $m
2015 $m
Government guarantee fee 6.6 8.7 8.6 11.4 8.7
Income tax equivalent 16.2 54.8 52.8 103.9 80.1
Ordinary dividend a 25.5 49.0 50.7 116.0 118.6
Rates equivalent 3.3 3.5 3.6 3.8 3.9
Total returns 51.7 116.0b 115.7 235.4 211.5a Represents the dividend paid in the period, relating to performance in the previous period.b Excluding stamp duty of $9.9 million. Stamp duty is generally not included in returns to government. It is
specifically noted in 2012 as Hydro Tasmania was required to pay $9.9 million in relation to the sale of land associated with wind farms.

Clark Dam
19Hydro Tasmania Annual Report 2015
Climate change policyOn 17 July 2014, the Australian Senate passed legislation enacting the repeal of a price on carbon. The legislation included an obligation for electricity suppliers to pass on any cost savings to customers.
The energy sector accounts for approximately one-third of Australia’s annual emissions. Power generators were among the largest liable entities under the carbon price. The removal of the price on carbon means that emitters no longer face a charge for greenhouse gas emissions. This has resulted in lower wholesale electricity prices.
The Australian Government has replaced the price on carbon with the Direct Action Plan. The key mechanism under the plan is the Emissions Reduction Fund. The Direct Action Plan also involves ‘safeguard baselines’ above which businesses cannot increase their emissions without incurring a penalty. These will be set during the second half of 2015, along with post-2020 national emissions targets in the lead-up to the United Nations Conference of the Parties to the Framework Convention on Climate Change. Both safeguard baselines and post-2020 emissions targets are of key importance to the electricity sector.
Following agreement between the Australian Government and the Australian Labor Party, legislation was passed during June 2015 that amended the Renewable Energy Target (RET) from 41 000 GWh to 33 000 GWh and provided full exemption for electricity-intensive industries, including several Tasmanian industries.
Hydro Tasmania believes that the bipartisan agreement is a positive development for the renewable energy sector because it resolves the uncertainty that had stalled investment and depressed the price of Large-scale Generation Certificates. The removal of the legislated two-yearly RET review is an important and positive step in returning investment confidence to the sector. Hydro Tasmania’s extensive asset refurbishment and modernisation program is underpinned by the continuation of the RET and the incentives it creates to increase output, where possible, from existing hydropower assets.
Cost-saving initiativesHydro Tasmania has commenced a strategy to achieve significant operational cost savings by 2018–19. The majority of the savings were realised in 2014–15 through process improvements and efficiencies identified in a thorough operational review. Employees from across the business contributed ideas for cost savings, resulting in over 100 initiatives, each with a saving of at least $20 000.
Annual Report 2015 Hydro Tasmania 20
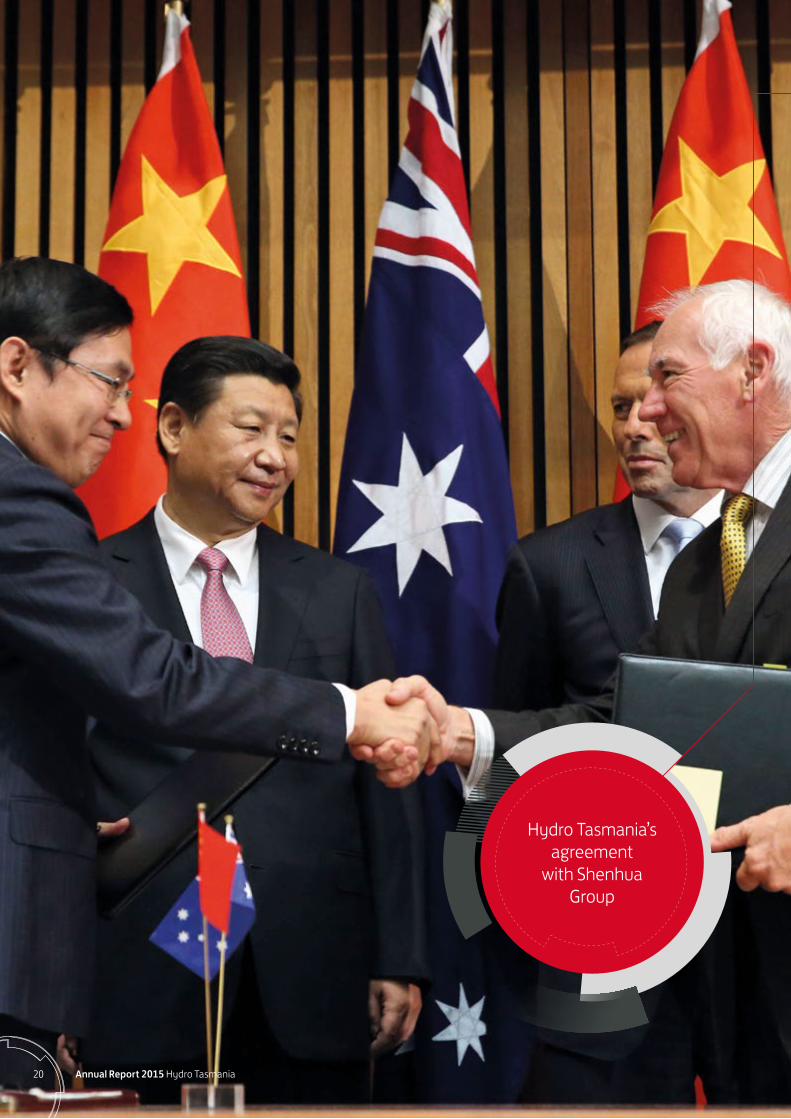
Hydro Tasmania’s agreement
with Shenhua Group

Opposite page: Hydro Tasmania Chairman Grant Every-Burns (right) with, from left, Shenhua Group Chairman Mr Zhang Yuzhuo, China’s President Xi Jinping and Prime Minister Tony Abbott.
Entura Managing Director Tammy Chu (left) with HydroChina Vice President Dr Chen Guanfu
21Hydro Tasmania Annual Report 2015
Governance
Managing our risk profileWe operate a health, safety and environment management system that takes a precautionary approach to minimise risks to our people. All contractors and staff of Hydro Tasmania are required to follow the processes outlined in the health, safety and environment system. The system enables us to manage our health and safety risks and to drive improvements.
Hydro Tasmania faces a variety of financial risks associated with trading electricity in the NEM and the management of our gas portfolio. While the retail business Momentum Energy represents a key strategy to mitigate our market risk, impending regulatory changes and well-publicised technology changes are likely to increase the challenges for Momentum Energy in the near future.
The Board’s Risk Management Committee reviews the risk register on a quarterly basis to ensure there are effective controls to mitigate significant risks and to monitor new and emerging risks.
We have made a number of changes to our emergency management, business continuity and disaster recovery programs over the past 18 months.
Sustainability Code principlesWe make our decisions within comprehensive governance and risk management frameworks while seeking to continually improve our business processes.
We make ethical decisions by applying our values, sustainability principles and Code of Ethical Behaviour, complying with relevant legislation and delivering on the commitments we make.
The framework of the Emergency Management Plan has been aligned to the emergency management processes of other Tasmanian energy supply businesses, which allows for effective management of incidents that are outside the scope of normal business operations. The plan focuses on managing threats to people, the environment, assets and reputation.
The business conducts a number of exercises each year to test our emergency response and recovery capabilities. A combined emergency management and business continuity exercise was conducted in December 2014, as well as a number of field exercise scenarios focused on our assets and infrastructure. Knowledge gained from these exercises has been incorporated into our systems and processes.
For more information on Hydro Tasmania’s management approaches including business resilience visit www.hydro.com.au/about-us/governance/management-approaches
Shareholder and strategic relationshipsWorking closely with the Tasmanian GovernmentWe continue to work closely with the Tasmanian Government and welcomed the release in May 2015 of the Tasmanian Energy Strategy. Hydro Tasmania is a key participant in Tasmania’s energy supply industry. We support the Tasmanian Government’s vision to restore Tasmania’s competitive advantage in energy generation in Australia through delivering affordable energy, empowering consumer choice, facilitating state growth and maximising renewable energy opportunities.
Working with HydroChinaHydro Tasmania’s professional services business Entura has signed a Memorandum of Understanding with leading Chinese power and design consultants HydroChina. The arrangement allows the businesses to co-operate on the development of opportunities in the energy and water sectors, including hydropower, other renewable energy, sustainability and environmental management and power transmission. The aim is to establish a long-term,
strategic co-operative relationship to build on the skills and reputation of both parties with a focus on the Asia–Pacific region.
HydroChina is a subsidiary of the Chinese Central Government enterprise PowerChina, which ranks 253 among the Fortune Global 500.
Agreement with Shenhua GroupIn November 2014 Hydro Tasmania and Shenhua Group Corporation Limited agreed to investigate the potential use of Chinese wind turbine generator technology in Australia. The agreement was announced at a ceremony attended by the Australian Prime Minister and the Chinese President in Canberra.
Information and knowledge management systemsHydro Tasmania has made a number of improvements to billing and customer management systems, including installation of an integrated communications and contact management system for Momentum Energy’s retail team. Momentum Energy’s entry into gas retailing was supported through system enhancements to billing, sales acquisition, the web-based sales comparison tool used by sales and customer service agents to provide electricity and gas quotes, and the implementation of an online sign-up system for gas sales.

22 Annual Report 2015 Hydro Tasmania
Our enterprise resource management system mysap has undergone a number of improvements. These are focused on achieving process efficiencies while improving employee capability through increased training and awareness sessions, improved user interfaces and building direct and indirect connections between end users and in-house system/process experts.
To meet our goals of customer centricity and cost leadership our systems need to be flexible, cost-effective and minimal risk. Cloud services provide a significant opportunity for excellence and innovation in this space. A key achievement of 2014–15 was the development of a cloud migration roadmap which identified which applications could be hosted externally to realise cost efficiencies and reduce the total cost of ownership while delivering service improvements to Hydro Tasmania and our customers. This aligns with industry best practice via analysing migration suitability, identification of key issues (risk, compliance, security, budget and technical) and associated mitigations. Initially, email services will be migrated to the cloud with further migrations planned in the coming year.
Hydro Tasmania has reviewed information security risks and has started implementing enhancements, including changes to terms of acceptable use of information technology, improved security monitoring and better protection against malicious software.
We have begun using data insights to improve our understanding of the drivers of Momentum Energy’s customer churn. We plan to develop a predictive model focused on customer churn and segmentation.
Data quality and integrity
Hydro Tasmania makes decisions based on sound analysis of large amounts of data. Our focus on the quality and integrity of our data supports our decision-making and our customer-centric approach.
During 2014–15 the Information Processes and Systems team worked towards better understanding of the data structures of our SAP systems to assist business decision-making. We also commenced work on an information governance initiative to understand the quality of Momentum Energy customer data and to improve the customer experience.
A new energy trading risk management system was implemented in December 2014, running in parallel with the legacy NemPower contract management system. The replacement system supports Hydro Tasmania’s wholesale energy trading and management of the associated risks.
The BoardGrant Every-Burns ChairmanGrant Every-Burns was appointed to the Board of Hydro Tasmania on 27 August 2012 and became Chairman of the Board on 13 October 2014. Mr Every-Burns brings more than 40 years of experience in the operation and maintenance of large power generation facilities. From 1996 to 2011 he was Chief Executive and Managing Director of Macquarie Generation, the nation’s largest producer of electricity in that period. He has previously held directorships of the National Safety Council of Australia and the Energy Supply Association of Australia. Mr Every-Burns holds an Honours degree in Electrical Engineering and is a fellow of the Australian Institute of Company Directors.
Stephen Davy Chief Executive Officer and Director Mr Davy was appointed Chief Executive Officer at Hydro Tasmania on 5 September 2013 and has been with the business since 2005. Mr Davy previously led the trading and market operations of the business. Prior to his arrival at Hydro Tasmania, Mr Davy worked at Eraring Energy in New South Wales and in the banking industry, trading and marketing currency and derivative products. Mr Davy is a Director of the Electricity Supply Association of Australia and also represents generators on the NEM Reliability Panel. Mr Davy has an Honours degree in Physics.
Saul Eslake DirectorMr Eslake was appointed to the Hydro Tasmania Board on 19 March 2008. Mr Eslake was formerly the Chief Economist at the Bank of America Merrill Lynch Australia. Prior to taking up this role he was a Program Director at the Grattan Institute. He was previously Chief Economist of Australia and New Zealand Banking Group (ANZ) for 14 years to July 2009. Mr Eslake was formerly the Chair of the Tasmanian Arts Advisory Board. He holds an Honours degree in Economics from the University of Tasmania and a post-graduate Diploma in Applied Finance and Investment, and has completed the Senior Executive Program at the Columbia University Graduate School of Business in New York. Mr Eslake is a Senior Fellow of the Financial Services Institute of Australia and a member of the Australian Institute of Company Directors.
The key objectives of this project were to provide a single view of our energy trading portfolio across wholesale and retail trading and to enable improved analytical tools for contract trading and position reporting.
Board and Executive performance evaluationIn 2012–2013 the Board commissioned an independent external provider to undertake an in-depth appraisal of the performance of the Board, Board Committees and Directors. During 2014 and 2015 the Board implemented recommendations from the evaluation process and is now in a position to annually assess its performance and that of its committees and individual Directors using quality object appraisal criteria.
Each director, including the Chairman, undergoes a formal performance evaluation, conducted by their peers, when their term of office is under consideration and they are seeking re-appointment. The Chairman provides continuous individual feedback on performance to each director and is also subject to periodic assessment by the directors. The Board Committees undertake self-assessment of their performance in accordance with their Terms of Reference, usually on an annual basis. Following annual self-assessments the Board will consider undertaking an external performance evaluation each fourth year.
Performance of the Chief Executive Officer and other senior executives is reviewed annually using robust, measurable and qualitative key performance indicators.
Director induction, education and training Each new Board member receives a Board induction pack and meets with the Executive and the Corporation Secretary for immediate dissemination of introductory information. Other information, similar to that referenced in the Guidelines for Tasmanian Government Businesses on Director Induction, Education and Training is provided in hard copy, where necessary. Access to the main governance, organisation and Board administration documents and reference materials is available through the Board computer and iPad application used by Hydro Tasmania Directors. This ensures that resources are up-to-date and at hand.
Ongoing training and education for directors is provided in-house or through external providers as required. This ensures that directors are informed of and understand all key developments relating to Hydro Tasmania’s business, and the industry and environment in which we operate.

The Board: From left, Stan Kalinko, Tessa Jakszewicz, Saul Eslake, Grant Every-Burns, Stephen Davy, Janine Healey
23Hydro Tasmania Annual Report 2015
Tessa Jakszewicz DirectorTessa Jakszewicz was appointed to the Board of Hydro Tasmania on 27 August 2012. Ms Jakszewicz is CEO of Landcare Australia Limited, an organisation which builds capacity for Landcare communities to better manage Australia’s crucial land and water assets. Ms Jakszewicz plays a lead role in promoting Landcare to government, business and the community. Prior to this she was Deputy CEO at the Antarctic Climate and Ecosystems Cooperative Research Centre and previously a General Manager at Telstra. Ms Jakszewicz has a Master of Business Administration from Macquarie University, a Master of Science from the University of Bath and a Bachelor of Science with Honours from the University of Sheffield. She is a fellow of the Australian Institute of Company Directors and brings to Hydro Tasmania wide-ranging commercial experience predominantly in general management, marketing and business development roles.
Stan Kalinko DirectorStan Kalinko was appointed to the Board on 25 June 2007. He has been a director of companies for many years, and, since his retirement from law on 30 June 2007, his main occupation has been as a director serving on the Boards of FSA Group Limited (a publicly-listed company), Indigenous Community Volunteers Limited, Seisia Enterprises Pty Ltd and the Central Synagogue. Mr Kalinko practised law for more than 30 years and was a merchant banker for six years. He has a Bachelor of Commerce, a Bachelor of Laws and a Higher Diploma in Tax. Mr Kalinko is an accredited mediator and a fellow of the Australian Institute of Company Directors.
Janine Healey DirectorJanine Healey was appointed to the Board on 9 September 2002. Currently a Director with Chartered Accountants, Ruddicks (Launceston, Tasmania), Ms Healey has wide-ranging commercial experience, particularly in the areas of commercial taxation advice, business structures, planning and cash flow management. Ms Healey has a strong history of community and commercial involvement in Tasmania, which includes serving on the Launceston Chamber of Commerce, the Audit Committee of the Port of Launceston Pty Ltd, the University of Tasmania Council, the Inveresk Railyard Development Authority, the Female Factory Historic Site Ltd and the Tasmanian Electronic Commerce Centre Pty Ltd. Her professional memberships include as a Certified Tax Advisor with the Taxation Institute of Australia, Fellow of the Institute of Chartered Accountants and Member of the Australian Institute of Company Directors. Ms Healey’s term as a director of Hydro Tasmania ended on 31 August 2015.

24 Annual Report 2015 Hydro Tasmania
Table 5: Board committee membership at 30 June 2015
Audit Committee
Risk Management Committee[Formerly Business Risk Committee]
Human Resources and Remuneration Committee
Janine Healey* Saul Eslake* Stan Kalinko*
Saul Eslake Grant Every-Burns Grant Every-Burns
Grant Every-Burns Janine Healey Janine Healey
Tessa Jakszewicz Stan Kalinko Tessa Jakszewicz
Stephen Davy[Appointed as a director 16 December 2014]
Stephen Davy[Appointed as a director 16 December 2014]
David Crean[Ceased in September 2014]
David Crean*[Ceased in September 2014]
David Crean[Ceased in September 2014]
*Committee Chair
Leadership GroupAssets and InfrastructureChief Operating Officer Evangelista Albertini
The Assets and Infrastructure team is responsible for the operation, maintenance and sustainable long-term management of Hydro Tasmania’s generating assets. These assets comprise dams, hydropower stations, roads and bridges, extensive civil and water conveyance infrastructure, the generating and distribution assets on the Bass Strait islands and the gas-fired Tamar Valley Power Station. In addition, the team is responsible for the management of the critically important areas of safety, the environment and sustainability.
Corporate and People ServicesChief Financial Officer Miles Smith
The Corporate and People Services team provides a range of services across Hydro Tasmania to support the efficient delivery of energy and consulting products to our customers. Services include finance, accounting and financial reporting as well as commercial advice. Also included are human resources, debt management, financial analysis, forecasting, legal counsel, enterprise risk, corporate compliance, trading risk management, procurement, fleet management, facilities management and internal audit.
Information Processes and SystemsChief Information Officer Luke Stow
The Information Processes and Systems team is responsible for delivery of information technology and information management services across Hydro Tasmania. The team leads improvement of internal processes and drives change initiatives to benefit the business. It sets strategic direction on information technology and provides advice on the use of technology for business innovation. It leads and advises the business on the management and protection of our information assets. Luke was appointed on 18 July 2014.
Table 6: Directors’ meeting attendance 2013–2014
Boar
d (re
gula
r and
sp
ecia
l mee
tings
)
Audi
t Com
mitt
ee
Risk
Man
agem
ent
Com
mitt
ee
Hum
an R
esou
rces
an
d Rem
uner
atio
n Co
mm
ittee
A B A B A B A BGrant Every-Burns 13 13 5 5 4 3* 2 2
Stephen Davy[Appointed as a director 16 December 2014]
6 6 3 2* 2 2
Janine Healey 13 13 5 5 4 4 3 3
Saul Eslake 13 13 5 5 4 4
Tessa Jakszewicz 13 13 5 5 3 3
Stan Kalinko 13 12* 2 2 3 3 3 2*
David Crean[Ceased in September 2014]
4 4 1 1 1 1
A = Maximum number of meetings the director could have attendedB = Number of meetings attended* Leave of absence granted
Public Interest DisclosuresUnder the Public Interest Disclosures Act 2002 (the Act), Hydro Tasmania is required to report on any disclosures about improper conduct by its public officers or Hydro Tasmania. In accordance with the requirements of section 86 of the Act, Hydro Tasmania advises that:
a) Hydro Tasmania’s procedures under the Act are available on the Hydro Tasmania website at www.hydro.com.au
b) no disclosures of public interest were made to Hydro Tasmania during the year
c) no public interest disclosures were investigated by Hydro Tasmania during the year
d) no disclosed matters were referred to Hydro Tasmania during the year by the Ombudsman
e) no disclosed matters were referred during the year by Hydro Tasmania to the Ombudsman to investigate
f) no investigations of disclosed matters were taken over by the Ombudsman from Hydro Tasmania during the year
g) there were no disclosed matters that Hydro Tasmania decided not to investigate during the year
h) there were no disclosed matters that were substantiated on investigation as there were no disclosed matters
i) the Ombudsman made no recommendations under the Act that relate to Hydro Tasmania.

Leadership group: From left, Luke Stow, Gerard Flack, Alan Evans, Tammy Chu, Stephen Bendeich, Stephen Davy, Evangelista Albertini, Paul Geason, Andrew Catchpole and Miles Smith. Absent: Hilary Fazackerley
25Hydro Tasmania Annual Report 2015
Strategy and Market DevelopmentDirector Strategy and Market Development Andrew Catchpole
The Strategy and Market Development team is responsible for managing business strategy across Hydro Tasmania. The team supports wholesale, retail and professional services by identifying and commercialising new products and services in response to customer needs. It delivers wind development services and hybrid off-grid solutions. The team also manages our community and stakeholder engagements, including sponsorship, partnering and market policy and regulation.
Wholesale Energy ServicesDirector Wholesale Energy Services Gerard Flack
The Wholesale Energy Services team trades and dispatches electricity and gas in the NEM using Hydro Tasmania’s renewable and gas-fired generation assets. Prudent management of water storages and gas supplies is central to that function. The team directly services commercial and industrial customers and provides portfolio management (financial hedging) services to Momentum Energy to service mass-market customers.
EnturaManaging Director Tammy Chu
Entura is Hydro Tasmania’s international consulting business. Entura works with local, national and international clients to deliver a full range of consulting services related to planning, designing, constructing, operating and maintaining all kinds of energy and water projects. Entura’s areas of expertise include renewable energy, power engineering, hydropower, water infrastructure and water and environmental management and planning.
Momentum EnergyManaging Director Paul Geason
Momentum Energy is Hydro Tasmania’s retail energy business operating on mainland Australia and the Bass Strait islands. Momentum is responsible for successfully gaining and retaining customers, billing and collecting from our retail customer base, covering and electricity, gas and energy services. Responsibilities include product development, branding and marketing of Momentum Energy in target markets to achieve profitable growth.
Corporate GovernanceCorporation Secretary Alan Evans
Corporate Governance is responsible for establishing, maintaining and operating a best-practice governance framework and the provision of the secretariat function to Hydro Tasmania’s Board, Board committees and subsidiary companies. It provides surety in corporate obligations and ensures the oversight of risk management, audit and compliance.
Legal Services General Counsel Stephen Bendeich
The Legal team provides legal support across the business, including legal advice, dispute management and transactional support.
People and CultureHead of People and Culture Hilary Fazackerley
The People and Culture team provides human resources-related advice, programs, policy and support to assist the business to meet its strategic objectives. The team is responsible for leading and managing people, culture and industrial relations strategies, programs and activities to attract, manage, develop and retain our people.

26 Annual Report 2015 Hydro Tasmania
We believe customers in our
chosen markets are the foundation of our
future success

Opposite page: Momentum Energy engaging with prospective customers at the Melbourne International Flower and Garden Show
Hydro Tasmania team celebrating with Cadel Evans (front right) as part of the Momentum Energy People’s Ride
27Hydro Tasmania Annual Report 2015
Customers
We believe customers in our chosen markets are the foundation of our future success, enabling us to meet the expectations of our shareholders and stakeholders. Hydro Tasmania is refocusing business processes and evolving our culture to place customers at the centre of our business.
Sustainability Code principlesWe know that our customers have a choice. We aim to be the first choice through understanding, responding and delivering sustainable solutions to our customers.
We are innovative and creative in developing new products and services in response to the needs of our customers and in order to retain our competitive edge in the marketplace.
Momentum EnergyA key initiative of Momentum Energy’s customer-centricity strategy considers improvements to our systems, processes and capabilities to enable us to deliver a quality customer experience and successfully compete in a rapidly transforming marketplace. We are undertaking a detailed evaluation of technology specialists to implement the improvements.
Momentum Energy is using a mix of automated post-call customer surveys, electronic surveys and focus groups to monitor customer needs to ensure our product and service proposition remains relevant. We are using Net Promoter Scores and other customer satisfaction metrics to provide real-time customer feedback to drive continuous improvement in service delivery.
We have expanded our product offerings with the launch of gas retailing in Victoria, where approximately 90 per cent of households use both electricity and gas. Dual-fuel retailing enables Momentum Energy to better meet customers’ needs, increases customer lifetime value, and offers customers the option of using Momentum as their sole energy retailer.
Competition in the electricity retail market has intensified with new retailers, heavy discounting and increased penetration of solar photovoltaic and other technologies. In this environment it is critical to communicate our value proposition and critical points of differentiation in order to compete for growth in market share.
In addition to retailing energy and gas, Momentum Energy provides additional energy solutions, such as energy efficiency advice. A new product commercialisation process has been implemented to better support ‘new energy’ products and tap into intellectual property and expertise from across Hydro Tasmania. Trial programs were launched for LED lighting and solar photovoltaic installation through third party installation partners. We have signed agreements with our first embedded networks (see glossary page 117), which are a key growth opportunity.
For more information on Momentum Energy’s products and services see www.momentumenergy.com.au.
Momentum Energy powering the People’s RideThe beautiful Bellarine Peninsula in Victoria came alive in January for the inaugural Cadel Evans Great Ocean Road Race. The elite cycling event also included a People’s Ride which saw more than 4000 recreational cyclists, including the Prime Minister Tony Abbott and a Momentum Energy team, take to the road to enjoy the magnificent scenery. Momentum Energy is the naming rights partner of the People’s Ride, which encourages people to get active and provides an economic boost for the small rural townships along the ride’s route.
To find out more about Momentum Energy’s support of the Cadel Evans Great Ocean Road Race visit www.momentumenergy.com.au/sponsorship

Director of Wholesale Energy Services Gerard Flack (left) with Tasmanian Minister for Energy Matthew Groom (second left), and the official party at the Bell Bay Aluminium contract announcement
28 Annual Report 2015 Hydro Tasmania
EnturaDuring the year we rebranded our digital presence to focus more on customers, including developing a social media presence and instituting a quarterly newsletter, Natural Thinking. Results from our quarterly client survey indicated that we are in the top quartile of professional service businesses. In 2014–15, Entura’s annual Net Promoter Score was +37.
The consulting market remained highly competitive in 2014–15, particularly due to reduced national spending on new infrastructure. Nevertheless, we have increased our market share within Tasmania and nationally and have maintained our presence internationally. In addition, Entura’s focus on asset management, our customers and working smarter has enabled us to operate more cost-effectively, resulting in improved financial performance.
Entura’s great strength is our owner–operator experience as part of Hydro Tasmania. In 2014–15 we focused on building that strength. The customer insights program has strengthened our asset management offering to customers in Papua New Guinea, Malaysia, South Asia and the Pacific Region. We have continued to develop our market presence nationally and internationally, including offering highly valued training and capacity-building through the Entura clean energy and water institute. The Net Promoter Score from training customers was +65. The institute has now delivered nearly 2500 training days to 550 participants as part of 37 programs, including eight certified courses.
Table 7: Significant projects for Entura in 2014–15
Client Project
Tasmania
TasWater Dam safety surveillance, detailed design, electrical assessment and safety audits, geotechnical investigations, hydrographic and weather station data management, training
TasNetworks Transmission network design, operation and maintenance
National
BHP Billiton, South Australia Annual data monitoring program
Central Goldfields Shire Council, Victoria Flood modelling and management
Power and Water Corporation, Northern Territory Network design and maintenance, yield assessment, cost estimate review, hydro-economic analysis
Downer EDI, Queensland Switchyard works
Ausnet Services, Victoria Community engagement, planning and approvals
Powercor Network Services, Victoria and Tasmania
Electrical design
Northern Territory Utilities Commission, Northern Territory
Power system review
Sydney Water Corporation, New South Wales Dam upgrade operations and maintenance manuals
Territory Generation, Northern Territory Leadership training
International
Ok Tedi Mining, Papua New Guinea Hydropower asset maintenance and upgrades
DSK Group, Laos Detailed hydropower design, site management
Virtuaal Retail, India Detailed hydropower design
Motleon Limited, New Zealand Modelling and flood hazard mapping
PNG Power, Papua New Guinea Hydropower design
Industrial Development Corporation, South Africa Engineering feasibility studies
Asian Development Bank, Cook Islands Renewable energy development
Uniten, Malaysia Hydrological forecasting system and hydrographic network

29Hydro Tasmania Annual Report 2015
Lasting community benefits from hydropower in South AfricaIn January 2015, Southern Africa’s newest hydropower plant achieved full commercial operation. Both Hydro Tasmania and Entura played significant roles in the project, from design through to construction and operation.
The Kakamas Hydro Electric Power project is a run-of-river small hydropower project on the Orange River near Kakamas in the Northern Cape Province of South Africa. Hydro Tasmania South Africa is a one-quarter equity partner in the project. Construction at Neusberg began in June 2013 and the power station commenced commercial operation on 31 January 2015. Hydro Tasmania and Entura have been involved in the project throughout its life from initial design through construction to ongoing support for operation and maintenance.
The project provides an ongoing social and economic boost for the local community. The broader Kakamas community has a 15 per cent shareholding in the project. The income will be kept in trust and distributed to community projects focused on education, the elderly and children. In addition, the Kakamas Hydro Electric Power project will spend two to three per cent of total revenue over the life of the project on community projects.
At the peak of construction, at least half of the 350 people employed on site were from the local community. Specific employment opportunities were created for young people and women. Local business also derived benefit from the project’s commitment to spending money on South African goods and services. During the construction period over 70 per cent of the total expenditure was spent on local goods and services.
For more information on Entura’s services see www.entura.com.au
Wholesale energyDuring 2014–15 Hydro Tasmania entered into new arrangements with all four of our major industrial customers. These customers—Bell Bay Aluminium, Nyrstar, TEMCO and Norske Skog—account for approximately 55 per cent of Tasmania’s electricity load. The new arrangements will allow these customers to increase their consumption and provide them with the confidence to invest in plant upgrades.
Table 8: Sustainability performance indicators—Customers
Indicator 2014–15 response Explanatory notes GRI Code
Number of customers
As a generator, Hydro Tasmania has fewer than five on-grid, non-residential customers in Tasmania and no residential customers.Momentum has an increasing number of customers across Victoria, NSW, SA, QLD and retail customers on the Bass Strait islands. Entura provides consulting services to clients across Australia and overseas.
The exact number of Momentum Energy’s customers cannot be disclosed due to the proprietary nature of the information.
EU3
Number of people impacted by our projects
EnturaEntura has primarily been involved in the feasibility and design of renewable energy projects over 2014–15, which has not, directly or indirectly, involved the displacement of indigenous or local communities or resulted in impacts to their livelihoods over this year.MomentumNilHydro TasmaniaNil
EU22
Total number of incidents of non-compliance with service regulations
EnturaNilMomentumNil
PR4
Monetary value of significant fines
EnturaNilMomentumNil
Momentum did not incur any fines but did provide wrongful disconnection payments for non-compliance with Energy Retail Code obligations.
PR9a
Number of residential disconnections for non-payment
Length of time between arrangement of payment and reconnection
Number of disconnections
In relation to length of time between arrangement of payment and reconnection – we currently use the date of receipt, not the date of payment by the customer. This generally shows as 1–3 days after the reconnection.
EU27
< 48 hours 172
48 hours to 1 week
94
1 week to 1 month
56
1 month to 1 year
59
No payment 357
a This indicator was included in the scope of KPMG’s assurance procedures
The new arrangements will help mitigate the challenge of declining electricity demand across our broader market and are consistent with the Tasmanian Government’s 2015 Energy Strategy objective to use Tasmanian energy to facilitate state growth.

30 Annual Report 2015 Hydro Tasmania
The cornerstone of Hydro Tasmania’s
asset management is a rolling 10-year Asset
Management Plan
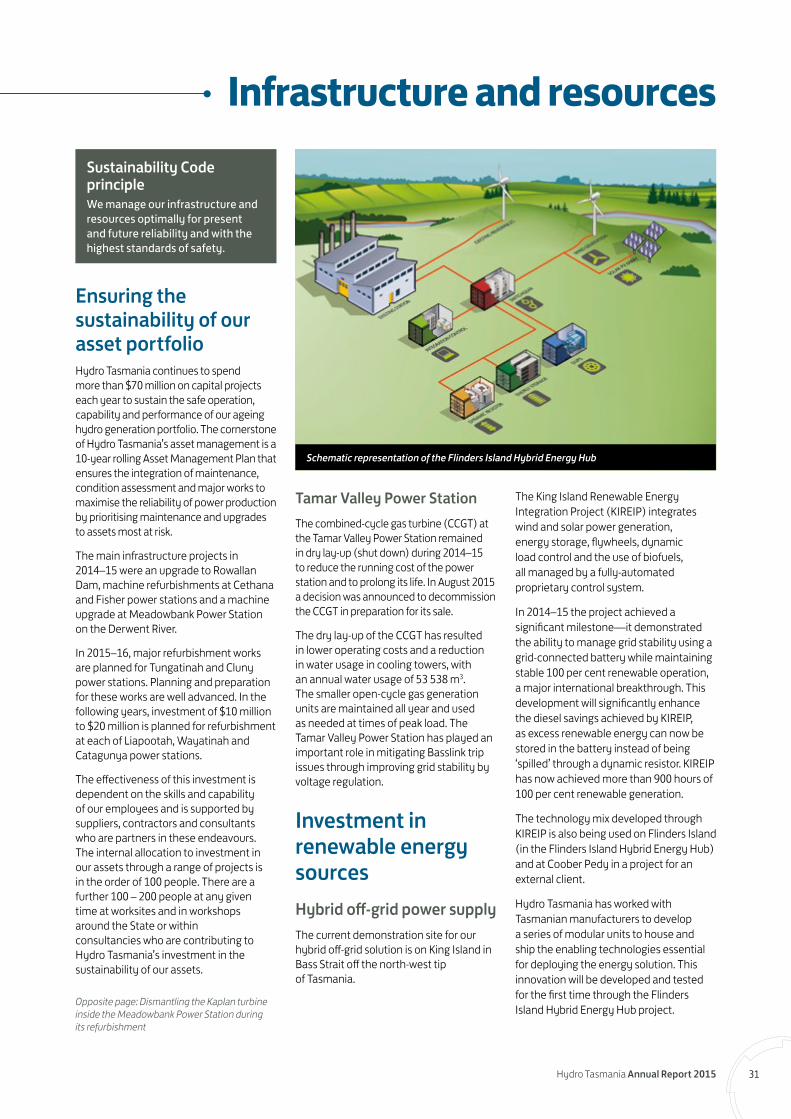
Opposite page: Dismantling the Kaplan turbine inside the Meadowbank Power Station during its refurbishment
Ensuring the sustainability of our asset portfolioHydro Tasmania continues to spend more than $70 million on capital projects each year to sustain the safe operation, capability and performance of our ageing hydro generation portfolio. The cornerstone of Hydro Tasmania’s asset management is a 10-year rolling Asset Management Plan that ensures the integration of maintenance, condition assessment and major works to maximise the reliability of power production by prioritising maintenance and upgrades to assets most at risk.
The main infrastructure projects in 2014–15 were an upgrade to Rowallan Dam, machine refurbishments at Cethana and Fisher power stations and a machine upgrade at Meadowbank Power Station on the Derwent River.
In 2015–16, major refurbishment works are planned for Tungatinah and Cluny power stations. Planning and preparation for these works are well advanced. In the following years, investment of $10 million to $20 million is planned for refurbishment at each of Liapootah, Wayatinah and Catagunya power stations.
The effectiveness of this investment is dependent on the skills and capability of our employees and is supported by suppliers, contractors and consultants who are partners in these endeavours. The internal allocation to investment in our assets through a range of projects is in the order of 100 people. There are a further 100 – 200 people at any given time at worksites and in workshops around the State or within consultancies who are contributing to Hydro Tasmania’s investment in the sustainability of our assets.
Sustainability Code principleWe manage our infrastructure and resources optimally for present and future reliability and with the highest standards of safety.
Tamar Valley Power StationThe combined-cycle gas turbine (CCGT) at the Tamar Valley Power Station remained in dry lay-up (shut down) during 2014–15 to reduce the running cost of the power station and to prolong its life. In August 2015 a decision was announced to decommission the CCGT in preparation for its sale.
The dry lay-up of the CCGT has resulted in lower operating costs and a reduction in water usage in cooling towers, with an annual water usage of 53 538 m3. The smaller open-cycle gas generation units are maintained all year and used as needed at times of peak load. The Tamar Valley Power Station has played an important role in mitigating Basslink trip issues through improving grid stability by voltage regulation.
Investment in renewable energy sourcesHybrid off-grid power supplyThe current demonstration site for our hybrid off-grid solution is on King Island in Bass Strait off the north-west tip of Tasmania.
The King Island Renewable Energy Integration Project (KIREIP) integrates wind and solar power generation, energy storage, flywheels, dynamic load control and the use of biofuels, all managed by a fully-automated proprietary control system.
In 2014–15 the project achieved a significant milestone—it demonstrated the ability to manage grid stability using a grid-connected battery while maintaining stable 100 per cent renewable operation, a major international breakthrough. This development will significantly enhance the diesel savings achieved by KIREIP, as excess renewable energy can now be stored in the battery instead of being ‘spilled’ through a dynamic resistor. KIREIP has now achieved more than 900 hours of 100 per cent renewable generation.
The technology mix developed through KIREIP is also being used on Flinders Island (in the Flinders Island Hybrid Energy Hub) and at Coober Pedy in a project for an external client.
Hydro Tasmania has worked with Tasmanian manufacturers to develop a series of modular units to house and ship the enabling technologies essential for deploying the energy solution. This innovation will be developed and tested for the first time through the Flinders Island Hybrid Energy Hub project.
Infrastructure and resources
Schematic representation of the Flinders Island Hybrid Energy Hub
31Hydro Tasmania Annual Report 2015

25
30
30
35
40
45
50
55
60
65
Jan Feb Mar Apr May Jun Jul Aug Sep Oct Nov Dec Jan
System Storage (%
)
Preferred MinCal 2011Cal 2012Cal 2013Cal 2014Cal 2015
Figure 5: Storage levels 2011–2015Preferred min = the minimum average level of storage within which the system operates under normal conditionsCal = calendar year
0
1000
2000
3000
4000
5000
6000
7000
8000
9000
20152014201320122011
Stored energy (GWh)
29.6%
45.9%
53.6%
32.8%
28.1%
426840594732
7745
6630
Figure 4: Energy in storage at 1 July 2011-2015
The modular enabling units will provide a lower-cost and scalable solution that will allow easy and rapid transport and installation for renewable energy projects, ensuring a speedy rollout at the final location, and reducing the risk, cost and duration of construction.
Both the Flinders Island and Coober Pedy projects received funding from the Australian Renewable Energy Agency as part of its Regional Australia Renewables Program.
Hydro Tasmania is following up on further project opportunities within Australia and the Asia–Pacific region to capitalise on our world-leading renewable energy enabling technology.
See more about hybrid off-grid solution at www.hydro.com.au/energy/hybrid-off-grid-solutions
TasWind proposalIn October 2014 Hydro Tasmania announced the decision not to proceed with the TasWind project on King Island. The original concept was for the construction of a 600 MW wind farm on the island. For two years the TasWind project created significant community debate on King Island. The project was found not to be economically viable as a stand-alone wind farm project or as a staged connection to Tasmania.
We continue to support the King Island community through our ongoing operations and presence on the island and our support for a range of initiatives and events such as the Hydro Tasmania King Island Imperial 20, Rural Alive and Well and the King Island Men’s Shed.
Lake level managementThere was very low rainfall in July to December 2014, leading to low inflows to our lakes and low storage levels over summer. This resulted in less generation over the financial year than budgeted. However, good inflows during May 2015 lifted generation over the financial year to only slightly below average. Total energy in storage at 1 July 2015 was 29.6 per cent (Figure 4) which is 1.5 per cent higher than at 1 July 2014 (Figure 5).
El Niño conditionsAustralia is currently (as at July 2015) in a strong El Niño weather pattern which is forecast to continue. El Niño conditions have little direct effect on hydro generation in Tasmania; reduced inflows are possible in some parts of the system, particularly the Mersey–Forth catchment, but the effect is small. However, a very strong or persistent El Niño can have effects months later in the Indian Ocean that may have significant impacts on inflows in Tasmania. Hydro Tasmania will monitor the Indian Ocean through this winter and spring and will adjust planning should a strong signal emerge.
See more about Hydro Tasmania’s water management at www.hydro.com.au/water
Pictured at left: Flinders Island Hybrid Energy Partnership announcement with Tasmanian Minister for Energy Matthew Groom, CEO of Southern Prospect Lee Whiteley, Hydro Tasmania’s Work Package Manager Peter Thompson and Tasmanian Minister for Health, and local member for Braddon, Jeremy Rockcliff
32 Annual Report 2015 Hydro Tasmania

Basslink imports and exportsHydro Tasmania uses the Basslink connection across Bass Strait to export and import electricity. In 2014–15 there was a net import of energy of 1417 GWh over Basslink, resulting from exports of 724 GWh and imports of 2141 GWh (Table 9).
Basslink is owned by Keppel Infrastructure Trust through Basslink Pty Ltd. On 18 May 2015 CitySpring Infrastructure Trust acquired the assets and name of the Keppel Infrastructure Trust.
Table 9: Basslink imports and exports at 30 June
Financial year ending 30 June 2011 2012 2013 2014 2015
Export (GWh) 1311 986 2293 3113 725
Import (GWh) 1095 1262 251 20 2141
Neta (GWh) 216 -276 2042 3093 -1417a Positive numbers indicate net export, negative numbers indicate net import
Table 10: Sustainability performance indicators—Infrastructure and resources
Indicator 2014–15 response Explanatory notes GRI Code
Length of transmission and distribution lines
~700 km Our only above-ground distribution feeders are on the Bass Strait islands. EU4
Average generation efficiency of thermal plants
34.7% Prior to 2013–14 we did not report on this issue because we did not own significant thermal plants. However, we now operate the gas-fired Tamar Valley Power Station.
EU11
Transmission and distribution losses as a percentage of total energy
7.5% This relates to the Bass Strait islands only. EU12
Percentage of population unserved in licensed distribution or service areas
~1% This indicator is estimated and only relates to the Bass Strait islands. Note the business does not keep data on individuals who are not connected to the distribution network.
EU26
Power outage frequency Flinders Island = 5.83King Island = 3.54
System Average Interruption Frequency Index (SAIFI): total system average number of interruptions per kVA.
EU28
Water usage 57.5 ML Includes water usage at TVPS, Trevallyn Power Station and our offices at 4 Elizabeth St.
EN8a
Indicator 2010–11 2011–12 2012–13 2013–14 2014–15 Explanatory notes GRI Code
Average power outage duration
N/A N/A Flinders Island = 760King Island = 321
Flinders Island = 297King Island = 1196
Flinders Island = 224King Island = 531
System Average Interruption Duration Index (SAIDI): total system average minutes off supply per kVA.
EU29
Average plant availability factor (%)
88 87 92 91 86a These data relate to the hydropower system.
EU30
Hydropower system yield (GWh)
10 700 9538 7753 11 294 8466 Water used as part of our operations is not consumed but is returned to the environment.
a This indicator was included in the scope of KPMG’s assurance procedures
33Hydro Tasmania Annual Report 2015

34 Annual Report 2015 Hydro Tasmania
Hydro Tasmania generates energy
principally from renewable sources

Sustainability Code principlesWe aim to minimise our impact on the environment and seek opportunities to enhance environmental, cultural and heritage values.
As climate change has significant implications for our business we are committed to being part of a sustainable solution.
Environment
Senior Ecologist Raymond Brereton examining zooplankton at Lagoon of Islands
There were no significant environmental or heritage incidents during 2014–15 and we complied with our obligations to Tasmanian and Australian government agencies for environmental monitoring and reporting.
For further information on the Pieman Sustainability Review see www.hydro.com.au/pieman-sustainability-review
Lagoon of Islands rehabilitationOur project to rehabilitate Lagoon of Islands continued in 2014–15. Since the dam wall was removed in April 2013, the lagoon turbidity and nutrient concentrations have improved, although the long-term targets for these parameters will take longer to achieve. The target of no algal blooms was achieved, and a diverse algal community has developed. The continuing recolonisation of vegetation from natural seed sources has been complemented by the development of a weed management plan for Typha latifolia (bulrush) which has the potential to change the character of the rehabilitating wetland. In contrast to descriptions of the lagoon cycles before damming, the lagoon bed has dried each summer since decommissioning. This may ultimately lead to development of a different type of wetland than existed prior to impoundment. We are assessing whether corrective works to decrease drainage are required in 2015–16.
To see further information on the rehabilitation of Lagoon of Islands see www.hydro.com.au/lagoon-of-islands
Environmental and heritage stewardshipPieman Sustainability ReviewWe periodically review our operations in each of our catchments to assess and improve our water management practices. These reviews are conducted in consultation with local communities and our stakeholders.
The Pieman Sustainability Review is our fourth catchment review and includes the Anthony–Pieman hydropower scheme on the west coast of Tasmania. The review began in late 2014 and will end in late 2016. Cloud seeding is a key issue for community members, and communication efforts are being reviewed. A publication which collates information on the scheme has been completed and provided to the public.
We are currently consulting with stakeholders, incorporating an International Hydropower Association sustainability assessment protocol, interactions with community activities and heritage and environmental views.
A challenge for the Pieman Sustainability Review is to maintain community engagement and interest over the course of the lengthy review process.Opposite page: Icy conditions at Lagoon
of Islands
35Hydro Tasmania Annual Report 2015

0.00
0.01
0.02
0.03
0.04
0.05
0.06
0.07
0.08
0.09
Financial year ending 30 June
tCO 2e/
MW
h
2011 2012 2013 2014 2015
0.0047 0.00510.0089
0.0668
0.0055
0
100000
200000
300000
400000
500000
600000
700000
800000
900000
2011 2012 2013 2014 2015
45 620a
Financial year ending 30 June
tCO 2e
44 282 45 19795 987
879 351
Table 11: Atmospheric emissions associated with diesel combustion
Flinders Island (kg/year)
King Island (kg/year)
Oxides of nitrogen 28385.15 58054.01
Sulfur dioxide 0.78 1.59
Polycyclic aromatic hydrocarbons 0.0002 0.0004
Volatile organic compounds 1190.35 2434.52
Particulate matter 1465.04 2996.34
Figure 6: Total emissions 2011–2015
Figure 7: Emissions intensity 2011-2015
Female Paragalaxias mesotes—the species was rediscovered in Woods Lake as part of our surveys
36 Annual Report 2015 Hydro Tasmania
Great Lake Power Scheme heritage listingThe importance of the Great Lake Power Scheme to Tasmania’s historical development has been formally recognised, with permanent listing of key elements of the scheme on the Tasmanian Heritage Register. Heritage-listed elements of the Great Lake Scheme include Waddamana A and B power stations, Waddamana Village, Miena Number 1 and 2 dams, Liawenee, Waddamana and Shannon canals, Penstock Lagoon, Hilltop Camp and the sites of McAulay’s hut and house, and segments of the Red Gate tramway.
The commemorative foundation stone laid at the opening of Waddamana A Power Station was also restored and remounted inside the Waddamana Power Station Museum to conserve it and to highlight its heritage significance.
Threatened fish speciesWe continued to monitor spawning of the threatened species, Galaxias tanycephalus, in Woods Lake. Significantly, our monitoring detected eggs and mature adults of Paragalaxias mesote, previously thought to be locally extinct in Woods Lake. Hydro Tasmania is now working to ensure our operations do not affect the spawning of P. mesotes in Woods Lake in 2015.
For more information on threatened species see www.hydro.com.au/environment/threatened-species
Atmospheric emissionsHydro Tasmania generates energy principally from renewable sources. Gas was added when AETV Pty Ltd, including the Tamar Valley Power Station, was transferred to Hydro Tasmania in June 2013. Our emissions significantly decreased in 2014–15 as shown in figures 6 and 7. At 30 June total emissions were 45 620 tCO2e. The emissions intensity was 0.0055 tCO2e/MWh. This compares favourably to the average NEM emissions intensity of 0.9037 tCO2e/ MWh. The atmospheric emissions associated with the consumption of diesel and natural gas for electricity generataion are shown in table 11.
a The dry lay-up of the CCGT during 2014–15 has resulted in lower use and a reduction in associated GHG emissions.

From left: Russell Eyre, Roger Parkyn, Sarah Blundy, Andrew Overington and Bryan Scott inspect the Kaplan turbine refurbishment at Meadowbank Power Station
37Hydro Tasmania Annual Report 2015
Waste managementOil managementHydro Tasmania continued implementing actions from the 2013 Oil Management Plan. Many major projects strongly emphasise reduction of environmental risks using engineering controls, including a program to upgrade the oil spill capture capabilities of each major transformer yard across the state. The Kaplan turbine program is a series of major projects at our power stations, refurbishing a number of turbines that have been in service for at least 40 years. The refurbishment incorporates an oil-less hub design, increasing efficiency and eliminating the risk of spilling a large volume of oil into important waterways. Upgrades to Kaplan turbines were completed at Paloona and commenced at Meadowbank Power Station, with upgrades to Repulse and Cluny power stations commencing in subsequent years.
Table 12: Materials used 2014–15
Material Amount
Oil recycled (L) 28 840
Oil disposed (L) 0
PCB waste (L) 0
Hydrocarbons (m3) 55
Solid waste (t) 27
Liquid waste (L) 11 150
Co-mingled paper/cardboard recycling (L)
480
The wastes listed in Table 12 are recycled or disposed of in various purpose-built facilities using registered contractors. Wastes that are recycled include waste oil (used as lime kiln fuel), hydrocarbon waste (treated naturally for later reuse) and paper/cardboard. Liquid waste that is not recycled is treated at the nearest wastewater treatment plant. Solid waste which is not recycled is disposed of in landfill, with the exception of PCB waste which is incinerated.
Contaminated aggregate reuseIn 2014–15, Hydro Tasmania investigated and implemented a new program of waste reduction by reconditioning some hydrocarbon-contaminated aggregate found in transformer yards, the result of leaks and spills within the bunds. Normally, this aggregate would be disposed of at a specialised disposal site. However, working with the Tasmanian Environment Protection
Table 13: Sustainability performance indicators—Environment
Indicator 2014–15 response Explanatory notes GRI Code
Materials used by weight or volume
Gas:8 511 021 GJBass Strait islands diesel usage: King Island = 1 872 710 L Flinders Island = 915 650 L
EN1
Effluents and waste — total water discharge by quality and destination
Annual average of daily results:Outfall flow = 12.6 m³/hrTemperature = 15.1 °CpH = 7.6Dissolved Oxygen = 101%Annual average of monthly results: Suspended Solids = 15.3 mg/LBiochemical Oxygen Demand = 5.8 mg/LTotal Phosphorus = 0.3 mg/LTotal Nitrogen = 1.4 mg/L
The Tamar Valley Power Station is licensed to discharge cooling tower water into Donovans Bay on the Tamar River.
EN22
Authority, we devised a means to store the aggregate and encourage natural breakdown of contaminants to insignificant concentrations. After two years contaminant concentrations will be acceptable for reuse of the aggregate, likely as an additive for road base. This will significantly reduce the amount of waste generated by Hydro Tasmania (by an estimated 3–5 tonnes in 2015–16) and also reduce expenditure on contaminated waste disposal.
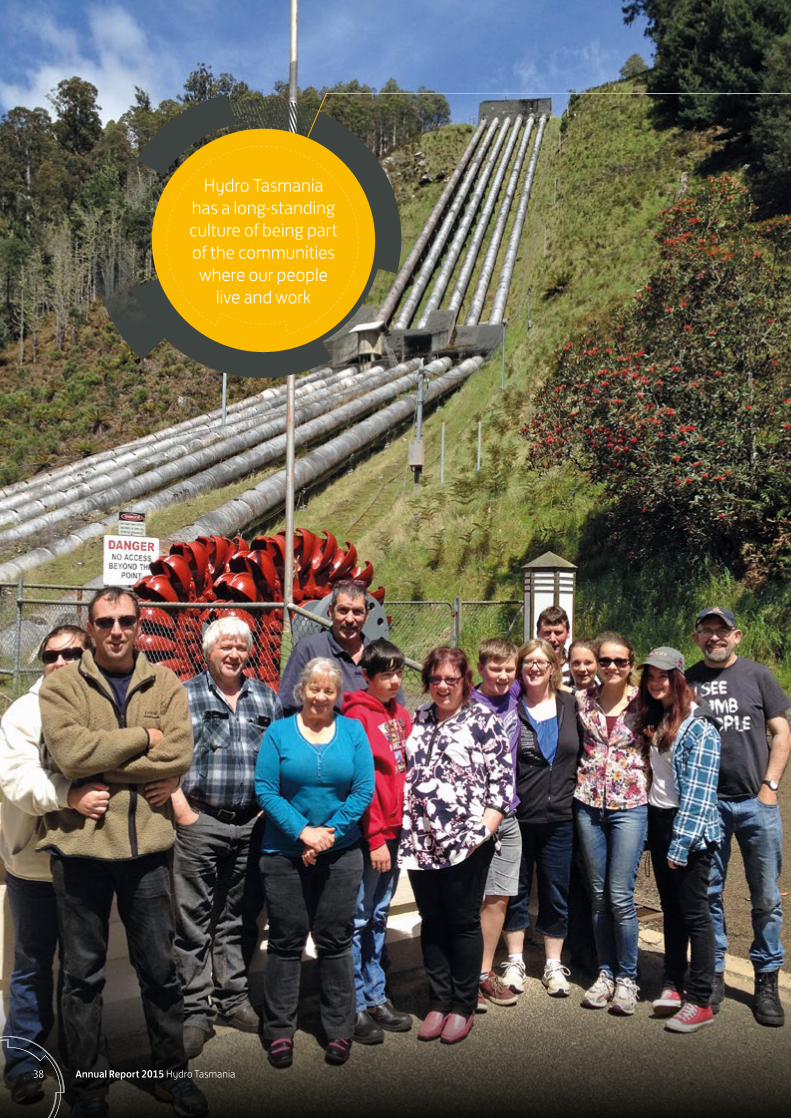
38 Annual Report 2015 Hydro Tasmania
Hydro Tasmania has a long-standing culture of being part of the communities
where our people live and work

Opposite page: Members of the community enjoying a tour of Tarraleah Power Station as part of Hydro Tasmania’s centenary celebrations
Community
Sustainability Code principlesWe understand that we have the potential to impact on people through our activities. We:
• aim to have regular, open and transparent dialogue with our community
• aim to make a genuine difference in the communities in which we operate
• work with our customers, stakeholders, suppliers and partners to contribute to a sustainable future.
Members of the community participating in a rowing regatta on Lake Barrington
39Hydro Tasmania Annual Report 2015
Hydro Tasmania has a long-standing culture of being part of the communities where our people live and work. This was particularly evident in 2014–15 during our centenary celebrations, which gave us the opportunity to interact with thousands of people at our free community events. We were delighted to share the stories of past employees and Hydro families who built Tasmania’s hydropower system.
We continue to look for opportunities for our business to be open and accessible to our owners, the people of Tasmania. Our stakeholders encompass a wide cross-section of government, industry and community sectors (Table 14).
Engaging with our communityHydro Tasmania’s centenary celebrationsHydro Tasmania celebrated its centenary in October 2014. We wanted to tell the stories of the people who built Tasmania’s hydropower system and recognise their contribution to Tasmania’s economic and social development. Thousands of people enjoyed a program of free community events, including power station tours. The high level of public interest and enthusiasm enabled our people to engage directly with the community.
The centenary program also included a travelling public exhibition, a competition for school children, a family day at the Waddamana Museum, and culminated in a performance by the Tasmanian Symphony Orchestra at Tarraleah. A short documentary film ‘People of the Hydro’ was produced. Many of the stories in the documentary were provided by former employees and Hydro families.
To find out more about Hydro Tasmania’s centenary visit www.hydro100.com.au
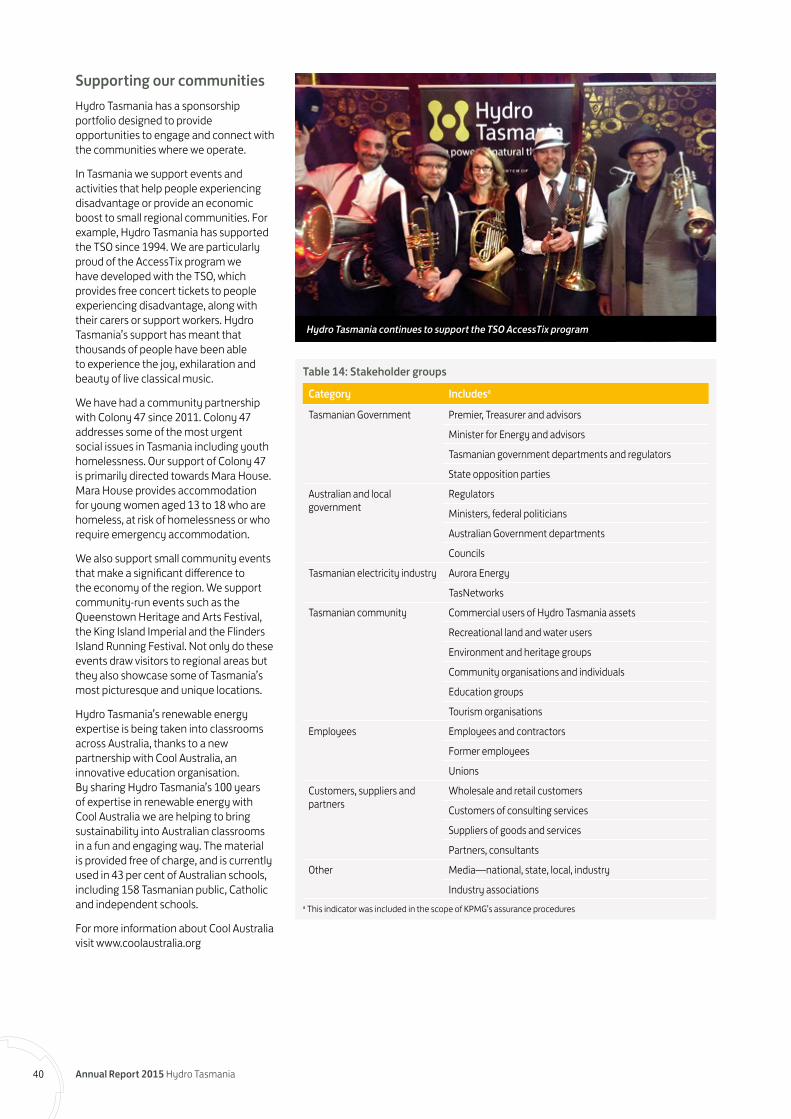
Hydro Tasmania continues to support the TSO AccessTix program
40 Annual Report 2015 Hydro Tasmania
Supporting our communitiesHydro Tasmania has a sponsorship portfolio designed to provide opportunities to engage and connect with the communities where we operate.
In Tasmania we support events and activities that help people experiencing disadvantage or provide an economic boost to small regional communities. For example, Hydro Tasmania has supported the TSO since 1994. We are particularly proud of the AccessTix program we have developed with the TSO, which provides free concert tickets to people experiencing disadvantage, along with their carers or support workers. Hydro Tasmania’s support has meant that thousands of people have been able to experience the joy, exhilaration and beauty of live classical music.
We have had a community partnership with Colony 47 since 2011. Colony 47 addresses some of the most urgent social issues in Tasmania including youth homelessness. Our support of Colony 47 is primarily directed towards Mara House. Mara House provides accommodation for young women aged 13 to 18 who are homeless, at risk of homelessness or who require emergency accommodation.
We also support small community events that make a significant difference to the economy of the region. We support community-run events such as the Queenstown Heritage and Arts Festival, the King Island Imperial and the Flinders Island Running Festival. Not only do these events draw visitors to regional areas but they also showcase some of Tasmania’s most picturesque and unique locations.
Hydro Tasmania’s renewable energy expertise is being taken into classrooms across Australia, thanks to a new partnership with Cool Australia, an innovative education organisation. By sharing Hydro Tasmania’s 100 years of expertise in renewable energy with Cool Australia we are helping to bring sustainability into Australian classrooms in a fun and engaging way. The material is provided free of charge, and is currently used in 43 per cent of Australian schools, including 158 Tasmanian public, Catholic and independent schools.
For more information about Cool Australia visit www.coolaustralia.org
Table 14: Stakeholder groups
Category Includesa
Tasmanian Government Premier, Treasurer and advisors
Minister for Energy and advisors
Tasmanian government departments and regulators
State opposition parties
Australian and local government
Regulators
Ministers, federal politicians
Australian Government departments
Councils
Tasmanian electricity industry Aurora Energy
TasNetworks
Tasmanian community Commercial users of Hydro Tasmania assets
Recreational land and water users
Environment and heritage groups
Community organisations and individuals
Education groups
Tourism organisations
Employees Employees and contractors
Former employees
Unions
Customers, suppliers and partners
Wholesale and retail customers
Customers of consulting services
Suppliers of goods and services
Partners, consultants
Other Media—national, state, local, industry
Industry associationsa This indicator was included in the scope of KPMG’s assurance procedures

41Hydro Tasmania Annual Report 2015
Entura’s sponsorship program focuses on one major issue — child labour in India. The Too Young to Work program aims to eliminate child labour in India by providing impoverished children with an education.
For more information about Too Young to Work visit www.tytw.org.au
On 25 April 2015 Nepal experienced a devastating earthquake. Our people in Entura’s India office were working on the 27 MW Dordi-Khola Hydropower Project in the Lamjung district in Western Nepal, 164 km from Kathmandu, close to the earthquake epicentre. Fortunately, our people and their colleagues were safe but we felt strongly about wanting to contribute to the relief and reconstruction efforts in Nepal. The Entura team in the Indian office made the generous donation of one full day’s salary to the relief efforts. Back in Australia, Hydro Tasmania and our people provided a total of $49 320 to the Nepal relief effort.
Sharing water for recreationHydro Tasmania was awarded the Australian Canoeing President’s Award
Table 15: Sustainability performance indicators—Community
Indicator 2010–11 2011–12 2012–13 2013–14 2014–15 Explanatory notes
GRI Code
Proportion of spending on local suppliers by Hydro Tasmania (%)
Mainland Australia: 42Tasmania: 53.4Overseas: 4.6
Mainland Australia: 51.8Tasmania: 42.8Overseas: 5.4
Mainland Australia: 68.2 Tasmania: 28.9Overseas: 2.9
Mainland Australia: 51 Tasmania: 41 Overseas: 8
Mainland Australia: 32.4 Tasmania: 56.7Overseas: 10.9
Local spending for Hydro Tasmania is defined as within Tasmania.
EC9a
Proportion of spending on local suppliers by Momentum Energy (%)
NA Mainland Australia: 93.2 Tasmania: 0 Overseas: 6.8
Mainland Australia: 93.8 Tasmania: 0.6 Overseas: 5.5
Mainland Australia: 98.6 Tasmania: 0.2 Overseas: 1.2
Mainland Australia: 97.2 Tasmania: 0.7 Overseas: 2.1
Local spending for Momentum Energy is defined as mainland Australia.
EC9a
Community awareness of our primary role, electricity generation (%)
NA NA 57 NA 72 Percentage of respondents in a biennial survey.
Staff participation in community volunteering (%)
NA 7.5 22.8 26.8 25.4
a This indicator was included in the scope of KPMG’s assurance procedures
for our support of canoeing. We are the largest water manager in Australia and support the use of our waterways for recreation including angling and visual amenity at tourist sites. In a typical year between 100 and 200 water releases occur for recreational purposes.
To find out more about water releases for recreation see www.hydro.com.au/water/water-releases-recreation.
Public liabilityMembers of the public access and use Hydro Tasmania land and waterways in a number of ways. We are working to develop a more systematic approach to civil liability and environmental risk management associated with these activities.
SuppliersWorking closely with suppliers and contractorsHydro Tasmania recognises that the suppliers and contractors who contribute to our extended supply chain represent a
large cross-section of the communities in which we operate. We procure goods and services from more than 1500 companies and small businesses. The total value of payments made for goods and services in 2014–15 was more than $200 million via purchase orders and $6.8 million via purchasing cards. As 73 per cent of payments were for services (rather than goods) our supply chain is considered labour-intensive.
As part of our commitment to work closely with our suppliers and contractors we undertake an annual survey seeking direct feedback on our performance. More than 400 survey comments were received, of which 92 per cent were positive. The comments indicated that Hydro Tasmania is considered to be very approachable; our employees demonstrate exceptional integrity and communicate well; and the business has strong procedures. However, the feedback also indicated that Hydro Tasmania needs to work harder to understand the impacts of late payments to small business owners and ensure we pay our invoices on time, every time.

42 Annual Report 2015 Hydro Tasmania
We continue to build an even
stronger health and safety culture within
the business
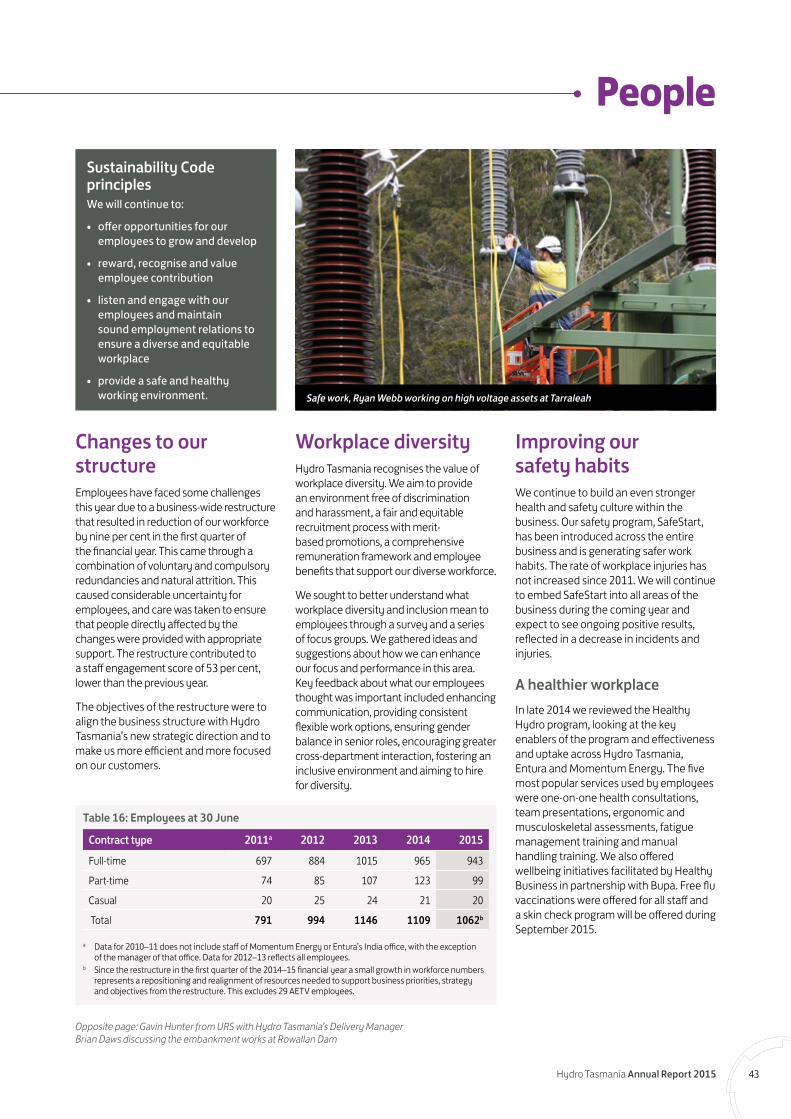
Opposite page: Gavin Hunter from URS with Hydro Tasmania’s Delivery Manager Brian Daws discussing the embankment works at Rowallan Dam
PeopleSustainability Code principlesWe will continue to:
• offer opportunities for our employees to grow and develop
• reward, recognise and value employee contribution
• listen and engage with our employees and maintain sound employment relations to ensure a diverse and equitable workplace
• provide a safe and healthy working environment. Safe work, Ryan Webb working on high voltage assets at Tarraleah
43Hydro Tasmania Annual Report 2015
Changes to our structureEmployees have faced some challenges this year due to a business-wide restructure that resulted in reduction of our workforce by nine per cent in the first quarter of the financial year. This came through a combination of voluntary and compulsory redundancies and natural attrition. This caused considerable uncertainty for employees, and care was taken to ensure that people directly affected by the changes were provided with appropriate support. The restructure contributed to a staff engagement score of 53 per cent, lower than the previous year.
The objectives of the restructure were to align the business structure with Hydro Tasmania’s new strategic direction and to make us more efficient and more focused on our customers.
Workplace diversityHydro Tasmania recognises the value of workplace diversity. We aim to provide an environment free of discrimination and harassment, a fair and equitable recruitment process with merit-based promotions, a comprehensive remuneration framework and employee benefits that support our diverse workforce.
We sought to better understand what workplace diversity and inclusion mean to employees through a survey and a series of focus groups. We gathered ideas and suggestions about how we can enhance our focus and performance in this area. Key feedback about what our employees thought was important included enhancing communication, providing consistent flexible work options, ensuring gender balance in senior roles, encouraging greater cross-department interaction, fostering an inclusive environment and aiming to hire for diversity.
Improving our safety habitsWe continue to build an even stronger health and safety culture within the business. Our safety program, SafeStart, has been introduced across the entire business and is generating safer work habits. The rate of workplace injuries has not increased since 2011. We will continue to embed SafeStart into all areas of the business during the coming year and expect to see ongoing positive results, reflected in a decrease in incidents and injuries.
A healthier workplaceIn late 2014 we reviewed the Healthy Hydro program, looking at the key enablers of the program and effectiveness and uptake across Hydro Tasmania, Entura and Momentum Energy. The five most popular services used by employees were one-on-one health consultations, team presentations, ergonomic and musculoskeletal assessments, fatigue management training and manual handling training. We also offered wellbeing initiatives facilitated by Healthy Business in partnership with Bupa. Free flu vaccinations were offered for all staff and a skin check program will be offered during September 2015.
Table 16: Employees at 30 June
Contract type 2011a 2012 2013 2014 2015
Full-time 697 884 1015 965 943
Part-time 74 85 107 123 99
Casual 20 25 24 21 20
Total 791 994 1146 1109 1062b
a Data for 2010–11 does not include staff of Momentum Energy or Entura’s India office, with the exception of the manager of that office. Data for 2012–13 reflects all employees.
b Since the restructure in the first quarter of the 2014–15 financial year a small growth in workforce numbers represents a repositioning and realignment of resources needed to support business priorities, strategy and objectives from the restructure. This excludes 29 AETV employees.
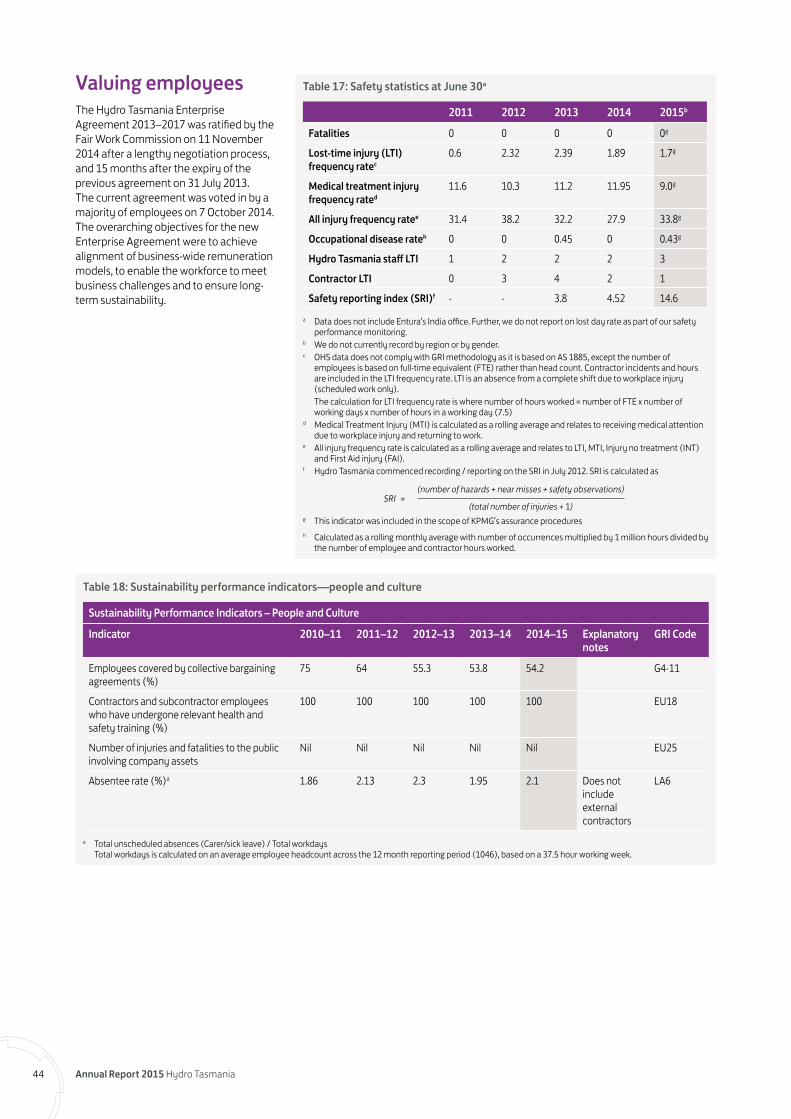
44 Annual Report 2015 Hydro Tasmania
Valuing employeesThe Hydro Tasmania Enterprise Agreement 2013–2017 was ratified by the Fair Work Commission on 11 November 2014 after a lengthy negotiation process, and 15 months after the expiry of the previous agreement on 31 July 2013. The current agreement was voted in by a majority of employees on 7 October 2014. The overarching objectives for the new Enterprise Agreement were to achieve alignment of business-wide remuneration models, to enable the workforce to meet business challenges and to ensure long-term sustainability.
Table 17: Safety statistics at June 30a
2011 2012 2013 2014 2015b
Fatalities 0 0 0 0 0g
Lost-time injury (LTI) frequency ratec
0.6 2.32 2.39 1.89 1.7g
Medical treatment injury frequency rated
11.6 10.3 11.2 11.95 9.0g
All injury frequency ratee 31.4 38.2 32.2 27.9 33.8g
Occupational disease rateh 0 0 0.45 0 0.43g
Hydro Tasmania staff LTI 1 2 2 2 3
Contractor LTI 0 3 4 2 1
Safety reporting index (SRI)f - - 3.8 4.52 14.6
a Data does not include Entura’s India office. Further, we do not report on lost day rate as part of our safety performance monitoring.
b We do not currently record by region or by gender.c OHS data does not comply with GRI methodology as it is based on AS 1885, except the number of
employees is based on full-time equivalent (FTE) rather than head count. Contractor incidents and hours are included in the LTI frequency rate. LTI is an absence from a complete shift due to workplace injury (scheduled work only).
The calculation for LTI frequency rate is where number of hours worked = number of FTE x number of working days x number of hours in a working day (7.5)
d Medical Treatment Injury (MTI) is calculated as a rolling average and relates to receiving medical attention due to workplace injury and returning to work.
e All injury frequency rate is calculated as a rolling average and relates to LTI, MTI, Injury no treatment (INT) and First Aid injury (FAI).
f Hydro Tasmania commenced recording / reporting on the SRI in July 2012. SRI is calculated as
(number of hazards + near misses + safety observations) SRI = (total number of injuries + 1)g This indicator was included in the scope of KPMG’s assurance proceduresh Calculated as a rolling monthly average with number of occurrences multiplied by 1 million hours divided by
the number of employee and contractor hours worked.
Table 18: Sustainability performance indicators—people and culture
Sustainability Performance Indicators – People and Culture
Indicator 2010–11 2011–12 2012–13 2013–14 2014–15 Explanatory notes
GRI Code
Employees covered by collective bargaining agreements (%)
75 64 55.3 53.8 54.2 G4-11
Contractors and subcontractor employees who have undergone relevant health and safety training (%)
100 100 100 100 100 EU18
Number of injuries and fatalities to the public involving company assets
Nil Nil Nil Nil Nil EU25
Absentee rate (%)a 1.86 2.13 2.3 1.95 2.1 Does not include external contractors
LA6
a Total unscheduled absences (Carer/sick leave) / Total workdays Total workdays is calculated on an average employee headcount across the 12 month reporting period (1046), based on a 37.5 hour working week.

Financial reportfor the Year Ended 30 June
Hydro-Electric Corporation ARBN 072 377 158 ABN 48 072 377 158
Income Statement ..........................................................................46Statement of Comprehensive Income ....................................47Balance Sheet ..................................................................................48Cash Flow Statement ....................................................................49Statement of Changes in Equity ................................................50Notes to and forming part of the financial statements .....511.1 Details Of Reporting Entity ...............................................511.2 Summary of Significant Accounting Policies ..............512. Revenue and Expenses ......................................................613. Assumptions and Judgements ........................................624. Income Tax Equivalent .......................................................635. Note to The Cash Flow Statement .................................666. Receivables ............................................................................677. Investments ...........................................................................678. Inventories ..............................................................................679. Property, Plant and Equipment.......................................6811. Other Financial Assets ........................................................7110 . Intangible Assets ..................................................................7112. Other Assets ...........................................................................7213. Goodwill ...................................................................................7214. Payables ..................................................................................7215. Interest-Bearing Liabilities ................................................7316. Provisions ................................................................................7417. Other Financial Liabilities ..................................................7518. Other Liabilities .....................................................................7619. Retirement Benefits Fund Provision..............................7720. Financial Instruments Disclosures ................................8021. Commitments For Expenditure.......................................9122. Contingent Assets and Liabilities ............................... 91
23. Auditor’s Remuneration .....................................................9124. Key Management Personnel Compensation .............9225. Related Party Information ................................................9626. Events Subsequent to Balance Date .............................9627. Government Grants .............................................................9728. Controlled Entities ...............................................................9829. Interest In Joint Ventures ..................................................9930. Deed Of Cross Guarantee ................................................ 10031. Incorporated Joint Ventures .......................................... 10232. Dividend ................................................................................ 10433. Segment Information ....................................................... 104Superannuation declaration ..................................................... 108Statement of certification .......................................................... 108Auditor’s independence declaration ...................................... 109Independent audit report ........................................................... 110
45Hydro Tasmania Annual Report 2015
2015

CONSOLIDATED PARENTNOTE 2015 2014 2015 2014
$’000 $’000 $’000 $’000RevenueSale of products and services 2(a) 1,467,161 1,978,012 585,197 877,706Fair value gains 2(c) 16,050 167,572 - 165,791Share of profit of joint venture entities 1,773 2,073 - -Other 15,289 13,052 19,594 27,404Total revenue 1,500,273 2,160,709 604,791 1,070,901
ExpensesDirect expenses 1,034,271 1,319,456 227,535 259,439Labour 126,060 149,941 100,606 119,764Depreciation and amortisation 92,918 88,230 87,728 83,486Finance expenses 2(b) 71,927 79,840 70,799 78,424Fair value losses 2(d) 126,977 5,462 117,449 1,694Revaluation and impairment expenses / (gains) 2(e) (232,066) 220,492 (197,442) 272,690Other 96,695 114,557 53,757 78,824Total expenses 1,316,782 1,977,978 460,432 894,321
Profit/(loss) before income tax equivalent expense 183,491 182,731 144,359 176,580
Comprising:Result before fair value movements and revaluation expenses 62,352 241,113 64,366 285,173Net fair value gains/(losses) (110,927) 162,110 (117,449) 164,097Revaluation and impairment (expenses) / gains 232,066 (220,492) 197,442 (272,690)
Profit/(loss) before income tax equivalent expense 183,491 182,731 144,359 176,580
Income tax equivalent expense/(benefit) 4(a) 54,816 39,182 67,827 55,514
Profit/(loss) after tax attributable to owners of the parent 128,675 143,549 76,532 121,066
The Income Statment is to be read in conjunction with the notes to and forming part of the financial report included on pages 51 to 108.
Income Statementfor the Year Ended 30 June 2015
46 Annual Report 2015 Hydro Tasmania

CONSOLIDATED PARENTNOTE 2015 2014 2015 2014
$’000 $’000 $’000 $’000
Profit/(loss) after tax attributable to owners of the parent 128,675 143,549 76,532 121,066
Other comprehensive income
Items that will not be reclassified in subsequent years to operating resultRevaluation of property, plant and equipmentActuarial gain/(loss) on RBF provision 19 41,331 232 41,331 232Income tax relating to components of other comprehensive income (12,399) (70) (12,399) (70)
Items that may be reclassified in subsequent years to operating resultForeign currency translation gain/(loss) (26) 79 - -Fair value gain/(loss) on cash flow hedges 5,146 5,904 4,081 2,973Income tax relating to components of other comprehensive income (1,536) (1,794) (1,224) (891)Total other comprehensive income for the year, net of taxTotal other comprehensive income 32,516 4,351 31,789 2,244
Total comprehensive income/(loss) attributable to the owners of the parent 161,191 147,900 108,321 123,310
The Statement of Comprehensive Income is to be read in conjunction with the notes to and forming part of the financial report included on pages 51 to 108.
Statement of Comprehensive Income for the Year Ended 30 June 2015
47Hydro Tasmania Annual Report 2015 47

CONSOLIDATED PARENTNOTE 2015 2014 2015 2014
$’000 $’000 $’000 $’000Current assetsCash and cash equivalents 15,683 13,001 8,554 8,306Receivables 6 250,476 241,086 99,076 96,419Investments 7(a) 11 11 - -Inventories 8 2,539 2,331 2,539 2,331Other financial assets 11(a) 134,129 200,401 134,091 197,518Current tax asset 4(c) 25,876 - 25,876 -Other 12(a) 15,314 11,213 8,603 8,250Total current assets 444,028 468,043 278,739 312,824
Non-current assetsInvestments 7(b) - - 203,827 203,827Investments in joint ventures 7(b) 68,556 68,939 - -Property plant and equipment 9 4,119,687 3,894,586 4,023,182 3,777,234Other financial assets 11(b) 425,516 488,384 425,516 488,384Intangible assets 10 88,400 75,209 85,173 74,831Goodwill 13 16,396 16,396 - -Other 12(b) 33,185 13,247 - 135Total non-current assets 4,751,740 4,556,761 4,737,698 4,544,411
TOTAL ASSETS 5,195,768 5,024,804 5,016,437 4,857,235
Current liabilitiesPayables 14 164,283 176,073 95,890 120,253Interest-bearing liabilities 15(a) 65,403 369,285 65,403 369,285Provisions 16(a) 100,003 100,399 38,043 37,321Provision for income tax 4(c) - 46,755 - 46,780Other financial liabilities 17(a) 142,210 157,615 142,210 156,550Other 18 8,338 6,425 95,506 53,234Total current liabilities 480,237 856,552 437,052 783,423
Non-current liabilitiesInterest-bearing liabilities 15(a) 789,612 494,717 789,612 494,717Deferred tax liability 4(d) 569,678 508,332 654,854 597,559Provisions 16(b) 401,704 458,691 303,886 345,666Other financial liabilities 17(b) 891,216 890,797 891,216 890,797Total non-current liabilities 2,652,210 2,352,537 2,639,568 2,328,739
TOTAL LIABILITIES 3,132,447 3,209,089 3,076,620 3,112,162
NET ASSETS 2,063,321 1,815,715 1,939,817 1,745,073
EQUITYContributed equity 558,206 353,206 558,206 353,206Reserves (8,122) (13,242) (7,735) (11,816)Retained earnings 1,513,237 1,475,751 1,389,346 1,403,683TOTAL EQUITY 2,063,321 1,815,715 1,939,817 1,745,073
The Balance Sheet is to be read in conjunction with the notes to and forming part of the financial report included on pages 51 to 108.
Balance Sheet as at 30 June 2015
48 Annual Report 2015 Hydro Tasmania

CONSOLIDATED PARENTNOTE 2015 2014 2015 2014
$’000 $’000 $’000 $’000CASH FLOW FROM OPERATING ACTIVITIESInflows:Receipts from customers 1,470,704 1,957,004 592,360 926,896Operating grants and subsidies received 9,605 9,264 9,605 9,264Interest received 256 333 250 472
Outflows:Payments to suppliers and employees (1,315,603) (1,561,575) (413,774) (460,579)Interest paid (50,708) (46,776) (50,708) (46,776)Government guarantee fee (8,719) (11,427) (8,719) (11,427)Income tax equivalent paid (80,069) (103,861) (80,069) (103,861)NET CASH PROVIDED BY OPERATING ACTIVITIES 5(b) 25,466 242,962 48,945 313,989
CASH FLOW FROM INVESTING ACTIVITIESInflows:Proceeds from sale of property, plant and equipment 567 761 593 761Proceeds from financial derivatives 200 11,267 200 9,929Proceeds from loans to associates 1,102 1,173 135 -Dividends from joint venture 2,156 900 - -
Outflows:Payments for financial derivatives (2,950) - (9,485) -Net payments of intercompany loans - - (20,907) (71,176)Payments for property, plant and equipment (100,698) (118,697) (96,072) (115,248)NET CASH USED IN INVESTING ACTIVITIES (99,623) (104,596) (125,536) (175,734)
CASH FLOW FROM FINANCING ACTIVITIESInflows:Proceeds from Tascorp loans 475,369 185,700 475,369 185,700Equity contributions received 205,000 - 205,000 -
Outflows:Repayment of Tascorp loans (484,269) (227,100) (484,269) (227,100)Repayment of finance lease (685) (669) (685) (669)Dividends paid (118,576) (116,058) (118,576) (116,058)Equity contributions repaid - (7,033) - (7,033)NET CASH USED IN FINANCING ACTIVITIES 76,839 (165,160) 76,839 (165,160)
NET (DECREASE)/INCREASE IN CASH 2,682 (26,794) 248 (26,905)
CASH AT BEGINNING OF THE YEAR 13,012 39,806 8,306 35,211
CASH AT END OF THE YEAR 5(a) 15,694 13,012 8,554 8,306
The Cash Flow Statement is to be read in conjunction with the notes to and forming part of the financial report included on pages 51 to 108.
Cash Flow Statement for the Year Ended 30 June 2015
49Hydro Tasmania Annual Report 2015 49

CONSOLIDATED PARENTNOTE 2015 2014 2015 2014
$’000 $’000 $’000 $’000CONTRIBUTED EQUITYBalance at the beginning of the year 353,206 360,239 353,206 360,239Equity contributions from the State of Tasmania 205,000 - 205,000 -Equity contributions repaid to the State of Tasmania - (7,033) - (7,033)Balance at the end of the year 558,206 353,206 558,206 353,206
RESERVESDerivative revaluation reserve 1.2(j), Balance at the beginning of the year 1.2(r) (12,881) (18,785) (11,816) (14,789)Forward exchange contracts 5,146 5,094 4,081 2,163Interest rate swaps - 810 - 810Balance at the end of the year (7,735) (12,881) (7,735) (11,816)
Foreign currency translation reserveBalance at the beginning of the year (361) (440) - -Foreign currency translation (26) 79 - -Balance at the end of the year (387) (361) - -
TOTAL RESERVES (8,122) (13,242) (7,735) (11,816)
RETAINED EARNINGSBalance at the beginning of the year 1,475,751 1,448,142 1,403,683 1,396,575Net profit/(loss) 128,675 143,549 76,532 121,066Dividend paid (118,576) (116,058) (118,576) (116,058)Deferred income tax recognised directly in equity 4(b) (13,935) (1,864) (13,623) (961)Actuarial gain on defined benefit plans 19 41,331 232 41,331 232Other (9) 1,750 (1) 2,829Balance at the end of the year 1,513,237 1,475,751 1,389,346 1,403,683
TOTAL EQUITY 2,063,321 1,815,715 1,939,817 1,745,073
The Statement of Changes in Equity is to be read in conjunction with the notes to and forming part of the financial report included on pages 51 to 108.
Statement of Changes in Equityfor the year ended 30 June 2015
50 Annual Report 2015 Hydro Tasmania
1.1 DETAILS OF REPORTING ENTITYThe financial statements and notes thereto relate to the Hydro-Electric Corporation (the Corporation), which is a Tasmanian Government Business Enterprise and a consolidated reporting entity. The Corporation was established as the Hydro-Electric Commission by the Hydro-Electric Commission Act 1944 and was incorporated by the Hydro-Electric Corporation Act 1995. The Corporation trades using the business names Hydro Tasmania, Entura, and through the Corporation’s subsidiary, Momentum Energy Pty Ltd.
The Corporation’s Australian Business Number is 48 072 377 158. Its principal place of business is 4 Elizabeth Street, Hobart, Tasmania.
The Corporation owns 55 major dams, 30 operating hydro power stations, the Tamar Valley gas-fired power station, and supplies electricity to Bass Strait islands via diesel and wind power generation. The Corporation sells energy to retail customers through its subsidiary, Momentum Energy Pty Ltd, trading in all regions of the National Electricity Market (NEM). The Corporation also operates the Entura consulting business.
At 30 June 2015 the Corporation had 1,061 full-time equivalent employees (FTEs) (2014: 1,101 FTEs) including 5 non-executive directors (2014: 6 FTEs).
The Corporation holds Australian Financial Services Licence number 279796. This licence authorises the Corporation to carry on a financial services business in accordance with the licence conditions.
The financial report for the year ended 30 June 2015 was adopted by the directors on 13 August 2015.
1.2 SUMMARY OF SIGNIFICANT ACCOUNTING POLICIESThe significant accounting policies which have been adopted in the preparation of these financial statements have been consistently applied by each entity in the consolidated group.
(a) Basis of preparation
The financial report is a general purpose financial report prepared on an accrual basis under the historical cost convention except for derivative financial assets and liabilities, inventory of environmental energy products and generation assets which are carried at fair value.
The carrying values of recognised assets and liabilities that are hedged are adjusted to record changes in the fair value attributable to the risks that are being hedged.
The financial report is prepared in accordance with:
• Hydro-Electric Corporation Act 1995;
• Government Business Enterprises Act 1995 (GBE Act) and related Treasurer’s Instructions;
• Australian Accounting Standards and interpretations; and
• Financial disclosure requirements of the Corporations Act 2001, where applicable to the operations of the Corporation and its subsidiaries, and other requirements of the law.
(b) Statement of compliance
The financial report is compliant with Australian Accounting Standards including the Australian equivalents to International Financial Reporting Standards (AIFRS).
In complying with AIFRS, the Corporation is ensuring that the consolidated financial statements and accompanying notes are also compliant with International Financial Reporting Standards (IFRS).
51Hydro Tasmania Annual Report 2015 51
Notes to and forming part of the financial statements for the year ended 30 June 2015

1.2 SUMMARY OF SIGNIFICANT ACCOUNTING POLICIES (CONTINUED)The following Australian Accounting Standards are applicable to the Corporation and have recently been issued or amended. As they are not yet effective the Corporation has chosen not to adopt them for the year ended 30 June 2015:
Standard/Interpretation Effective for annual Expected to be initially reporting periods applied in the financial beginning on or after year ending
AASB 9 ‘Financial Instruments’, and the relevant 1 January 2018 30 June 2019 amending standards
AASB 15 ‘Revenue from Contracts with 1 January 2017 30 June 2018 Customers’ and AASB 2014-5 ‘Amendments to Australian Accounting Standards arising from AASB 15’
AASB 2014-3 ‘Amendments to Australian 1 January 2016 30 June 2017 Accounting Standards – Accounting for Acquisitions of Interests in Joint Operations’
AASB 2014-4 ‘Amendments to Australian 1 January 2016 30 June 2017 Accounting Standards – Clarification of Acceptable Methods of Depreciation and Amortisation’
AASB 2014-9 ‘Amendments to Australian 1 January 2016 30 June 2017 Accounting Standards – Equity Method in Separate Financial Statements’
AASB 2014-10 ‘Amendments to Australian 1 January 2016 30 June 2017 Accounting Standards – Sale or Contribution of Assets between an Investor and its Associate or Joint Venture’
AASB 2015-1 ‘Amendments to Australian 1 January 2016 30 June 2017 Accounting Standards – Annual Improvements to Australian Accounting Standards 2012-2014 Cycle’
AASB 2015-2 ‘Amendments to Australian 1 January 2016 30 June 2017 Accounting Standards – Disclosure Initiative: Amendments to AASB 101’
AASB 2015-3 ‘Amendments to Australian 1 July 2015 30 June 2016 Accounting Standards arising from the Withdrawal of AASB 1031 Materiality’
Impact of changes to Australian Accounting Standards and Interpretations
AASB 9 ‘Financial Instruments’, and the relevant amending standards
AASB 9 issued in December 2009 introduced new requirements for the classification and measurement of financial assets. AASB 9 was subsequently amended in December 2010 to include requirements for the classification and measurement of financial liabilities and for derecognition, and in December 2013 to include the new requirements for general hedge accounting. Another revised version of AASB 9 was issued in December 2014 mainly to include
a) impairment requirements for financial assets and
b) limited amendments to the classification and measurement requirements by introducing a ‘fair value through other comprehensive income’ (FVTOCI) measurement category for certain simple debt instruments.
Key requirements of AASB 9:
• all recognised financial assets that are within the scope of AASB 139 ‘Financial Instruments: Recognition and Measurement’ are required to be subsequently measured at amortised cost or fair value. Specifically, debt investments that are held within a business model whose objective is to collect the contractual cash flows, and that have contractual cash flows that are solely payments of principal and interest on the principal outstanding are generally measured at amortised cost at the end of subsequent accounting periods. Debt instruments that are held within a business model whose objective is achieved both by collecting contractual cash flows
52 Annual Report 2015 Hydro Tasmania
Notes to and forming part of the financial statements for the year ended 30 June 2015

1.2 SUMMARY OF SIGNIFICANT ACCOUNTING POLICIES (CONTINUED) and selling financial assets, and that have contractual terms of the financial asset give rise on specified dates to cash flows that are
solely payments of principal and interest on the principal amount outstanding, are measured at FVTOCI. All other debt investments and equity investments are measured at their fair value at the end of subsequent accounting periods. In addition, under AASB 9, entities may make an irrevocable election to present subsequent changes in the fair value of an equity investment (that is not held for trading) in other comprehensive income, with only dividend income generally recognised in profit or loss.
• with regard to the measurement of financial liabilities designated as at fair value through profit or loss, AASB 9 requires that the amount of change in fair value of the financial liability that is attributable to changes in the credit risk of that liability is presented in other comprehensive income, unless the recognition of the effects of changes in the liability’s credit risk in other comprehensive income would create or enlarge an accounting mismatch in profit or loss. Changes in fair value attributable to a financial liability’s credit risk are not subsequently reclassified to profit or loss. Under AASB 139, the entire amount of the change in the fair value of the financial liability designated as fair value through profit or loss is presented in profit or loss.
• in relation to the impairment of financial assets, AASB 9 requires an expected credit loss model, as opposed to an incurred credit loss model under AASB 139. The expected credit loss model requires an entity to account for expected credit losses and changes in those expected credit losses at each reporting date to reflect changes in credit risk since initial recognition. In other words, it is no longer necessary for a credit event to have occurred before credit losses are recognised. The new general hedge accounting requirements retain the three types of hedge accounting mechanisms currently available in AASB 139. Under AASB 9, greater flexibility has been introduced to the types of transactions eligible for hedge accounting, specifically broadening the types of instruments that qualify for hedging instruments and the types of risk components of non-financial items that are eligible for hedge accounting. In addition, the effectiveness test has been overhauled and replaced with the principle of an ‘economic relationship’. Retrospective assessment of hedge effectiveness is also no longer required. Enhanced disclosure requirements about an entity’s risk management activities have also been introduced.
The directors of the Corporation anticipate that the application of AASB 9 in the future is not likely to have a material impact on amounts reported in respect of the Group’s financial assets and financial liabilities. However, it is not practicable to provide a reasonable estimate of the effect of AASB 9 until the Group undertakes a detailed review.
AASB 15 ‘Revenue from Contracts with Customers’
• AASB 15 establishes a single comprehensive model for entities to use in accounting for revenue arising from contracts with customers. AASB 15 will supersede the current revenue recognition guidance including AASB 118 ‘Revenue,’ AASB 111 ‘Construction Contracts’ and the related Interpretations when it becomes effective.
• The core principle of AASB 15 is that an entity should recognise revenue to depict the transfer of promised goods or services to customers in an amount that reflects the consideration to which the entity expects to be entitled in exchange for those goods or services. Specifically, the Standard introduces a 5-step approach to revenue recognition:
• Step 1: Identify the contract(s) with a customer
• Step 2: Identify the performance obligations in the contract
• Step 3: Determine the transaction price
• Step 4: Allocate the transaction price to the performance obligations in the contract
• Step 5: Recognise revenue when (or as) the entity satisfies a performance obligation
• Under AASB 15, an entity recognises revenue when (or as) a performance obligation is satisfied, i.e. when ‘control’ of the goods or services underlying the particular performance obligation is transferred to the customer.
The directors of the Corporation anticipate that the application of AASB 15 in the future is not likely to have a material impact on the amounts reported in the Group’s consolidated financial statements. However, the Corporation is still in the process of completing a detailed assessment on the anticipated impacts and disclosure.
(c) Principles of consolidation
The consolidated financial report includes the Corporation, being the parent entity, and its controlled entities.
The financial report includes the information and results of each controlled entity from the date on which the Corporation obtained control and until such time as the Corporation ceased to control the entity. The financial reports of subsidiaries are prepared for the same reporting period as the Corporation.
In preparing the consolidated financial report, the effects of all transactions between entities in the group have been eliminated.
53Hydro Tasmania Annual Report 2015 53
Notes to and forming part of the financial statements for the year ended 30 June 2015

1.2 SUMMARY OF SIGNIFICANT ACCOUNTING POLICIES (CONTINUED)(d) Significant accounting judgements
In the process of applying the Corporation’s accounting policies, the Corporation has made the following judgements, apart from those involving estimates, which have a significant effect on the amount recognised in the financial report.
• Fair value of hydro generation assets
Note 1.2 (i) and note 9 describe the judgement process adopted in assessing fair value of hydro generation assets. Note 1.2(m) describes the judgement process adopted to estimate the recoverable amount of property, plant and equipment when an indication of revaluation exists or when a previous indicator of revaluation has reversed.
• Financial liabilities and financial assets
Notes 1.2(j) and (r) describe the valuation methods applied to the Corporation’s financial liabilities and financial assets which include judgements about market conditions and activity.
Note 3 details assumptions on financial assets and liabilities.
(e) Significant accounting estimates and assumptions
The Retirement Benefits Fund liability detailed in note 19 has been assessed by the State Actuary and various actuarial assumptions have been applied to arrive at the carrying value reported.
(f) Receivables
Current trade receivables include amounts receivable on 30 day terms from Australian Energy Market Operator (AEMO) for electricity sales and amounts receivable on 30 to 90 day terms for consulting services. They also include amounts receivable on terms varying from 14 to 90 days for retail sales of electricity and gas. Receivables are recognised and carried at the invoiced amount less an allowance for impairment. Such an allowance is only recognised when there is objective evidence that the debt is impaired. Any bad debts are written off as an expense or against the provision for impairment.
All trade receivables are non-interest bearing except for Entura consulting receivables which, if past due, are charged interest in accordance with the contract.
Non-current receivables are recognised and carried at amortised cost. Amortisation of receivables is calculated using the effective interest method. Any allowance for impairment is deducted from the carrying value.
Prior to extending credit to new Entura consulting clients and Momentum retail customers, credit checks are undertaken by referencing external credit reports and contacting credit referees. Additional risks are reviewed in relation to new international clients.
(g) Inventories
Inventories are carried at the lower of cost and net realisable value.
Net realisable value is the estimated selling price in the ordinary course of business less the estimated costs necessary to make the sale.
(h) Cash and cash equivalents
Cash and cash equivalents reported in the Balance Sheet and Cash Flow Statement comprises cash on hand and in banks and short-term deposits. Short-term deposits have an original maturity of three months or less, are readily convertible to known amounts of cash and are subject to an insignificant risk of change in value.
54 Annual Report 2015 Hydro Tasmania
Notes to and forming part of the financial statements for the year ended 30 June 2015
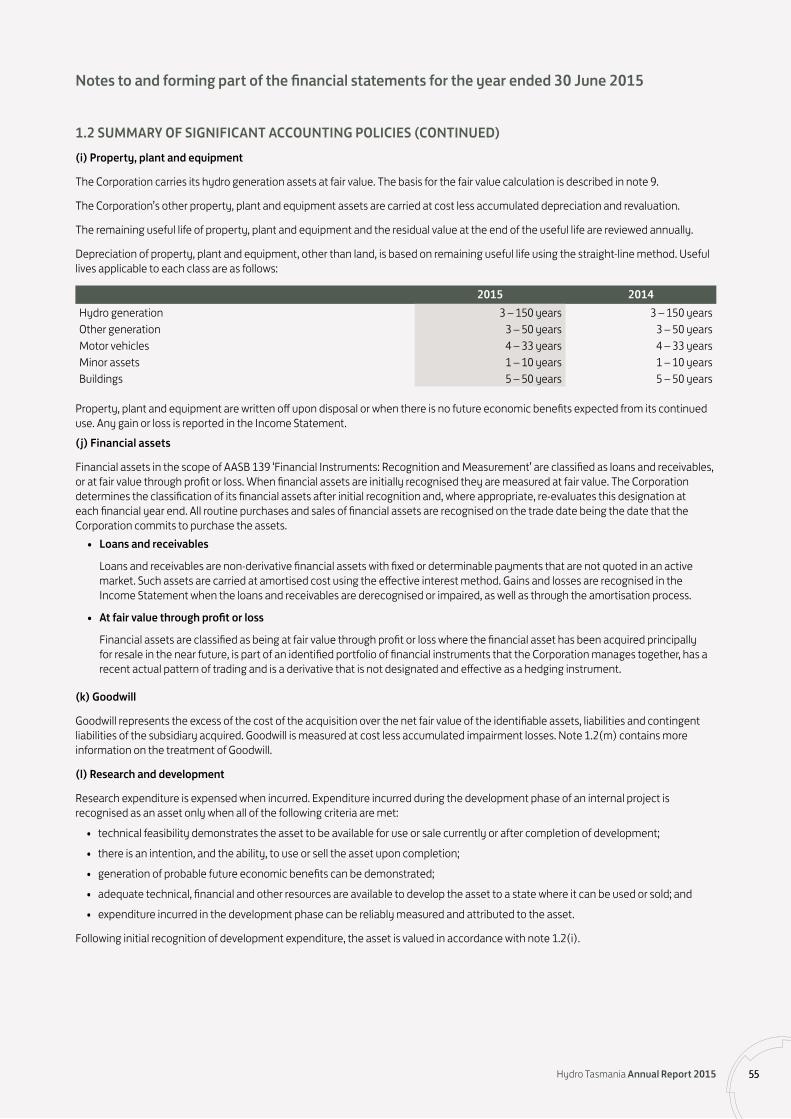
1.2 SUMMARY OF SIGNIFICANT ACCOUNTING POLICIES (CONTINUED)(i) Property, plant and equipment
The Corporation carries its hydro generation assets at fair value. The basis for the fair value calculation is described in note 9.
The Corporation’s other property, plant and equipment assets are carried at cost less accumulated depreciation and revaluation.
The remaining useful life of property, plant and equipment and the residual value at the end of the useful life are reviewed annually.
Depreciation of property, plant and equipment, other than land, is based on remaining useful life using the straight-line method. Useful lives applicable to each class are as follows:
2015 2014Hydro generation 3 – 150 years 3 – 150 yearsOther generation 3 – 50 years 3 – 50 yearsMotor vehicles 4 – 33 years 4 – 33 yearsMinor assets 1 – 10 years 1 – 10 yearsBuildings 5 – 50 years 5 – 50 years
Property, plant and equipment are written off upon disposal or when there is no future economic benefits expected from its continued use. Any gain or loss is reported in the Income Statement.(j) Financial assets
Financial assets in the scope of AASB 139 ‘Financial Instruments: Recognition and Measurement’ are classified as loans and receivables, or at fair value through profit or loss. When financial assets are initially recognised they are measured at fair value. The Corporation determines the classification of its financial assets after initial recognition and, where appropriate, re-evaluates this designation at each financial year end. All routine purchases and sales of financial assets are recognised on the trade date being the date that the Corporation commits to purchase the assets.
• Loans and receivables
Loans and receivables are non-derivative financial assets with fixed or determinable payments that are not quoted in an active market. Such assets are carried at amortised cost using the effective interest method. Gains and losses are recognised in the Income Statement when the loans and receivables are derecognised or impaired, as well as through the amortisation process.
• At fair value through profit or loss
Financial assets are classified as being at fair value through profit or loss where the financial asset has been acquired principally for resale in the near future, is part of an identified portfolio of financial instruments that the Corporation manages together, has a recent actual pattern of trading and is a derivative that is not designated and effective as a hedging instrument.
(k) Goodwill
Goodwill represents the excess of the cost of the acquisition over the net fair value of the identifiable assets, liabilities and contingent liabilities of the subsidiary acquired. Goodwill is measured at cost less accumulated impairment losses. Note 1.2(m) contains more information on the treatment of Goodwill.
(l) Research and development
Research expenditure is expensed when incurred. Expenditure incurred during the development phase of an internal project is recognised as an asset only when all of the following criteria are met:
• technical feasibility demonstrates the asset to be available for use or sale currently or after completion of development;
• there is an intention, and the ability, to use or sell the asset upon completion;
• generation of probable future economic benefits can be demonstrated;
• adequate technical, financial and other resources are available to develop the asset to a state where it can be used or sold; and
• expenditure incurred in the development phase can be reliably measured and attributed to the asset.
Following initial recognition of development expenditure, the asset is valued in accordance with note 1.2(i).
55Hydro Tasmania Annual Report 2015 55
Notes to and forming part of the financial statements for the year ended 30 June 2015

1.2 SUMMARY OF SIGNIFICANT ACCOUNTING POLICIES (CONTINUED)(m) Asset impairment
At each reporting date the Corporation assesses whether there is an indication that an asset may be impaired. If any such indication exists the Corporation makes an estimate of the asset’s recoverable amount. For goodwill, an assessment of impairment is performed and the recoverable amount is estimated each year. An asset’s recoverable amount is the higher of its fair value less costs to sell and its value in use. Value in use is determined for each individual asset, unless the asset does not generate cash inflows that are largely independent of those from other assets or groups of assets. In such cases the asset is tested for revaluation as part of the cash generating unit (CGU) to which it belongs. Goodwill acquired in a business combination, for the purpose of revaluation testing, is allocated to the CGUs that are expected to benefit from the synergies of the combination.
When the carrying amount of an asset or CGU exceeds its recoverable amount, the asset or CGU is considered impaired and is written down to its recoverable amount. Impairment losses are allocated first to reduce the carrying amount of any goodwill allocated to the CGU and then to reduce the carrying amount of the other assets in the CGU on a pro rata basis. The Corporation classifies its hydro generating assets, the Momentum Energy retail business and the gas-fired generation business as separate CGUs.
In assessing value in use, the estimated future cash flows are discounted to their present value using the pre-tax nominal weighted average cost of capital that reflects current market assessment of the time value of money and the expected life of the asset. In assessing fair value, estimates are made of the current market value of an asset less estimated cost of sale.
An assessment is also made at each reporting date as to whether there is any indication that the cause of previously recognised impairment losses may no longer exist or have decreased. A previously recognised impairment loss is only reversed if there has been a change in the estimates used to determine the asset’s recoverable amount since the last impairment loss was recognised. If that is the case the carrying amount of the asset is increased to its recoverable amount and a gain is recognised in the Income Statement. The impairment reversal cannot result in a carrying amount exceeding the amount that would have been determined, net of depreciation or amortisation, had no revaluation loss been recognised for the asset in prior years. An impairment of goodwill is not reversed.
(n) Payables
All trade payables and accrued expenses are unsecured and non-interest bearing, are normally settled within supplier credit terms and are carried at the invoiced amount.
(o) Provisions
A provision is recognised when there is a legal or constructive obligation as a result of a past event, it is probable that a future sacrifice of economic benefits will be required to settle the obligation and a reliable estimate can be made of the obligation.
Provisions relating to a liability that is expected to be settled more than 12 months after the balance date are discounted using a pre-tax rate that reflects the risks of the underlying liability.
An onerous contract is considered to exist when the Corporation is party to a contract under which the unavoidable cost of meeting contractual obligations exceeds the economic benefits to be received. Net obligations arising under onerous contracts are recognised as a provision.
A restructuring provision is recognised when the Group has developed a detailed formal plan for the restructuring and has raised a valid expectation in those affected that it will carry out the restructuring by starting to implement the plan or announcing its main features to those affected by it. The measurement of a restructuring provision includes only the direct expenditures arising from the restructuring, which are those amounts that are both necessarily entailed by the restructuring and not associated with the ongoing activities of the entity.
(p) Employee benefits
• Wages, salaries and annual leave
Liabilities for wages, salaries and annual leave are recognised as the present obligations resulting from employees’ services provided to the reporting date. These liabilities include related on-costs. Liabilities expected to be settled within 12 months are based on wage and salary rates that the Corporation expects to pay at the time of settlement. For those expected to be settled later than 12 months the liability is calculated using expected future increases in wage and salary rates including related on-costs and the expected rate of utilisation based on historical patterns, and is discounted using Corporate Bond rates at reporting date.
• Long service leave
The provision for long service leave represents the present value of the expected future cash payments for entitlements earned through employees’ services provided to reporting date.
The provision is calculated using expected future increases in wage and salary rates including related on-costs and the expected rate of utilisation based on historical patterns and is discounted using Corporate Bond rates at reporting date. The provision is segregated into current and non-current portions based on vesting of entitlements in the next 12 months.
56 Annual Report 2015 Hydro Tasmania
Notes to and forming part of the financial statements for the year ended 30 June 2015
1.2 SUMMARY OF SIGNIFICANT ACCOUNTING POLICIES (CONTINUED)(p) Employee benefits (continued)
• Defined benefit plan
The Retirement Benefits Fund (RBF) is a defined benefit plan funded by employee and employer contributions. Employee contributions to the fund are transferred to independent RBF administrators while employer obligations are raised as a provision. The defined benefit plan is closed to new members.
An interest charge, calculated by the application of market-related interest rates, is added to this provision each year after advice from the State Actuary. This is reported in the Income Statement as part of finance costs.
• Defined contribution plans
Contributions to defined contribution superannuation plans are made as directed by the employee and are expensed when the employee has rendered service entitling them to the contribution.
• Employee termination benefits
Termination benefits are expensed at the earlier of when the Group can no longer withdraw the offer of those benefits and when the Group recognises costs for a restructuring. If benefits are not expected to be settled wholly within 12 months of the end of the reporting period, then they are discounted.
(q) Taxation
• Income tax equivalent
Under the Government Business Enterprises Act 1995 the Corporation is required to pay an income tax equivalent to the State of Tasmania as if it were a company under Commonwealth income tax laws. As a result the Corporation applies tax effect accounting principles prescribed in AASB 112 Income Taxes.
Current tax assets and liabilities are measured at the amount expected to be paid or recovered. The tax rates and tax laws used to compute the amount are those that are enacted or substantively enacted by the balance sheet date.
Subject to the condition noted below, deferred income tax assets and liabilities are recorded for all temporary differences at balance date between the tax bases of assets and liabilities and their carrying amounts for financial reporting purposes.
Deferred tax assets are recognised to the extent that it is probable that sufficient taxable income will be available against which deductible temporary differences can be utilised. However, deferred tax assets and liabilities are not recognised if the temporary differences giving rise to them arise from the initial recognition of assets and liabilities which affect neither taxable income nor accounting profit.
Deferred tax liabilities are recognised for taxable temporary differences associated with investments in subsidiaries and interest in joint ventures except where the Corporation is able to control the reversal of the temporary differences and it is probable that the temporary differences will not reverse in the foreseeable future.
Income taxes relating to items recognised directly in equity are recognised as other comprehensive income or expense in the Statement of Comprehensive Income.
Deferred tax assets and deferred tax liabilities are offset only if a legally enforceable right of set-off exists and they relate to the same taxable entity and the same taxation authority.
• Tax consolidation
Income tax legislation allows groups, comprising a parent entity and its Australian wholly-owned entities, to elect to consolidate and be treated as a single entity for income tax purposes.
The Corporation and its wholly-owned Australian resident subsidiaries have consolidated for tax purposes under this legislation and have elected to be taxed as a single entity. The head entity within the tax consolidation group is the Hydro-Electric Corporation.
Tax sharing agreements between the Corporation as head entity and its subsidiaries define the liability for tax of each member of the group and the process by which members can exit the group. As a result of these agreements amounts equivalent to the deferred tax assets and liabilities are disclosed by each subsidiary as intercompany loan balances as if the subsidiary were a stand-alone tax entity.
Each of the entities in the tax consolidated group has agreed to make a tax equivalent payment to the head entity based on that entity’s tax payable on a stand-alone basis. Such amounts are reflected as amounts receivable from or payable to other entities in the tax consolidated group.
57Hydro Tasmania Annual Report 2015 57
Notes to and forming part of the financial statements for the year ended 30 June 2015

1.2 SUMMARY OF SIGNIFICANT ACCOUNTING POLICIES (CONTINUED)(q) Taxation (continued)
• Other taxes Revenues, expenses, assets and liabilities are recognised net of the amount of goods and services tax (GST) except:• When the GST incurred on a purchase of goods or services is not recoverable from the taxation authority, in which case the GST is
recognised as part of the cost of acquisition of the asset or as part of the expense item as applicable; and• Receivables and payables, which are stated with the amount of GST included. Cash flows are included in the Cash Flow Statement on a gross basis. The GST component of cash flows arising from investing and
financing activities, which is recoverable from, or payable to, the taxation authority, is classified as operating cash flow.
Commitments and contingencies are disclosed net of the amount of GST recoverable from, or payable to, the taxation authority.
(r) Financial liabilities
Financial liabilities include trade payables, interest-bearing liabilities and derivative financial instruments such as energy contracts, credit swaps, interest rate swaps, forward foreign exchange contracts and the Basslink contracts.
The Corporation enters into derivative financial instruments to manage financial exposure to electricity prices, exchange rates and interest rates.
Derivatives are initially recognised at fair value on the date the Corporation becomes party to a contract. At subsequent reporting dates the fair value is remeasured and any gain or loss (with the exception of cash flow hedges qualifying for hedge accounting) is recognised in the Income Statement.
The Corporation designates certain derivatives as effective hedges to allow hedge accounting rules to be applied. A hedge is effective if it demonstrates changes in fair value or cash flows that offset those attributable to the hedged risk over the designated hedging period. At inception of a hedge relationship the Corporation formally designates and documents the hedge relationship to which the Corporation wishes to apply hedge accounting and the alignment of the hedge to the Corporation’s risk management objectives and strategies. The documentation includes identification of the hedging instrument, the hedged item or transaction, the nature of the risk being hedged and how the Corporation will assess the hedging instrument’s effectiveness in offsetting the exposure to changes in the hedged item’s fair values or cash flows attributable to the hedged risk. Such hedges are assessed on an ongoing basis to determine that they have been highly effective throughout the financial reporting periods for which they were designated.
Cash flow hedges are hedges of the Corporation’s exposure to variability in cash flows attributable to a particular risk associated with a recognised asset or liability or a highly probable forecast transaction that could affect profit or loss. The effective portion of the gain or loss on the hedging instrument is recognised directly in equity, while the ineffective portion is recognised as a gain or loss from current year operations in the Income Statement.
Amounts taken to equity are transferred to the Income Statement when the hedged transaction affects profit or loss, such as when hedged income or expenses are recognised or when a forecast transaction occurs. When the hedged item is the cost of a non-financial asset or liability, the amounts taken to equity are transferred to the initial carrying amount of the non-financial asset or liability.
If the forecast transaction is no longer expected to occur, amounts previously recognised in equity are recognised as gains or losses from current year operations in the Income Statement. If the hedging instrument expires or is sold, terminated or exercised without replacement or rollover, or if its designation as a hedge is revoked, amounts previously recognised in equity remain in equity until the forecast transaction occurs.
(s) Leases
The determination of whether an arrangement is or contains a lease is based on the substance of the arrangement and requires an assessment of whether the fulfilment of the arrangement is dependent on the use of a specific asset and the arrangement conveys a right to use the asset.
• Corporation as a lessee When the Corporation assumes substantially all the risks and rewards of ownership under a lease it is classified as a finance lease.
Upon initial recognition the leased asset is measured at the lower of its fair value and the present value of the minimum lease payments. Subsequent to initial recognition, the asset is accounted for in accordance with the accounting policy applicable to the class of asset to which it is assigned. Lease payments under a finance lease are apportioned between the finance expense and the reduction of the outstanding liability.
Other leases are operating leases. Payments under operating leases are recognised as an expense in the Income Statement on a straight-line basis over the lease term. Lease incentives are recognised in the Income Statement as an integral part of the total lease expense.
• Corporation as a lessor Leases in which the Corporation retains substantially all the risks and benefits of ownership of the leased asset are classified as
operating leases. Initial direct costs incurred in negotiating an operating lease are added to the carrying amount of the leased asset.
58 Annual Report 2015 Hydro Tasmania
Notes to and forming part of the financial statements for the year ended 30 June 2015

1.2 SUMMARY OF SIGNIFICANT ACCOUNTING POLICIES (CONTINUED)(t) Borrowing expenses
Borrowing costs associated with the raising of loans are expensed when incurred except those borrowing costs directly attributable to an asset. Borrowing costs attributable to an asset are included in the capital cost of the asset.
(u) Interest-bearing liabilities
Loans are recognised initially at the fair value of the consideration received. Subsequent to initial recognition loans are measured at amortised cost using the effective interest method.
(v) Foreign currency
The consolidated statements of the Corporation are presented in the functional currency which is Australian dollars.
All foreign currency transactions are brought to account using the spot exchange rate in effect at the date of the transaction. Foreign currency amounts at balance date are translated to Australian dollars using the exchange rate in effect at that date.
Foreign currency transactions that are hedged are accounted for as detailed in note 1.2 (j) or 1.2 (r).
Exchange variances resulting from the translation of balances of foreign subsidiaries are recognised in the foreign currency translation reserve in equity.
All other exchange differences in the consolidated financial report are reported as gains or losses from current year operations in the Income Statement.
(w) Joint ventures
A joint venture is a contractual arrangement whereby two or more parties undertake an economic activity which is subject to joint control.
An investor controls an investee if they have power over the investee, are exposed to variable returns, and are able to use their power over the investee to affect the amount of the returns. The Corporation has assessed power over the joint ventures by reference to the shareholders agreement relating to each joint venture, the respective voting rights held and the percentage of vote required to effect a decision. In each case the requirement to have unanimous agreement to a decision prevents the Corporation having power over any of the joint ventures. The Corporation is subject to variable returns but is unable to influence the amount of those returns in the absence of having power over the joint venture.
Interests in incorporated joint venture entities are reported in the consolidated financial report using the equity method and in the parent entity financial report using the cost method. If the carrying amount of an investment in a joint venture is zero, the Corporation’s share of a loss by the joint venture is reported as a loss against the current year operations in the Income Statement and accrued as a provision for later offset against any investments.
Unincorporated joint ventures which operate jointly controlled assets are accounted for by recognising the Corporation’s share of the venture’s assets, liabilities, revenues and expenses.
(x) Segment information
The Corporation has identified segments based on internal management reports. Refer to note 33.
(y) Contributed equity
Contributed equity from the State of Tasmania is recorded when received.
(z) Government grants
Government grants are recognised as revenue when there is reasonable assurance that the Corporation is able to meet the qualifying conditions.
Where a grant is received as compensation for certain expenditure, the grant is recognised as revenue in the Income Statement on a basis that matches the timing of the expenditure.
59Hydro Tasmania Annual Report 2015 59
Notes to and forming part of the financial statements for the year ended 30 June 2015
(aa) Revenue recognition
Revenue is recognised when the amount can be measured reliably, it is probable that the economic benefits associated with the transaction will flow to the Corporation, control over any goods and the associated risks and rewards of ownership have flowed to the buyer and any costs associated with the transaction can be reliably measured.
• Electricity and gas sales
Revenue from generated electricity and traded gas is earned from the Australian Energy Market Operator (AEMO) at market price and is recognised at the time the electricity or gas is provided. Revenue from sale of gas to other parties is recognised at contract prices at the time of delivery. Revenue from sale of retail electricity is earned at contract prices and is recognised at the time of delivery to the customer. Retail electricity sold is purchased from AEMO at market price. Exposure to fluctuations in market price is managed through the use of derivative contracts executed principally in the Tasmanian and Victorian regions. The realised gain or loss on settlement of these contracts against market price is included in electricity revenue or cost of electricity as applicable.
• Environmental energy products
Revenue from environmental energy products is recognised at the time the Corporation has earned the right to register the products.
• Consulting services
Consulting revenue is recognised on the basis of work completed and with regard to the contractual agreements that exist with the client.
• Interest income
Interest revenue is recognised on an accrual basis using the effective interest method. This is based on the amortised cost of a financial asset and the allocation of the interest income over the relevant period using the effective interest rate. The effective interest rate is the rate that exactly discounts estimated future cash receipts through the expected life of the financial asset to the net carrying amount of the financial asset.
• Dividends
Revenue is recognised when the Corporation’s right to receive the payment is established.
• Rental revenue
Rental income from land and buildings is recognised on a straight-line basis over the term of the lease.
(ab) Rounding
Amounts in the Financial Report have been rounded to the nearest thousand dollars, unless otherwise stated.
(ac) Comparative figures
Where necessary, the comparative figures for the previous year have been reclassified to facilitate comparison with the current year.
(ad) Change in Accounting Estimates
Employee benefits
A study commissioned by the Group of 100 (G100) and conducted by Milliman Australia in 2015 has concluded that a deep market in high quality corporate bonds now exists in Australia. Milliman Australia was then commissioned by G100 to generate a standardised set of discount rates to be made publicly available for the purpose of discounting employee benefit liabilities under Australian Accounting Standard 119 ‘Employee Benefits’. The discount rates are based on a blended yield curve for AA and AAA rated corporate bonds.
As a result, the Company used market yields on high quality corporate bonds to discount its defined benefit plan obligations and long service provision as required by AASB 119 for the first time in the current year. Previously, discount rates based on market yields on government bonds were used. This change in estimate resulted in a decrease to the Retirement Benefits Fund provision by $51.722m. The decrease in the Retirement Benefit Fund provision was recognised as an actuarial gain in other comprehensive income. It is impracticable to estimate the effect of this change in future years because the measurements of defined benefit plan and other long-term employee benefit obligations are based on a number of judgements, estimates and assumptions that change between reporting periods as new information becomes available.
60 Annual Report 2015 Hydro Tasmania
Notes to and forming part of the financial statements for the year ended 30 June 2015

2. REVENUE AND EXPENSESCONSOLIDATED PARENT
NOTE 2015 2014 2015 2014$’000 $’000 $’000 $’000
(a) RevenueRevenue from the sale of goods 1,425,724 1,931,028 544,400 828,511Revenue from the rendering of services 41,437 46,984 40,797 49,195
1,467,161 1,978,012 585,197 877,706
(b) Finance expensesLoan interest 47,022 51,095 47,022 51,095Government guarantee fee 9,237 12,063 9,237 12,063RBF interest 19 14,148 14,693 14,148 14,693Other finance costs 1,520 1,989 392 573
71,927 79,840 70,799 78,424
(c) Fair value gainsBasslink financial asset and liabilities - 106,181 - 106,181Energy price derivatives - 59,450 - 59,450Treasury derivatives 3 2 - -Onerous contracts 16,047 1,457 - -
Other - 482 - 160 16,050 167,572 - 165,791
(d) Fair value lossesBasslink financial asset and liabilities 40,810 - 40,810 -Energy price derivatives 73,100 - 73,100 -Treasury derivatives 320 1,696 320 1,694
Site rehabilitation provision 3,776 3,766 - - Onerous contracts 8,722 - 2,970 - Other 249 - 249 - Fair value losses 126,977 5,462 117,449 1,694
Fair value gains/(losses) (110,927) 162,110 (117,449) 164,097
(e) Revaluation and impairment expense/(gain) - (8,235) 51,968 43,963 Impairment of loan carried at amortised cost (232,066) 228,727 (249,410) 228,727 Revaluation (gain)/loss of generation assets (232,066) 220,492 (197,442) 272,690
61Hydro Tasmania Annual Report 2015 61
Notes to and forming part of the financial statements for the year ended 30 June 2015

3. ASSUMPTIONS AND JUDGEMENTSFinancial assets and liabilities
Changes in the fair value of financial assets and liabilities described below are presented as gains or losses through the Income Statement and are calculated based on the present value of projected cash flows. None of the adjustments reflect cash flow transactions during the year. In the case of those financial liabilities valued using published forward prices, while fair value represents an estimate of the cost of closing out the obligations at year end, the intention of the Corporation is to let the obligations run their course and deliver the associated financial benefits.
• Energy price derivatives
The Corporation trades in energy price derivatives in all regions of the National Electricity Market (NEM) as a means of securing the value of future electricity revenue or the cost of future electricity to be delivered under retail contracts. In accordance with AASB 139 ‘Financial Instruments: Recognition and Measurement’ financial derivatives are recorded at their fair value. Movement in fair value is recorded as a gain or loss in the Income Statement as detailed in note 2(c) and (d).
Mainland electricity contracts are valued using published forward energy prices. The remeasurement of the fair value of energy price derivatives at 30 June 2015 has resulted in a loss being recorded in the Income Statement (note 2(b)). Details of the methodology adopted are provided in note 20(c).
• Basslink financial asset and liabilities
The financial asset and liabilities associated with the Basslink agreements are recorded at fair value in accordance with AASB 139. The remeasurement of the net financial liability to fair value at 30 June 2015 has resulted in loss being recorded in the Income Statement (note 2(d)). Note 20(b) details the methodology used to calculate the fair value of the Basslink financial asset and liabilities.
Asset valuation
Assets are fair valued and assessed for impairment in accordance with the methodology described in note 1.2(m). Note 9 describes the inputs to the asset revaluation model. Goodwill generated by acquisition of a business is attributed to cash generating units (CGU) as described in note 1.2(m). Assessment of this goodwill for impairment is conducted in conjunction with the revaluation assessment of the relevant CGUs. Impairment assessment is undertaken on a value-in-use basis involving assessment of future cash flows associated with the strategic direction over the ensuing five years or useful life of the plant discounted at the Corporation’s weighted average cost of capital.
Acquisition of Tamar Valley Power Station and associated contracts
The transfer of the Tamar Valley Power Station and associated contracts from Aurora Energy Pty Ltd to the Corporation occurred on 1 June 2013 as part of the Tasmanian Government energy reforms.
Site rehabilitation provision
The Corporation has provided for the cost of removing the Bell Bay plant and removing the Tamar Valley Power Station at the end of its useful life. The provision also includes the cost of remediating the site within prescribed limits. The provision is reassessed each year to reflect the current estimated cost of the demolition and remediation. Any adjustment to the provision is reflected as a gain or loss in the Income Statement.
Onerous contracts
Present obligations arising under onerous contracts are recognised and measured as provisions. An onerous contract is considered to exist where the Corporation has a contract under which the unavoidable costs of meeting the obligations under the contract exceed the economic benefits expected to be received from the contract.
Unbilled energy
In valuing unbilled energy the Corporation estimates the load of electricity sold to customers as at 30 June at the average sale price.
62 Annual Report 2015 Hydro Tasmania
Notes to and forming part of the financial statements for the year ended 30 June 2015

4. INCOME TAX EQUIVALENTCONSOLIDATED PARENT
2015 2014 2015 2014$’000 $’000 $’000 $’000
(a) Income tax (benefit)/expense reported in the Income StatementCurrent income tax liability 14,330 104,806 21,813 113,980Adjustments in respect of income tax of prior years (7,534) (21,620) 2,341 (15,458)Income tax expense in relation to foreign operations 609 321 - -Deferred income tax expense arising from origination and reversal of temporary differences 47,411 (44,325) 43,673 (43,008)Income tax expense/(benefit) recognised in the Statement of Comprehensive Income 54,816 39,182 67,827 55,514
A reconciliation between income tax expense and accounting profit before income tax multiplied by the Group’s income tax rate is as follows:
Accounting profit before income tax 183,491 182,731 144,359 176,580
Income tax expense/(benefit) calculated at 30% 55,047 54,819 43,308 52,974Adjustment in respect of income tax of previous years (887) (15,177) 4,614 (13,346)Income tax expense in relation to foreign operations 609 321 - 20Expenditure not deductible for income tax purposes 47 59 11,139 16,706Effect of transactions within the tax consolidated group that are not subject to taxation - - 8,766 -Research and development concession - (840) - (840)Income tax expense/(benefit) recognised in the Statement of Comprehensive Income 54,816 39,182 67,827 55,514
(b) Income tax benefit/(expense) recognised directly in equityRevaluation of effective hedges (1,536) (1,794) (1,224) (891)Actuarial assessment of RBF provision (12,399) (70) (12,399) (70)Income tax (expense)/benefit recognised in equity (13,935) (1,864) (13,623) (961)
(c) Current tax assets and liabilitiesCurrent tax asset 25,876 - 25,876 -Provision for income tax - 46,755 - 46,780
(d) Deferred tax balancesDeferred tax assets comprise:Deductible temporary differences 469,718 447,665 420,705 391,913Tax losses 3,892 3,892 3,892 3,892
473,610 451,557 424,597 395,805
Deferred tax liabilities comprise:Assessable temporary differences 1,043,288 959,889 1,079,451 993,364Net deferred tax liabilities 569,678 508,332 654,854 597,559
63Hydro Tasmania Annual Report 2015 63
Notes to and forming part of the financial statements for the year ended 30 June 2015

4. INCOME TAX EQUIVALENT (CONTINUED)The tax effect of assessable and deductible temporary differences arises from the following:
2015 CONSOLIDATEDOpening Charged to Charged Closing balance income to equity Adjustments Acquisitions balance
$’000 $’000 $’000 $’000 $’000 $’000Deferred tax liabilities:Property, plant and equipment 811,541 74,893 - - - 886,434Electricity derivatives (8,717) 27,109 - - - 18,392Financial assets 137,035 (16,162) - - - 120,873Other 20,029 (2,440) - - - 17,589
959,888 83,400 - - - 1,043,288
Deferred tax assets:Provision for employee entitlements 114,503 (1,227) (12,399) - - 100,877Basslink and other financial liabilities 263,393 47,178 (1,536) - - 309,035Provisions 53,179 (2,903) - - - 50,276Tax losses 3,892 - - - - 3,892Other 16,589 (7,059) - - 9,530
451,556 35,989 (13,935) - - 473,610Net deferred tax liabilities 508,332 47,411 13,935 - - 569,678
2015 PARENTOpening Charged to Charged Closing balance income to equity Adjustments Acquisitions balance
$’000 $’000 $’000 $’000 $’000 $’000Deferred tax liabilities:Property, plant and equipment 853,909 76,360 - - - 930,269Electricity derivatives (8,717) 27,109 - - - 18,392Financial assets 137,035 (16,162) - - - 120,873Other 11,137 (1,220) - - - 9,917
993,364 86,087 - - - 1,079,451
Deferred tax assets:Provision for employee entitlements 113,555 (1,165) (12,399) - - 99,991Basslink and other financial liabilities 263,393 46,866 (1,224) - - 309,035Provisions 24 2,699 - - - 2,723Tax losses 3,892 - - - - 3,892Other 14,942 (5,986) - - - 8,956
395,806 42,414 (13,623) - - 424,597Net deferred tax liabilities 597,558 43,673 13,623 - - 654,854
64 Annual Report 2015 Hydro Tasmania
Notes to and forming part of the financial statements for the year ended 30 June 2015

4. INCOME TAX EQUIVALENT (CONTINUED)2014 CONSOLIDATED
Opening Charged to Charged Closing balance income to equity Adjustments Acquisitions balance
$’000 $’000 $’000 $’000 $’000 $’000Deferred tax liabilities:Property, plant and equipment 884,962 (73,243) - (178) - 811,541Electricity derivatives (24,199) 15,482 - - - (8,717)Financial assets 117,762 19,273 - - - 137,035Other 85,175 (57,542) - (7,604) - 20,029
1,063,700 (96,030) - (7,782) - 959,888
Deferred tax assets:Provision for employee entitlements 103,004 11,429 70 - - 114,503Basslink and other financial liabilities 275,626 (12,233) - - - 263,393Provisions 48,752 4,899 - (472) - 53,179Tax losses 11,540 (7,694) - 46 - 3,892Other 63,203 (48,107) 1,794 (301) - 16,589
502,125 (51,706) 1,864 (727) - 451,556Net deferred tax liabilities 561,575 (44,324) (1,864) (7,055) - 508,332
2014 PARENTOpening Charged to Charged Closing balance income to equity Adjustments Acquisitions balance
$’000 $’000 $’000 $’000 $’000 $’000Deferred tax liabilities:Property, plant and equipment 939,560 (85,666) - 15 - 853,909Electricity derivatives (24,199) 15,482 - - - (8,717)Financial assets 116,553 20,482 - - - 137,035Other 2,895 16,531 - (8,289) - 11,137
1,034,809 (33,171) - (8,274) - 993,364
Deferred tax assets:Provision for employee entitlements 114,932 (1,447) 70 - - 113,555Basslink and other financial liabilities 275,627 (12,234) - - - 263,393Provisions - 24 - - - 24Tax losses 15,288 (7,694) - (3,702) - 3,892Other (17,137) 31,188 891 - - 14,942
388,710 9,837 961 (3,702) - 395,806Net deferred tax liabilities 646,099 (43,008) (961) (4,572) - 597,558
All deferred tax balances relate to continuing operations.
At 30 June 2015, there is no recognised or unrecognised deferred income tax liability (2014: nil) for taxes that would be payable on the unremitted earnings of certain of the Group’s subsidiaries or joint ventures. The Group has no liability for additional taxation should such amounts be remitted.
65Hydro Tasmania Annual Report 2015 65
Notes to and forming part of the financial statements for the year ended 30 June 2015

5. NOTE TO THE CASH FLOW STATEMENTCONSOLIDATED PARENT
2015 2014 2015 2014$’000 $’000 $’000 $’000
(a) Cash reconciliation
Cash 15,683 13,001 8,554 8,306Money market investments 11 11 - -
15,694 13,012 8,554 8,306
(b) Reconciliation of net cash provided by operating activities to net profit for the yearProfit/(loss) after income tax equivalent expense 128,675 143,549 76,532 121,066Adjusted for non-cash items of income and expense:Depreciation of property, plant and equipment 78,904 82,483 74,102 77,939Amortisation 14,014 5,747 13,626 5,547Revaluations and impairment (232,066) 220,492 (197,442) 272,690Loss on derecognition of property, plant and equipment 532 22,726 473 22,726Equity accounted share of joint venture (profit)/loss (1,773) (2,073) - -Fair Value Adjustments 110,927 (162,110) 117,449 (164,097)Income Tax (Benefit)/Expense 54,816 39,182 67,827 55,514Cash from operating profit before changes in working capital 154,029 349,996 152,567 391,385(Increase)/decrease in receivables (9,389) (20,258) (2,656) 31,580(Increase)/decrease in inventories (208) (94) (208) (94)Increase/(decrease) in other financial assets and liabilities (11,054) (24,115) 3,402 (48,504)Increase/(decrease) in payables (11,790) 33,341 (24,363) 41,557Increase/(decrease) in provisions (16,053) 7,953 272 1,926Income tax equivalent paid (80,069) (103,861) (80,069) (103,861)
NET CASH PROVIDED BY OPERATING ACTIVITIES 25,466 242,962 48,945 313,989
66 Annual Report 2015 Hydro Tasmania
Notes to and forming part of the financial statements for the year ended 30 June 2015

6. RECEIVABLESCONSOLIDATED PARENT
2015 2014 2015 2014$’000 $’000 $’000 $’000
Trade receivables 253,169 243,299 99,476 96,819Provision for impairment (2,693) (2,213) (400) (400)
250,476 241,086 99,076 96,419
Ageing of past due but not impaired trade receivables:60-90 days 841 2,357 284 798Over 90 days 11,201 16,077 9,137 13,913
12,042 18,434 9,421 14,711
The amount past due but not impaired included in trade receivables is predominantly attributable to consulting services clients and retail customers. A provision for impairment has been recorded following assessment of the credit quality of the clients or customers with overdue accounts. This provision represents those accounts considered to be wholly or partially non-recoverable. The Corporation expensed $3.1m of bad debts during the year (2014: $5.6m). The Corporation does not hold any security over the balances past due.
7. INVESTMENTSCONSOLIDATED PARENT
NOTE 2015 2014 2015 2014$’000 $’000 $’000 $’000
(a) Current investmentsMoney market investments 11 11 - -
(b) Non-current investmentsInvestment in joint ventures 31 68,556 68,939 - -Investment in subsidiaries - - 203,827 203,827
68,556 68,939 203,827 203,827
8. INVENTORIESCONSOLIDATED PARENT
2015 2014 2015 2014$’000 $’000 $’000 $’000
Maintenance stores 2,539 2,331 2,539 2,331 2,539 2,331 2,539 2,331
67Hydro Tasmania Annual Report 2015 67
Notes to and forming part of the financial statements for the year ended 30 June 2015
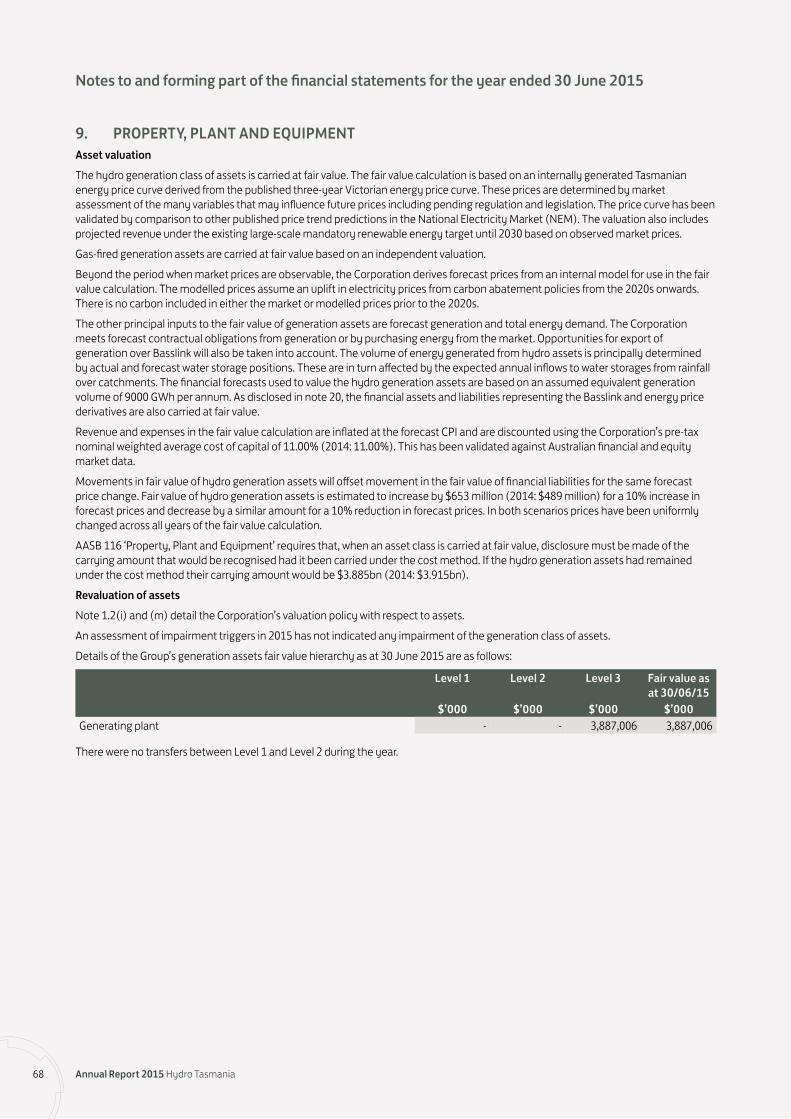
9. PROPERTY, PLANT AND EQUIPMENTAsset valuation
The hydro generation class of assets is carried at fair value. The fair value calculation is based on an internally generated Tasmanian energy price curve derived from the published three-year Victorian energy price curve. These prices are determined by market assessment of the many variables that may influence future prices including pending regulation and legislation. The price curve has been validated by comparison to other published price trend predictions in the National Electricity Market (NEM). The valuation also includes projected revenue under the existing large-scale mandatory renewable energy target until 2030 based on observed market prices.
Gas-fired generation assets are carried at fair value based on an independent valuation.
Beyond the period when market prices are observable, the Corporation derives forecast prices from an internal model for use in the fair value calculation. The modelled prices assume an uplift in electricity prices from carbon abatement policies from the 2020s onwards. There is no carbon included in either the market or modelled prices prior to the 2020s.
The other principal inputs to the fair value of generation assets are forecast generation and total energy demand. The Corporation meets forecast contractual obligations from generation or by purchasing energy from the market. Opportunities for export of generation over Basslink will also be taken into account. The volume of energy generated from hydro assets is principally determined by actual and forecast water storage positions. These are in turn affected by the expected annual inflows to water storages from rainfall over catchments. The financial forecasts used to value the hydro generation assets are based on an assumed equivalent generation volume of 9000 GWh per annum. As disclosed in note 20, the financial assets and liabilities representing the Basslink and energy price derivatives are also carried at fair value.
Revenue and expenses in the fair value calculation are inflated at the forecast CPI and are discounted using the Corporation’s pre-tax nominal weighted average cost of capital of 11.00% (2014: 11.00%). This has been validated against Australian financial and equity market data.
Movements in fair value of hydro generation assets will offset movement in the fair value of financial liabilities for the same forecast price change. Fair value of hydro generation assets is estimated to increase by $653 million (2014: $489 million) for a 10% increase in forecast prices and decrease by a similar amount for a 10% reduction in forecast prices. In both scenarios prices have been uniformly changed across all years of the fair value calculation.
AASB 116 ‘Property, Plant and Equipment’ requires that, when an asset class is carried at fair value, disclosure must be made of the carrying amount that would be recognised had it been carried under the cost method. If the hydro generation assets had remained under the cost method their carrying amount would be $3.885bn (2014: $3.915bn).
Revaluation of assets
Note 1.2(i) and (m) detail the Corporation’s valuation policy with respect to assets.
An assessment of impairment triggers in 2015 has not indicated any impairment of the generation class of assets.
Details of the Group’s generation assets fair value hierarchy as at 30 June 2015 are as follows:
Level 1 Level 2 Level 3 Fair value as at 30/06/15
$’000 $’000 $’000 $’000Generating plant - - 3,887,006 3,887,006
There were no transfers between Level 1 and Level 2 during the year.
68 Annual Report 2015 Hydro Tasmania
Notes to and forming part of the financial statements for the year ended 30 June 2015

9. PROPERTY, PLANT AND EQUIPMENT (CONTINUED)2015 CONSOLIDATED
CapitalOther Motor Land & Minor work in
Generation generation vehicles Buildings assets progressat fair value at cost at cost at cost at cost at cost Total
$’000 $’000 $’000 $’000 $’000 $’000 $’000Gross carrying amountBalance at the beginning of the year 4,127,740 19,812 13,863 61,117 84,888 143,548 4,450,968Additions - - 27 1 25 100,645 100,698Disposals (801) (273) (2,625) (39) (1,073) (866) (5,678)Transfers 46,530 690 3,200 2,626 3,150 (83,601) (27,405)Balance at the end of the year 4,173,469 20,229 14,465 63,705 86,989 159,726 4,518,583
Accumulated depreciationBalance at the beginning of the year (452,220) (12,662) (5,985) (18,605) (66,910) - (556,382)Disposals 1,043 197 2,032 9 1,043 - 4,324Transfers 6 - - (7) 1 - -Revaluations 232,066 - - - - - 232,066Depreciation expense (67,358) (484) (2,118) (2,470) (6,474) - (78,904)Balance at the end of the year (286,463) (12,949) (6,071) (21,073) (72,340) - (398,896)
Net book value at the end of the year 3,887,006 7,280 8,394 42,632 14,649 159,726 4,119,687
2015 PARENTCapital
Other Motor Land & Minor work inGeneration generation vehicles Buildings assets progressat fair value at cost at cost at cost at cost at cost Total
$’000 $’000 $’000 $’000 $’000 $’000 $’000Gross carrying amountBalance at the beginning of the year 3,997,397 19,722 13,612 44,592 81,996 138,796 4,296,115Additions - - - - - 96,072 96,072Disposals (801) (273) (2,612) (28) (833) (807) (5,354)Transfers 45,593 690 3,200 2,025 2,529 (78,205) (24,168)Balance at the end of the year 4,042,189 20,139 14,200 46,589 83,692 155,856 4,362,665
Accumulated depreciationBalance at the beginning of the year (419,226) (12,651) (5,866) (15,572) (65,565) - (518,880)Disposals 1,043 197 2,020 2 827 - 4,089Transfers 6 - - (7) 1 - -Revaluations 249,410 - - - - - 249,410Depreciation expense (63,473) (467) (2,098) (2,043) (6,021) - (74,102)Balance at the end of the year (232,240) (12,921) (5,944) (17,620) (70,758) - (339,483)
Net book value at the end of the year 3,809,949 7,218 8,256 28,969 12,934 155,856 4,023,182
69Hydro Tasmania Annual Report 2015 69
Notes to and forming part of the financial statements for the year ended 30 June 2015
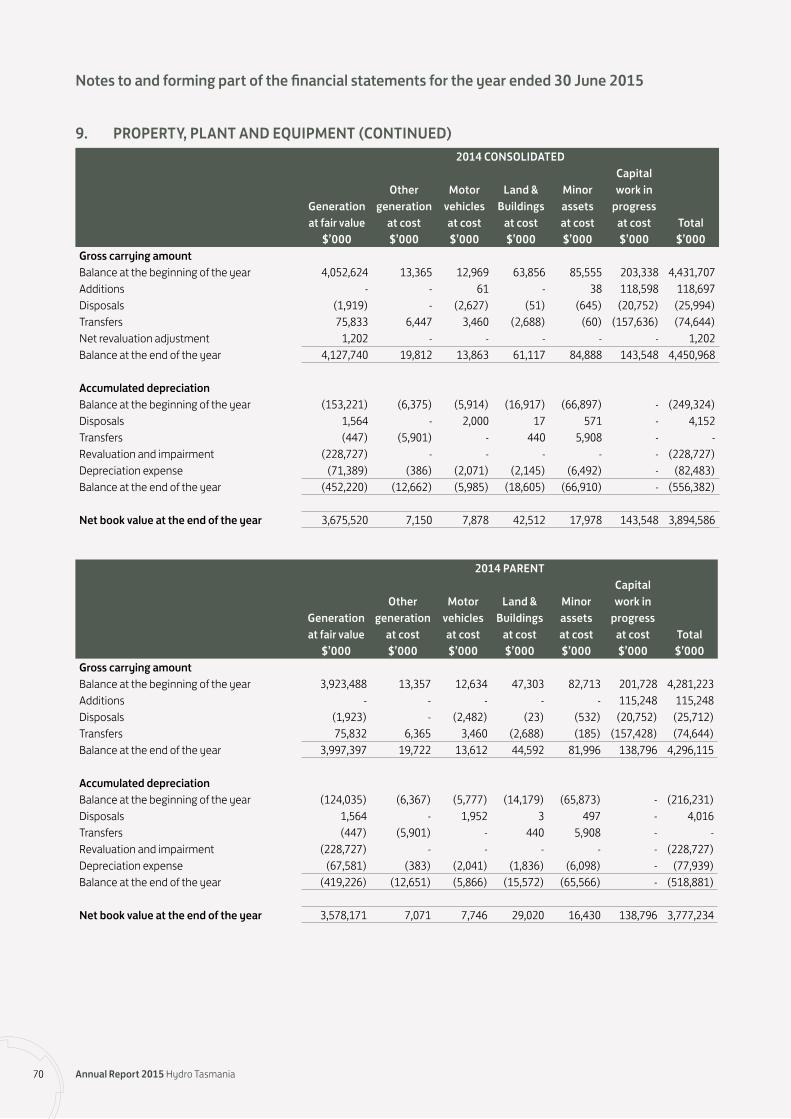
9. PROPERTY, PLANT AND EQUIPMENT (CONTINUED)2014 CONSOLIDATED
CapitalOther Motor Land & Minor work in
Generation generation vehicles Buildings assets progressat fair value at cost at cost at cost at cost at cost Total
$’000 $’000 $’000 $’000 $’000 $’000 $’000Gross carrying amountBalance at the beginning of the year 4,052,624 13,365 12,969 63,856 85,555 203,338 4,431,707Additions - - 61 - 38 118,598 118,697Disposals (1,919) - (2,627) (51) (645) (20,752) (25,994)Transfers 75,833 6,447 3,460 (2,688) (60) (157,636) (74,644)Net revaluation adjustment 1,202 - - - - - 1,202Balance at the end of the year 4,127,740 19,812 13,863 61,117 84,888 143,548 4,450,968
Accumulated depreciationBalance at the beginning of the year (153,221) (6,375) (5,914) (16,917) (66,897) - (249,324)Disposals 1,564 - 2,000 17 571 - 4,152Transfers (447) (5,901) - 440 5,908 - -Revaluation and impairment (228,727) - - - - - (228,727)Depreciation expense (71,389) (386) (2,071) (2,145) (6,492) - (82,483)Balance at the end of the year (452,220) (12,662) (5,985) (18,605) (66,910) - (556,382)
Net book value at the end of the year 3,675,520 7,150 7,878 42,512 17,978 143,548 3,894,586
2014 PARENTCapital
Other Motor Land & Minor work inGeneration generation vehicles Buildings assets progressat fair value at cost at cost at cost at cost at cost Total
$’000 $’000 $’000 $’000 $’000 $’000 $’000Gross carrying amountBalance at the beginning of the year 3,923,488 13,357 12,634 47,303 82,713 201,728 4,281,223Additions - - - - - 115,248 115,248Disposals (1,923) - (2,482) (23) (532) (20,752) (25,712)Transfers 75,832 6,365 3,460 (2,688) (185) (157,428) (74,644)Balance at the end of the year 3,997,397 19,722 13,612 44,592 81,996 138,796 4,296,115
Accumulated depreciationBalance at the beginning of the year (124,035) (6,367) (5,777) (14,179) (65,873) - (216,231)Disposals 1,564 - 1,952 3 497 - 4,016Transfers (447) (5,901) - 440 5,908 - -Revaluation and impairment (228,727) - - - - - (228,727)Depreciation expense (67,581) (383) (2,041) (1,836) (6,098) - (77,939)Balance at the end of the year (419,226) (12,651) (5,866) (15,572) (65,566) - (518,881)
Net book value at the end of the year 3,578,171 7,071 7,746 29,020 16,430 138,796 3,777,234
70 Annual Report 2015 Hydro Tasmania
Notes to and forming part of the financial statements for the year ended 30 June 2015

11. OTHER FINANCIAL ASSETSCONSOLIDATED PARENT
NOTE 2015 2014 2015 2014$’000 $’000 $’000 $’000
(a) Current other financial assetsEnergy price derivatives 17 33,474 76,850 33,474 76,850Basslink financial asset (i) 17 58,869 65,750 58,869 65,750Environmental energy products 41,786 57,801 41,748 54,918
134,129 200,401 134,091 197,518
(b) Non-current other financial assetsBasslink financial asset (i) 17 344,041 391,034 344,041 391,034Basslink security deposit (ii) 50,000 50,000 50,000 50,000Energy price derivatives 17 31,475 47,350 31,475 47,350
425,516 488,384 425,516 488,384
(i) The Basslink financial asset represents the fair value of the contractual rights to receive revenue under the Basslink Services Agreement (note 17).
(ii) Basslink security deposit represents the contribution made to the asset owner upon commissioning. This will be recovered via lower facility fee payments over the final 3 years of the agreement.
10 . INTANGIBLE ASSETSCONSOLIDATED PARENT
2015 2014 2015 2014Software Software Software Software
at cost at cost at cost at cost$’000 $’000 $’000 $’000
Gross carrying amountBalance at the beginning of the year 111,755 37,316 110,961 36,522Disposals (14,947) (205) (14,947) (205)Transfers from capital work in progress 27,405 74,644 24,168 74,644Balance at the end of the year 124,213 111,755 120,182 110,961
Accumulated amortisationBalance at the beginning of the year (36,546) (30,865) (36,130) (30,649)Disposals 14,747 66 14,747 66Amortisation expense (14,014) (5,747) (13,626) (5,547)Balance at the end of the year (35,813) (36,546) (35,009) (36,130)
Net book value at the end of the year 88,400 75,209 85,173 74,831
71Hydro Tasmania Annual Report 2015 71
Notes to and forming part of the financial statements for the year ended 30 June 2015

12. OTHER ASSETSCONSOLIDATED PARENT
2015 2014 2015 2014$’000 $’000 $’000 $’000
(a) Current other assetsPrepayments 9,216 8,979 8,603 8,250Loans to associates 248 1,254 - -Other 5,850 980 - -
15,314 11,213 8,603 8,250
(b) Non-current other assetsPrepayments 30,803 5,806 - -Loans to associates - 135 - 135Other 2,382 7,306 - -
33,185 13,247 - 135
13. GOODWILLCONSOLIDATED PARENT
2015 2014 2015 2014$’000 $’000 $’000 $’000
Balance at the beginning of the year 16,396 16,396 - -Accumulated impairment losses - - - -Closing balance of goodwill 16,396 16,396 - -
14. PAYABLESCONSOLIDATED PARENT
2015 2014 2015 2014$’000 $’000 $’000 $’000
Trade creditors 85,010 70,472 70,645 75,889Accrued expenses 72,137 95,171 18,109 33,935Accrued interest payable 7,136 10,430 7,136 10,429
164,283 176,073 95,890 120,253
72 Annual Report 2015 Hydro Tasmania
Notes to and forming part of the financial statements for the year ended 30 June 2015

15. INTEREST-BEARING LIABILITIESCONSOLIDATED PARENT
2015 2014 2015 2014$’000 $’000 $’000 $’000
(a) Interest-bearing liabilities
CurrentLoans from Tascorp (i) 64,700 368,600 64,700 368,600Finance Lease Liability (ii) 703 685 703 685
65,403 369,285 65,403 369,285
Non-currentLoans from Tascorp (i) 785,000 490,000 785,000 490,000Finance Lease Liability (ii) 4,612 4,717 4,612 4,717
789,612 494,717 789,612 494,717
(i) The loans from Tascorp are unsecured
(ii) The finance leases are secured by the leased assets
The State of Tasmania transferred $205m of debt from the Corporation to TasNetworks Pty Ltd on 29 January 2015.
CONSOLIDATED PARENT2015 2014 2015 2014$’000 $’000 $’000 $’000
(b) Loan facilitiesMaster loan facilityFacility limit 1,055,000 1,001,000 1,055,000 1,001,000Facility used/committed 849,700 858,600 849,700 858,600Facility balance 205,300 142,400 205,300 142,400
Standby revolving credit facilityFacility limit 30,000 30,000 30,000 30,000Facility used/committed - - - -Facility balance 30,000 30,000 30,000 30,000
Bank overdraftFacility limit 1,000 1,000 1,000 1,000Facility used/committed - - - -Facility balance 1,000 1,000 1,000 1,000
Corporate purchasing cardFacility limit 7,500 7,500 7,500 7,500Facility used/committed 4,368 4,743 3,726 4,163Facility balance 3,132 2,757 3,774 3,337
Hydro Tasmania manages its debt portfolio under a Board approved Treasury Policy, in line with the requirement of the GBE Act and related Treasurer’s Instructions. The policy requires a weighted average term to maturity of 4 years. The policy also places limits around maturity profile of the debt. The maturity profile of the Corporation’s debt as at 30 June 2015 is included in note 20. The current interest bearing liabilities as at 30 June 2015 of $65.403m will be settled with budgeted cash inflows. In addition, Hydro Tasmania had unused loan facilities of $235.3m as at 30 June 2015.
73Hydro Tasmania Annual Report 2015 73
Notes to and forming part of the financial statements for the year ended 30 June 2015

15. INTEREST-BEARING LIABILITIES (CONTINUED)PARENT & CONSOLIDATED
2015 2015 2015 2015$’000 $’000 $’000 $’000
Between Less than one and five Later than one year years five years Total
(c) Finance lease liabilitiesFuture minimum lease payments 703 2,990 3,301 6,994Interest - (510) (1,169) (1,679)Present value of future minimum lease payments 703 2,480 2,132 5,315
PARENT & CONSOLIDATED2014 2014 2014 2014$’000 $’000 $’000 $’000
Between Less than one and five Later than one year years five years Total
Future minimum lease payments 685 2,917 4,076 7,678Interest - (568) (1,707) (2,275)Present value of future minimum lease payments 685 2,349 2,369 5,403
(d) Fair value disclosures
Details of the fair value of the Corporation’s interest-bearing liabilities are set out in note 17.
16. PROVISIONSCONSOLIDATED PARENT
NOTE 2015 2014 2015 2014$’000 $’000 $’000 $’000
(a) Current provisionsEmployee entitlements 20,268 20,581 17,706 17,933Retirement Benefits Fund provision 19 18,849 18,488 18,849 18,488Other provisions 60,886 61,330 1,488 900
100,003 100,399 38,043 37,321
(b) Non-current provisionsEmployee entitlements 5,128 6,536 4,660 6,086Retirement Benefits Fund provision 19 292,388 336,220 292,388 336,220Other provisions 104,188 115,935 6,838 3,360
401,704 458,691 303,886 345,666
74 Annual Report 2015 Hydro Tasmania
Notes to and forming part of the financial statements for the year ended 30 June 2015

17. OTHER FINANCIAL LIABILITIESCONSOLIDATED PARENT
2015 2014 2015 2014$’000 $’000 $’000 $’000
(a) Current other financial liabilitiesBasslink Services Agreement 67,926 65,327 67,926 65,327Basslink Facility Fee Swap 16,927 12,057 16,927 12,057Interest rate swaps 7,735 12,881 7,735 11,816Energy price derivatives 49,622 67,350 49,622 67,350
142,210 157,615 142,210 156,550
(b) Non-current other financial liabilitiesBasslink Services Agreement 453,449 515,657 453,449 515,657Basslink Facility Fee Swap 325,532 284,936 325,532 284,936Energy price derivatives 112,235 90,204 112,235 90,204
891,216 890,797 891,216 890,797
16. PROVISIONS CONTINUEDCONSOLIDATED
Onerous contracts(i)
Regulatory schemes
Site rehabilitation(ii) Total
$’000 $’000 $’000 $’000Other provisionsBalance at 1 July 2014 104,637 23,371 49,256 177,265Additional provision recognised - 55,597 - 55,597Reductions arising from payments (483) - (178) (661)Reductions from settlement - (64,190) - (64,190)Unwinding of discount (6,713) - 3,776 (2,937)Balance at 30 June 2015 97,441 14,778 52,854 165,074
ParentOnerous
contracts(i)Regulatory
schemesSite
rehabilitation(ii) Total
$’000 $’000 $’000 $’000Other provisionsBalance at 1 July 2014 4,260 - - 4,260Additional provision recognised 964 - - 964Reductions arising from payments (483) - - (483)Unwinding of discount 3,585 - - 3,585Balance at 30 June 2015 8,326 - - 8,326
(i) Onerous contracts include gas contracts, lease liabilities and the Corporation’s obligation to remediate the Studland Bay wind farm foundations.
(ii) Site rehabilitation provision represents estimated future cost of demolishing the Bell Bay plant and the Tamar Valley plant at the end of its useful life and of rehabilitating the site.
75Hydro Tasmania Annual Report 2015 75
Notes to and forming part of the financial statements for the year ended 30 June 2015

17. OTHER FINANCIAL LIABILITIES (CONTINUED)CONSOLIDATED PARENT
NOTE 2015 2014 2015 2014$’000 $’000 $’000 $’000
Energy price derivatives movement reconciliation:Liability at the beginning of the year 33,355 85,962 33,355 85,962Amount included in electricity revenue due to settlement during the year 102,692 133,181 59,009 120,765Net cash (payments)/receipts on futures margin account 13,846 (4,565) 13,846 (4,565)Fair value (gain)/loss on contracts outstanding as at 30 June (52,985) (181,223) (9,302) (168,807)Liability at the end of the year 96,908 33,355 96,908 33,355
Represented by:Current energy price derivative liability 17(a) 49,622 67,350 49,622 67,350Non-current energy price derivative liability 17(b) 112,235 90,204 112,235 90,204
161,857 157,554 161,857 157,554
Current energy price derivative asset 11(a) 33,474 76,850 33,474 76,850Non-current energy price derivative asset 11(b) 31,475 47,349 31,475 47,349
64,949 124,199 64,949 124,199Net energy price derivatives liability 96,908 33,355 96,908 33,355
Net Basslink financial liability movement reconciliation:Balance at the beginning of the year 421,193 526,213 421,193 526,213
Current year net (revenue) and operating expenses realised during the year and included in the operating valuation (11,634) (61,617) (11,634) (61,617)
Increase/(decrease) in present value of projected rights and obligations of later years as at the beginning of the year (22,717) 153,115 (22,717) 153,115
(Gain)/loss arising on re-estimation of fair value of contract rights and obligations over the remaining contract term as at 30 June 74,082 (196,518) 74,082 (196,518)Balance at the end of the year 460,924 421,193 460,924 421,193
Represented by:Current Basslink financial liabilitity 84,853 77,384 84,853 77,384Non-current Basslink financial liability 778,981 800,593 778,981 800,593
863,834 877,977 863,834 877,977
Current Basslink financial asset 11(a) 58,869 65,750 58,869 65,750Non-current Basslink financial asset 11(b) 344,041 391,034 344,041 391,034
402,910 456,784 402,910 456,784Net Basslink financial liability 460,924 421,193 460,924 421,193
18. OTHER LIABILITIESCONSOLIDATED PARENT
2015 2014 2015 2014$’000 $’000 $’000 $’000
(a) Current other liabilitiesIncome received in advance 232 620 107 472Loans from associates (i) 6,855 4,871 - -Loans from subsidiaries (i) - - 94,166 51,831Other 1,251 934 1,233 931
8,338 6,425 95,506 53,234
(i) Loans from associates and subsidiaries are interest-free and on-call and presented on a net basis.
76 Annual Report 2015 Hydro Tasmania
Notes to and forming part of the financial statements for the year ended 30 June 2015

19. RETIREMENT BENEFITS FUND PROVISIONPlan information
The Retirement Benefits Fund (RBF) is a defined benefit fund which pays lump sum benefits on resignation and lump sum or pension benefits on retirement, death or invalidity. The defined benefit section of RBF is closed to new members. All new members receive accumulation only benefits.
The scheme operates under the Retirement Benefits Act 1993 and the Retirement Benefits Regulations 2005.
Although the scheme is not formally subject to the Superannuation Industry (Supervision) (SIS) legislation, the Tasmanian Government has undertaken (in a Heads of Government Agreement) to operate the scheme in accordance with the spirit of the SIS legislation.
As an exempt public sector superannuation scheme (as defined in the SIS legislation), the scheme is not subject to any minimum funding requirements.
RBF is a complying superannuation fund within the provisions of the Income Tax Assessment Act 1997 such that the fund’s taxable income is taxed at a concessional rate of 15%. However RBF is also a public sector superannuation scheme which means that employer contributions may not be subject to the 15% tax (if the RBF Board elects) up to the amount of “untaxed” benefits paid to members in the year.
The RBF Board (the Board) is responsible for the governance of the scheme. As trustee, the Board has a legal obligation to act solely in the best interests of scheme beneficiaries. The Board has the following roles:
• Administration of the scheme and payment to the beneficiaries when required in accordance with the scheme rules;
• Management and investment of the scheme assets; and
• Compliance with the Heads of Government Agreement referred to above.
There are a number of risks to which the scheme exposes the Corporation. The more significant risks relating to the defined benefits are: Investment risk - The risk that investment returns will be lower than assumed and employers will need to increase contributions to
offset this shortfall.
Salary growth risk - The risk that wages or salaries (on which future benefit amounts will be based) will rise more rapidly than assumed, increasing defined benefit amounts and the associated employer contributions.
Inflation risk - The risk that inflation is higher than anticipated, increasing pension payments and the associated employer contributions.
Benefits options risk - The risk that a greater proportion of members who joined prior to 1 July 1994 will elect the pension option, which is generally more costly than the alternative lump sum option.
Pensioner mortality risk - The risk that pensioner mortality will be lighter than expected, resulting in pensions being paid for a longer period.
Legislative risk - The risk that legislative changes could be made which increase the cost of providing the defined benefits.
There were no planned amendments, curtailments or settlements during the year.
Information in this note applies equally to the parent and consolidated entities.
Reconciliation of the net liability recognised in the Balance Sheet:
NOTE 2015 2014$’000 $’000
Defined benefit obligation 382,777 422,689Fair value of plan assets (71,540) (67,981)Net superannuation liability 311,237 354,708
Comprising:Current net liability 16 18,849 18,488Non-current net liability 16 292,388 336,220Net superannuation liability 311,237 354,708
77Hydro Tasmania Annual Report 2015 77
Notes to and forming part of the financial statements for the year ended 30 June 2015

19. RETIREMENT BENEFITS FUND PROVISION (CONTINUED)Reconciliation of the present value of the defined benefit obligation:
2015 2014$’000 $’000
Present value of defined benefit obligations at the beginning of the year 422,689 425,159Current service cost 4,961 4,814Interest cost 16,828 17,534Contributions by plan participants 1,363 1,311Actuarial (gains)/losses arising from changes in demographic assumptions - (4,143)Actuarial losses/(gains) arising from changes in financial assumptions (33,640) 8,937Actuarial (gains)/losses arising from liability experience (984) (3,659)Benefits paid (27,865) (26,651)Taxes, premiums and expenses paid (575) (613)Present value of defined benefit obligations at year end 382,777 422,689
Reconciliation of the fair value of scheme assets:
2015 2014$’000 $’000
Fair value of plan assets at beginning of the year 67,981 69,559Interest income 2,680 2,841Actual return on plan assets less interest income 6,940 1,367Employer contributions 21,016 20,167Contributions by plan participants 1,363 1,311Benefits paid (27,865) (26,651)Taxes, premiums and expenses paid (575) (613)Fair value of plan assets at end of the year 71,540 67,981
Fair value of scheme assets:
2015Quoted prices in Significant Unobservableactive markets – observable inputs – inputs
Total Level 1 Level 2 Level 3Asset category $’000 $’000 $’000 $’000Cash and cash equivalents 12,417 12,417 - -Equity instruments 48,819 22,221 21,439 5,159Debt instruments 9,590 2,603 3,937 3,050Derivatives 132 - 132 -Real estate 582 - 582 -Total 71,540 37,241 26,090 8,209
The fair value of the scheme assets includes no amounts relating to any of the Corporation’s own financial instruments or to any property occupied, or other assets used by the Corporation.
Assets are not held separately for each employer but are held for the Fund as a whole. The fair value of Scheme assets for each reporting entity was estimated by allocating the total Fund assets in proportion to the value of each reporting entity’s funded liabilities, calculated using the assumptions outlined in this report, with the exception of the discount rate. For the purposes of allocating assets to each reporting entity, a discount rate of 3.7% has been used, in order to be consistent with the allocation of assets reported to the Department of Treasury and Finance.
The Actuarial assumptions used in the calculations have been agreed with the Tasmanian Department of Treasury and Finance and have been specified in the preceding tables of this note.
78 Annual Report 2015 Hydro Tasmania
Notes to and forming part of the financial statements for the year ended 30 June 2015

19. RETIREMENT BENEFITS FUND PROVISION (CONTINUED)Significant actuarial assumptions as at balance date:
2015 2014% %
Assumptions to determine defined benefit cost and defined benefit obligation at the start of the yearDiscount rate (active members) 4.10 4.25Discount rate (pensioners) 4.10 4.25Expected rate of increase in compulsory preserved amounts 4.50 3.75Expected salary increase rate 3.00 3.00Expected pension increase rate 2.50 2.50
2015 2014% %
Assumptions used to determine defined benefit obligation at the end of the yearDiscount rate (active members) 4.80 4.10Discount rate (pensioners) 4.80 4.10Expected salary increase rate 3.00 3.00Expected rate of increase in compulsory preserved amounts 4.50 4.50Expected pension increase rate 2.50 2.50
2015 2014$’000 $’000
Gain/(loss) recognised in Other Comprehensive IncomeActuarial (gains)/losses 41,331 232
The defined benefit obligation as at 30 June 2015 under several scenarios is presented below.
Scenario A and B relate to discount rate sensitivity. Scenario C and D relate to expected pension increase rate sensitivity.
Scenario A: 0.5% pa lower discount rate assumption Scenario B: 0.5% pa higher discount rate assumption Scenario C: 0.5% pa lower expected pension increase rate assumption Scenario D: 0.5% pa higher expected pension increase rate assumption
Base Case Scenario A Scenario B Scenario C Scenario D-0.5% pa +0.5% pa -0.5% pa +0.5% padiscount
ratediscount
rateincrease
rateincrease
rateDiscount rate (%) 4.80% pa 4.30% pa 5.30% pa 4.80% pa 4.80% paPension increase rate (%) 2.50% pa 2.50% pa 2.50% pa 2.00% pa 3.00% paDefined benefit obligation (A$’000s) 382,777 406,287 361,590 365,487 401,606
The defined benefit obligation has been recalculated by changing the assumptions as outlined above, whilst retaining all other assumptions.
There were no asset and liability matching strategies adopted by the fund.
The Corporation contributes a percentage of each lump sum or pension benefit payment. This percentage may be amended by the Minister on the advice of the Actuary.
The weighted average duration of the defined benefit obligation for the Corporation is 12.2 years.
2016$’000
Expected employer contributions 18,849
79Hydro Tasmania Annual Report 2015 79
Notes to and forming part of the financial statements for the year ended 30 June 2015
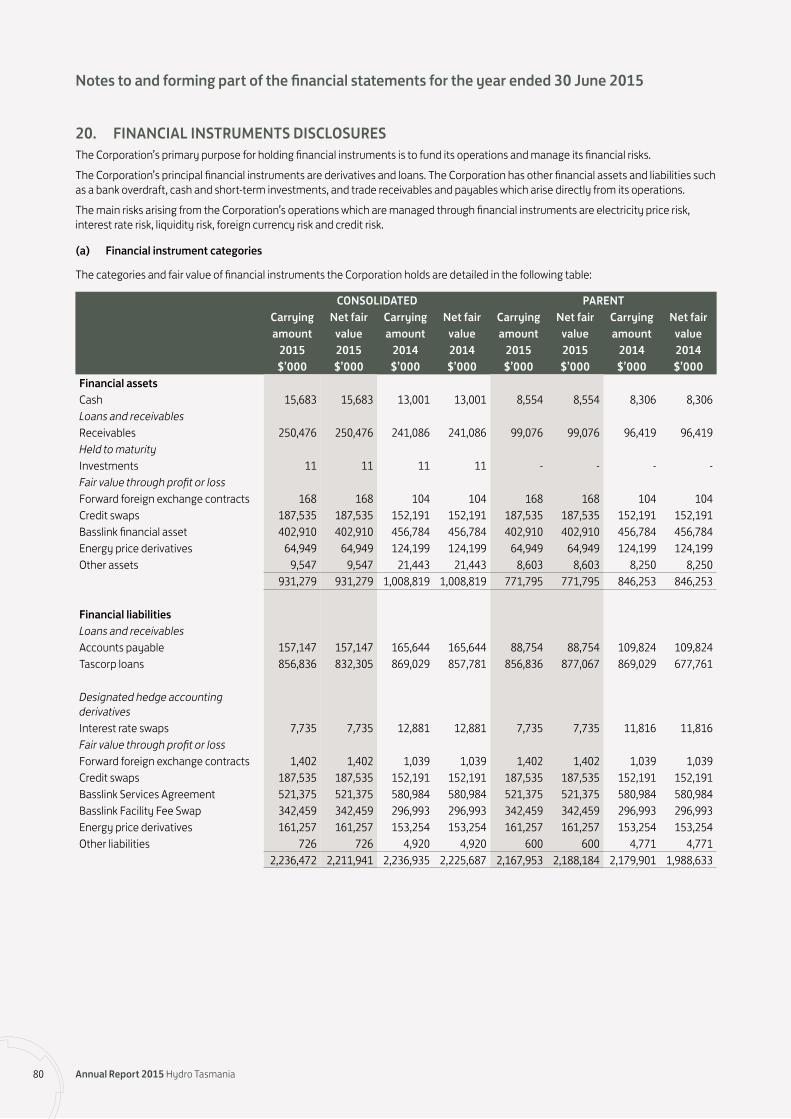
20. FINANCIAL INSTRUMENTS DISCLOSURES The Corporation’s primary purpose for holding financial instruments is to fund its operations and manage its financial risks.
The Corporation’s principal financial instruments are derivatives and loans. The Corporation has other financial assets and liabilities such as a bank overdraft, cash and short-term investments, and trade receivables and payables which arise directly from its operations.
The main risks arising from the Corporation’s operations which are managed through financial instruments are electricity price risk, interest rate risk, liquidity risk, foreign currency risk and credit risk.
(a) Financial instrument categories
The categories and fair value of financial instruments the Corporation holds are detailed in the following table:
CONSOLIDATED PARENTCarrying Net fair Carrying Net fair Carrying Net fair Carrying Net fairamount value amount value amount value amount value
2015 2015 2014 2014 2015 2015 2014 2014$’000 $’000 $’000 $’000 $’000 $’000 $’000 $’000
Financial assetsCash 15,683 15,683 13,001 13,001 8,554 8,554 8,306 8,306Loans and receivablesReceivables 250,476 250,476 241,086 241,086 99,076 99,076 96,419 96,419Held to maturityInvestments 11 11 11 11 - - - -Fair value through profit or lossForward foreign exchange contracts 168 168 104 104 168 168 104 104Credit swaps 187,535 187,535 152,191 152,191 187,535 187,535 152,191 152,191Basslink financial asset 402,910 402,910 456,784 456,784 402,910 402,910 456,784 456,784Energy price derivatives 64,949 64,949 124,199 124,199 64,949 64,949 124,199 124,199Other assets 9,547 9,547 21,443 21,443 8,603 8,603 8,250 8,250
931,279 931,279 1,008,819 1,008,819 771,795 771,795 846,253 846,253
Financial liabilitiesLoans and receivablesAccounts payable 157,147 157,147 165,644 165,644 88,754 88,754 109,824 109,824Tascorp loans 856,836 832,305 869,029 857,781 856,836 877,067 869,029 677,761
Designated hedge accounting derivativesInterest rate swaps 7,735 7,735 12,881 12,881 7,735 7,735 11,816 11,816Fair value through profit or lossForward foreign exchange contracts 1,402 1,402 1,039 1,039 1,402 1,402 1,039 1,039Credit swaps 187,535 187,535 152,191 152,191 187,535 187,535 152,191 152,191Basslink Services Agreement 521,375 521,375 580,984 580,984 521,375 521,375 580,984 580,984Basslink Facility Fee Swap 342,459 342,459 296,993 296,993 342,459 342,459 296,993 296,993Energy price derivatives 161,257 161,257 153,254 153,254 161,257 161,257 153,254 153,254Other liabilities 726 726 4,920 4,920 600 600 4,771 4,771
2,236,472 2,211,941 2,236,935 2,225,687 2,167,953 2,188,184 2,179,901 1,988,633
80 Annual Report 2015 Hydro Tasmania
Notes to and forming part of the financial statements for the year ended 30 June 2015

20. FINANCIAL INSTRUMENTS DISCLOSURES (CONTINUED)(b) Financial risk management objectives and policies
The Corporation enters into derivative contracts being principally energy price contracts, interest rate swaps and forward currency exchange contracts. The risk management objective is to manage exposure to market electricity prices, interest rates and foreign currency rates arising from operations and funding. The Corporation enters into these derivatives in accordance with the policies approved by the Board. All hedges are cash flow hedges (refer note 1.2(r)).
The Basslink contracts including the Basslink Services Agreement (BSA), Floating Facility Fee Instrument (FFFI) and Basslink Facility Fee Swap (BFFS) have been designated as derivatives.
Details of the significant accounting policies and methods adopted, including the criteria for recognition, the basis for measurement and the basis on which income and expenses are recognised, in respect to each class of financial asset and financial liability are disclosed in notes 1.2(j) and (r).
The Corporation’s objectives, policies and processes for managing its risk exposures are consistent with previous years.
(i) Capital risk management
The Corporation’s policy is to maintain an appropriate capital structure to ensure it will continue as a going concern while maximising the return to stakeholders through an appropriate balance of debt and equity.
The capital structure of the Corporation includes loans disclosed in note 15, contributed equity and cash and cash equivalents disclosed in note 5.
The Corporation is subject to financial covenants on its borrowings and the Basslink Facility Fee Swap. The latter requires a minimum level of equity, sets a maximum level of debt, and requires a minimum of 50 per cent of debt to be held with the Tasmanian Government’s central borrowing authority, Tascorp. The loan agreement with Tascorp sets a maximum financial leverage ratio and a minimum interest coverage ratio.
The Corporation reviews its capital risk and performance against these covenants on a monthly basis.
The Corporation has been compliant with all financial covenants.
(ii) Market risk management
The Corporation’s activities primarily expose it to electricity price risk and interest rate risk. In addition, the Corporation operates consulting businesses in foreign countries and enters into foreign currency transactions which expose it to foreign currency risk.
(A) Energy prices
The Corporation’s revenue is exposed to fluctuations in the market price of electricity in Tasmania. In addition, on 1 January 2014 wholesale regulation began in Tasmania. The wholesale pricing methodology links Tasmanian regulated contract prices to Victorian market prices. The Corporation’s revenue is also exposed to fluctuations in the Victorian market price to the extent of electricity flows over Basslink, and through the variable portion of the Basslink facility fee. The Corporation is also exposed to fluctuations in electricity market prices in all NEM regions in relation to its retail operation in Victoria and other NEM regions. Exposure to these fluctuations in market price is managed through the use of derivative contracts executed in all regions of the NEM in accordance with Board approved policy. Contract volumes for many of the Corporation’s current Tasmanian forward contracts are determined by the actual load consumed in the contract period.
Until December 2013 Board approved policies prescribe the management of electricity trading risk in line with an asset backed trading model. From December 2013 the Corporation has managed electricity trading risk using an earnings at risk approach combined with an asset backed trading model.
81Hydro Tasmania Annual Report 2015 81
Notes to and forming part of the financial statements for the year ended 30 June 2015

20. FINANCIAL INSTRUMENTS DISCLOSURES (CONTINUED)The Corporation assesses its electricity price risk exposure through sensitivity analysis. The following table shows the effect on the Income Statement of a feasible movement (10%) in forecast electricity prices.
2015 2014CONSOLIDATED PARENT CONSOLIDATED PARENT
Income Equity Income Equity Income Equity Income Equity$’000 $’000 $’000 $’000 $’000 $’000 $’000 $’000
Increase/(decrease)Electricity forward price +10%Basslink net liability (32,451) - (32,451) - (38,911) - (38,911) -Energy derivative net asset (110,860) - (110,860) - (66,468) - (66,468) -Electricity forward price -10%Basslink net liability 35,661 - 35,661 - 40,140 - 40,140 -Energy derivative net asset 110,944 - 110,944 - 66,521 - 66,521 -
The sensitivity of the fair value of the Basslink Services Agreement to energy price movements has been based on adjustments to forecast price differences between the Tasmanian and Victorian regions. The sensitivity of the fair value of energy price derivatives to energy price movements has been determined by adjusting the forecast prices for the Tasmanian and mainland regions.
The forecast price methodology is based on published three-year NEM electricity price curves. These prices are determined by market assessment of the many variables that may influence future prices including pending regulation and legislation. The price curves have been validated by comparison to other published price trend predictions in the National Electricity Market (NEM). Beyond the period when market prices are observable, the Corporation derives forecast prices from an internal model.
The fair value movements in the energy trading derivatives arising from variation in forecast prices are offset by movements in the fair value of the generation assets to the extent that they hedge generation revenue. An energy price derivative instrument may also expose the Corporation to commodity price risk.
(B) Interest rates
The Corporation’s exposure to changes in market interest rates arises primarily from the Corporation’s borrowings and the Basslink contracts.
Cash flow hedges
The Corporation has entered into interest rate swap contracts to achieve an interest rate risk exposure profile that is consistent with the long-term cash flow stability and the debt management strategy of the Corporation. Interest rate exposure on specific loans is managed using highly effective hedge derivatives. The Corporation applies hedge accounting treatment to hedges of the Tascorp debt as described in note 1.2(r).
In pursuit of these objectives, the Corporation manages its debt through setting and achieving benchmarks for the two key portfolio indicators of repricing profile and weighted average term to maturity.
At 30 June 2015 fixed rate loans varied from 3.01% to 6.92% (2014: 3.9% to 7.0%). Floating rates were based on bank bill rates and these varied from 2.7% to 3.2% (2014: 2.6% to 3.7%).
The Government Guarantee Fee rate varied from 0.5% to 1.8% for this financial year (2014: 0.5% to 1.8%).
82 Annual Report 2015 Hydro Tasmania
Notes to and forming part of the financial statements for the year ended 30 June 2015

20. FINANCIAL INSTRUMENTS DISCLOSURES (CONTINUED) Basslink
The Basslink Services Agreement (BSA) and Floating Facility Fee Instrument (FFFI) between the Corporation and Basslink Pty Ltd (BPL) establish the rights and obligations of both parties with respect to the operation of Basslink including the monthly payment of the Basslink Facility Fee (BFF) by the Corporation to BPL. These agreements are financial assets and financial liabilities whereby the Corporation is committed to make payments to BPL over the term of the contract should BPL meet its obligations to keep Basslink available in exchange for the right to receive Inter Regional Revenues (IRRs). The latter has been recognised as a financial asset.
The BSA commenced upon successful commissioning of Basslink on 28 April 2006 and was for a term of 25 years, with an option for a further 15 years. Basslink effectively gives Tasmania, including Hydro Tasmania, physical access to the Victorian region of the NEM.
The Corporation entered into the Basslink Facility Fee Swap (BFFS) in 2002 for a 25 year term to eliminate the interest rate and foreign exchange risk arising from the Basslink construction and operational agreements. The BFFS hedged the interest rate and foreign exchange risk during construction and swapped the floating interest rate exposure in the BFF. The inherent fixed interest rate is 7.83%.
The Corporation assesses its interest rate risk exposure through sensitivity analysis. The following table shows the effect on the Income Statement of a movement of 1 basis point (bps) in forecast interest rates.
2015 2014CONSOLIDATED PARENT CONSOLIDATED PARENT
Income Equity Income Equity Income Equity Income Equity$’000 $’000 $’000 $’000 $’000 $’000 $’000 $’000
Increase/(decrease)Forward interest rates +0.1 bpsFinancial assets 1,378 (3) 1,378 (3) 1,362 - 1,362 -Financial liabilities (1,521) (34) (1,521) (34) (1,515) (59) (1,515) (59)Forward interest rates -0.1 bpsFinancial assets (1,378) 3 (1,378) 3 (1,362) - (1,362) -Financial liabilities 1,521 34 1,521 34 1,515 59 1,515 59
The sensitivity of the fair value of financial assets and liabilities to interest rates has been determined by adjusting closing published forward market rates. The impact on the fair value of financial instruments is calculated using standard Australian treasury valuation formulae.
The Weighted Average Cost of Debt (WACD) for 2015 for both the parent and consolidated entities is 6.67% (2014: 7.39%). This incorporates both loans and interest rate swaps as at the reporting date and also includes the average government guarantee fee of 1.09% (2014: 1.03%).
(C) Foreign currency rates
The Corporation owns and operates companies in India and South Africa and is exposed to foreign exchange rate risks upon translation into Australian dollars. This risk is considered to be insignificant relative to the Corporation as a whole.
The Corporation transacts in foreign currency for operational and capital requirements and enters into forward foreign exchange contracts to eliminate currency exposure in accordance with Board approved policy. Due to the relatively small size of the transactions the Corporation considers the risk exposure to be insignificant.
The Corporation ensures that the term of the hedge derivatives matches the term of the currency exposure in order to maximise hedge effectiveness and enable application of hedge accounting.
83Hydro Tasmania Annual Report 2015 83
Notes to and forming part of the financial statements for the year ended 30 June 2015

20. FINANCIAL INSTRUMENTS DISCLOSURES (CONTINUED)The settlement dates and principal amounts of the Corporation’s outstanding foreign exchange hedge contracts were:
CONSOLIDATED PARENT2015 2014 2015 2014$’000 $’000 $’000 $’000
ReceivablesNot later than one year 6,308 925 6,308 925Later than one year but not later than two years 148 8,135 148 8,135Later than two years 58 5,523 58 5,523Total 6,514 14,583 6,514 14,583
PayablesNot later than one year 22,849 8,213 22,849 8,213Later than one year but not later than two years 8,250 4,668 8,250 4,668Later than two years 1,417 2,372 1,417 2,372Total 32,516 15,253 32,516 15,253
(iii) Credit risk
Credit risk represents the loss that would be recognised at the reporting date if counterparties failed to meet their contractual obligations. The Corporation measures credit risk on non-derivative financial instruments as the carrying amount of any instruments that represent an asset to the Corporation.
Derivative financial instruments
The credit exposure on a derivative financial instrument is its positive market valuation at the reporting date. In addition a potential exposure, calculated broadly in accordance with Reserve Bank guidelines, is included for all interest rate swaps. These include the BFFS and the Basslink credit swaps.
In the main, the Corporation reduces credit risk on derivative financial assets by only transacting with high credit quality counterparties up to a pre-determined counterparty limit or by limiting credit exposure to unrated counterparties. The Corporation also obtains credit support for counterparties of low credit quality. Interest rate swaps and energy contracts are subject to the industry recommended International Swap Dealers Association (ISDA) documentation. Where possible this documentation contains clauses enabling the netting of exposures.
Receivables
Receivables represent amounts due from AEMO, electricity, gas, treasury and environmental energy product counterparties, consulting service clients and retail energy customers.
The Corporation’s credit exposure to AEMO is mitigated by the provisions of the National Electricity Rules (NER). The NER define the rules for conduct of the wholesale electricity market.
Consulting services clients are spread across diverse industries and geographical locations. Ongoing credit evaluation is performed on the financial condition of debtors, and where necessary recovery action is undertaken and contract penalty clauses activated.
Appropriate credit management practices are adopted to protect against exposure to non-payment by retail customers.
Basslink credit swaps
While the BFFS transaction has been executed with a single counterparty, the Corporation has also entered into supplementary interest rate swap transactions with other counterparties to mitigate the potential credit risk associated with a single counterparty. These swaps are readily tradeable financial instruments.
84 Annual Report 2015 Hydro Tasmania
Notes to and forming part of the financial statements for the year ended 30 June 2015

20. FINANCIAL INSTRUMENTS DISCLOSURES (CONTINUED)CONSOLIDATED
2015 2014 2015 2014$’000 $’000 $’000 $’000
Credit risk exposure by instrument typeFinancial assetsInvestments and bank balances 15,694 13,012 8,554 8,306Receivables 250,476 241,086 99,076 96,419Basslink financial asset 350 1,784 350 1,784
Derivative financial instrumentsInterest rate swaps 9 27 9 27Forward foreign exchange contracts - - - -Basslink Facility Fee Swap 11,993 12,215 11,993 12,215Energy price derivatives 20,303 24,280 20,303 24,280Environmental product contracts 23,058 9,337 23,058 9,337Total credit risk exposure 321,883 301,741 163,343 152,368
Credit risk exposure by institution ratingsAustralian-based institutionsAA+ to AA- ratings 111,939 117,500 67,514 74,830A+ to A- ratings 8,459 13,282 8,459 13,282BBB+ to BBB- ratings 1,334 1,260 1,320 1,249Unrated 172,172 142,626 58,071 35,934
293,904 274,668 135,364 125,295
Overseas-based institutionsAA+ to AA- ratings 9,941 11,258 9,941 11,258A+ to A- ratings 17,799 10,358 17,799 10,358BBB+ to BBB- ratings 239 - 239 -Unrated - 5,457 - 5,457
27,979 27,073 27,979 27,073Total credit risk exposure 321,883 301,741 163,343 152,368
(iv) Liquidity risk
Liquidity risk represents the possibility that the Corporation may be unable to settle an obligation on the due date.
To manage this risk, the Corporation maintains adequate stand-by funding facilities and other arrangements as detailed in note 15.
The Corporation’s exposure at 30 June 2015 is detailed in the tables below. The tables are based on the undiscounted cash flows of the financial assets and liabilities based on the date on which the payments fall due. The tables include principal and interest cash flows.
The Corporation monitors its liquidity risk on a daily basis. The following table details the Corporation’s liquidity exposure.
85Hydro Tasmania Annual Report 2015 85
Notes to and forming part of the financial statements for the year ended 30 June 2015

20. FINANCIAL INSTRUMENTS DISCLOSURES (CONTINUED)2015 2015
CONSOLIDATED PARENTLess than 6-12 1-5 Over 5 Less than 6-12 1-5 Over 56 months months years years 6 months months years years
$’000 $’000 $’000 $’000 $’000 $’000 $’000 $’000Financial assetsLoans and receivablesCash 15,683 - - - 8,554 - - -Receivables 250,476 - - - 99,076 - - -Held to maturityInvestments 11 - - - - - - -Fair value through profit or lossCredit swaps 13,962 13,870 90,477 116,348 13,962 13,870 90,477 116,348Forward foreign exchange contracts 76 12 1 - 76 12 1 -Energy price derivatives 24,992 5,165 36,516 4,864 24,992 5,165 36,516 4,864Basslink financial asset 29,435 29,435 221,043 578,901 29,435 29,435 221,043 578,901Other assets 20,757 - - - 8,603 - - -
355,392 48,482 348,037 700,113 184,698 48,482 348,037 700,113
Financial liabilitiesLoans and receivablesAccounts payable 157,147 - - - 88,754 - - -Tascorp loans 61,051 36,232 501,457 419,024 61,051 36,232 501,457 419,024
Designated hedge accounting derivativesInterest rate swaps 949 987 5,113 1,527 949 987 5,113 1,527Forward foreign exchange contracts 682 307 890 - 682 307 890 -Fair value through profit or lossCredit swaps 13,962 13,907 90,444 116,344 13,962 13,907 90,444 116,344Basslink Services Agreement 32,566 32,566 283,899 932,302 32,566 32,566 283,899 932,302Basslink Facility Fee Swap 19,372 19,306 131,858 254,041 19,372 19,306 131,858 254,041Energy price derivatives 25,128 25,917 99,645 63,707 25,128 25,917 99,645 63,707Other liabilities 726 - - - 600 - - -
311,583 129,222 1,113,306 1,786,945 243,064 129,222 1,113,306 1,786,945
86 Annual Report 2015 Hydro Tasmania
Notes to and forming part of the financial statements for the year ended 30 June 2015

20. FINANCIAL INSTRUMENTS DISCLOSURES (CONTINUED)2014 2014
CONSOLIDATED PARENTLess than 6-12 1-5 Over 5 Less than 6-12 1-5 Over 56 months months years years 6 months months years years
$’000 $’000 $’000 $’000 $’000 $’000 $’000 $’000Financial assetsLoans and receivablesCash 13,001 - - - 8,306 - - -Receivables 241,086 - - - 96,419 - - -Held to maturityInvestments 11 - - - - - - -Fair value through profit or lossCredit swaps 12,830 12,569 78,953 91,094 12,830 12,569 78,953 91,094Forward foreign exchange contracts 16 21 78 - 16 21 78 -Energy price derivatives 47,328 30,133 48,153 17,668 47,328 30,133 48,153 17,668Basslink financial asset 45,826 45,826 300,675 816,562 45,826 45,826 300,675 816,562Other assets 21,443 - - - 4,771 - - -
381,541 88,549 427,859 925,324 215,496 88,549 427,859 925,324
Financial liabilitiesLoans and receivablesAccounts payable 165,644 - - - 109,824 - - -Tascorp loans 103,225 112,852 300,526 249,943 103,225 112,852 300,526 249,943
Designated hedge accounting derivativesInterest rate swaps 2,960 3,025 7,594 1,174 2,960 3,025 7,594 1,174Forward foreign exchange contracts 259 357 865 - 259 357 865 -Fair value through profit or lossCredit swaps 12,843 14,060 89,816 95,480 12,843 14,060 89,816 95,480Basslink Services Agreement 38,639 38,639 322,828 1,110,172 38,639 38,639 322,828 1,110,172Basslink Facility Fee Swap 18,185 17,981 123,824 242,632 18,185 17,981 123,824 242,632Energy price derivatives 30,834 23,246 90,711 21,066 30,834 23,246 90,711 21,066Other liabilities 4,920 - - - 4,771 - - -
377,509 210,160 936,164 1,720,467 321,540 210,160 936,164 1,720,467
87Hydro Tasmania Annual Report 2015 87
Notes to and forming part of the financial statements for the year ended 30 June 2015

20. FINANCIAL INSTRUMENTS DISCLOSURES (CONTINUED)(c) Fair values
AASB 139 requires recognition of some financial assets and financial liabilities at fair value on the Balance Sheet.
Where possible this fair value is determined from prices quoted for the financial instrument on an active market.
In the event of a lack of quoted market prices, the fair value of financial instruments has been calculated using valuation models that make maximum use of available market inputs to produce a reasonable estimate of the price that would be determined by the market. In many cases this entails projecting future cash flows that are then discounted to present value using the appropriate discount rate, including the credit risk of the out of the money party to the agreement. The calculation of projected future cash flows requires, among other things, a forecast electricity price. Beyond the period when market prices are observable, the Corporation derives forecast prices from an internal model.
The fair values of financial assets and liabilities carried at fair value through profit or loss are determined using the following valuation inputs:
CONSOLIDATED2015 2014
Level 3 Level 3Level 2 Valuation Level 2 Valuation
Valuation technique Valuation techniqueLevel 1 technique – non Level 1 technique – nonQuoted – market market Quoted – market marketmarket observable observable market observable observableprices inputs inputs Total prices inputs inputs Total$’000 $’000 $’000 $’000 $’000 $’000 $’000 $’000
Financial assetsFair value through profit or lossCredit swaps - 187,535 - 187,535 - 152,191 - 152,191Forward foreign exchange contracts - 168 - 168 - 104 - 104Basslink financial asset - - 402,910 402,910 - - 456,784 456,784Energy price derivatives 12,328 20,816 31,804 64,948 34,650 48,841 40,708 124,199
12,328 208,519 434,714 655,561 34,650 201,136 497,492 733,278
Financial liabilitiesDesignated hedge accounting derivativesInterest rate swaps - 7,735 - 7,735 - 12,881 - 12,881Forward foreign exchange contracts - 1,402 - 1,402 - 1,039 - 1,039Fair value through profit or lossCredit swaps - 187,535 - 187,535 - 152,191 - 152,191Basslink Services Agreement - - 521,375 521,375 - - 580,984 580,984Basslink Facility Fee Swap - - 342,459 342,459 - - 296,993 296,993Energy price derivatives 2,146 12,946 146,165 161,257 18,653 27,414 107,187 153,254
2,146 209,618 1,009,999 1,221,763 18,653 193,525 985,164 1,197,342
88 Annual Report 2015 Hydro Tasmania
Notes to and forming part of the financial statements for the year ended 30 June 2015

20. FINANCIAL INSTRUMENTS DISCLOSURES (CONTINUED)PARENT
2015 2014Level 3 Level 3
Level 2 Valuation Level 2 ValuationValuation technique Valuation technique
Level 1 technique – non Level 1 technique – nonQuoted – market market Quoted – market marketmarket observable observable market observable observableprices inputs inputs Total prices inputs inputs Total$’000 $’000 $’000 $’000 $’000 $’000 $’000 $’000
Financial assetsFair value through profit or lossCredit swaps - 187,535 - 187,535 - 152,191 - 152,191Forward foreign exchange contracts - 168 - 168 - 104 - 104Basslink financial asset - - 402,910 402,910 - - 456,784 456,784Energy price derivatives 12,328 20,816 31,804 64,948 34,650 48,841 40,708 124,199
12,328 208,519 434,714 655,561 34,650 201,136 497,492 733,278
Financial liabilitiesDesignated hedge accounting derivativesInterest rate swaps - 7,735 - 7,735 - 11,816 - 11,816Forward foreign exchange contracts - 1,402 - 1,402 - 1,039 - 1,039Fair value through profit or lossCredit swaps - 187,535 - 187,535 - 152,191 - 152,191Basslink Services Agreement - - 521,375 521,375 - - 580,984 580,984Basslink Facility Fee Swap - - 342,459 342,459 - - 296,993 296,993Energy price derivatives 2,146 12,946 146,165 161,257 18,653 27,414 107,187 153,254
2,146 209,618 1,009,999 1,221,763 18,653 192,460 985,164 1,196,277
There were no transfers between Level 1, 2 and 3 during the year.
Basslink financial instruments
The Basslink financial instruments comprise the Basslink Services Agreement (BSA), Floating Facility Fee Instrument (FFFI) and Basslink Facility Fee Swap (BFFS). The fair value of the Basslink financial instruments has been calculated using a valuation model based on the present value of expected contractual cash flows. The fair value of expected receipts of inter-regional revenues (IRRs) under the BSA has been separately calculated based on experience to date and projected operating conditions and reported as a financial asset. The expected contractual payments under the BSA, FFFI and BFFS have been reported as financial liabilities. These represent the Basslink facility fees and interest rate swap settlements payable under these contracts.
The fair value of the BSA has been calculated using the pre-tax weighted average cost of capital as the nominal discount rate. The fair values of the FFFI and BFFS have been calculated using a 17 year forward market interest rate.
The BSA, FFFI and BFFS are not readily tradeable financial instruments.
89Hydro Tasmania Annual Report 2015 89
Notes to and forming part of the financial statements for the year ended 30 June 2015

20. FINANCIAL INSTRUMENTS DISCLOSURES (CONTINUED)Tasmanian energy price derivatives
The Corporation has entered into energy contracts in the Tasmanian market to manage its exposure to market price risks and has developed a model to value these contracts. To the extent that each contract incorporates special term, load or other conditions, the price at commencement of the contract will be at a discount from the spot price at that time. Fair value at balance date has been calculated as the present value of the difference between the projected market price and each contract price, taking into account any discount provided on inception. Projected market price is based on an internally generated long term Tasmanian energy price curve.
The financial instruments above are valued using non-market unobservable inputs, the following table details the nature and sensitivities of those inputs. For a description of the valuation method relating to fair value and unobservable inputs refer to note 20(c).
The relationship of unobservable inputs to the fair value of energy price derivatives is as follows:• The higher the electricity price, the smaller the fair value liability of energy price derivatives
The relationship of unobservable inputs to the fair value of the Basslink Services Agreement and Facility Fee Swap liability is as follows:• The higher the weighted average cost of capital, the smaller the liability
• The higher the price spread the smaller the liability
• The higher the long term average generation forecast the smaller the liability
• The higher the counterparty credit margin the larger the liability
• The higher the long term interest rate the larger the liability
Description Fair value at end of year
$’000
Valuation technique Significant unobservable
input
Range (weighted average)
Valuation change $’000
Energy price derivatives (25,400) Discounted cash flow
Long term flat electricity price -10% to +10% 52,446 to (52,457)
Basslink Services Agreement and Facilty Fee Swap (455,906) Discounted cash flow
Weighted average cost of capital 10% to 12% (11%) (11,650) to 10,559Long term price benchmark -10% to +10% (35,661) to 32,451Long term water storage positions (GWh)
8,700 to 9,300 (9,000) (47,543) to 47,543
Counterparty credit margin
0.19% to 0.59% (0.39%) 547 to (539)
Long term interest rate
2.94% to 3.34% (3.14%) (2,862) to 2,846
90 Annual Report 2015 Hydro Tasmania
Notes to and forming part of the financial statements for the year ended 30 June 2015

21. COMMITMENTS FOR EXPENDITURECONSOLIDATED PARENT
2015 2014 2015 2014$’000 $’000 $’000 $’000
(a) Capital expenditure commitmentsNot later than 1 year 31,784 17,639 31,784 17,639Over 1 year and up to 2 years 9,451 11,109 9,451 11,109
41,235 28,748 41,235 28,748(b) Operating lease commitments
Future minimum lease paymentsNot later than 1 year 4,911 4,022 3,670 3,094Over 1 year and up to 2 years 4,876 4,013 3,640 3,081Over 2 years and up to 5 years 12,093 11,612 9,828 8,703Later than 5 years 11,860 10,951 11,860 10,951
33,740 30,598 28,998 25,829
The majority of the Corporation’s leases are for office accommodation.
Payments made under operating leases are expensed as incurred over the term of the lease, except where an alternative basis is more representative of the pattern of benefits to be derived from the leased property.
(c) Other commitmentsNot later than 1 year 6,099 19,500 6,099 19,500Over 1 year and up to 2 years 5,282 602 5,282 602Over 2 years and up to 5 years 1,460 - 1,460 -Later than 5 years - - - -
12,841 20,102 12,841 20,102
The other commitments relate to pass-through costs for consulting work, energy transmission charges, contracted maintenance services and supply of general goods and services.
22. CONTINGENT ASSETS AND LIABILITIES
Under the terms of ASIC Instruments [15-0576] and [15-0577], AETV Pty Ltd and Momentum Energy Pty Ltd have been granted relief from the requirement to prepare audited financial statements. The Corporation has entered into an approved deed of indemnity for the cross-guarantee of liabilities with those controlled entities. The parties to the deed are the Hydro-Electric Corporation, AETV Pty Ltd and Momentum Energy Pty Ltd.
A consolidated statement of comprehensive income and retained profits, and a consolidated statement of financial position, comprising the company and controlled entities which are a party to the Deed of Cross Guarantee, after eliminating all transactions between parties to the Deed, at 30 June 2015, are set out in note 30.
23. AUDITOR’S REMUNERATION
CONSOLIDATED PARENT2015 2014 2015 2014
$ $ $ $Amounts received, or due and receivable, by the Auditor-General from the Corporation for auditing the financial statements of the Corporation 383,400 443,495 383,400 343,495Amounts received, or due and receivable, for compliance audits 9,150 17,825 9,150 17,825Amounts received, or due and receivable to Deloitte Touche Tohmatsu, for local and international tax matters 64,635 - 64,635 -
457,185 461,320 457,185 361,320
91Hydro Tasmania Annual Report 2015 91
Notes to and forming part of the financial statements for the year ended 30 June 2015

24. KEY MANAGEMENT PERSONNEL COMPENSATION(a) Remuneration policy
Remuneration levels for key management personnel of the Corporation are competitively set to attract and retain appropriately qualified and experienced executives. The Human Resources and Remuneration Committee, a Committee of the Board, obtains independent advice on the appropriateness of remuneration packages given trends in comparative entities both locally and interstate and the objectives of the Corporation’s remuneration policy.
The remuneration structures take into account:
• the capability and experience of key management personnel
• the key management personnel’s ability to control the relevant segments’ performance
• achievement of the Corporation’s strategic initiatives
• government wages and salaries expectations.
Remuneration packages include contribution to post-employment superannuation plans.
The Corporation has complied with Treasury guidelines in the presentation of the executive remuneration in 2015.
Non-executive directors’ remuneration
Non-executive directors are appointed by the Governor-in-Council on the joint recommendation of the Treasurer and Portfolio Minister. Each instrument of appointment is for a maximum period of three years and prescribes the relevant remuneration provisions. Directors can be re-appointed.
The level of fees paid to non-executive directors is administered by the Department of Premier and Cabinet.
Superannuation is paid at the appropriate rate as prescribed by superannuation guarantee legislation.
No other leave or retirement benefits are accrued or paid to directors.
Directors are entitled to reimbursement of expenses incurred while attending to Board business.
Non-executive directors’ remuneration is reviewed periodically with increases subject to approval by the Treasurer and Portfolio Minister.
Senior executives
The employment terms and conditions of senior executives are contained in individual employment contracts and prescribe total remuneration, superannuation, annual and long service leave and salary sacrifice provisions.
The CEO is appointed by the Premier and Portfolio Minister following selection and recommendation by the Board. The Board consults with the Government Business Executive Remuneration Advisory Panel when determining the CEO’s remuneration package.
The CEO and executive level employees are also eligible for a short-term incentive payment subject to meeting agreed key performance indicators. The CEO and Executive Remuneration Policy is aligned to Hydro Tasmania’s strategic objectives and business performance results across a mix of corporate, team and individual measures. The CEO and Executive Remuneration Policy is also aligned with Guidelines issued by the Treasurer.
Short-term incentive payments are those that are dependent on achieving specified performance goals within specified timeframes. These payments are non-recurrent and are capped at a percentage of base salary.
The performance of each senior executive, including the CEO, is reviewed annually, including a review of the remuneration package.
The terms of employment of each senior executive, including the CEO, contain a termination clause that requires the senior executive or the CEO to provide a minimum notice period of up to 6 months prior to termination of the contract.
The aggregate compensation to key management personnel of the Corporation is:
2015 2014$’000 $’000
Short-term employee benefits 3,779 4,034Post-employment benefits 335 285Other long-term benefits - -Termination benefits 378 -
4,492 4,319
92 Annual Report 2015 Hydro Tasmania
Notes to and forming part of the financial statements for the year ended 30 June 2015

24. KEY MANAGEMENT PERSONNEL COMPENSATION (CONTINUED)(b) Director remuneration
The following tables disclose the remuneration details for each person that acted as a non-executive director during the current and previous financial years:
2015Directors’ Committee Total
Director fees fees Superannuation 2014/15$’000 $’000 $’000 $’000
Dr D Crean - Chairman to 13/10/14* 70 6 7 83Mr S Eslake 45 12 6 63Mr G Every-Burns - Chairman from 13/10/14 83 8 10 101Ms J Healey 45 16 6 67Ms T Jakszewicz 46 6 5 57Mr S Kalinko 45 8 6 59Total 334 56 40 430
*Dr Crean received payment of normal remuneration in lieu of notice up until 31 January 2015.
2014Directors’ Committee Total
Director fees fees Superannuation 2013/14$’000 $’000 $’000 $’000
Dr D Crean - Chairman 98 18 12 128Mr S Eslake 45 8 6 59Mr G Every-Burns 46 4 5 55Ms J Healey 45 17 6 68Ms T Jakszewicz 46 6 5 57Mr S Kalinko 45 10 6 61Total 325 63 40 428
93Hydro Tasmania Annual Report 2015 93
Notes to and forming part of the financial statements for the year ended 30 June 2015

24. KEY MANAGEMENT PERSONNEL COMPENSATION (CONTINUED)(c) Executive remuneration
The following table discloses the remuneration details of senior executives during the current financial year:
2015Short-term Termin- Other non-
Executive Base incentive ation Super- Other monetary Total salaries payments payments annuation Vehicles benefits benefits 2014/15
$’000 $’000 $’000 $’000 $’000 $’000 $’000 $’000Mr E Albertini Chief Operating Officer 375 60 - 19 6 - 11 471Mr A Catchpole Director, Strategy & Market
Development 325 44 - 19 9 4 10 411Ms T Chu Managing Director Entura 256 26 - 19 6 2 8 317Mr N Clark Managing Director
Momentum (to 12/12/14) 161 62 378 33 11 1 4 650Mr S Davy Chief Executive Officer 466 84 - 19 10 - 14 593Mr A Evans Corporate Secretary 248 34 - 19 9 2 8 320Mr G Flack Director, Wholesale Markets 282 40 - 32 10 1 8 373Mr P Geason Managing Director
Momentum (from 05/01/15) 153 24 - 15 - - - 192Mr M Smith Chief Financial Officer 325 44 - 19 2 - 10 400Mr L Stow Chief Information Officer
(from 18/07/14) 266 40 - 25 - 1 3 335Total 2,857 458 378 219 63 11 76 4,062
94 Annual Report 2015 Hydro Tasmania
Notes to and forming part of the financial statements for the year ended 30 June 2015

24. KEY MANAGEMENT PERSONNEL COMPENSATION (CONTINUED)(c) Executive remuneration
The following table discloses the remuneration details of senior executives during the previous financial year:
2014Short-term Termin- Other non-
Executive Base incentive ation Super- Other monetary Total salaries payments payments annuation Vehicles benefits benefits 2013/14
$’000 $’000 $’000 $’000 $’000 $’000 $’000 $’000Mr E Albertini Chief Operating Officer 374 115 - 18 6 - 10 523Mr L Balcombe Chief Financial Officer
(to 11/10/13) 94 - - 5 7 1 2 109Mr R Burridge Chief Financial Officer (from
11/10/13 to 28/03/14) 128 31 - 12 9 2 4 186Mr A Catchpole Director Corporate Services
(to 26/06/14), Director, Strategy & Market Development (from 27/06/14) 302 89 - 18 6 2 8 425
Ms T Chu Managing Director Entura 247 - - 18 7 - 7 279Mr N Clark Managing Director
Momentum 343 108 - 31 11 2 9 504Mr S Davy Chief Executive Officer
(acting from 01/07/13), appointed from 5/10/13) 446 72 - 18 12 1 11 560
Mr A Evansa Corporate Secretary 469 53 - 18 7 1 7 555Mr G Flack Director, Wholesale Markets
(acting from 01/07/13, appointed from 01/04/14) 256 58 - 19 5 - 5 343
Mr M Smith Chief Financial Officer
Director Business Development (to 30/03/14), Chief Financial Officer (from 31/03/14) 292 86 - 17 2 2 8 407
Total 2,951 612 - 174 72 11 71 3,891
aDuring the year, additional remuneration was paid for Acting GM of Business Development in previous years
The Directors of the Corporation as at 30 June 2015 were:Dr D M Crean, resigned as a Director and Chairman on 13 October 2014Mr S Davy, appointed as a Director on 16 December 2014Mr S R EslakeMr G Every-Burns, appointed Chairman on 13 October 2014Ms J M HealeyMs T C JakszewiczMr S S Kalinko
During the year no non-executive Directors of the Corporation undertook any overseas trips.
Employees undertook overseas travel on 214 occasions during the year at a cost of $1,010,431. Of these, 121 overseas trips were made while undertaking work for clients, at a cost of $403,184. The cost of Entura travel on client business was recovered from clients.
95Hydro Tasmania Annual Report 2015 95
Notes to and forming part of the financial statements for the year ended 30 June 2015

25. RELATED PARTY INFORMATIONSales to related Purchases from Amounts owed Amounts owed
parties related parties by related parties to related parties2015 2014 2015 2014 2015 2014 2015 2014$’000 $’000 $’000 $’000 $’000 $’000 $’000 $’000
CONSOLIDATEDWoolnorth Wind Farm Holding Pty Ltd 17,966 11,497 4,653 25,747 272 832 - -Cathedral Rocks Construction and Management Pty Ltd - - - - - 135 - -Kakamas Hydro Electric Power (Pty) Ltd - - - - - - - -
PARENTHT Wind Operations Pty Ltd - - - - - - 147,498 144,981Cathedral Rocks Construction and Management Pty Ltd - - - - - 135 - -Bell Bay Power Pty Ltd 35 320 - - 362 134 -Bell Bay Three Pty Ltd - - - - - - 1,424 1,424Lofty Ranges Power Pty Ltd - - - - 481 511 - -Hydro Tasmania Consulting (Holding) Pty Ltd - - - - 4,035 4,035 - -Hydro Tasmania Consulting India Pty Ltd - - - - - - -Hydro Tasmania Wind Developments Pty Ltd - - - - 221 114RE Storage Project Holding Pty Ltd - - - - 893 936 - -Heemskirk Wind Farm Pty Ltd - - - - 95 95 - -Studland Bay Holdings Pty Ltd - - - - 11,370 11,370 - -Bluff Point Holdings Pty Ltd - - - - 18,666 18,666 - -Momentum Energy Pty Ltd 53,957 69,629 253 - 21,667 49,091 - -AETV Pty Ltd - - 7,213 - 296,034 245,158 - -Hydro Tasmania South Africa (Pty) Ltd - - - - 42 4,612 - -Hydro Tasmania Neusberg (Pty) Ltd - - - - - 665 - -
Transactions with related parties are made at arm’s length at normal market prices and on normal commercial terms.
Outstanding balances at year end are unsecured and interest free. Settlement with related parties not wholly owned occurs in cash. Cash settlement does not occur between wholly-owned subsidiaries and the parent.
There were no transactions with director related entities during the year.
Amounts owed by AETV to the parent are fully provided for.
26. EVENTS SUBSEQUENT TO BALANCE DATEOn 11 August 2015, the Tasmanian Government announced its approval for Hydro Tasmania to sell the combined-cycle gas turbine at the Tamar Valley Power Station subject to certain conditions being satisfied.
After due enquiry, there have not been any other matters or circumstances since the end of the financial year that have significantly affected or may have significantly affected the operations of the Corporation, the results of those operations or the state of affairs of the Corporation in subsequent financial years.
96 Annual Report 2015 Hydro Tasmania
Notes to and forming part of the financial statements for the year ended 30 June 2015

27. GOVERNMENT GRANTSThe Corporation has recognised $9.7m of grant revenue during the year (2014: $15m) as detailed below:
Community Service Obligations
On 1 June 1999, the Tasmanian Government agreed to formally recognise the cost of concessions to eligible customers living on the Bass Strait islands as a Community Service Obligation (CSO), as defined under the Government Business Enterprises Act 1995.
During the year ended 30 June 2015, the State paid the Corporation $9.6m (2014: $9.2m) as reimbursement of the cost of providing CSO.
Department of Resources, Energy and Tourism – Flinders Hub
During the year the Commonwealth Government entered into a $5.5m funding agreement through the Australian Renewable Energy Agency (ARENA) for the development of a modular hybrid energy solution on Flinders Island to displace more than 60% of the island’s diesel generated electricity. The total project value is $12.8m, of which ARENA will fund up to $5.5m.
During the year the corporation received the first draw down of $0.14m (2014: Nil) for the Flinders Island Hybrid Energy Hub project.
ARENA have committed to providing a further $4.86m in funding up to 31 December 2016, with an additional $0.5m contingency grant available.
Department of Resources, Energy and Tourism – King Island Renewable Energy Integration Project
As at 30 June 2011, the Commonwealth Government entered into a $15.28m funding agreement with the Corporation under the auspices of the Renewable Energy Demonstration Program.
This grant has been administered by the Australian Renewable Energy Agency (ARENA) from 1 July 2012 since ARENA’s creation.
Under the agreement the Corporation received 33.3% funding for the integration of multiple renewable energy sources into an existing small scale diesel generation system. As the project progressed the scope was significantly reduced and the $15.28m was reduced to $6.08m, representing 33.3% of the revised budget.
During the year ended 30 June 2015 the Corporation did not recognise any grant income (2014: $4.584m) as reimbursement of costs relating to the grant. All payments for the King Island Project (KIREIP) have been received.
97Hydro Tasmania Annual Report 2015 97
Notes to and forming part of the financial statements for the year ended 30 June 2015

28. CONTROLLED ENTITIES
Percentage of share held byHydro-Electric Corporation
Country of 2015 2014Footnote incorporation % %
Parent entityHydro-Electric Corporation
Controlled entitiesBell Bay Power Pty Ltd 1 Australia 100 100Lofty Ranges Power Pty Ltd 2 Australia 100 100Bell Bay Three Pty Ltd 3 Australia 100 100RE Storage Project Holding Pty Ltd 4 Australia 100 100Hydro Tasmania Consulting (Holding) Pty Ltd 5 Australia 100 100Momentum Energy Pty Ltd 6 Australia 100 100HT Wind Operations Pty Ltd 7 Australia 100 100Hydro Tasmania South Africa (Pty) Ltd 8 South Africa 100 100AETV Pty Ltd 9 Australia 100 100
Footnotes
1. Bell Bay Power Pty Ltd was incorporated on 20 December 2001.2. Lofty Ranges Power Pty Ltd was incorporated on 26 April 2002.3. Bell Bay Three Pty Ltd was incorporated on 7 December 2005.4. RE Storage Project Holding Pty Ltd was incorporated on 11 April 2006.5. Hydro Tasmania Consulting (Holding) Pty Ltd was incorporated on 20 October 2006. It holds a 99.9% interest (9,999 shares) in
Hydro Tasmania Consulting India Private Limited with Hydro-Electric Corporation holding 1 share.6. Hydro Tasmania acquired 51% of the issued capital of Momentum Energy Pty Ltd on 31 August 2008. The remaining 49% of the
issued capital was acquired on 30 September 2009. Momentum was incorporated on 8 July 2002.7. Hydro Tasmania acquired 100% of the issued capital of HT Wind Operations Pty Ltd on 30 June 2011. HT Wind Operations Pty
Ltd owns 100% of Woolnorth Bluff Point Holdings Pty Ltd, Woolnorth Studland Bay Holdings Pty Ltd, Heemskirk Holdings Pty Ltd, HT Wind Developments Pty Ltd and HT Wind New Zealand Pty Ltd. HT Wind Operations Pty Ltd was registered on 29 November 2004.
8. Hydro Tasmania acquired 100% ownership of Hydro Tasmania South Africa (Pty) Ltd on 23 January 2012. Hydro Tasmania South Africa (Pty) Ltd holds a 92% ownership interest in Hydro Tasmania Neusberg (Pty) Ltd.
9. AETV Pty Ltd was transferred to Hydro Tasmania by Ministerial direction on midnight 1 June 2013.
98 Annual Report 2015 Hydro Tasmania
Notes to and forming part of the financial statements for the year ended 30 June 2015

29. INTEREST IN JOINT VENTURESCONSOLIDATED PARENT
Ordinary Ordinary share Joint venture share Joint venture
Joint ownership agreement ownership agreementventure interest voting rights interest voting rights
Principal activity
balance 2015 2014 2015 2014 2015 2014 2015 2014date % % % % % % % %
Cathedral Rocks Construction and Management Pty Ltd
Wind farm construction and operation
30 June 50 50 50 50 50 50 50 50
SA Water Corporation & Lofty Ranges Power Pty Ltd Joint Venture
Mini-hydro operation
30 June 50 50 50 50 - - - -
RE Storage Pty Ltd Investigation of renewable energy commercial opportunities 30 June 50 50 50 50 50 50 50 50
Integrated Energy Solutions Pty Ltd
Implementation of renewable energy project 30 June 50 50 50 50 - - - -
Woolnorth Wind Farm Holding Pty Ltd
Wind farm operation
30 June 25 25 25 25 - - - -
Kakamas Hydro Electric Power (Pty) Ltd
Mini-hydro operation
30 June 25 25 25 25 - - - -
The Corporation holds a 50% interest in a dormant joint venture (Cathedral Rocks Construction and Management Pty Ltd) with Acciona Energy Oceania Pty Ltd. The joint venture was previously engaged in managing the construction and operation of a wind farm at Cathedral Rocks, South Australia (note 31).
A subsidiary of the Corporation, Lofty Ranges Power Pty Ltd, holds a 50% interest in an unincorporated joint venture operation named SA Water Corporation & Lofty Ranges Power Pty Ltd Joint Venture. The principal activity of the joint venture is the operation of hydro facilities.
The Corporation holds a 50% interest in an incorporated joint venture operation with CBD Energy Limited, named RE Storage Pty Ltd. The principal activity of the joint venture is the investigation of renewable energy commercial opportunities. This joint venture was de-registered on 16 March 2015.
A subsidiary of the Corporation, RE Storage Project Holding Pty Ltd holds a 50% interest in an incorporated joint venture with CBD Project Holdings Pty Ltd, a 100% owned subsidiary of CBD Energy Limited, named Integrated Energy Solutions Pty Ltd. The principal activity of the joint venture is the implementation of a renewable energy project on King Island. This joint venture was de-registered on 16 March 2015.
A subsidiary of the Corporation, Hydro Tasmania South Africa (Pty) Ltd became a joint venture partner in the Kakamas Hydro Electric Power (Pty) Ltd joint venture during 2013 and holds a 25% interest in the joint venture. The principal activity of the joint venture is to develop and operate a hydro scheme in Neusberg South Africa.
99Hydro Tasmania Annual Report 2015 99
Notes to and forming part of the financial statements for the year ended 30 June 2015
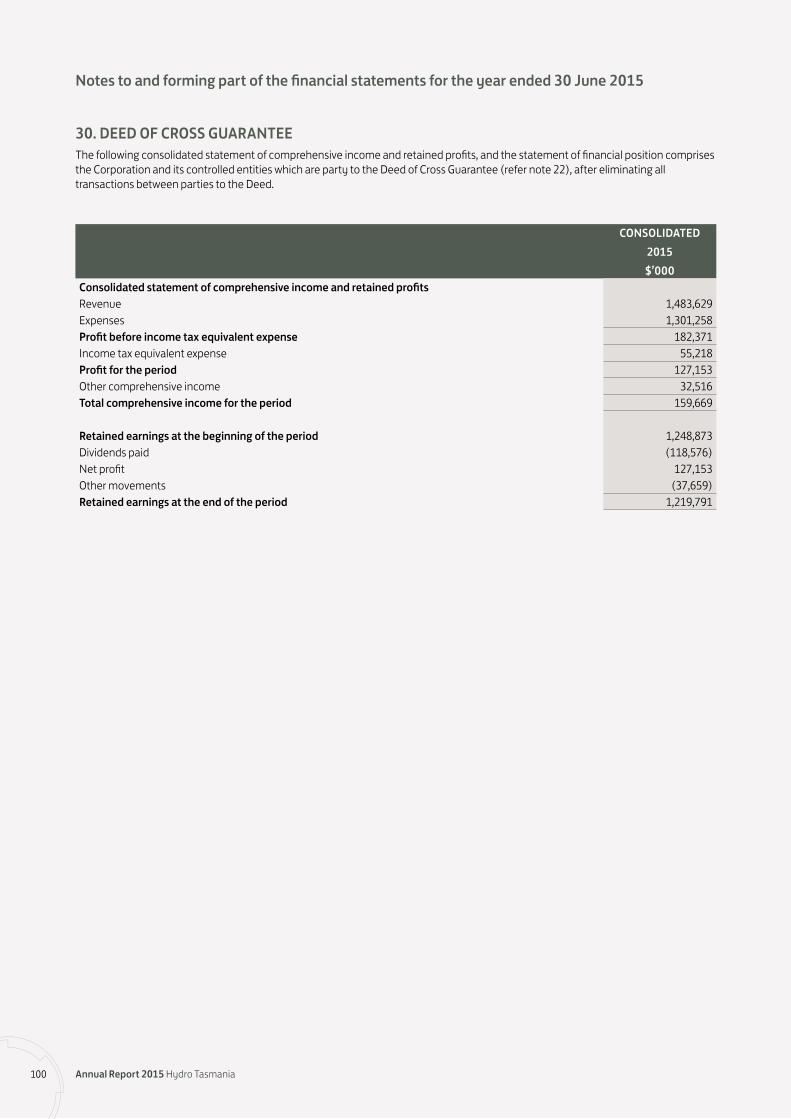
30. DEED OF CROSS GUARANTEEThe following consolidated statement of comprehensive income and retained profits, and the statement of financial position comprises the Corporation and its controlled entities which are party to the Deed of Cross Guarantee (refer note 22), after eliminating all transactions between parties to the Deed.
CONSOLIDATED2015$’000
Consolidated statement of comprehensive income and retained profitsRevenue 1,483,629Expenses 1,301,258Profit before income tax equivalent expense 182,371Income tax equivalent expense 55,218Profit for the period 127,153Other comprehensive income 32,516Total comprehensive income for the period 159,669
Retained earnings at the beginning of the period 1,248,873Dividends paid (118,576)Net profit 127,153Other movements (37,659)Retained earnings at the end of the period 1,219,791
100 Annual Report 2015 Hydro Tasmania
Notes to and forming part of the financial statements for the year ended 30 June 2015

30. DEED OF CROSS GUARANTEE (CONTINUED)CONSOLIDATED
2015$’000
Current assetsCash and cash equivalents 8,712Receivables 250,151Investments 11Inventories 2,577Other financial assets 134,091Current tax asset 25,876Other 15,060Total current assets 436,478
Non-current assetsInvestments 184,410Property plant and equipment 4,106,184Other financial assets 425,516Intangible assets 88,400Goodwill 16,396Other 32,874Total non-current assets 4,853,780
TOTAL ASSETS 5,290,258
Current liabilitiesPayables 167,399Interest-bearing liabilities 65,403Provisions 78,771Other financial liabilities 142,228Other 413,111Total current liabilities 866,912
Non-current liabilitiesInterest-bearing liabilities 789,612Deferred tax liability 570,552Provisions 401,704Other financial liabilities 891,216Total non-current liabilities 2,653,084
TOTAL LIABILITIES 3,519,996
NET ASSETS 1,770,262
EQUITYContributed equity 558,206Reserves (7,735)Retained earnings 1,219,791TOTAL EQUITY 1,770,262
101Hydro Tasmania Annual Report 2015 101
Notes to and forming part of the financial statements for the year ended 30 June 2015

31. INCORPORATED JOINT VENTURES The income statements and balance sheets of the following incorporated joint ventures are not consolidated but are instead accounted for under the equity method.
CONSOLIDATEDCathedral Rocks
Woolnorth Construction and KakamasWind Farm Management Hydro Electric
Joint Venture Pty Ltd Power Pty Ltd Total25% 50% 25%2015 2015 2015 2015$’000 $’000 $’000 $’000
Income statementRevenue 85,987 2 3,407 89,396Expenses 78,238 - 1,033 79,271Profit/(loss) before income tax expense 7,749 2 2,374 10,125Income tax expense (3,032) - - (3,032)Net profit/(loss) after tax 4,717 2 2,374 7,093
Balance SheetCurrent assets 67,257 52 5,695 73,004Non-current assets 595,457 - 19,061 614,518Total assets 662,714 52 24,756 687,522
Current liabilities 26,079 - 2,312 28,391Non-current liabilities 427,372 - 20,082 447,454Total liabilities 453,451 - 22,394 475,845
Net assets 209,263 52 2,362 211,677
Share of accumulated profits/(losses)Share of accumulated profit/(losses) at the beginning of the year 11,368 (23) (727) 10,618Share of profit/(loss) before income tax expense 1,179 1 593 1,773Share of accumulated profits/(losses) at the end of the year 12,547 (22) (134) 12,391
Movements in carrying amount of investment in joint venturesCarrying amount at the beginning of the year 65,325 15 3,599 68,939Dividends received (2,156) - - (2,156)Share of profit/(loss) before income tax for the year 1,179 1 593 1,773Carrying amount at the end of the year 64,348 16 4,192 68,556
102 Annual Report 2015 Hydro Tasmania
Notes to and forming part of the financial statements for the year ended 30 June 2015

31. INCORPORATED JOINT VENTURES (CONTINUED)CONSOLIDATED
Cathedral RocksWoolnorth Construction and KakamasWind Farm Management Hydro Electric
Joint Venture Pty Ltd Power Pty Ltd Total25% 50% 25%2014 2014 2014 2014$’000 $’000 $’000 $’000
Income statementRevenue 91,363 8 3 91,374Expenses 76,189 1 2,911 79,101Profit/(loss) before income tax expense 15,174 7 (2,908) 12,273Income tax expense (4,783) (2) - (4,785)Net profit/(loss) after tax 10,391 5 (2,908) 7,488
Balance SheetCurrent assets 70,678 411 1,785 72,874Non-current assets 622,743 - 37,085 659,828Total assets 693,421 411 38,870 732,702
Current liabilities 48,318 272 108 48,698Non-current liabilities 425,860 - 28,598 454,458Total liabilities 474,178 272 28,706 503,156
Net assets 219,243 139 10,164 229,546
Share of accumulated profits/(losses)Share of accumulated profit/(losses) at the beginning of the year 8,770 (26) - 8,744Share of profit before income tax expense 2,598 3 (727) 1,874Share of accumulated profit/(losses) at the end of the year 11,368 (23) (727) 10,618
Movements in carrying amount of investment in joint venturesCarrying amount at the beginning of the year 63,627 12 4,326 67,965Dividends received (900) - - (900)Share of profit before income tax for the year 2,598 3 (727) 1,874Carrying amount at the end of the year 65,325 15 3,599 68,939
The fair value of the Corporation’s investment in joint ventures is equivalent to its carrying value in the absence of a quoted market price for investment shares in joint venture.
The Woolnorth Wind Farm joint venture has finance agreements in place which impose conditions on it making distributions in the form of dividends or loan repayments.
103Hydro Tasmania Annual Report 2015 103
Notes to and forming part of the financial statements for the year ended 30 June 2015

32. DIVIDENDCONSOLIDATED PARENT
2015 2014 2015 2014$’000 $’000 $’000 $’000
Declared and Paid during the yearStatutory dividend 118,576 116,058 118,576 116,058
At the date of signing the Annual Report the Board had not yet declared a dividend, similarly no declaration was made in the previous year prior to the signing of the Annual Report.
33. SEGMENT INFORMATIONIdentification of reportable segments
The Corporation has identified its material operating segments based on the internal reports that are reviewed and used by the Chief Executive Officer (CEO) as chief operating decision maker in assessing the performance and determining the allocation of resources. Three material segments have been identified as Hydro Tasmania, AETV and Momentum Energy.
Types of products and services by segment
(i) Hydro Tasmania
Hydro Tasmania generates and sells wholesale energy into the National Electricity Market from hydro generation assets and provides consulting services.
(ii) AETV
AETV Pty Ltd generates and sells wholesale energy into the National Electricity Market from gas fired generation assets and sells gas to wholesale customers in Tasmania.
(iii) Momentum Energy
Momentum Energy sells energy to retail customers in the Victorian, New South Wales, South Australian and Queensland regions of the National Electricity Market.
Basis of accounting for purposes of reporting by operating segments
Unless stated otherwise, all financial information reported to the CEO with respect to individual segments is determined in accordance with the accounting policies adopted in the financial statements as detailed in note 1.2.
Inter-segment revenues are eliminated on consolidation.
104 Annual Report 2015 Hydro Tasmania
Notes to and forming part of the financial statements for the year ended 30 June 2015

33. SEGMENT INFORMATION (CONTINUED)YEAR ENDED 30 JUNE 2015
Hydro Momentum Total Adjustments & Tasmania AETV Energy Segments eliminations Consolidated
$’000 $’000 $’000 $’000 $’000 $’000RevenueExternal customers 588,321 49,767 900,872 1,538,960 (71,799) 1,467,161Share of joint venture 1,773 - - 1,773 - 1,773Other revenue 19,594 - - 19,594 (4,305) 15,289Total revenue 609,688 49,767 900,872 1,560,327 (76,104) 1,484,223
Segment resultsDepreciation and amortisation 88,088 3,882 948 92,918 - 92,918Finance expenses 71,927 5,988 - 77,915 (5,988) 71,927Net fair value movement 117,449 (6,522) - 110,927 - 110,927Net revaluation and impairment (197,442) 17,344 - (180,098) (51,968) (232,066)Other expense 382,504 81,796 862,842 1,327,142 (70,116) 1,257,026Total expense 462,526 102,488 863,790 1,428,804 (128,072) 1,300,732
Profit/(loss) before income tax equivalent expense 147,162 (52,721) 37,082 131,523 51,968 183,491
Comprising:Result before fair value movements and revaluation 67,169 (41,899) 37,082 62,352 - 62,352Net fair value gains/(losses) (117,449) 6,522 - (110,927) - (110,927)Revaluation and impairment (expenses)/gains 197,442 (17,344) - 180,098 51,968 232,066Profit/(loss) before income tax equivalent expense 147,162 (52,721) 37,082 131,523 51,968 183,491
Income tax equivalent expense 67,425 (15,816) 14,602 66,211 (11,395) 54,816
Segment profit/(loss) after tax 79,737 (36,905) 22,480 65,312 63,363 128,675
Total assets 5,036,194 198,331 165,070 5,399,595 (203,827) 5,195,768
Total liabilities 2,977,462 427,834 102,101 3,507,397 (374,950) 3,132,447
Other disclosuresInvestment in joint venture 68,556 - - 68,556 - 68,556Capital expenditure 96,125 - 4,573 100,698 - 100,698
Inter-segment revenues are eliminated on consolidation.
105Hydro Tasmania Annual Report 2015 105
Notes to and forming part of the financial statements for the year ended 30 June 2015

33. SEGMENT INFORMATION (CONTINUED)YEAR ENDED 30 JUNE 2014
Hydro Momentum Total Adjustments & Tasmania AETV Energy Segments eliminations Consolidated
$’000 $’000 $’000 $’000 $’000 $’000RevenueExternal customers 886,809 85,107 1,033,232 2,005,148 (27,136) 1,978,012Share of joint venture 2,073 - - 2,073 - 2,073Other revenue 27,910 - 305 28,215 (15,163) 13,052Total revenue 916,792 85,107 1,033,537 2,035,436 (42,299) 1,993,137
Segment resultsDepreciation and amortisation 83,804 3,941 485 88,230 - 88,230Finance expenses 79,840 15,163 - 95,003 (15,163) 79,840Net fair value movement (153,621) (8,489) - (162,110) - (162,110)Net revaluation and impairment 265,657 (1,202) - 264,455 (43,963) 220,492Other expense 458,158 141,028 1,011,904 1,611,090 (27,136) 1,583,954Total expense 733,838 150,441 1,012,389 1,896,668 (86,262) 1,810,406
Profit/(loss) before income tax equivalent expense 182,954 (65,334) 21,148 138,768 43,963 182,731
Comprising:Result before fair value movements and revaluation 294,990 (75,025) 21,148 241,113 - 241,113Net fair value gains/(losses) 153,621 8,489 - 162,110 - 162,110Revaluation and impairment (expenses)/gains (265,657) 1,202 - (264,455) 43,963 (220,492)Profit/(loss) before income tax equivalent expense 182,954 (65,334) 21,148 138,768 43,963 182,731
Income tax equivalent expense 54,512 (19,598) 4,268 39,182 - 39,182
Segment profit/(loss) after tax 128,442 (45,736) 16,880 99,586 43,963 143,549
Total assets 4,860,194 192,734 175,703 5,228,631 (203,827) 5,024,804
Total liabilities 2,996,102 386,077 135,213 3,517,392 (308,303) 3,209,089
Other disclosuresInvestment in joint venture 68,939 - - 68,939 - 68,939Capital expenditure 115,346 36 3,315 118,697 - 118,697
106 Annual Report 2015 Hydro Tasmania
Notes to and forming part of the financial statements for the year ended 30 June 2015

33. SEGMENT INFORMATION (CONTINUED)YEAR ENDED
2015 2014$’000 $’000
Reconciliation of profit
Segment profit 65,312 99,586Energy sales 71,799 27,136Purchased energy (71,799) (27,136)Other income 5,988 15,163Interest expense (5,988) (15,163)Intercompany loan impairment 51,968 43,963Income tax 11,395 -Consolidated profit 128,675 143,549
Reconciliation of assetsSegment total assets 5,399,595 5,228,631Elimination of investment in subsidiary (203,827) (203,827)Corporation total assets 5,195,768 5,024,804
Reconciliation of liabilitiesSegment total liabilities 3,507,397 3,517,392Elimination of intercompany revaluation and balances (374,950) (308,303)Corporation total liabilities 3,132,447 3,209,089
107Hydro Tasmania Annual Report 2015 107
Notes to and forming part of the financial statements for the year ended 30 June 2015

Superannuation declaration
I, Stephen Davy, hereby certify that the Hydro-Electric Corporation has met its obligations under the Commonwealth’s Superannuation Guarantee (Administration) Act 1992 in respect of any employee who is a member of a complying superannuation scheme to which the Hydro-Electric Corporation contributes.
S Davy Chief Executive Officer 13 August 2015
Statement of certification
In the opinion of the directors of the Hydro-Electric Corporation:
a) the financial statements and notes of the Corporation and of the consolidated entity are in accordance with the Government Business Enterprises Act 1995, including:
(i) giving a true and fair view of the results and cash flows for the year ended 30 June 2015 and the financial position at 30 June 2015 of the Corporation and its subsidiaries;
(ii) complying with the Australian Accounting Standards and Interpretations, and with the Treasurer’s instructions.
b) there are reasonable grounds to believe that the Corporation will be able to pay its debts as and when they fall due.
c) there are reasonable grounds to believe that the Corporation, AETV Pty Ltd and Momentum Energy Pty Ltd will be able to meet any obligations or liabilities to which they are or may become subject to by virtue of the Deed of Cross Guarantee between those entities pursuant to ASIC Instruments [15-0576] and [15-0577].
This declaration has been made after receiving the following declaration from the Chief Executive Officer and Chief Financial Officer of the Corporation:
a) the financial records of the Corporation for the year ended 30 June 2015 have been properly maintained in accordance with Section 51 of the Government Business Enterprises Act 1995;
b) the financial statements and notes for the year ended 30 June 2015 have been prepared in accordance with Section 52 of the Government Business Enterprises Act 1995; and
c) the financial statements and notes for the year ended 30 June 2015 give a true and fair view.
Signed in accordance with a resolution of the directors:
G Every-Burns S Eslake Chairman Director 13 August 2015 13 August 2015
108 Annual Report 2015 Hydro Tasmania
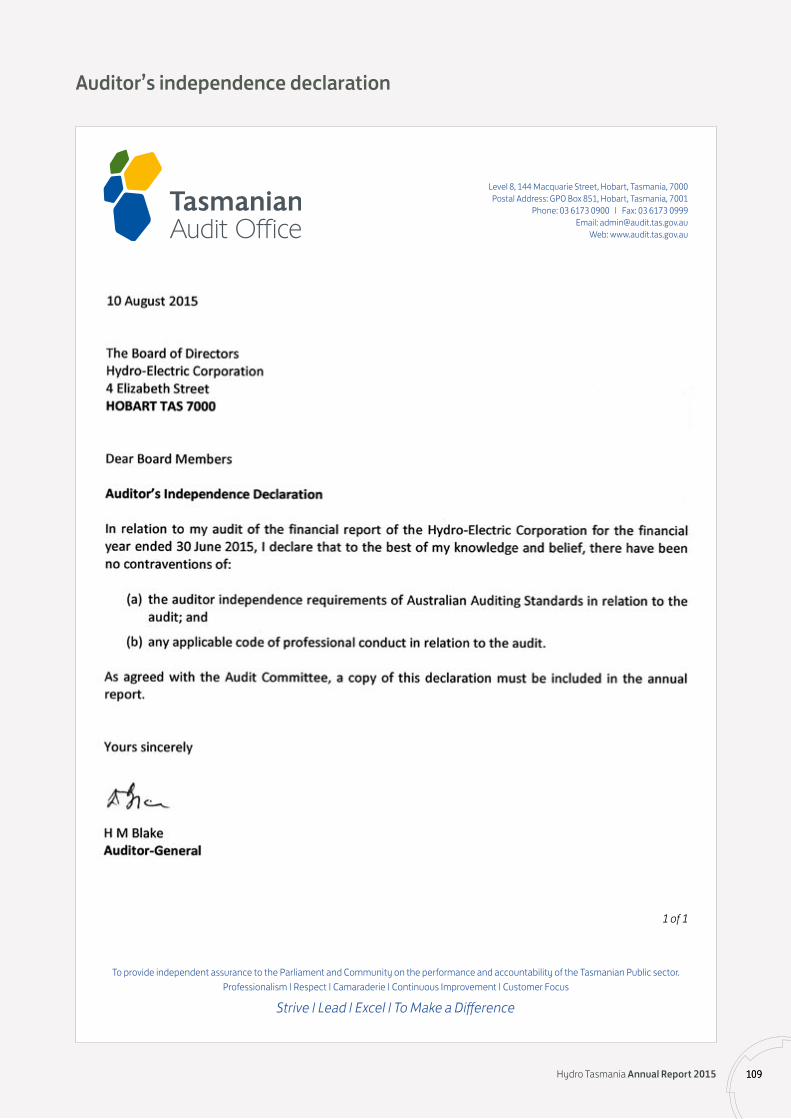
To provide independent assurance to the Parliament and Community on the performance and accountability of the Tasmanian Public sector. Professionalism | Respect | Camaraderie | Continuous Improvement | Customer Focus
Strive | Lead | Excel | To Make a Difference
Level 8, 144 Macquarie Street, Hobart, Tasmania, 7000Postal Address: GPO Box 851, Hobart, Tasmania, 7001
Phone: 03 6173 0900 | Fax: 03 6173 0999Email: [email protected]
Web: www.audit.tas.gov.au
1 of 1
Auditor’s independence declaration
109Hydro Tasmania Annual Report 2015 109

To provide independent assurance to the Parliament and Community on the performance and accountability of the Tasmanian Public sector. Professionalism | Respect | Camaraderie | Continuous Improvement | Customer Focus
Strive | Lead | Excel | To Make a Difference
1 of 2
Independent audit report
110 Annual Report 2015 Hydro Tasmania

To provide independent assurance to the Parliament and Community on the performance and accountability of the Tasmanian Public sector. Professionalism | Respect | Camaraderie | Continuous Improvement | Customer Focus
Strive | Lead | Excel | To Make a Difference
2 of 2
Independent audit report (continued)
111Hydro Tasmania Annual Report 2015 111

Generation summaryAs at June 30 2011 2012 2013 2014 2015
Mainland Tasmania Power stations
Hydro Number 30 30 301 30 30
Thermal (gas) Number 0 0 12 1 1
Wind Number 23 04 05 0 0
Total number of power stations Number 32 30 31 31 31
Installed capacity
Hydro MW 2 281 2 281 2 281 2 281 2 281
Thermal (gas) MW 0 0 3726 372 372
Wind MW 140 0 0 0 0
Total installed capacity MW 2 421 2 281 2 653 2 653 2 653
Energy generated7
Hydro GWh 9 276 8 334 10 627 11 932 8 176
Thermal (gas) GWh 0 0 1408 886 4
Wind9 GWh 0 3139 0 0 0
Total energy generated GWh 9 273 8 647 10 767 12 798 8 180
Generation peak MW 2 093 2 042 2 222 2 168 2 187
Generation load factor 10 % 51 48 55 67 43
Bass Strait islandsKing Island
Diesel MWh 11 232 11 635 7 968 7 220 7 430
Wind MWh 5 139 4 830 4 133 4 974 4 14411
Flinders Island diesel MWh 4 232 4 123 3 569 3 734 3 536
Total Bass Strait islands MWh 20 603 20 588 15 670 15 928 15 110
Notes: 1) The number of power stations differs from the number in the Statement of Corporate Intent as this table includes power stations additional to the main undertakings,
being Parangana, Nieterana (Butlers Gorge mini-hydro) and Lower Lake Margaret.2) Tamar Valley Power Station transferred to Hydro Tasmania on 1 June 2013.3) Woolnorth Bluff Point Wind Farm and Woolnorth Studland Bay Wind Farm transferred to Hydro Tasmania on 30 June 2011.4) Woolnorth Bluff Point Wind Farm and Woolnorth Studland Bay Wind Farm transferred from Hydro Tasmania in February 2012.5) Musselroe Wind Farm transferred from Hydro Tasmania on 5 February 2013 before operational production commenced.6) Tamar Valley Power Station registered capacity.7) Mainland Tasmania energy generated is calculated as the net energy measured at the market and distribution connection points.8) Tamar Valley Power Station energy generated for the month of June 2013.9) Wind energy generation is from 1 July 2011 to 27 February 2012.10) Calculated as average MW divided by peak MW. Average MW calculated from total energy divided by hours in the year.11) King Island generation is calculated as the Net Wind output for the year.
112 Annual Report 2015 Hydro Tasmania
Statistical summaries

Financial statistical summaryFive Year Profile - Statement of Comprehensive Income
2011 $’000
2012 $’000
2013 $’000
2014 $’000
2015 $’000
IncomeSales of goods and services 804,181 1,039,693 1,541,617 1,978,012 1,467,161Other income 8,591 11,438 13,616 15,125 17,062TOTAL INCOME 812,772 1,051,131 1,555,233 1,993,137 1,484,223
ExpensesLabour 104,660 104,802 123,242 149,941 126,060Direct operating expenses 374,930 590,001 960,782 1,319,456 1,034,271Depreciation and amortisation of non-current assets 79,873 82,273 91,373 88,230 92,918Impairment of non-current assets - - 484,315 220,492 (232,066)Finance costs 80,481 86,687 67,501 79,840 71,927Fair value movements (116,389) 85,571 1,923 (162,110) 110,927Other operating expenses 72,812 83,928 82,074 114,557 96,695TOTAL EXPENSES 596,367 1,033,262 1,811,210 1,810,406 1,300,732
NET PROFIT/(LOSS) BEFORE TAX 216,405 17,869 (255,977) 182,731 183,491
Five Year Profile - Balance Sheet2011
$’0002012
$’0002013
$’0002014
$’0002015
$’000AssetsCash and cash equivalents 13,199 7,061 39,806 13,012 15,683Investments - 34,557 66,696 68,939 68,556Receivables 114,253 142,062 220,828 241,086 250,476Property, plant and equipment 4,414,220 4,484,569 4,188,436 3,969,795 4,208,087Financial and other assets 964,922 1,137,587 613,592 731,972 652,966TOTAL ASSETS 5,506,594 5,805,836 5,129,358 5,024,804 5,195,768
LiabilitiesPayables 81,260 124,700 142,732 176,073 164,283Provisions 371,154 467,247 551,369 559,090 501,707Interest bearing liabilities 983,366 856,806 905,795 864,003 855,015Tax liabilities 804,684 801,713 621,103 555,087 569,678Financial liabilities 1,252,677 1,423,323 1,119,204 1,054,837 1,041,764TOTAL LIABILITIES 3,493,141 3,673,789 3,340,203 3,209,090 3,132,447
NET ASSETS 2,013,453 2,132,047 1,789,155 1,815,714 2,063,321
EQUITY 2,013,453 2,132,047 1,789,155 1,815,714 2,063,321
Five Year Profile - Capital Works2011
$’000’s2012
$’000’s2013
$’000’s2014
$’000’s2015
$’000’sExpenditureGeneration assets 48,049 147,310 85,732 71,034 73,182Bass Strait islands 1,144 6,389 1,828 1,164 1,461Communications - - - - Land and buildings 823 956 1,286 686 624Fleet 1,938 2,159 2,887 3,646 3,905Information systems 9,279 20,617 57,047 36,329 20,811Renewable developments - 3,584 8,654 412 334Other assets 3,105 5,120 6,604 5,426 381TOTAL CAPITAL EXPENDITURE 64,338 186,135 164,038 118,697 100,698
113Hydro Tasmania Annual Report 2015

114 Annual Report 2015 Hydro Tasmania
Consultancies valued at more than $50,000 (ex GST), 2014–15
Name of consultant Location Description Period of engagement Total paid (AUD)
Pitt & Sherry (Operations) Pty Ltd Launceston, TAS Engineering consultants 1 Jul 2014–30 Jun 2015 736,290.03 Ernst & Young Sydney, NSW Financial consultants 1 Jul 2014–30 Jun 2015 490,722.24 Capgemini Australia Pty Ltd Sydney, NSW Information technology consultants 23 Sep 2014 –30 Jun 2015 453,019.95 Corrs Chambers Westgarth Melbourne, VIC Legal advisors 1 Jul 2014–30 Jun 2015 361,471.71 GHD Hobart, TAS Engineering consultants 1 Jul 2014–30 Jun 2015 361,171.23 Damwatch Engineering Ltd Wellington, NZ Engineering consultants 1 Jul 2014–30 Jun 2015 375,903.50 Page Seager Hobart, TAS Legal advisors 1 Jul 2014–30 Jun 2015 325,344.05 Clayton Utz Sydney, NSW Legal advisors 1 Jul 2014–30 Jun 2015 283,436.47 Pitcher Partners Melbourne, VIC Information technology consultants 1 Oct 2014–30 Jun 2015 279,814.00 Pitt & Sherry Consulting Engineers Hobart, TAS Engineering consultants 1 Jul 2014–30 Jun 2015 243,922.58 Partners in Performance International
Sydney, NSW Financial consultants 15 Dec 2014–30 Mar 2015 226,744.17
SICC Services Devonport, TAS Engineering consultants 1 Jul 2014–30 Jun 2015 194,904.00 KPMG Melbourne, VIC Financial consultants 10 Dec 2014–30 Jun 2015 192,264.98 Marsden Jacob Associates Camberwell, VIC Financial consultants 1 Jul 2014–30 Jun 2015 191,405.00 Howarth Fisher and Associates Sandy Bay, TAS Engineering consultants 1 Jul 2014–30 Jun 2015 177,794.55 URS Australia Pty Ltd Southbank, VIC Engineering consultants 1 Jul 2014–30 Jun 2015 177,253.35 Clutch Consulting Pty Ltd Forestville, SA Engineering consultants 1 Jul 2014–30 Jun 2015 139,468.02 Celsius Graphic Design Collingwood, VIC Marketing consultants 28 Jan 2015–30 Jun 2015 127,849.39 E3 International Pty Ltd Surfers Paradise, QLD Strategic advisory services 1 Jul 2014–30 Jun 2015 118,579.66 Mark G Jackson Consulting East Launceston, TAS Engineering consultants 1 Jul 2014–30 Jun 2015 118,411.70 Worley Parsons Services Pty Ltd Melbourne, VIC Engineering consultants 1 Jul 2014–30 Jun 2015 118,230.68 Herbert Smith Freehills Melbourne, VIC Legal advisors 1 Jul 2014–30 Jun 2015 114,840.47 Profile Consulting (Aust) Pty Ltd Sydney, NSW Strategic advisory services 1 Jul 2014–30 Jun 2015 109,527.17 Biosis Pty Ltd Port Melbourne, VIC
South Hobart, TASEnvironmental consultant 1 Jul 2014–30 Jun 2015 108,934.08
Johnstone McGee & Gandy P/L Hobart, TAS Engineering consultants 1 Jul 2014–30 Jun 2015 108,455.00 Frontier Economics Melbourne, VIC Financial consultants 1 Jul 2014–30 Jun 2015 100,382.89 Jurutera Jasa (Sarawak) Sdn Bhd Kuching, Sarawak Engineering consultants 1 Jul 2014–30 Oct 2014 109,206.00 Parsons Brinckerhoff Newcastle upon
Tyne, UKEngineering consultants 1 Jul 2014–30 Jun 2015 108,101.64
Sheldon Harris Melbourne, VIC Strategic advisory services 1 Jul 2014–30 Jun 2015 93,889.72 Aquasia Pty Limited Sydney, NSW Strategic advisory services 12 Dec 2014–28 Feb 2015 86,428.92 Aurecon Australasia Pty Ltd Brisbane, QLD Engineering consultants 1 Jul 2014–28 Feb 2015 82,627.19 Wise Lord & Ferguson Hobart, TAS Financial consultants 1 Jul 2014–19 Feb 2015 78,580.00 Ernst & Young Melbourne, VIC Financial consultants 1 Jul 2014–30 Jun 2015 75,670.00 White Legal Pty Ltd Brisbane, QLD Legal advisors 1 Jul 2014–30 Jun 2015 65,831.29 Acurus Pty Ltd Melbourne, VIC Information technology consultants 1 Jul 2014–30 Jun 2015 62,565.44 Gruzza Associates Ltd Porirua, NZ Engineering consultants 1 Jul 2014–30 Jun 2015 61,881.88 Gondwana Heritage Solutions Oatlands, TAS Heritage consultants 5 Aug 2014–30 Jun 2015 61,355.97 Joule Logic Battery Point, TAS Environmental consultant 13 Oct 2014–29 Apr 2015 60,250.02 K & L Gates Melbourne, VIC Legal advisors 1 Jul 2014–30 Jun 2015 59,830.11 GeoPacific Consultants Port Moresby, PNG Engineering consultants 8 Feb 2015–30 Jun 2015 57,784.76 KPMG Hobart, TAS Financial consultants 10 Nov 2014–31 Mar 2015 54,600.00 Deloitte Growth Solutions Pty Ltd Hobart, TAS Financial consultants 1 Jul 2014–30 Jun 2015 53,965.00 Total 7,408,708.80Total expenditure on 233 other consultants engaged for $50 000 or less 3,017,957.60Total payments to consultants 10,426,666.40
Procurement summary
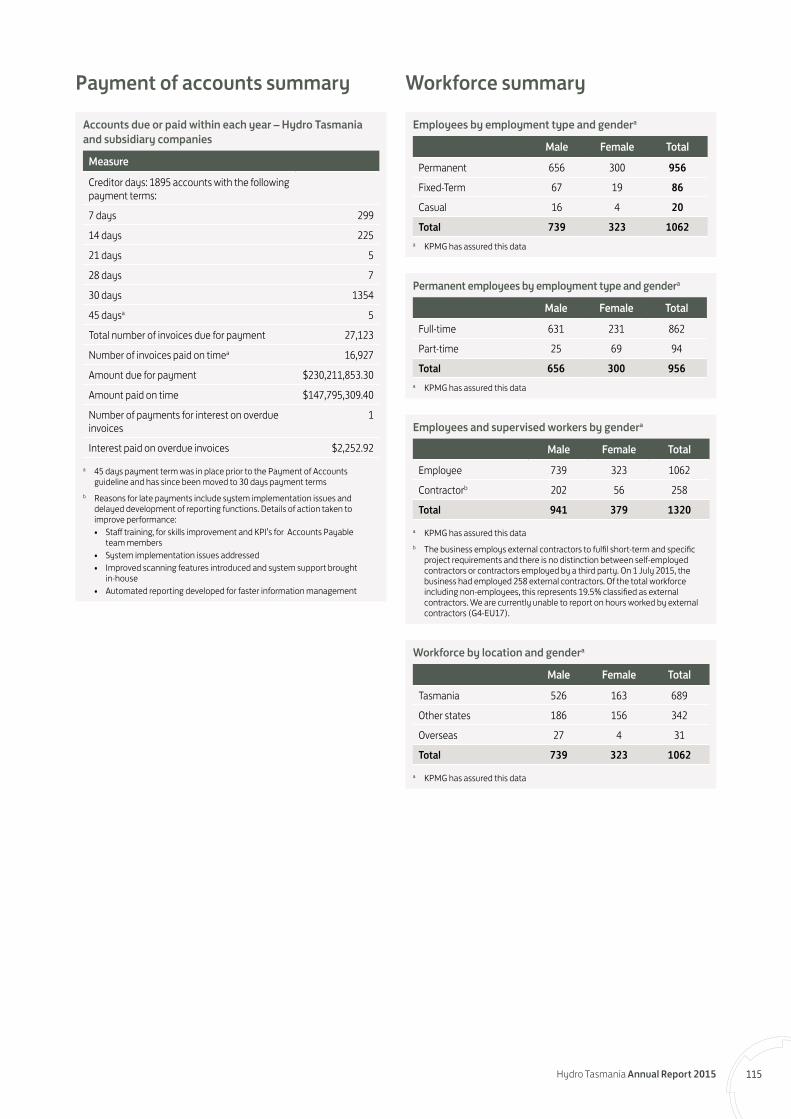
Accounts due or paid within each year – Hydro Tasmania and subsidiary companies
Measure
Creditor days: 1895 accounts with the following payment terms:
7 days 299
14 days 225
21 days 5
28 days 7
30 days 1354
45 daysa 5
Total number of invoices due for payment 27,123
Number of invoices paid on timea 16,927
Amount due for payment $230,211,853.30
Amount paid on time $147,795,309.40
Number of payments for interest on overdue invoices
1
Interest paid on overdue invoices $2,252.92
a 45 days payment term was in place prior to the Payment of Accounts guideline and has since been moved to 30 days payment terms
b Reasons for late payments include system implementation issues and delayed development of reporting functions. Details of action taken to improve performance:• Staff training, for skills improvement and KPI’s for Accounts Payable
team members• System implementation issues addressed• Improved scanning features introduced and system support brought
in-house• Automated reporting developed for faster information management
Payment of accounts summary
Workforce by location and gendera
Male Female Total
Tasmania 526 163 689
Other states 186 156 342
Overseas 27 4 31
Total 739 323 1062
a KPMG has assured this data
Employees and supervised workers by gendera
Male Female Total
Employee 739 323 1062
Contractorb 202 56 258
Total 941 379 1320
a KPMG has assured this datab The business employs external contractors to fulfil short-term and specific
project requirements and there is no distinction between self-employed contractors or contractors employed by a third party. On 1 July 2015, the business had employed 258 external contractors. Of the total workforce including non-employees, this represents 19.5% classified as external contractors. We are currently unable to report on hours worked by external contractors (G4-EU17).
Permanent employees by employment type and gendera
Male Female Total
Full-time 631 231 862
Part-time 25 69 94
Total 656 300 956a KPMG has assured this data
Employees by employment type and gendera
Male Female Total
Permanent 656 300 956
Fixed-Term 67 19 86
Casual 16 4 20
Total 739 323 1062a KPMG has assured this data
Workforce summary
115Hydro Tasmania Annual Report 2015

Percentage of employees eligible to retire in the next five or ten years by job category and region
Eligible 5 yrs 10 yrs
Board 0.1% 0.1% 0.1%
Tasmania 0.1% 0.1% 0.1%
Executive 0.4% 0.5% 0.9%
Tasmania 0.4% 0.4% 0.9%
Other states 0.1%
Overseas
Enterprise Agreement 0.6% 2.7% 2.0%
Tasmania 0.6% 2.7% 1.8%
Other states 0.2%
Individual Agreement 0.1% 0.7% 1%
Tasmania 0.1% 0.2%
Other states 0.7% 0.6%
Overseas 0.2%
Total 1.1% 4.0% 4.0%
New employee hires, terminations and employee turnover
Hire Termination
Male Female Male Female
Tasmania 45 13 106 46
Other states 47 45 51 50
Overseas 8 3 8 3
100 61 165 99
161 264
New hire turnover
23.6%
Overall turnover 25.2%
Social labour practices and decent work employment
116 Annual Report 2015 Hydro Tasmania
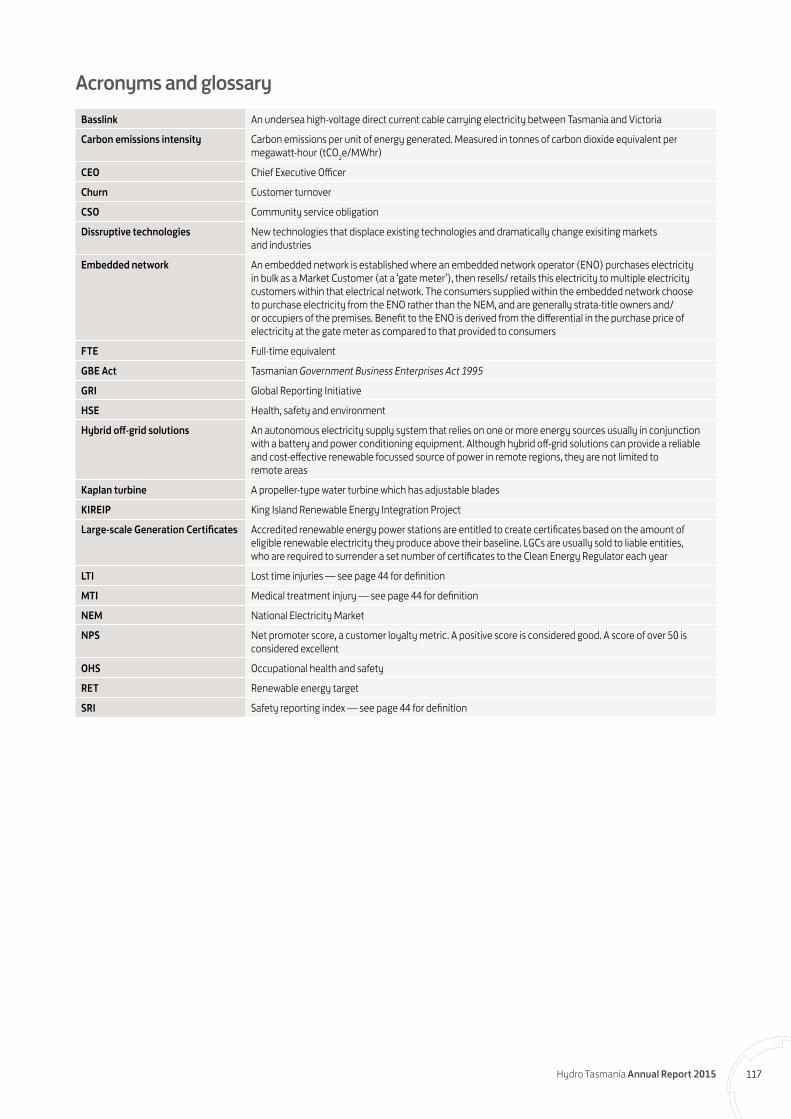
Acronyms and glossaryBasslink An undersea high-voltage direct current cable carrying electricity between Tasmania and Victoria
Carbon emissions intensity Carbon emissions per unit of energy generated. Measured in tonnes of carbon dioxide equivalent per megawatt-hour (tCO2e/MWhr)
CEO Chief Executive Officer
Churn Customer turnover
CSO Community service obligation
Dissruptive technologies New technologies that displace existing technologies and dramatically change exisiting markets and industries
Embedded network An embedded network is established where an embedded network operator (ENO) purchases electricity in bulk as a Market Customer (at a ‘gate meter’), then resells/ retails this electricity to multiple electricity customers within that electrical network. The consumers supplied within the embedded network choose to purchase electricity from the ENO rather than the NEM, and are generally strata-title owners and/or occupiers of the premises. Benefit to the ENO is derived from the differential in the purchase price of electricity at the gate meter as compared to that provided to consumers
FTE Full-time equivalent
GBE Act Tasmanian Government Business Enterprises Act 1995
GRI Global Reporting Initiative
HSE Health, safety and environment
Hybrid off-grid solutions An autonomous electricity supply system that relies on one or more energy sources usually in conjunction with a battery and power conditioning equipment. Although hybrid off-grid solutions can provide a reliable and cost-effective renewable focussed source of power in remote regions, they are not limited to remote areas
Kaplan turbine A propeller-type water turbine which has adjustable blades
KIREIP King Island Renewable Energy Integration Project
Large-scale Generation Certificates Accredited renewable energy power stations are entitled to create certificates based on the amount of eligible renewable electricity they produce above their baseline. LGCs are usually sold to liable entities, who are required to surrender a set number of certificates to the Clean Energy Regulator each year
LTI Lost time injuries — see page 44 for definition
MTI Medical treatment injury — see page 44 for definition
NEM National Electricity Market
NPS Net promoter score, a customer loyalty metric. A positive score is considered good. A score of over 50 is considered excellent
OHS Occupational health and safety
RET Renewable energy target
SRI Safety reporting index — see page 44 for definition
117Hydro Tasmania Annual Report 2015

Reflections on Lake Gordon
118 Annual Report 2015 Hydro Tasmania
Measuring water storage levelsHydro Tasmania publishes water storage data in two ways: ‘energy in storage’, and ‘lake levels’.
Lake levels are reported as metres below full and are a measure of the level of the lake relative to its full supply level.
Energy in storage is the amount of electricity that could be generated from the water stored in a lake. Storage levels are described as ‘x per cent full in energy terms’ or ‘per cent full of energy’ or ‘gigawatt-hours’. The figure is not the same as the level of water in the storage. Energy in storage can be reported for the system as a whole or for individual lakes.
The preferred operating minimum level forms part of our obligation to prudently manage our water storages, and is a seasonal energy in storage level for the system as a whole. We aim to keep above this level under median inflows.
Economic Operating Levels are seasonal lake level targets that ensure a reasonable balance between risk of spill and risk of energy shortfall.
Terms of energy measurementkW – kilowatt One kW = 1000 watts. A watt is the rate at which electrical energy is produced or used.
MW – megawatt One MW = 1000 kilowatts or one million watts.
kWh – kilowatt hour The standard unit of energy, equivalent to production or consumption at the rate of one kilowatt for one hour.
MWh – megawatt-hour One MWh = 1000 kilowatt hours.
GW – gigawatt One GW = 1000 megawatts or one million kilowatts.
GWh – gigawatt hour One GWh = 1 million kilowatt hours, or 1000 megawatt hours.
TW – terawatt One TW = 1000 gigawatts or one million megawatts.
TWh – terawatt hour One TWh = 1000 gigawatt-hours, or one million megawatt hours.
kV – kilovolt One kV = 1000 volts. A volt is the unit of potential or electrical pressure.

119Hydro Tasmania Annual Report 2015
Index
AAETV Pty Ltd 9, 18, 36, 43, 91, 96, 98,
104-106asset management 2, 15, 31assurance (KPMG) 8Aurora Energy 40, 62awards 2, 14, 41audit 109-111
B
Bass Strait islands 10, 18, 33, 37, 97, 112, 113 see also King Island see also Flinders Island Hybrid
Energy Hub see also hybrid off-grid solutions see also KIREIP Basslink 33, 61, 62, 64, 65, 68, 71, 75, 76,
80, 81Board 22-24business strategy 9, 13, 14, 17buy local 3, 15, 29, 41, 114
Ccapital expenditure 2, 15, 18, 31, 113carbon price 14, 19catchments (water) 10, 32, 35
see also Pieman Sustainability Review
centenary 2, 15, 39challenges 2, 13-15, 17, 21, 27, 43climate change policy 19community consultation 35community engagement 32, 39-41community service obligation (CSO)
18, 97compliance 29contractors 41, 44, 115cost savings 2, 14, 18, 19customer centricity 22, 27customer satisfaction 2, 27, 28customers 2, 15, 27-29
D dams 15, 31, 35, 36debt 18, 73, 81, 82Direct Action 19dividend 2, 18, 19, 20, 100, 102-104
EEl Niño 32emergency management 21emissions 19, 36employees, see peopleEmissions Reduction Fund 19enterprise agreement 44, 116Entura 2, 9, 10, 14, 15, 21, 25, 28, 29, 41,
43customers 10, 14, 28Entura clean energy and water
institute 28markets 2, 10, 28people 14, 43products and services 10, 28, 29profit 14
environment 35-37greenhouse gas emissions 36HSE management system 21rehabilitation 35, 61, 62, 75waste management 37
executives 9, 22, 24-25, 92-95
Ffinance 2, 14, 17-18, 45-111
balance sheet 48 capital expenditure 2, 15, 18, 31,
113 cash flow statement 18, 49, 66 debt 18, 67, 73, 78 dividend 14 income statement 46 returns to government 14, 18 statement of changes in equity 50 statistical summary 113
financial sustainability 17Flinders Island Hybrid Energy Hub 15,
31, 97
G gas retail 2, 10, 14, 21, 27gas power, see Tamar Valley Power Station generation (electricity) 2, 3, 14, 18, 33,
112governance 9, 21-25greenhouse gas emissions 19, 36
Hhealth, safety, environment management
system (HSE) 23Healthy Hydro program 43heritage 36hybrid off-grid solutions 2, 15, 31-32HydroChina 2, 14, 21
Iinformation management 21-22
processes 22, 27 improvements 21-22, 27 security 22
international travel 95
J joint venture 9, 10, 46, 48, 49, 59, 66, 67,
99, 102-103, 105-106
K King Island 2, 15, 31, 32, 33, 36, 37, 97,
99, 112King Island Renewable Energy Integration
Project (KIREIP) 15, 31, 97knowledge management 21-22
L Lagoon of Islands 35lake level management 32, 118lost-time injuries (LTI) 2, 15, 44
M markets 2, 10, 27, 28material issues 4, 5Momentum Energy 2, 9, 10, 14, 15, 18,
21, 22, 25, 27, 29, 41, 43, 91customers 10, 14, 27, 29markets 2, 10, 18, 27people 15, 43products and services 2, 10, 18, 27profit 14
Musselroe Wind Farm 10, 18

120 Annual Report 2015 Hydro Tasmania
NNational Electricity Market (NEM) 2, 11,
17, 21, 36, 51, 62Net Promoter Score 27, 28Neusberg 2, 15, 28, 29, 96, 98, 99
O oil management 37organisational structure 9, 22-25
P
People 15, 43-44, 115-116diversity 43employment profile 43, 115health 21, 43, 44restructure 2, 14, 43safety 2, 15, 21, 43-44workplace agreement 44, 116
Pieman Sustainability Review 35profit 14, 17, 18, 46, 47
R recreation 41redundancies 14, 43, 116remuneration 43, 44, 92-95Renewable Energy Certificate 14Renewable Energy Target 19restructure 2, 14, 43retail 21, 27, 29, 60risk management 15, 21, 22, 24, 25, 41,
80-81assets 15, 31energy trading 21, 22financial 17, 21, 80-81information security 22safety 2, 3, 15, 21, 43-44
S safety 2, 3, 15, 21, 43-44SAP 22Shenhua Clean Energy Holdings 2, 10,
21sponsorship 27, 40-41staff, see people stakeholders 4, 5, 27, 35, 40storage (water) 2, 10, 14, 32, 118suppliers 15, 41, 49sustainability 4, 121-122
assets 15, 31environmental 31, 35-37financial 17
sustainability indicators 4, 6-7, 29, 33, 37, 41, 44, 121-122
sustainability code 4sustainability principles 17, 21, 27, 31,
35, 39, 43
T Tamar Valley Power Station 31, 33, 36,
37Tasmanian Energy Strategy 13, 15, 21,
29TasWind 2, 32threatened species 2, 36travel 95
W waste management 37water 2, 10, 15, 31, 32, 33, 35, 37, 41, 118
inflows 2, 14, 18, 32management 10, 32, 33, 35, 41storage levels 2, 10, 14, 32, 118
wholesale energy 29wind farms 9, 10, 32, 99Woolnorth Wind Farm Holding 9, 10, 98workforce, see people

121Hydro Tasmania Annual Report 2015
Global Reporting Index How to use this indexThis index refers to the Global Report Initiative (GRI) indicators on which Hydro Tasmania reports. We report using the fourth edition of the GRI indicators, and have adopted an ‘in accordance’ ‘core’ level of reporting. For more information see https://www.globalreporting.org/Pages/default.aspx
In addition to the standard suite of GRI indicators we have also applied the sector supplement indicators that are most relevant. The EU code denotes an Electricity Utility specific indicator.
Our disclosures on management approaches (DMA), are typically discussed at http://www.hydro.com.au/about-us/governance/management-approaches
Format
The references to the indicators below adopt the format below, similar to Oxford note citation referencing style.
Code, Indicator, notes (if any) and reference location (e.g. EN1, Materials used by weight or volume, page 37).
General standard disclosuresG4 - 1, CEO/Chairman statement on sustainability strategy and performance, page 13
G4 - 3, Name of the organisation, page 9
G4 - 4, The primary brands, products and services, page 10
G4 - 5, The location of the organisation’s headquarters, inside back cover
G4 - 6, Number and names of countries where either the organisation has significant operations or that are relevant to sustainability topics covered in the report, page 10
G4 - 7, The nature of ownership and legal form of the organisation, page 9
G4 - 8, Report the markets served, page 10
G4 - 9, Report the scale of the organisation, pages 9, 10, 15
G4 - 10, Workforce reporting, page 115
G4 - 11, Percentage of total employees covered by collective bargaining agreements, page 44
G4 - 12, Describe the organisation’s supply chain, page 10 and web, www.hydro.com.au/about-us/supply-chain
G4 - 13, Changes during the reporting period regarding the organisation’s size, structure, ownership, or its supply chain, page 11-15 and 43
G4 - 14, Report whether and how the precautionary approach or principle is addressed by the organisation, page 21
G4 - 15, List externally developed economic, environmental and social charters, principles, or other initiatives to which the organisation subscribes or which it endorses, http://www.hydro.com.au/about-us/governance/codes-and-policies
G4 - 16, List memberships of associations (such as industry associations) and national or international advocacy organisations to which the organisation belongs, web: www.hydro.com.au/about-us/our-associations
EU1, Installed capacity, broken down by primary energy source and by regulatory regime, page 112
EU2, Net energy output broken down by primary energy source and by regulatory regime, page 112
EU3, Number of residential, industrial, institutional and commercial customer accounts, page 29
EU4, Length of above and underground transmission and distribution lines by regulatory regime, page 33
Plant decommissioningG4 - DMA, Plant decommissioning - nuclear power sites, not relevant to our operations
EU5, Allocation of co2e emissions allowances or equivalent, broken down by carbon trading framework, not relevant
G4 - 17, Entities included in the organisation’s consolidated financial statements, page 45
G4 - 18, Explain the process for defining the report content and the aspect boundaries. Explain how the organisation has implemented the reporting principles for defining report content, page 4 and web: www.hydro.com.au/about-us/sustainability
G4 - 19, List all the material aspects identified in the process for defining report content, page 5
G4 - 20, For each material aspect, report the Aspect Boundary within the organisation, page 4-5
G4 - 21, For each material aspect, report the aspect boundary outside the organisation, web: www.hydro.com.au/about-us/sustainability
G4 - 22, Report the effect of any restatements of information provided in previous reports, and the reasons for such restatements, not applicable
G4 - 23, Report significant changes from previous reporting periods in the scope and aspect boundaries, no changes
G4 - 24, Provide a list of stakeholder groups engaged by the organisation, page 40
G4 - 25, Report the basis for identification and selection of stakeholders with whom to engage, web: www.hydro.com.au/about-us/governance/management-approaches
G4 - 26, Report the organisation’s approach to stakeholder engagement, web: www.hydro.com.au/about-us/governance/management-approaches
G4 - 27, Report key topics and concerns that have been raised through stakeholder engagement, page 5 and 35
G4 - 28, Reporting period (such as fiscal or calendar year) for information provided, page 4
G4 - 29, Date of most recent previous report (if any), 2013-14
G4 - 30, Reporting cycle , annual
G4 - 31, Provide the contact point for questions regarding the report or its contents, inside back cover
G4 - 32, Report the ‘in accordance’ option the organisation has chosen, page 4
G4 - 33, Report the organisation’s policy and current practice with regard to seeking external assurance for the report, page 4
G4 - 34, Report the governance structure of the organisation, page 9
G4 - 56, Describe the organisation’s values, principles, standards and norms of behaviour such as codes of conduct and codes of ethics, web: www.hydro.com.au/about-us
EconomicG4 - DMA, How Hydro Tasmania manages its economic performance, web: www.hydro.com.au/about-us/governance/management-approaches
EC1, Direct economic value generated and distributed, pages 18, 45 and 113
EC4, Financial assistance received from government, page 18
Procurement practicesG4 - DMA, Our approach to procurement, with particular reference to local suppliers, web: www.hydro.com.au/about-us/governance/management-approaches
EC9, Proportion of spending on local suppliers at significant locations of operation, page 41
Availability and reliabilityG4 - DMA, Management approach to ensure short and long-term electricity availability and reliability, web: www.hydro.com.au/about-us/governance/management-approaches
EU10, Planned capacity against projected electricity demand over the long term, not reported – this information is proprietary due to market arrangements

122 Annual Report 2015 Hydro Tasmania
Demand-side managementG4 - DMA, Demand-side management programs including residential, commercial, institutional and industrial programs, web: www.hydro.com.au/about-us/governance/management-approaches
Research and developmentG4 - DMA, Research and development activity and expenditure aimed at providing reliable electricity and promoting sustainable development, web: www.hydro.com.au/about-us/innovation-and-research
EU11, Average generation efficiency of thermal plants by energy source and by regulatory regime, page 33
EU12, Transmission and distribution losses as a percentage of total energy, page 33
EnvironmentalG4 - DMA, Why and how we manage the resources used in our products and services, web: www.hydro.com.au/about-us/governance/management-approaches
EN1, Materials used by weight or volume, page 37
WaterG4 - DMA, Why and how we manage water as a resource, web: www.hydro.com.au/about-us/governance/management-approaches
EN8, Total water withdrawal by source, page 31
Biodiversity G4 - DMA, Why and how we manage our impacts upon biodiversity, web: www.hydro.com.au/about-us/governance/management-approaches
EN12, Description of significant impacts of activities, products, and services on biodiversity in protected areas and areas of high biodiversity value outside protected areas, page 31
EU13, Biodiversity of offset habitats compared to the biodiversity of the affected areas, not applicable
EmissionsG4 - DMA, Why and how we manage our environmental emissions, web: www.hydro.com.au/about-us/governance/management-approaches
EN15, Direct greenhouse gas emissions (scope 1), page 36
EN16, Energy indirect greenhouse gas emissions (scope 2), page 36
EN18, Greenhouse gas emissions intensity, page 36
EN 21, NOx, SOx, and other significant air emissions, page 36
Effluents and wasteG4 - DMA, Why and how we manage the effluents and waste associated with our operations, web: www.hydro.com.au/about-us/governance/management-approaches
EN22, Effluents and waste - Total water discharge by quality and destination, page 37
EN23, Total weight of waste by type and disposal method, page 37
Supplier environmental assessmentG4 - DMA, Describe the systems used to screen new suppliers using environmental criteria, web: www.hydro.com.au/about-us/governance/management-approaches
EN33, Significant actual and potential negative environmental impacts in the supply chain and actions taken, web: www.hydro.com.au/about-us/supply-chain
SocialEmploymentG4 - DMA, Describe actions taken to determine and address situations, where work undertaken within the organisation’s supply chain does not take place within appropriate institutional and legal frameworks, web: www.hydro.com.au/about-us/supply-chain
LA1, Total number and rates of new employee hires and employee turnover by age group, gender, and region, page 116
EU15, Percentage of employees eligible to retire in the next 5 and 10 years broken down by job category and by region, page 116
EU17, Days worked by contractor and subcontractor employees involved in construction, operation & maintenance activities, page 44
EU18, Percentage of contractor and subcontractor employees that have undergone relevant health and safety training, page 44
Labour/management relationsG4 - DMA, Freedom of Association and Collective Bargaining, web: www.hydro.com.au/about-us/governance/management-approaches
Occupational health and safety
G4 - DMA, How Hydro Tasmania manages occupational health and safety, web: www.hydro.com.au/about-us/governance/management-approaches
LA6, Type of injury and rates of injury, occupational diseases, lost days, and absenteeism, and total number of work related fatalities, by region and by gender, page 44
SocietyCustomer health and safetyG4 - DMA, Stakeholder participation in decision making processes related to energy planning and infrastructure development (former EU19), approach to managing the impacts of displacement (former EU20), web: www.hydro.com.au/about-us/governance/management-approaches
EU22, Number of people physically or economically displaced and compensation, broken down by type of project, page 29
Disaster /emergency planning and responseG4 - DMA, Contingency planning measures, disaster/emergency management plan and training programs, and recovery/restoration plans (former EU21), page 21 and web: www.hydro.com.au/about-us/governance/management-approaches
Product responsibilityCustomer health and safetyG4 - DMA, Why and how Hydro Tasmania manages customer health and safety, web: www.hydro.com.au/about-us/governance/management-approaches
EU25, Number of injuries and fatalities to the public involving company assets, including legal judgments, settlements and pending legal cases of diseases, page 44
Product and service labellingG4 - DMA, Why and how Hydro Tasmania manages its product and service labelling, web: www.hydro.com.au/about-us/governance/management-approaches
PR4, Total number of incidents of non-compliance with regulations and voluntary codes concerning product and service information and labelling, by type of outcomes, page 29
ComplianceG4 - DMA, Why and how Hydro Tasmania manages compliance obligations, web: www.hydro.com.au/about-us/governance/management-approaches
PR9, Monetary value of significant fines for non-compliance with laws and regulations concerning the provision and use of products and services, page 29
AccessG4 - DMA, Programs, including those in partnership with government, to improve or maintain access to electricity and customer support services (former EU23), page 18 and web: www.hydro.com.au/about-us/governance/management-approaches
EU26, Percentage of population unserved in licensed distribution or service areas, page 33
EU27, Number of residential disconnections for non-payment, broken down by duration of disconnection and by regulatory regime, page 29
EU28, Power outage frequency, page 33
EU29, Average power outage duration, page 33
EU30, Average plant availability factor by energy source and by regulatory regime, page 33
Provision of informationG4 - DMA, Practices to address language, cultural, low literacy and disability related barriers to accessing and safely using electricity and customer support services (former EU24), web: www.hydro.com.au/about-us/governance/management-approaches

Splendorgel is an FSC Mix Certified paper, which ensures that all pulp is derived from well-managed forests and controlled sources. It is elemental chlorine free and is manufactured by an ISO 14001 certified mill.
Hydro Tasmaniawww.hydro.com.au
4 Elizabeth Street Hobart Tasmania 7000 Postal Address: GPO Box 355 Hobart Tasmania 7001 Australia
Phone within Australia: 1300 360 441 Phone international: +61 3 6230 5111 Fax: +61 3 6230 5855 Email: [email protected]
Enturawww.entura.com.au
Hobart
89 Cambridge Park Drive Cambridge Tasmania 7170 Phone: +61 3 6245 4500 Fax: +61 3 6245 4550 Email: [email protected]
Brisbane
Level 1, 25 Buchanan Road Banyo Queensland 4014 Phone: +61 7 3877 9300 Fax: +61 7 3877 9301 Email: [email protected]
Melbourne
Level 25, 500 Collins Street Melbourne Victoria 3000 Phone: +61 3 8628 9700 Fax: +61 3 8628 9764 Email: [email protected]
Darwin
GPO Box 2139, Darwin Northern Territory 0801 Phone: +61 437 102 756 Email: [email protected]
New Delhi, India
Unit 3A, 3rd Floor Plot No. FC-24, Film CitySector-16A, Noida, District Gautam Budh Nagar, Uttar Pradesh-201301 India Phone: +91 120 403 3100 Fax: +91 120 403 3130 Email: [email protected]
Cape Town, South Africa
Third Floor, ExecuJet Business Centre Cape Town International Airport 7525 South Africa Phone: +27 21 934 5501/3 Email: [email protected]
Momentum Energywww.momentum.com.au
Postal Address: PO Box 353 Flinders Lane Melbourne Victoria 8009 Phone: 1300 662 778 Fax: +61 3 9620 1228 Email: [email protected]
ContactWe welcome feedback, comments and any queries regarding this report or its contents so that we can continue to improve its value to our readers. Contact us by phone on 1300 360 441 or email [email protected] or write to GPO Box 355, Hobart, Tasmania, Australia 7001
facebook.com/HydroTasmania
twitter.com/HydroTasmania
linkedin.com/company/hydro-tasmania
youtube.com/HydroTasmania