Hwy 15 P.O. Box 510 Northwood, ND 58267 Benson, MN … · Hwy 15 • P.O. Box 510 • Northwood, ND...
8
Hwy 15 • P.O. Box 510 • Northwood, ND 58267 (701) 587-6010 • Fax (701) 587-6013 Home page: agvise.com 902 13th St. N. • P.O. Box 187 • Benson, MN 56215 (320) 843-4109 • Fax (320) 843-2074 Interpreting Plant Analysis Reports K P K S Zn Fe N Zn N S W E P.O. BOX 510, NORTHWOOD, ND 58267 (701) 587-6010 FIELD ID West 80A SECTION 20 SAMPLE ID Stunted Corn QTR SE COUNTY Polk ACRES 80 TWP Marley VARIETY 2490 5 SUBMITTED FOR: MR. GROWER SUBMITTED BY: LE0002 GREEN ACRES AGRONOMY REF # 1534 LAB # 10496 DATE SAMPLED 6/9/2011 DATE RECEIVED 6/10/2011 DATE REPORTED 6/12/2011 CROP CORN GROWTH STAGE CORN 2 TO 12 IN P 2 O 5 -P NO 3 -N N P Ca Mg Na Phosphate Nitrate Nitrogen Phosphorus Potassium Sulfur Calcium Magnesium Sodium Zn Fe Mn Cu B %Cl ppm Al Zinc Iron Manganese Copper Boron Chloride 4.0 S 0.25 L 3.5 S 0.35 S 1.00 S 0.60 S 0.03 S 11 L 250 S 100 S 12 S 11 S NUTRIENT LEVEL IN CROP NUTRIENT SUFFICIENCY RANGE D.R.I.S. INDEX VALUES ppm Analysis in Percent Analysis in Parts Per Million 3.5 TO 5.0 .35 TO .80 3.0 TO 5.0 .2 TO .5 .3 TO 1.6 .21 TO .80 0 TO .1 20 TO 75 50 TO 300 50 TO 160 6 TO 20 6 TO 25 2 -37 24 4 16 29 -58 15 1 4
Transcript of Hwy 15 P.O. Box 510 Northwood, ND 58267 Benson, MN … · Hwy 15 • P.O. Box 510 • Northwood, ND...
Hwy 15 • P.O. Box 510 • Northwood, ND 58267(701) 587-6010 • Fax (701) 587-6013
Home page: agvise.com902 13th St. N. • P.O. Box 187 • Benson, MN 56215
(320) 843-4109 • Fax (320) 843-2074
Interpreting Plant Analysis Reports
K
P
K
SZn
Fe
N
Zn
NN
S
WE
P.O. BOX 510, NORTHWOOD, ND 58267(701) 587-6010FIELD ID West 80A SECTION 20SAMPLE ID Stunted Corn QTR
SECOUNTY Polk
ACRES 80TWP
MarleyVARIETY 2490
5SUBMITTED FOR:MR. GROWER
SUBMITTED BY: LE0002GREEN ACRES AGRONOMY
REF # 1534LAB # 10496
DATE SAMPLED 6/9/2011
DATE RECEIVED 6/10/2011
DATE REPORTED 6/12/2011
CROP CORN
GROWTH STAGE CORN 2 TO 12 INP2O5-P NO3-N NP
Ca Mg Na
Phosphate Nitrate Nitrogen Phosphorus Potassium Sulfur Calcium Magnesium Sodium Zn Fe Mn Cu B %Clppm Al
Zinc Iron Manganese Copper Boron Chloride
4.0
S
0.25
L
3.5
S
0.35
S
1.00
S
0.60
S
0.03
S
11
L
250
S
100
S
12
S
11
S
NUTRIENT LEVEL IN CROP
NUTRIENT SUFFICIENCY RANGE
D.R.I.S. INDEX VALUES
ppm
Analysis in Percent
Analysis in Parts Per Million
3.5TO
5.0
.35TO
.80
3.0TO
5.0
.2TO.5
.3TO
1.6
.21TO
.80
0TO.1
20TO75
50TO
300
50TO
160
6TO20
6TO252 -37 24 4 16 29
-5815 1 4

Photos on the cover courtesy of IPNI and North Dakota State University Extension Service.
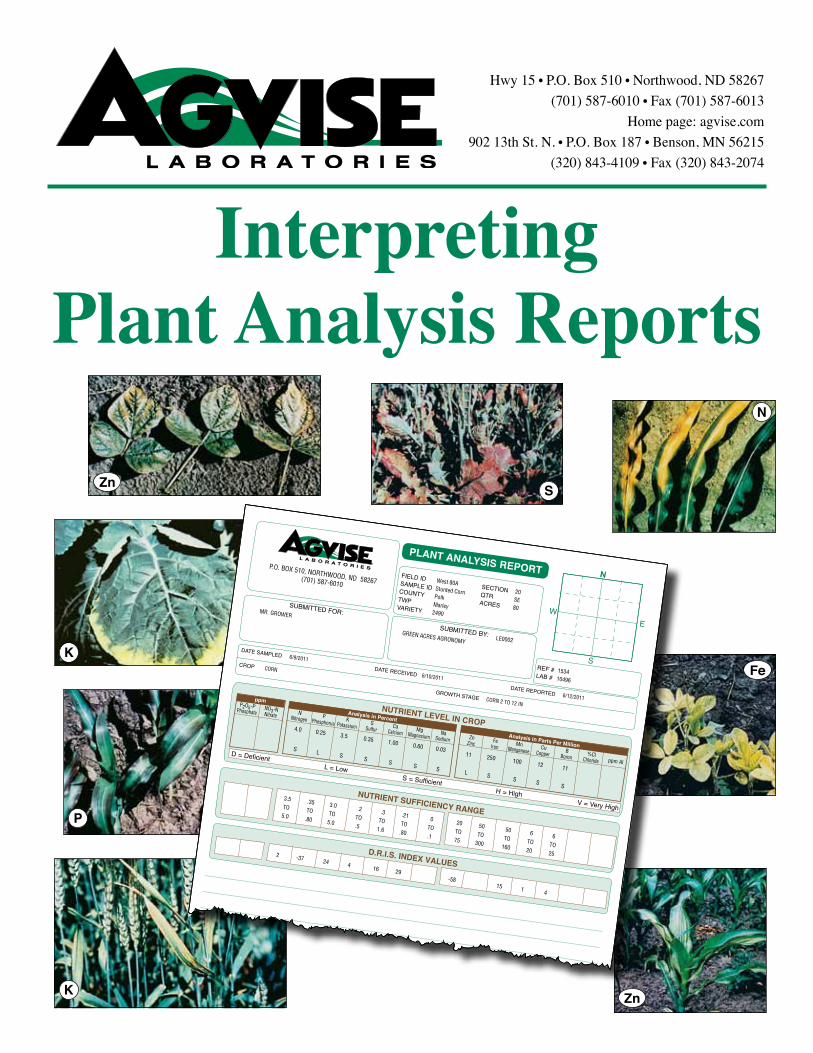
Interpreting a Plant Analysis ReportPlant nutrient analysis is a useful management tool.
While it is helpful to know the visual symptoms of nutrient deficiencies on plants, determining nutrient deficiencies visually is very difficult. In many situations, an analysis of good and bad plant samples, in addition to good and bad soil samples, will provide the answer.
To gain the most information from plant nutrient analysis, it is important to become familiar with the plant analysis report. This guide helps explain where all of the information is located on the plant analysis report. Basic information about each nutrient and some information on visual deficiency symptoms is also included in this guide. Please remember to follow accepted guidelines for collecting plant samples for nutrient analysis (see the plant sampling guide for additional information).
Information Located on the Plant Analysis Report1. Submitted for: The name of the grower for whom
the sample has been submitted. This may also be the name of the farm manager, consultant, etc. Some customers prefer to use a grower number instead of a grower name.
2. Submitted by: The name of the firm or individual who has submitted the sample to the laboratory. This is the person or business that will receive the plant analysis report and be billed for the laboratory analysis.
3. Field ID: Identifies the field or area where the plant sample was collected. The Field ID can be made up of any combination of letters or numbers (16 character limit).
4. Sample ID: Identifies each sample when there is more than one sample from each field (16 character limit).
5. County: Identifies the county where the plant sample was collected (16 character limit).
6. Township: Identifies the township where the plant sample was collected (30 character limit).
7. Section: Identifies the section of land where the plant sample was collected (2 character limit).
8. Quarter: Identifies which quarter of the section where the plant sample was collected (2 character limit).
9. Acres: Identifies the number of acres in the field where the plant sample was collected (3 character limit).
10. Variety: Identifies which variety the plant sample is from. This information is helpful when putting together a fertility management plan.
11. Reference Number: The reference number is used to track plant sample during laboratory analysis.
12. Laboratory Number: A distinct laboratory number is assigned to each plant sample being tested. This number is used in quality control in the laboratory.
13. Date Sampled: Indicates the day the sample was collected.
14. Date Received: Indicates the day the sample was received at the laboratory.
15. Date Reported: Indicates the day the sample analysis results were printed.
16. Crop: Indicates which crop the plant sample represents.
17. Growth Stage: Indicates the growth stage of the crop when the plant sample was collected. Stage of growth is critical for interpreting the nutrient analysis properly.
Plant Nutrient Information18a. Total Nitrogen (total N): Nitrogen is a critical part
of proteins in the plant. It is also an important part of chlorophyll and plays a key role in photosynthesis. Nitrogen deficient plants usually have a pale green or yellow color. In grasses, the yellowing usually starts at the leaf tip and goes down the middle of the leaf. Because nitrogen is mobile in the plant, the older leaves will show the symptoms first. The total N content of a plant includes all forms of nitrogen in the plant tissue. The total N content represents the nitrogen status of a crop up to that point in the growing season, but does not predict the nitrogen status of the crop in the future.
19. Total Phosphorus: Phosphorus is important for root growth, seed production and crop maturity along with many other functions. Symptoms of plants deficient in phosphorus include stunted growth, delayed maturity and reduced see production. In young plants, phosphorus deficiency may appear as purple coloring of the older leaves. Phosphorus is mobile in the plant, so deficiency symptoms appear first on the older leaves. The total phosphorus content of a plant includes all forms of phosphorus in the plant tissue.
2

3
20. Potassium: Potassium is involved in many physiological processes including protein synthesis and maintaining the water balance in the plant. Potassium deficiency symptoms include reduced growth and yellowing or burning of the leaf edges. Other symptoms include reduced straw or stalk strength, reduced disease resistance and reduced winter hardiness of perennial crops. Since potassium is mobile in the plant, the symptoms appear on the older leaves first. Sandy soils are more likely to be deficient in potassium.
21. Sulfur: Sulfur is a component of plant proteins. Symptoms of sulfur deficiency can look similar to a mild nitrogen deficiency. The only difference is a sulfur deficiency appears sooner on the newer growth because sulfur is not very mobile in the plant. Sulfur deficiencies are more common on sandy soils with low organic matter. In high rainfall years, sulfur deficiencies can occur on most soil types due to leaching of sulfur. Sulfur deficiency is more common in crops such as canola and alfalfa due to higher sulfur requirements.
NN
S
W EP.O. BOX 510, NORTHWOOD, ND 58267(701) 587-6010
FIELD ID West 80A SECTION 20SAMPLE ID Stunted Corn QTR SECOUNTY Polk ACRES 80TWP MarleyVARIETY 2490
34
56
10
78
9
SUBMITTED FOR:MR. GROWER
SUBMITTED BY: LE0002GREEN ACRES AGRONOMY
REF # 1534LAB # 10496
1 2
11
12
DATE SAMPLED 6/9/2011 DATE RECEIVED 6/10/2011 DATE REPORTED 6/12/2011
CROP CORN GROWTH STAGE CORN 2 TO 12 IN
151413
16 17
P2O5-P NO3-N N P Ca Mg NaPhosphate Nitrate Nitrogen Phosphorus Potassium Sulfur Calcium Magnesium Sodium
Zn Fe Mn Cu B %Clppm AlZinc Iron Manganese Copper Boron Chloride
4.0
S
0.25
L
3.5
S
0.35
S
1.00
S
0.60
S
0.03
S
11
L
250
S
100
S
12
S
11
S18 19 20 21 22 23 24 25 26 27 28 29 30 31
NUTRIENT LEVEL IN CROP
NUTRIENT SUFFICIENCY RANGE
D.R.I.S. INDEX VALUES
ppm Analysis in Percent Analysis in Parts Per Million
3.5TO5.0
.35TO.80
3.0TO5.0
.2TO.5
.3TO1.6
.21TO.80
0TO.1
20TO75
50TO300
50TO160
6TO20
6TO25
2 -37 24 4 16 29 -58 15 1 4
32
33

22. Calcium: Calcium is an important part of cell walls. Calcium deficiency in field crops is rare in the Midwest. When a soil is limed to an acceptable pH (6.0), calcium is usually adequate. Agricultural lime is composed of calcium and magnesium carbonates (CaCO3 & MgCO3). The Ag lime applied has enough calcium supplied by the calcium carbonate (CaCO3) for good plant growth. Areas where calcium deficiencies may occur are sandy irrigated soils with a low soil pH (<6.0). Symptoms of calcium deficiency include black scorched leaf tips and die-back of growing points because calcium is not mobile in the plant. Boron can cause the same symptoms, but calcium deficiency does not promote lateral shoot development like boron deficiency does.
24. Magnesium: Magnesium is a key component of chlorophyll and is essential for photosynthesis. Magnesium deficiencies are rare in the Midwest. When a soil is limed to be acceptable pH (>6.0) magnesium is usually adequate. Agricultural lime is composed of calcium and magnesium carbonates (CaCO3 & MgCO3). When magnesium deficiencies occur, they are usually associated with irrigated sandy soils with a low soil pH (<6.0). Symptoms of magnesium deficiency include mottling of older leaves which proceeds to the younger leaves. The interveinal chlorosis starts in the middle of the leaf, with the margins becoming chlorotic last. In some crops the chlorotic areas of the leaf die and the leaf margins become scorched.
24. Sodium: High levels of sodium are toxic to plant growth. Healthy plant tissue contains very little sodium (except sugarbeets). Symptoms of sodium toxicity include severe stunting and stand loss. A high level of sodium in plant tissue is caused by excessive sodium levels in the soil.
25. Zinc: Zinc is essential in the production of many plant enzymes. It is also important in balancing hormone levels in the plant. Zinc is moderately mobile in the plant. In some plants the interveinal mottling appears first on the older leaves and in others it appears on the new leaves first. The interveinal chlorosis may be the same as iron and manganese except that zinc deficient plants usually develop exceptionally small leaves. Zinc deficiencies are common on sandy low organic matter soils. Crops which are sensitive to zinc include edible beans, corn, flax and potatoes.
26. Iron: Iron is a component of many enzymes in the plant and is essential for photosynthesis. Iron deficiency starts with interveinal chlorosis of the newer leaves and in severe cases all leaves show symptoms. Soybeans are susceptible to iron chlorosis
with some varieties being more sensitive than others. Iron deficiencies are common on soils that have high pH (>7.5), high soluble salts (>0.7 mmhos/cm) and high carbonate content (>1.0%). Plant analysis is not a very useful tool for confirming iron deficiency in field crops. The dust that normally occurs on plant tissue contains enough iron to contaminate plant samples. Visual symptoms are used to confirm iron deficiency.
27. Manganese: Manganese is essential for many reactions in the plant and is essential for chloroplast production. Manganese deficiency symptoms include interveinal chlorosis on the newer leaves. These symptoms are difficult to distinguish from symptoms of iron deficiency.
28. Copper: Copper is essential in forming enzyemes involved in photosynthesis. In wheat, copper deficiency symptoms include a twisting or whitening of the leaf tip. In later stages of growth, a melanosis or browning of the upper stem and head may occur. Copper deficiencies are common on peat soils (>15% organic matter). Mineral soils which are course textured and low in organic matter (<3.0%) may also have copper deficiencies. A history of manure application increases the chance of copper deficiency. Crops most sensitive to copper deficiency include spring wheat, barley and winter wheat.
29. Boron: Boron is important in cell division and is essential for the production of amino acids. Boron deficiency symptoms include browning or blackening of new leaf tips and die-back of growing points similar to calcium deficiency. Growth of lateral shoots can occur on boron deficient plants. Soils likely to be boron deficient are sandy and low in organic matter (<3.0%). Crops most sensitive to boron deficiency include alfalfa and clover.
30. Chloride: Chloride is involved in balancing ion charges within the plant, regulating turgor pressure and reducing susceptibility to some diseases. Chloride is also involved in photosynthesis. A minor chloride deficiency will show few if any symptoms. When chloride deficiency becomes severe, small necrotic areas will appear on the upper leaves of crops such as wheat. Crops most sensitive to chloride include spring wheat, barley and winter wheat.
31. Aluminum: High levels of aluminum are toxic to plant growth. Plants which experience aluminum toxicity will have limited root growth reducing uptake of phosphorus and several other nutrients. Applying lime to bring soil pH to 6.0 or higher will eliminate aluminium toxicity. Aluminum is only tested by special request on plant tissue.
4

Nutrient Sufficiency Range Interpretation32. The sufficiency range for each nutrient has been
determined primarily by university research. The sufficiency range for each nutrient is based on a particular stage of growth and a specific plant part of each crop. Example: A plant sample of wheat at the tillering stage (whole plant – no roots) has a sufficiency range of 3.8% to 5.0% for total nitrogen. If the total nitrogen level is below 3.8%, the wheat crop is “deficient” in nitrogen. If the nitrogen content is between 3.8% and 5.0%, the nitrogen status of the crop is “sufficient.” If the nitrogen content is >5.0%, luxury uptake of nitrogen is occurring.
As plants go from the vegetative growth stage to the reproductive growth stage, the concentration of most nutrients decrease. Example: The sufficiency level for nitrate nitrogen for potato petioles early in the season ranges from 15,000 ppm to 25,000 ppm. Later in the season when potato tubers are bulking, the sufficient range for petiole nitrates is 8,000 ppm to 12,000 ppm (see figure below).
Advantages of Sufficiency Range System when Interpreting Plant Analysis1. Sufficiency ranges for each nutrient at various growth stages are available for most crops in the world.
2. Contamination of the plant sample with one nutrient does not affect the interpretation of the level of the other nutrients.
Disadvantages of the Sufficiency Range System when Interpreting Plant Analysis1. Sufficiency ranges are unable to rank which nutrient is most limiting. If more than one nutrient is found to be deficient, it is difficult to know which nutrient is the most limiting.
2. Sufficiency ranges are available only for specific stages of growth. If the growth stage of a crop is in between those established, interpretation is more difficult.
DRIS Indexes for Interpreting Plant Analysis33. The Diagnosis Recommendation Integrated System
(DRIS) interpretation of plant nutrient analysis was developed through university research. This system for interpreting the nutrient status of plants is based on comparing the ratio of each nutrient in the plant to all other nutrients. Those ratios are then compared to the ratios for high yielding plants. For example, the nitrogen level is compared to the level of phosphorus, potassium, zinc, etc. University research has shown that the ratio of one nutrient to another does not change appreciable through the season. In the tables below you can see that even though the level of nutrients in field corn declines as the plants age (table 1), the ratio of one nutrient to the other changes very little (table 2).
Nutrient Sufficiency Range
Increasing Nutrient Concentration in Plant Tissue
Incr
easi
ng G
row
th o
r Yie
ld Deficient Sufficient ToxicLuxuryUptake
Sufficiency Range Changes with Plant Age
30,000
25,000
20,000
15,000
10,000
5,000
0
Pet
iole
Nitr
ate
Leve
l - p
pm
Petiole Nitrate Levels in Longseasonirrigated potatoes
Excessive
Sufficient
Potential Yield Loss
Expected Yield Loss
Vegetative Tubers<3/4˝ Tubers 3/4˝ - 2˝ Tubers >2˝
5
Expected Nutrient Level DeclinesField Corn
Plant Age TotalNitrogen
TotalPhosphorus
TotalPotassium
30 days60 days80 days110 days
4.6%3.9%3.4%3.0%
.30%
.26%
.24%
.20%
3.4%2.4%1.9%1.8%
Table 1

DRIS indexes are shown as negative or positive numbers. A DRIS index for phosphorus with a value of -25 indicates that phosphorus is deficient. Any DRIS index with a value less than -15 indicates a deficiency. DRIS index values in the range of -15 to +15 are considered adequate. A DRIS index >15 indicates luxury consumption of that nutrient (see figure below).
Advantages of DRIS Index Interpretation
1. DRIS indexes help show which nutrient is most limiting (see table below). The nutrient with the largest negative number is the most limiting.
2. Crop growth stage is less important because the ratio of one nutrient to another through the season is fairly stable (see table 2).
Disadvantages of the DRIS Index System for Interpretation of Plant
Analysis1. DRIS indexes are not yet established for many crops.
Using the Sufficiency Range System and the DRIS System Together
While the Sufficiency Range System and the DRIS System each have their strengths and weaknesses, used together they provide more information. In a situation where a nutrient is rated as low in the sufficiency system and the DRIS index is very negative (-30), you can be very confident that the nutrient in question is deficient in the plant. In a situation where the sufficiency range system indicates a nutrient is adequate and the DRIS index shows the nutrient is deficient, you may need to get additional information from a soil test.
Nutrient Mobility Within the PlantNutrients which can move from one part of the plant
to another part of the plant are called mobile. Nitrogen, phosphorus, potassium, magnesium and chloride are all mobile within the plant (see table). If a deficiency of any of these nutrients occurs, the symptoms will be seen first on the older leaves. Sulfur is one nutrient that is somewhat mobile in the plant, depending on the severity of the deficiency. The initial symptoms will be on new leaves and then the whole plant may become chlorotic. Several secondary and micronutrients are immobile within the plant. This means the deficiency symptoms will be observed on new growth first. Calcium and boron are immobile in the plant under all situations. The deficiency symptoms of these two nutrients are always observed on the new growth.
DRIS Index Interpretation
-30 -15 +15 +300
DEFICIENCY LUXURYCONSUMPTIONADEQUATE
DRIS InterpretationIdentifying the Most limiting nutrient
NitrogenPhosphorusPotassiumCalciumMagnesiumTotal of Indexes
-36-251024270
-10-251525-50
75
-83
-70
Nutrient Example 1DRIS Index
Example 2DRIS Index
Example 3DRIS Index
6
Nitrogen (N) Mobile Older leavesPhosphorus (P) Mobile Older leavesPotassium (K) Mobile Older leavesSulfur (S) Somewhat Mobile New leaves then whole plant
Calcium (Ca) Immobile New leaves
Magnesium (Mg) Mobile Older leavesZinc (Zn) Immobile New leavesIron (Fe) Immobile New leavesManganese (Mn) Immobile New leavesCopper (Cu) Immobile New leavesBoron (B) Immobile New leavesChloride Mobile Older leaves
Nutrient Mobility in the plant Initial symptoms
Nutrient Mobility in the Plant
Plant Age vs Nutrient Ratios in PlantsField Corn
Plant Age30 days60 days80 days80 days110 days
N/P15151415
N/K1.41.61.81.7
P/K11989
Table 2

AGVISE Laboratories has been providing petiole and soil analysis to irrigated potato growers for over 35 years. Most growers collect a potato petiole sample every 7-10 days and do a complete nutrient analysis. In addition, soil samples are collected periodically through the growing season and tested for ammonium and nitrate nitrogen. Having timely petiole and soil nutrient analysis has proven to be valuable information to help with nutrient management during the growing season.
7

Petiole and Soil Reporting format: All test results for petiole samples are viewed and printed from the AGVISE web site (www.agvise.com). No printed re-ports will be sent. By using the petiole sample informa-tion sheets, which have pre-assigned reference number stickers to place on the sample bags, test results can be graphed for each field through the growing season. It is critical to have an emergence date for each potato field, so the tissue test results can be interpreted based on the correct stage of growth. If an emergence date is not provided, we will estimate an emergence date as 30 days before the first petiole sample arrives at the lab. The interpretation for the petiole nutrient levels is currently based on university research on long season processing potatoes.
Nutrient Interpretation: On the example report, seven petiole samples and five soil samples were collected during the growing season. All nutrient data is report-ed in table form for tissue and soil. The color of the numbers in the table, indicate if a nutrient test level is sufficient or not. RED indicates a nutrient level is lower than the established sufficiency range, BLACK indicates the nutrient level is sufficient and GREEN indicates the level is above the sufficiency range.
Nitrogen: Petiole nitrate levels are reported in the table with color coded numbers, as well as a graph of each sample through the season. The sufficiency ranges are represented by color lines on the graph. On the graph, the area between the green and red lines is considered sufficient. The soil nitrate and ammonium values are reported in a table and in a graph as well. It is impor-tant to test for ammonium nitrogen as well as nitrate in the soil. Soil samples should be collected from the hill (0-18") while avoiding fertilizer bands. It can take several days for urea or ammonium based fertilizer to totally convert to the nitrate form. It is very helpful to know the soil nitrogen status during the growing sea-son. There are times when excessive rainfall may leach nitrogen from the soil. A current soil test will show you the nitrogen status of the profile at that time. There are also times when explosive vegetative growth will re-sult in unusually low petiole nitrate values for short time, even though the soil nitrogen values are shown to be high and no additional fertilizer is needed. Having both petiole and soil nitrogen values is very helpful.
Phosphorus and Potassium: These nutrient levels are shown in the table as well as color coded graphs. The interpretation for the P & K levels is based on univer-sity research on long season processing potatoes.
Secondary and Micronutrients: These nutrient levels are shown in the table at the top of the report in color coded numbers. A second table on the right side of the report shows these nutrient values for the last three sampling dates along with the sufficiency range for each nutrient. Some fungicides contain micronutrients (i.e. Mn and Zn). The nutrients from these fungicides will increase the test results for these nutrients, even though the nutrient is most likely on the plant surface.
Representative Samples are Critical! Plant and soil nutrient analysis is only as good as the sample col-lected. Always collect the petiole and soil samples in the same area of the field every time. Be sure to col-lect representative samples and handle them properly to ensure reliable test results. If you have any questions on how to collect tissue and soil samples or interpret the test results, please give our technical support staff a call.
8