HVS Test Results on Fast-Setting Hydraulic Cement … South Tangent.pdfHVS Test Results on...
219
DRAFT HVS Test Results on Fast-Setting Hydraulic Cement Concrete Palmdale, California Test Sections, South Tangent Report prepared for the California Department of Transportation by: Louw du Plessis CSIR Transportek David Bush Dynatest, Inc. Fritz Jooste, CSIR Transportek Dave Hung University of California Pavement Research Center Clark Scheffy University of California Pavement Research Center Jeffery Roesler University of Illinois Urbana-Champaign Lorina Popescu University of California Pavement Research Center John Harvey University of California Pavement Research Center University of California Institute of Transportation Studies Pavement Research Center July 2002
Transcript of HVS Test Results on Fast-Setting Hydraulic Cement … South Tangent.pdfHVS Test Results on...
DRAFT
HVS Test Results on Fast-Setting Hydraulic Cement Concrete
Palmdale, California Test Sections, South Tangent
Report prepared for the California Department of Transportation
by:
Louw du PlessisCSIR Transportek
David BushDynatest, Inc.
Fritz Jooste,CSIR Transportek
Dave HungUniversity of California
Pavement Research Center
Clark ScheffyUniversity of California
Pavement Research Center
Jeffery RoeslerUniversity of IllinoisUrbana-Champaign
Lorina PopescuUniversity of California
Pavement Research Center
John HarveyUniversity of California
Pavement Research Center
University of CaliforniaInstitute of Transportation Studies
Pavement Research Center
July 2002

ii

iii
TABLE OF CONTENTS
Table of Contents........................................................................................................................... iii
List of Figures ................................................................................................................................ ix
List of Photographs ......................................................................................................................xiii
List of Tables .............................................................................................................................. xvii
1.0 Introduction......................................................................................................................... 1
2.0 HVS Test Objectives and Scope of Work........................................................................... 3
3.0 HVS Test Program.............................................................................................................. 5
3.1 HVS Data Collection Schedule........................................................................................... 5
3.2 HVS Instrumentation Plan .................................................................................................. 8
3.3 HVS Loading Plan ............................................................................................................ 11
4.0 HVS Results...................................................................................................................... 15
4.1 Test Section 519FD........................................................................................................... 15
4.1.1 Visual Observations, Section 519FD........................................................................ 16
4.1.2 JDMD and EDMD Data, Test Section 519FD.......................................................... 21
4.1.3 Load Transfer Efficiency, Test Section 519FD ........................................................ 24
4.1.4 CAM Data, Test Section 519FD............................................................................... 25
4.2 Test Section 520FD........................................................................................................... 27
4.2.1 Visual Observations, Test Section 520FD ................................................................ 27
4.2.2 JDMD and EDMD Data, Test Section 520FD.......................................................... 32
4.2.3 Load Transfer Efficiency, Test Section 520FD ........................................................ 34
4.2.4 Strain Gauge Data, Test Section 520FD ................................................................... 35
4.3 Test Section 521FD........................................................................................................... 40

iv
4.3.1 Visual Observations, Test Section 521FD ................................................................ 41
4.3.2 JDMD and EDMD Data, Test Section 521FD.......................................................... 42
4.3.3 MDD Elastic Deflection Data, Test Section 521FD................................................. 49
4.3.4 MDD Permanent Deformation Data, Test Section 521FD ....................................... 51
4.3.5 CAM Measurements, Test Section 521FD ............................................................... 53
4.4 Test Section 522FD........................................................................................................... 54
4.5 Test Section 523FD........................................................................................................... 59
4.5.1 Visual Observations, Test Section 523FD ................................................................ 59
4.5.2 JDMD and EDMD Data, Test Section 523FD.......................................................... 63
4.5.3 CAM Data, Test Section 523FD............................................................................... 70
4.6 Test Section 524FD........................................................................................................... 71
4.6.1 Visual observations and JDMD and EDMD results, Test Section 524FD ............... 71
4.6.2 JDMD and EDMD Data, Test Section 524FD.......................................................... 71
4.6.3 Load Transfer Efficiency, Test Section 524FD ........................................................ 79
4.6.4 Strain Gauge Data, Test Section 524FD ................................................................... 80
4.7 Test Section 525FD........................................................................................................... 86
4.7.1 Visual Observations, Test Section 525FD ................................................................ 86
4.7.2 JDMD and EDMD Data, Test Section 525FD.......................................................... 89
4.7.3 Load Transfer Efficiency, Test Section 525FD ........................................................ 93
4.8 Test Section 526FD........................................................................................................... 93
4.8.1 Visual Observations, Test Section 526FD ................................................................ 94
4.8.2 JDMD and EDMD Data, Test Section 526FD.......................................................... 94
4.9 Test Section 527FD........................................................................................................... 99

v
4.9.1 Visual Observations, Test Section 527FD .............................................................. 101
4.9.2 JDMD and EDMD Data, Test Section 527FD........................................................ 101
4.10 Test Section 528FD..................................................................................................... 110
4.10.1 Visual Observations, Test Section 528FD .............................................................. 110
4.10.2 JDMD and EDMD Data, Test Section 528FD........................................................ 111
4.10.3 Load Transfer Efficiency, Test Section 528FD ...................................................... 115
4.10.4 Strain Gauge Data, Test Section 528FD ................................................................. 116
4.11 Test Section 529FD..................................................................................................... 117
4.11.1 Visual Observations, Test Section 529FD .............................................................. 117
4.11.2 JDMD and EDMD Data, Test Section 529FD........................................................ 118
4.11.3 Load Transfer Efficiency, Test Section 529FD ...................................................... 118
4.12 Test Section 530FD..................................................................................................... 124
4.12.1 Visual Observations, Test Section 530FD .............................................................. 125
4.12.2 JDMD and EDMD Data, Test Section 530FD........................................................ 125
4.12.3 Load Transfer Efficiency, Test Section 530FD ...................................................... 131
4.12.4 MDD Elastic Deflection Data, Test Section 530FD............................................... 132
4.12.5 MDD Permanent Deformation Data, Test Section 530FD ..................................... 134
4.13 Test Section 531FD..................................................................................................... 134
4.13.1 Visual Observations, Test Section 531FD .............................................................. 138
4.13.2 JDMD and EDMD Data, Test Section 531FD........................................................ 138
4.13.3 Load Transfer Efficiency, Test Section 531FD ...................................................... 143
5.0 Test Pits........................................................................................................................... 145
5.1 Test Pit Results ............................................................................................................... 145

vi
5.1.1 Crack Patterns ......................................................................................................... 146
6.0 FWD Results................................................................................................................... 149
6.1 Effect of Curing on Backcalculated Stiffness ................................................................. 150
6.2 Effect of Curing on Load Transfer Efficiency ................................................................ 150
6.3 HVS Sections on 200-mm Thick Slabs: Effect of Curing on Centerline Deflections .... 155
6.4 Load Transfer Efficiency Recorded After HVS Testing................................................. 155
6.5 Deflection Data Recorded after HVS testing.................................................................. 155
7.0 Concrete Core Measurements ......................................................................................... 171
7.1 40-Day Core Properties................................................................................................... 171
7.1.1 Slab Thicknesses..................................................................................................... 171
7.1.2 Core Densities......................................................................................................... 173
7.1.3 Compressive Strength ............................................................................................. 173
7.2 Observations from Cores Taken after HVS Testing ....................................................... 174
7.2.1 Core Lengths ........................................................................................................... 174
7.2.2 Core Densities......................................................................................................... 175
7.2.3 Compression Strength of Cores .............................................................................. 175
7.2.4 Instrument Position ................................................................................................. 178
7.3 Observations and Comment on Day/Night Cores........................................................... 178
7.3.1 Saw cut depth and width ......................................................................................... 178
7.3.2 Day/night measurements of saw cut openings and cracks at the bottom of the cores
.................................................................................................................................180
8.0 Temperature Data............................................................................................................ 181
9.0 References....................................................................................................................... 183

vii
Appendix A: FWD Deflections .................................................................................................. 185
Documentation of Raw and Processed Data Files .................................................................. 185
Deflections versus Curing Age for HVS Sections .................................................................. 187
Deflections versus Curing Age for all 200 mm thick slabs .................................................... 187
FWD Deflections (Raw Data)................................................................................................. 187
Appendix B: Thermocouple Data ............................................................................................... 193

viii

ix
LIST OF FIGURES
Figure 3.1. Illustration of the placement of JDMDs and EDMD................................................... 9
Figure 3.2. Illustration of the placement of the strain gauges with respect to the concrete slab.. 10
Figure 3.3. Illustration of the output of the strain gauges under the
influence of an applied load. ................................................................................................. 11
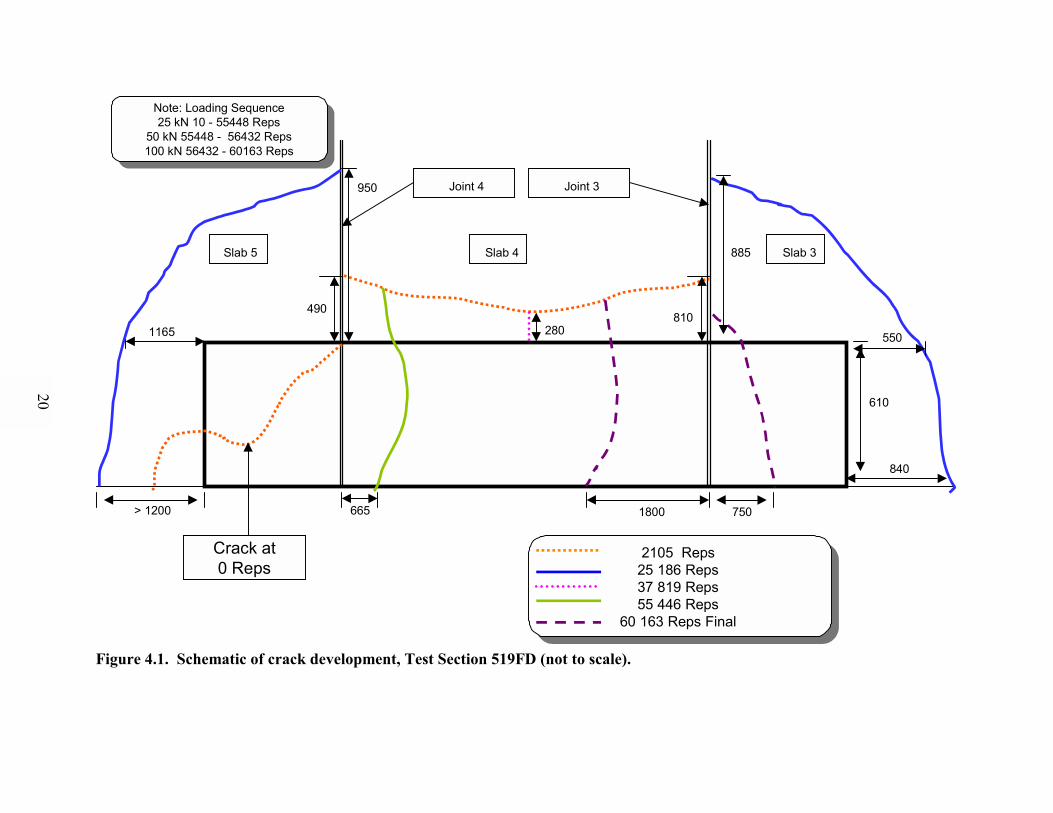
Figure 4.1. Schematic of crack development, Test Section 519FD (not to scale). ...................... 20
Figure 4.2. EDMD and JDMD deflections, test load = 25 kN, Test Section 519FD................... 23
Figure 4.3. CAM response, Test Section 519FD. ........................................................................ 26
Figure 4.4. Schematic of crack development, Test Section 520FD (not to scale). ...................... 29
Figure 4.5. JDMD and EDMD deflections, test load = 35 kN, Test Section 520FD................... 34
Figure 4.6. Schematic of crack development, Test Section 521 (not to scale). ........................... 44
Figure 4.7. JDMD and EDMD deflections, test load = 20 kN, Test Section 521FD................... 48
Figure 4.8. MDD deflections, test load = 20 kN, Test Section 521FD........................................ 50
Figure 4.9. MDD permanent deformation, Test Section 521FD.................................................. 52
Figure 4.10. Schematic of crack development, Test Section 522FD (not to scale). .................... 55
Figure 4.11. Elastic deflections at slab edge, Test Section 522FD. ............................................. 58
Figure 4.12. Schematic of crack development, Test Section 523FD (not to scale). .................... 61
Figure 4.13. JDMD deflections, Test Section 523FD.................................................................. 66
Figure 4.14. JDMD permanent deformation, Test Section 523FD.............................................. 68
Figure 4.15. Schematic of crack development, Test Section 524FD (not to scale). .................... 73
Figure 4.16. EDMD and JDMD elastic deflections, test load = 45 kN, Test Section 524FD. .... 78
Figure 4.17. EDMD and JDMD permanent deformation, Test Section 524FD. ......................... 78
Figure 4.18. Dynamic strain response at edge midpoint, slab 20, Test Section 524FD............... 83

x
Figure 4.19. Static strain response, slab 20, Test Section 524FD................................................ 85
Figure 4.20. Static strain response near joint 19, Test Section 524FD. ....................................... 85
Figure 4.21. Schematic of crack development, Test Section 525FD (not to scale). .................... 88
Figure 4.22. JDMD and EDMD deflections, Test Section 525FD. ............................................. 92
Figure 4.23. JDMD and EDMD permanent deformation, Test Section 525FD. ......................... 92
Figure 4.24. Schematic of crack development, Test Section 526FD (not to scale). .................... 97
Figure 4.25. EDMD and JDMD deflections, Test Section 526FD. ............................................. 98
Figure 4.26. Permanent deformation, Test Section 526FD........................................................ 100
Figure 4.27. Schematic of crack development, Test Section 527FD (not to scale). .................. 104
Figure 4.28. EDMD and JDMD deflections, test load = 35 and 40 kN, Test Section 527FD... 105
Figure 4.29. EDMD and JDMD permanent deformation, Test Section 527FD. ....................... 108
Figure 4.30. Schematic of crack development, Test Section 528FD (not to scale). .................. 113
Figure 4.31. EDMD and JDMD deflections, test load = 40 kN, Test Section 528FD............... 115
Figure 4.32. Schematic of crack development, Test Section 529FD (not to scale). .................. 119
Figure 4.33. Elastic surface deflections, test load = 40 kN, Test Section 529FD...................... 123
Figure 4.34. Elastic surface deflections, test load = 60 kN, Test Section 529FD...................... 123
Figure 4.35. Schematic of crack development, Test Section 530FD (not to scale). .................. 126
Figure 4.36. Elastic surface deflections, test load = 40 kN, Test Section 530FD...................... 130
Figure 4.37. Elastic surface deflections, test load = 60 kN, Test Section 530FD...................... 130
Figure 4.38. Elastic surface deflections, test load = 90 kN, Test Section 530FD...................... 131
Figure 4.39. In-depth MDD deflections, Test Section 530FD................................................... 137
Figure 4.40. Permanent deformation, Test Section 530FD........................................................ 137
Figure 4.41. Schematic of crack development, Test Section 531FD (not to scale). .................. 139

xi
Figure 4.42. Elastic surface deflections, test load = 40 kN, Test Section 531FD...................... 142
Figure 4.43. Elastic surface deflections, test load = 70 kN, Test Section 531FD...................... 142
Figure 6.1. Timeline showing time of FWD testing and start and duration of HVS testing on
200-mm thick slabs. ............................................................................................................ 149
Figure 6.2. Curing age versus stiffness of the concrete and subgrade for different slabs (based on
deflections measured at slab center). .................................................................................. 153
Figure 6.2 (Continued). Curing age versus stiffness of the concrete and subgrade for different
slabs (based on deflections measured at slab center). ......................................................... 154
Figure 6.3. Load transfer efficiency versus curing age .............................................................. 158
Figure 6.3. Load transfer efficiency versus curing age (continued)........................................... 159
Figure 6.3. Load transfer efficiency versus curing age. ............................................................. 160
Figure 6.4. HWD deflections versus curing time, Test Section 528FD..................................... 161
Figure 6.5. HWD deflections versus curing time, Test Section 530FD..................................... 162
Figure 6.6. HWD deflections versus curing time, Test Section 531FD..................................... 163
Figure 6.7. Positions at which load transfer efficiency was determined.................................... 164
Figure 7.1. Density versus compressive strength, cores taken after HVS testing...................... 177

xii

xiii
LIST OF PHOTOGRAPHS
Photograph 4.1. Corner crack prior to start of test, Test Section 519FD..................................... 17
Photograph 4.2. Longitudinal crack after 2,105 repetitions, Test Section 519FD....................... 17
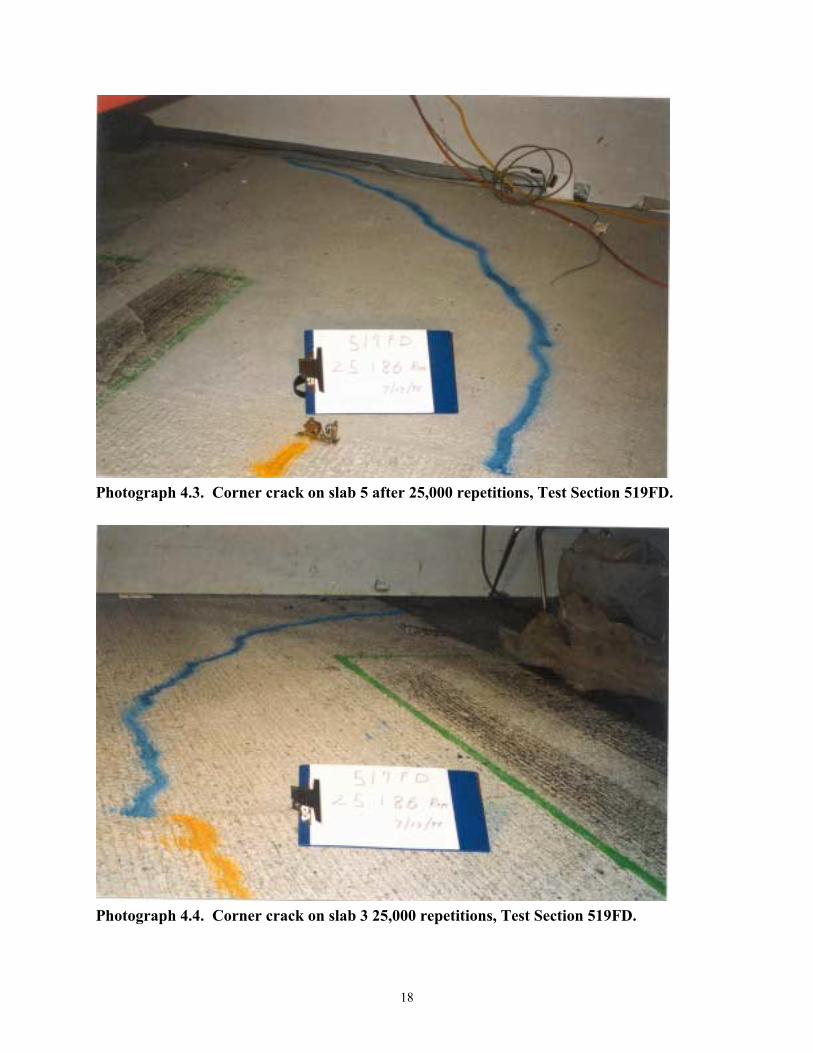
Photograph 4.3. Corner crack on slab 5 after 25,000 repetitions, Test Section 519FD............... 18
Photograph 4.4. Corner crack on slab 3 25,000 repetitions, Test Section 519FD. ...................... 18
Photograph 4.5. Composite photograph of final crack pattern, Test Section 519FD. ................. 19
Photograph 4.6. Permanent deformation at shoulder after 37,000 repetitions, Test Section
519FD. .................................................................................................................................. 21
Photograph 4.7. Composite photograph of final crack pattern, Test Section 520FD. ................. 28
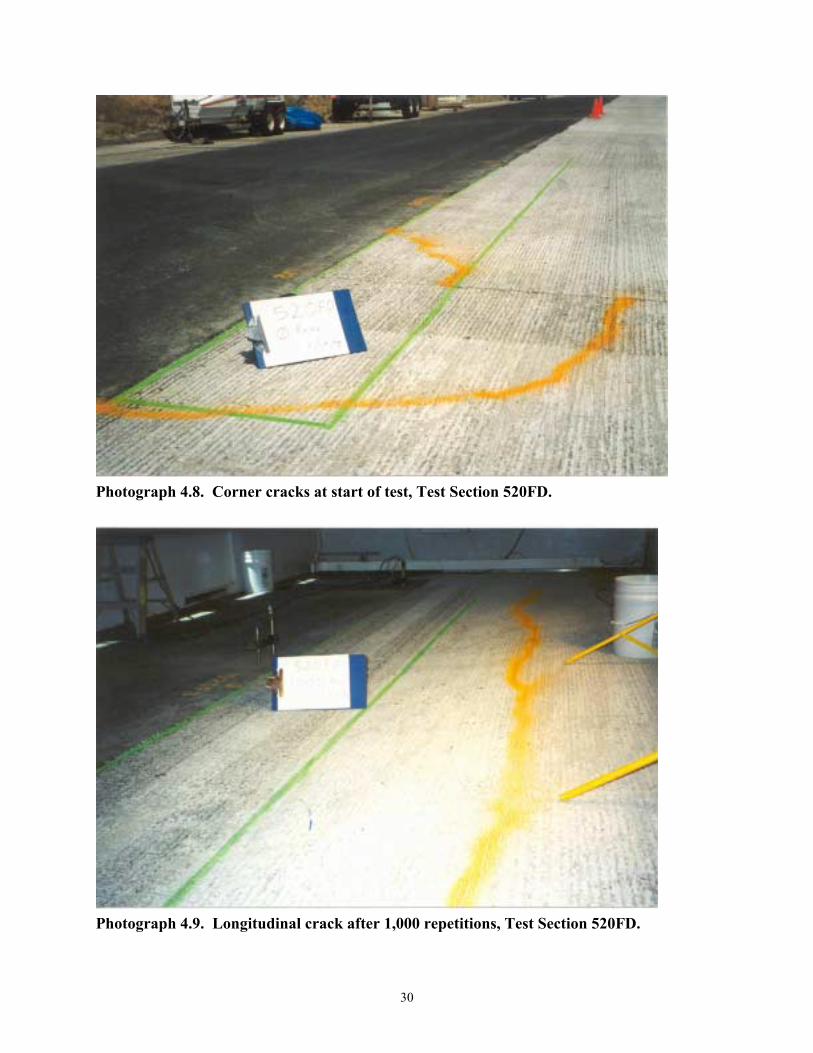
Photograph 4.8. Corner cracks at start of test, Test Section 520FD. ........................................... 30
Photograph 4.9. Longitudinal crack after 1,000 repetitions, Test Section 520FD....................... 30
Photograph 4.10. Cracks at joint 7 (J2) after 2,000 repetitions, Test Section 520FD. ................ 31
Photograph 4.11. Final crack pattern after 74,000 repetitions, Test Section 520FD. .................. 31
Photograph 4.12. Composite photograph of final crack pattern, Test Section 521. .................... 43
Photograph 4.13. Section at beginning of test, Test Section 521FD. .......................................... 45
Photograph 4.14. Longitudinal crack on slab center after 500 repetitions, Test Section 521FD. 46
Photograph 4.15. Crack pattern after 168,000 repetitions, Test Section 521FD. ........................ 46
Photograph 4.16. Corner cracks at joint after 157,000 repetitions, Test Section 521FD............. 47
Photograph 4.17. Final Crack pattern after 168,319 repetitions, Test Section 521FD. ............... 47
Photograph 4.18. Photograph of final crack pattern, Test Section 522FD. ................................. 56
Photograph 4.19. Crack pattern prior to HVS testing, Test Section 522FD. ............................... 56
Photograph 4.20. Position of static test, Test Section 522FD...................................................... 57
Photograph 4.21. Composite photograph of final crack pattern, Test Section 523FD. ............... 60

xiv
Photograph 4.22. Crack at transverse joint (joint 17) at start of test, Test Section 523FD.......... 62
Photograph 4.23. Crack pattern after 90,000 repetitions, Test Section 523FD. .......................... 62
Photograph 4.24. Composite photograph of final crack pattern, Test Section 524FD. ............... 72
Photograph 4.25. Crack pattern at completion of HVS trafficking, Test Section 524FD............ 74
Photograph 4.26. Composite photograph of final crack pattern, Test Section 525FD. ............... 87
Photograph 4.27. Corner crack after 1,000 repetitions, Test Section 525FD. ............................. 89
Photograph 4.28. Corner cracks after 100 repetitions, Test Section 526FD................................ 95
Photograph 4.29. Crack pattern after 500 repetitions, Test Section 526FD. ............................... 95
Photograph 4.30. Composite photograph of final crack pattern, Test Section 526FD. ............... 96
Photograph 4.31. Composite photograph of final crack pattern, Test Section 527FD. ............. 103
Photograph 4.32. Corner crack at start of test, Test Section 527FD.......................................... 105
Photograph 4.33. Composite photograph of final crack pattern, Test Section 528FD. ............. 112
Photograph 4.34. Transverse crack after 52,000 repetitions, Test Section 528FD.................... 114
Photograph 4.35. Final crack pattern after 83,000 repetitions, Test Section 528FD. ................ 114
Photograph 4.36. Composite photograph of final crack pattern, Test Section 529FD. ............. 120
Photograph 4.37. Corner crack after 230,000 repetitions, Test Section 529FD. ....................... 121
Photograph 4.38. Final crack pattern after 352,324 repetitions, Test Section 529FD. .............. 121
Photograph 4.39. Composite photograph of final crack pattern, Test Section 530FD. ............. 127
Photograph 4.40. Final crack pattern at the end of the test (846,844 repetitions), Test Section
530FD. ................................................................................................................................ 128
Photograph 4.41. Composite photograph of final crack pattern, Test Section 531FD. ............. 140
Photograph 4.42. Final crack pattern after 65,315 repetitions, Test Section 531FD. ................ 141
Photograph 5.1. Location of test pit prior to excavation on Test Section 519FD...................... 147

xv
Photograph 5.2. Crack on Test Section 519FD.......................................................................... 147
Photograph 5.3. Crack on Test Section 525FD.......................................................................... 148
Photograph 5.4. Surface crack that did not propagate to bottom of concrete, Test Section 529FD.
............................................................................................................................................. 148

xvi

xvii
LIST OF TABLES
Table 3.1 HVS Tests on the South Tangent................................................................................ 5
Table 3.2 Data Collection Schedules* for HVS Test Sections 519FD to 531FD....................... 6
Table 3.3 Instrumentation Plan For all HVS Sections on the South Tangent........................... 12
Table 3.4 Loading Plan for the HVS Tests ............................................................................... 13
Table 4.1 EDMD and JDMD Deflections, Test Load = 25 kN, Test Section 519FD............... 22
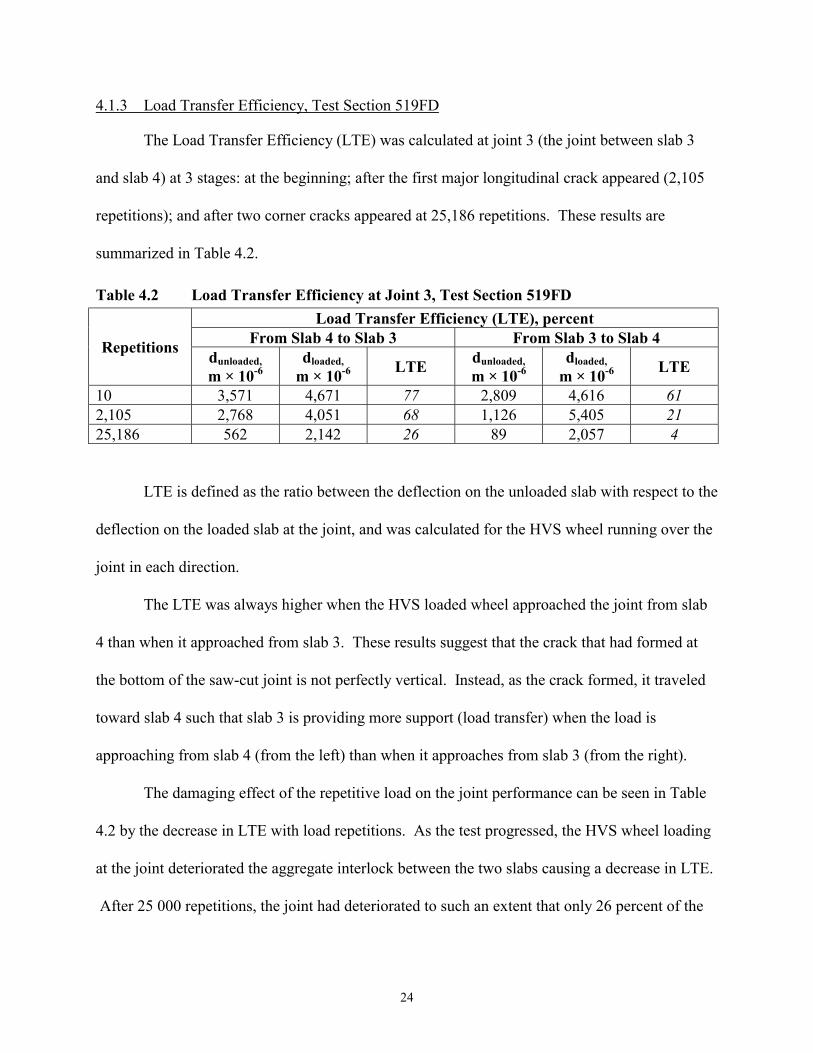
Table 4.2 Load Transfer Efficiency at Joint 3, Test Section 519FD......................................... 24
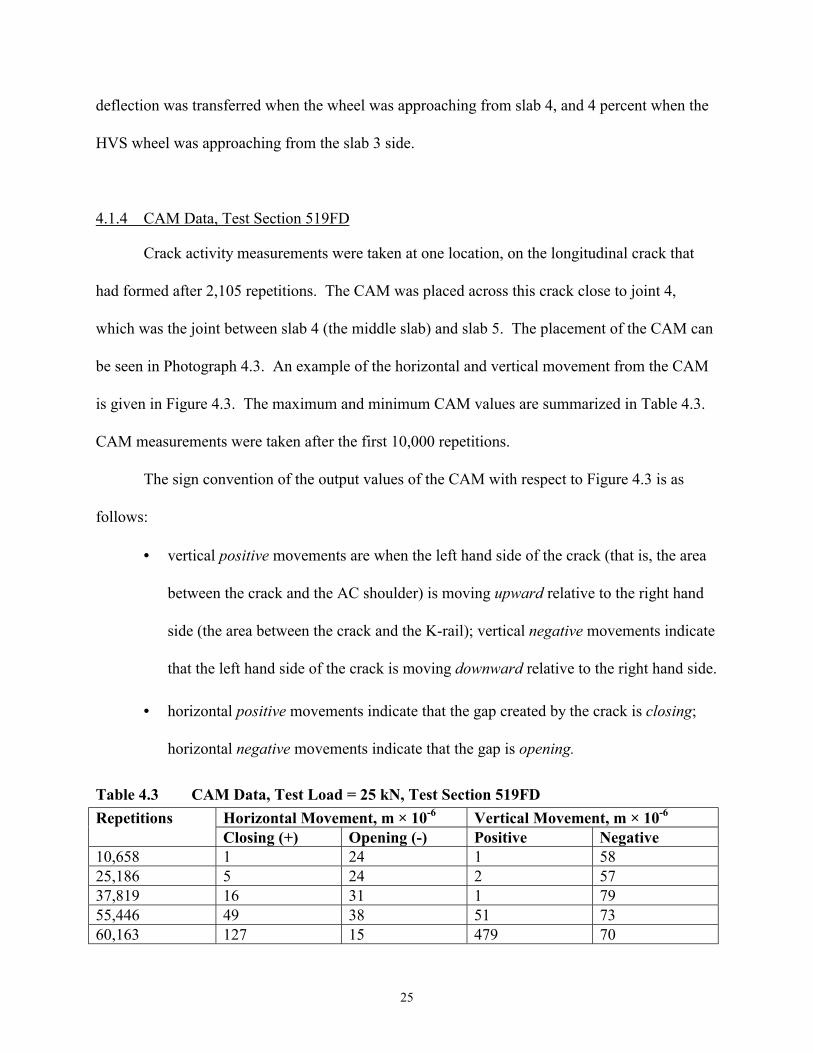
Table 4.3 CAM Data, Test Load = 25 kN, Test Section 519FD............................................... 25
Table 4.4 EDMD and JDMD Deflections, Test Load = 25 kN, Test Section 520FD............... 32
Table 4.5 EDMD and JDMD Deflections, Test load = 35 kN, Test Section 520FD................ 32
Table 4.6 Load Transfer Efficiency, Test Section 520FD ........................................................ 34
Table 4.7 Strain Gauge Data Before, During, and After Concrete
Construction, Test Section 520FD........................................................................................ 37
Table 4.8 Strain Gauge Data Before, During, and After the
HVS Was Positioned on Section, Test Section 520FD......................................................... 38
Table 4.9 Elastic Strain Results, Test Load = 25 kN, Test Section 520FD .............................. 40
Table 4.10 EDMD and JDMD Deflections, Test load = 20 kN, Test Section 521FD................ 48
Table 4.11 MDD Deflections, Test Load = 20 kN, Test Section 521FD.................................... 49
Table 4.12 MDD Permanent Deformation Data, Test Section 521FD ....................................... 51
Table 4.13 CAM Results, Test Section 521FD........................................................................... 53
Table 4.14 Elastic Edge Deflections at a Range of Loads, Test Section 522FD. ....................... 58
Table 4.15 Midpoint Edge Deflections under a 45-kN Wheel Load, Test Section 523FD ........ 63
Table 4.16 Corner Deflections under a 45-kN Wheel Load, Slab 17, Test Section 523FD ....... 64

xviii
Table 4.17 Corner Deflections under a 45-kN Wheel Load, Slab 16, Test Section 523FD ....... 65
Table 4.18 Average Edge and Corner Deflections under a 45-kN Wheel Load,
Test Section 523FD............................................................................................................... 65
Table 4.19 EDMD and JDMD Permanent Pavement Deformations, Test Section 523FD ........ 66
Table 4.20 Load Transfer Efficiency at Joint 16, Test Section 523FD....................................... 69
Table 4.21 CAM Results, Test Section 523FD........................................................................... 70
Table 4.22 Midpoint Edge Deflections under a 45-kN Wheel Load, Slab 20,
Test Section 524FD............................................................................................................... 74
Table 4.23 Corner Deflections under a 45-kN Wheel Load, Slab 20, Test Section 524FD ....... 75
Table 4.24 Corner Deflections under a 45-kN Wheel Load, Slab 19, Test Section 524FD ....... 75
Table 4.25 Average Midpoint Edge and Corner Deflections under a 45-kN Wheel Load,
Test Section 524FD............................................................................................................... 76
Table 4.26 EDMD and JDMD Permanent Deformation, Test Section 524FD........................... 77
Table 4.27 Load Transfer Efficiency, Test Section 524FD ........................................................ 79
Table 4.28 Dynamic Strain Response under a 45-kN Test Load, Test Section 524FD .............. 82
Table 4.29 Permanent Strain Gauge Response on Slab 20 and at Joint 19,
Test Section 524FD............................................................................................................... 84
Table 4.30 Midpoint Edge Deflections under a 45-kN Wheel Load, Slab 23,
Test Section 525FD............................................................................................................... 90
Table 4.31 Corner Deflections under a 45-kN Wheel Load, Slab 23/Joint 22,
Test Section 525FD............................................................................................................... 90
Table 4.32 Corner Deflections under a 45-kN Wheel Load, Slab 22/Joint 22,
Test Section 525FD............................................................................................................... 90

xix
Table 4.33 Average Midpoint Edge and Corner Deflections under a 45-kN Wheel Load,
Test Section 525FD............................................................................................................... 90
Table 4.34 Permanent Deformation Data, Test Section 525FD.................................................. 91
Table 4.35 Load Transfer Efficiency (LTE), Test Section 525FD.............................................. 93
Table 4.36 EDMD and JDMD Deflections, 85-kN Test Load, Test Section 526FD: ................ 98
Table 4.37 EDMD and JDMD Permanent Deformation, Test Section 526FD........................... 98
Table 4.38 Load Transfer Efficiency (LTE) at Joint 26, Test Section 526FD.......................... 100
Table 4.39 EDMD and JDMD Deflections, Test Load = 35 and 40 kN, Test Section 527FD. 105
Table 4.40 Permanent Deformation, Test Section 527FD ........................................................ 107
Table 4.41 Load Transfer Efficiency, Test Section 527FD ...................................................... 109
Table 4.42 EDMD and JDMD Deflections, Test Load = 40 kN, Test Section 528FD............. 115
Table 4.43 Load Transfer Efficiency at Joint 34, Test Section 528FD..................................... 116
Table 4.44 Dynamic Strain Data, Test Load = 40 kN, Test Section 528FD............................. 117
Table 4.45 EDMD and JDMD Deflections, Test Load = 40 kN, Test Section 529FD............. 122
Table 4.46 EDMD and JDMD Deflections, Test Load = 60 kN, Test Section 529FD............. 122
Table 4.47 Load Transfer Efficiency, Joint 31, Test Section 529FD........................................ 124
Table 4.48 EDMD and JDMD Deflections, Test Load = 40 kN, Test Section 530FD............. 128
Table 4.49 EDMD and JDMD Deflections, Test Load = 60 kN, Test Section 530FD............. 129
Table 4.50 EDMD and JDMD Deflections, Test Load = 90 kN, Test Section 530FD............. 129
Table 4.51 Load Transfer Efficiency, Joint 38, Test Section 530FD........................................ 133
Table 4.52 MDD Deflections, Joint 39, Test Section 530FD................................................... 135
Table 4.53 MDD Permanent Deformation, Joint 39, Test Section 530FD............................... 137
Table 4.54 EDMD and JDMD Deflections, Test Load = 40 kN, Test Section 531FD............. 141

xx
Table 4.55 EDMD and JDMD Deflections, Test Load = 70 kN, Test Section 531FD............. 141
Table 4.56 Load Transfer Efficiency at Joint 41, Test Section 531FD..................................... 143
Table 5.1 Test pit results: Layer thicknesses........................................................................... 145
Table 6.1 Concrete and Subgrade Stiffness for Different Curing Ages (Based on Deflections
Measured at Slab Center).................................................................................................... 151
Table 6.2 Joint Load Transfer Efficiency at Different Curing Ages....................................... 156
Table 6.3a Transverse Joint Load Transfer Efficiency (Center of Transverse Joint, Refer to
Figure 6.4)........................................................................................................................... 165
Table 6.3b Corner Load Transfer Efficiency (Corner: Shoulder side � See Figure 6.4)........... 166
Table 6.3c Corner Load Transfer Efficiency (Corner: K-rail side � See Figure 6.4) ............... 167
Table 6.3d Longitudinal Joint Load Transfer Efficiency (Longitudinal joint: K-rail side � See
Figure 6.4)........................................................................................................................... 168
Table 6.4 Maximum Deflection at Center of Slabs, Day and Night ....................................... 169
Table 7.1 Palmdale South Tangent Section 1 Cores Properties,
44 Days After Construction ................................................................................................ 172
Table 7.2 Palmdale South Tangent Section 3 Cores Properties,
44 Days After Construction ................................................................................................ 172
Table 7.3 Palmdale South Tangent Section 5 Cores Properties,
44 Days After Construction ................................................................................................ 173
Table 7.4 Properties of Palmdale cores, South Tangent, Section 1, Sample Size = 9 ............ 176
Table 7.5 Properties of Palmdale cores, South Tangent, Section 3, Sample Size = 14 .......... 176
Table 7.6 Properties of Palmdale cores, South Tangent, Section 5, Sample Size = 14 .......... 176

xxi
Table 7.7 Properties of Palmdale cores, South Tangent, all Sections Average,
Sample Size = 37 ................................................................................................................ 177
Table 7.8 Saw Cut Statistics: Day and Night Cores................................................................ 179
Table 7.9 Day/Night Measurements of Crack Openings at Bottom of Cores......................... 180

xxii

1
1.0 INTRODUCTION
As part of the Caltrans Long Life Pavement Rehabilitation Strategies (LLPRS), a fast
setting strength hydraulic cement concrete (FSHCC)/Type I/II Portland cement concrete (PCC)
blend was evaluated under Heavy Vehicle Simulator (HVS) tests as detailed in the Test Plan for
CAL / APT Goal LLPRS - Rigid Phase III (1).
Because it is expected to be used on projects where heavy trucks are expected to be
allowed on the slabs within 4 to 8 hours after placement, this newly placed concrete is specified
to obtain a flexural strength of 2.8 MPa within 4 to 8 hours of placement.
Two full-scale test sites, each approximately 210 m in length, were constructed using this
concrete on either side of State Route 14 about 5 miles south of Palmdale, California. Various
test sections were constructed at these two sites. The site in the southbound direction included
sections with different thicknesses of concrete placed on compacted granular base. The site in
the northbound direction included 200-mm concrete on cement treated base, with various design
features: dowels, tied shoulders, widened lanes.(2)
This report documents the results of the tests on the southbound lanes, also referred to as
the "South Tangent.� Another report currently in being written presents the results of tests on the
northbound lanes (North Tangent).

2

3
2.0 HVS TEST OBJECTIVES AND SCOPE OF WORK
The main objective of the series of tests on the South Tangent was to evaluate the fatigue
behavior of the fast setting hydraulic cement concrete/Portland cement concrete blend under the
influence of accelerated wheel loads. It was assumed that the behavior of this mix is similar to
that of a pure FSHCC mix. Thirteen HVS tests were undertaken on the South Tangent during the
period 07/15/1998 to 05/21/1999.
This report summarizes the results and observations of all HVS tests conducted on the
South Tangent. Included in this report are all test sections on the plain jointed (no-dowels, no-tie
bars, standard lane width) sections with concrete thicknesses of 100 mm, 150 mm, and 200 mm.
All of the data summarized in this report is included in the Pavement Research Center
electronic database.

4

5
3.0 HVS TEST PROGRAM
The HVS tests on the South Tangent are listed in Table 3.1.
Table 3.1 HVS Tests on the South TangentHVSTest
SectionNumber
SlabNumber*
DesignThickness
(mm)
SlabLength
(m)
StartDate
EndDate
TemperatureControl?
519FD 1A 4 100 5.80 07/15/98 07/19/98 Yes520FD 1B 8 100 5.77 07/23/98 07/30/98 Yes521FD 1C 12 100 5.76 08/10/98 08/28/98 Yes522FD 1D 14 100 3.69 09/02/98 09/02/98 No523FD 3A 17 150 5.47 09/14/98 09/29/98 Yes524FD 3B 20 150 5.77 10/02/98 10/13/98 Yes525FD 3C 23 150 3.91 10/15/98 10/18/98 No526FD 3D 27 150 4.00 10/19/98 10/22/98 Yes527FD 3C 22 150 3.58 10/26/98 01/21/99 No528FD 5B 35 200 4.03 01/27/99 02/02/99 Yes529FD 5A 31 200 3.94 02/07/99 03/04/99 No530FD 5C 39 200 3.95 03/10/99 05/14/99 Yes531FD 5D 42 200 3.70 05/19/99 05/21/99 Yes* The HVS test was centered on this slab. Some areas of the adjacent slabs were also subjected toHVS testing.
The layout of all these sections with respect to the 210-m long full-scale test section on
the South Tangent is detailed in an earlier report (2).
3.1 HVS Data Collection Schedule
Data were collected according to the intervals detailed in Table 3.2. Visual surveys of the
test section were done on a daily basis and air, surface, and in-depth temperatures were recorded
every 2 to 3 hours, 24 hours per day. Attempts were made to synchronize the data collection
times in terms of number of repetitions for all the test sections, but this was not always possible.
A summary of all the temperatures recorded can be found in Section 8 of this report; an example
of the raw temperature data can be found in Appendix B. Complete temperature data can be
accessed in the Pavement Research Center Database.

Table 3.2 Data Collection Schedules* for HVS Test Sections 519FD to 531FDTest Section/Temperature Control?/Thickness (mm)
519FD 520FD 521FD 522FD 523FD 524FD 525FD 526FD 527FD 528FD 529FD 530FD 531FDYes Yes Yes No Yes Yes No Yes No Yes No Yes YesRepetitions
100 mm 150 mm 200 mm10 X X X ** X X X X X X X X X100 X X X X X500 X X X X X X1,000 X X X X X X X2,100 X X X X X3,500 X X X X5,000 X X X X End X X10,000 X X X X15,000 X X X X X X20,000 X X X25,000 X X End X X30,000 X X X X X X X35,000 X X40,000 X X X X X50,000 X X X X X55,000 X X60,000 End X X X X70,000 End X80,000 X X End85,000 End X90,000 X X X100,000 X X X X X125,000 X End X X140,000 X X X150,000 X X157,000 X End X168,000 End X200,000 X X X215,000 X X
6

Test Section/Temperature Control?/Thickness (mm)519FD 520FD 521FD 522FD 523FD 524FD 525FD 526FD 527FD 528FD 529FD 530FD 531FD
Yes Yes Yes No Yes Yes No Yes No Yes No Yes YesRepetitions
100 mm 150 mm 200 mm230,000 X X245,000 X X260,000 X X X310,000 X X X320,000 X X335,000 X X350,000 X End X400,000 X X500,000 X X600,000 X X830,000 X End900,000 X950,000 X1,000,000 X1,233,969 End* Note: The table shows the approximate data collection times.** Test Section 522FD was a static test.
7

8
HVS loading was continued for each test section until the particular section was
considered failed. The failure criterion was a crack in the slab. Although all data were recorded
as indicated in Table 3.2, only the most significant results are presented in this summary report
(complete data can be accessed in the Pavement Research Center Database). HVS Test Section
522FD was a static test and was not subjected to repetitive loading.
3.2 HVS Instrumentation Plan
In order to monitor the functional and structural behavior of the pavement under
accelerated loading, various instruments were used. The description and function of these
instruments and their recording mechanisms are described in previous reports (1�3).
Vertical surface deflections were recorded using two Joint Deflection Measuring Devices
(JDMDs) and one Edge Deflection Measuring Device (EDMD) on each test section. The
JDMDs were positioned to record corner deflections; the EDMD was positioned to record the
edge deflection in the middle of the slab. On a few sections, Multi Depth Deflectometers
(MDDs) were installed to measure the vertical surface and in-depth deflections. An illustration
of the placement of the JDMDs and EDMDs with respect to the concrete slabs and the HVS test
pad is shown in Figure 3.1.
Surface deflections were also captured with the Road Surface Deflectometer (RSD) at
certain sections. These results were merely used for calibration purposes between the RSD,
JDMDs, and EDMDs and are not reported in this document. Further discussion of these
instruments and their application can be found in Reference (1, 2)
Each test section was instrumented with thermocouples, which recorded the surface (0
mm), mid-depth, and bottom in-depth temperatures of the concrete structures. Other

9
EDMD
JDMD 1JDMD 2
Slab x
Slab x+1
Slab x+2
HVS Test Section
Figure 3.1. Illustration of the placement of JDMDs and EDMD.
environmental data, such as rainfall, and wind direction and speed were continuously recorded
using a Davis automatic weather station.
Some sections were instrumented with strain gauges. At these sections, listed in Table
3.3, four strain gauges were placed inside the concrete slab along the edge of the slab. Two
gauges were placed inside the slab 40 mm from the bottom of the slab, and two were placed 40
mm from the surface.
Two of the four were manufactured by Dynatest, which are uniaxial, and the other two
were Tokyo Sokki PMR 60 6L gauges (designated by the abbreviation: PMR) each measuring in
three directions. One Dynatest gauge was placed parallel to the direction of wheel travel in the
middle of the center slab (midpoint), and the other one perpendicular to the direction of travel
about 300 mm from the joint to the adjacent slab.

10
The two PMR gauges were placed 40 mm from the surface at the same locations. They
were installed so that the two perpendicular arms (90 degrees apart) were placed in the
longitudinal and transverse directions with respect to the slab. The third arm is between the other
two at 45 degrees. Figure 3.2 illustrates the placement of the various strain gauges.
Dynatest 2Dynatest 1
PMR 1 PMR 2
300mm40mm
midspan
Figure 3.2. Illustration of the placement of the strain gauges with respect to the concreteslab
These strain gauges were used to monitor the changes in the strain state inside the
concrete slab in two ways:
1. Dynamic response: changes in the elastic strain state due to the influence of the
applied wheel load. This is illustrated in Figure 3.3. The figure shows the output of
both Dynatest strain gauges with respect to the applied wheel load. Note that the
gauges went through states of compression and tension as the wheel passed over
them.
2. Static response: changes in the strain state of the pavement due to concrete
hydration, setting, temperature, and shrinkage effects.

11
-30
-25
-20
-15
-10
-5
0
5
10
15
20
25
30
35
40
0 500 1000 1500 2000 2500 3000 3500 4000 4500 5000 5500 6000 6500 7000 7500
mm
mic
rost
rain
Dynatest midspan Dynatest Corner
Dynatest Midspan: Bottom
Dynatest Corner: Bottom
Wheel Direction
Positive Values = Tensile StrainNegative Values = Compressive Strain
Figure 3.3. Illustration of the output of the strain gauges under the influence of an appliedload.
The detailed instrumentation plan is given in Table 3.3.
3.3 HVS Loading Plan
The actual thickness of the slab varied over the length of the nominal 100-mm thick
sections. In order to account for these variations, some changes in the loading were made from
test to test. The actual loading applied can been seen in Table 3.4
All tests were done with the HVS trafficking in the bi-directional traffic mode, meaning
that the wheel was loaded in both directions. All tests were performed with a channelized
wander pattern, meaning that no lateral wander was introduced, and the wheel always traveled

Table 3.3 Instrumentation Plan For all HVS Sections on the South Tangent
SectionThickness
PavementSection Slab #
HVSTest
Section
Thermo-couples JDMD Strain
Gauges MDD RSD CAM FWD
1A 3, 4, 5 519 x x x x1B 7, 8, 9 520 x x x x1C 11, 12, 13 521 x x x x x100 mm
1D 13, 14, 15 522 x3A 16, 17, 18 523 x x x3B 19, 20, 21 524 x x x3C 22, 23, 24 525 x x3D 26, 27, 28 526 x x
150 mm
3C 21, 22, 23 527 x x x5B 34, 35, 36 528 x x x x x5A 30, 31, 32 529 x x x5C 38, 39, 40 530 x x x x200 mm
5D 41, 42, 43 531 x x x x
12
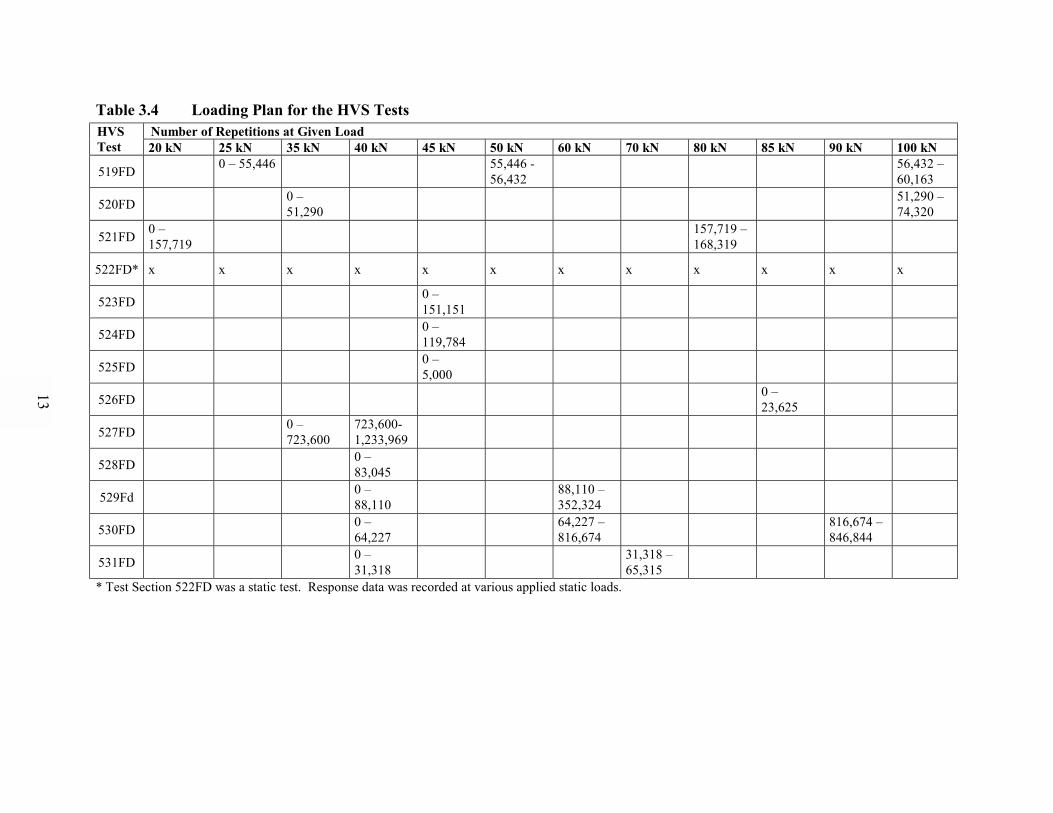
Table 3.4 Loading Plan for the HVS TestsNumber of Repetitions at Given LoadHVS
Test 20 kN 25 kN 35 kN 40 kN 45 kN 50 kN 60 kN 70 kN 80 kN 85 kN 90 kN 100 kN
519FD 0 � 55,446 55,446 -56,432
56,432 �60,163
520FD 0 �51,290
51,290 �74,320
521FD 0 �157,719
157,719 �168,319
522FD* x x x x x x x x x x x x
523FD 0 �151,151
524FD 0 �119,784
525FD 0 �5,000
526FD 0 �23,625
527FD 0 �723,600
723,600-1,233,969
528FD 0 �83,045
529Fd 0 �88,110
88,110 �352,324
530FD 0 �64,227
64,227 �816,674
816,674 �846,844
531FD 0 �31,318
31,318 �65,315
* Test Section 522FD was a static test. Response data was recorded at various applied static loads.
13

14
along the edge of the slabs next to the asphalt shoulder. Wander was not introduced because it
would have prolonged the time required to achieve fatigue cracking on each test section.
Channelized traffic represents the most critical case. The HVS repetitions to failure on
the slab edge for this case can be extrapolated to a more typical traffic wander pattern through the
use of modeling. In the modeling, the strains are calculated for the critical edge load as well as
for the other load locations. Stresses calculated from the strains are related to repetitions to
failure by fatigue laws. The HVS results are used to verify the fatigue law, which is then applied
to the other load locations.

15
4.0 HVS RESULTS
The test results of the individual HVS tests are summarized in this section. The previous
output report on the construction of the test sections at Palmdale gives complete details of the
instrument layout (1). Data collection was undertaken at the intervals shown in Table 3.2. All
dynamic data were measured when the HVS wheel was running at a creep speed of about 2 km/h,
and in both directions. Further details of HVS data collection procedure for concrete can be
found in a previous report (3). For fatigue analysis purposes, the appearance of a crack on the
middle slab signified fatigue failure. In certain cases, the HVS tests were run longer to monitor
the performance of the middle and adjacent slabs after the first appearance of fatigue cracks.
Because temperature differentials inside the concrete slab have a significant influence on
the stress and strain state which in turn influences the surface deflection measurements, the
temperature difference between the surface and the bottom of the concrete layer at the time of
deflection measurements is also given along with the tabulated deflection data. Thermocouple
data collection was not always in synchronization with regular data collection and in some cases,
no data are available.
In the surface deflection graphs, temperature gradient data have been omitted to avoid
unnecessary confusion as the graphs already have a significant amount of data displayed. Plots
of all the temperature gradients can, however, be found in Section 8, which details the
temperature results.
4.1 Test Section 519FD
Test Section 519FD was performed on slabs 3, 4, and 5 on the South Tangent. Slab 4
(total length of 5.8 m) was fully tested, together with part of the adjacent slabs (slabs 3 and 5) on

16
either side of joints 3 and 4. In order to minimize stresses and strains caused by temperature
effects, the temperature control chamber was used during this test.
The test started with a 25-kN dual wheel load to 55,448 repetitions, after which the load
was increased to 50 kN for another 1,000 repetitions. The final loading phase was performed at a
100-kN wheel load up to 60,163 repetitions, at which stage the pavement structure was cracked.
At the time of the test on Section 519FD, no thermocouples were installed.
4.1.1 Visual Observations, Section 519FD
The crack pattern, as it developed with time, can be seen in Figure 4.1. Prior to the start
of any loading on Section 519FD, a crack starting at joint 4 and the edge of the slab had
developed, most likely from construction traffic (Photograph 4.1).
After approximately 2,000 25-kN load repetitions, a longitudinal crack developed
throughout the length of the middle slab (slab 4) between both joints, about 1.4 m from the edge
(Photograph 4.2). This type of crack indicates a loss of support under the slab and/or excessive
slab warping causing an unsupported edge (4). This crack was followed by two corner cracks on
either side of slab 4 (one in slab 3 and one in slab 5), which developed at approximately 25,000
repetitions (Photographs 4.3 and 4.4). As the test progressed, more edge and corner cracks
developed. The final crack pattern is displayed in Photograph 4.5 and Figure 4.1.
One interesting observation is the amount of permanent deformation along the edge of the
slab. Prior to the HVS test, the concrete slab was flush with the asphalt concrete shoulder all
along the edge of the concrete slab. As the test progressed, the concrete edge slowly started to
move downward into the aggregate base. The total permanent deformation after 37,819

17
Photograph 4.1. Corner crack prior to start of test, Test Section 519FD.
Photograph 4.2. Longitudinal crack after 2,105 repetitions, Test Section 519FD.
18
Photograph 4.3. Corner crack on slab 5 after 25,000 repetitions, Test Section 519FD.
Photograph 4.4. Corner crack on slab 3 25,000 repetitions, Test Section 519FD.

Photograph 4.5. Composite photograph of final crack pattern, Test Section 519FD.
19
Note: Loading Sequence25 kN 10 - 55448 Reps
50 kN 55448 - 56432 Reps100 kN 56432 - 60163 Reps
Note: Loading Sequence25 kN 10 - 55448 Reps
50 kN 55448 - 56432 Reps100 kN 56432 - 60163 Reps
2105 Reps 25 186 Reps 37 819 Reps 55 446 Reps
60 163 Reps Final
2105 Reps 25 186 Reps 37 819 Reps 55 446 Reps
60 163 Reps Final
Crack at0 Reps
Joint 4 Joint 3950
490
1165
> 1200
280810
885
550
610
840
1800 750665
Slab 5 Slab 4 Slab 3
Figure 4.1. Schematic of crack development, Test Section 519FD (not to scale).
20

21
Photograph 4.6. Permanent deformation at shoulder after 37,000 repetitions, Test Section519FD.
repetitions recorded along the edge at the interface between the concrete slab and the adjacent
asphalt shoulder was around 20 mm (see Photograph 4.6).
4.1.2 JDMD and EDMD Data, Test Section 519FD
Two Joint Displacement Monitoring Devices (JDMDs) were placed on either side of joint
3 and one Edge Displacement Monitoring Device (EDMD) was placed on the edge of slab 4 at its
midpoint (centrally between the two joints) to monitor the elastic movement of the slab. The
maximum deflections at the midpoint edge of the middle slab and at the corner edge of joint 4 are
summarized in Table 4.1.

22
Table 4.1 EDMD and JDMD Deflections, Test Load = 25 kN, Test Section 519FDDeflections (m × 10-6)
Corner, Joint 3Repetitions Midpoint Edge,Slab 4 Slab 4 Side Slab 3 Side
TemperatureDifference (Top-Bottom), °C
10 1,762 4,553 4,669 NA2,105 448 2,748 5,427 NA10,658 335 2,248 5,038 NA25,186 375 2,134 2,053 NA37,819 380 2,239 1,842 NA55,446 368 2,307 1,752 NA60,163 426 5,842 3,597 NA
The data are shown graphically in Figure 4.2, which should be viewed together with the
crack patterns (Photograph 4.5) in order to interpret the behavior correctly.
It is believed that a cavity under the edge of the slab caused the high initial deflections
because of differential drying shrinkage in the FSHCC. This cavity, together with the applied
edge loading, caused a bending moment all along the length of the slab which resulted in the
longitudinal crack that developed after only 2,105 repetitions (Photograph 4.2). After this crack
had developed, it was considered that the concrete slab re-seated onto the base course. This
caused the cavity to close, which resulted in a significant decrease in edge deflections owing to
the more effective support from the base and underlying layers. After the crack had been formed,
the midpoint edge deflections decreased from 1,762 microns to 448 microns. This represents an
81 percent decrease in deflection at the midpoint. Similarly, the deflections on the slab 4 side of
joint 3 experienced a 51 percent decrease in deflection.
On the slab 3 side of joint 3, the deflections stayed constant up to the point when the
corner crack developed (25,186 repetitions) (see Photographs 4.3 and 4.4). At this point the
deflections decreased by about 60 percent from the original N10 measurements, from 4,699
microns at the beginning of the test to 2,053 microns after 25,186 repetitions.

23
0
500
1,000
1,500
2,000
2,500
3,000
3,500
4,000
4,500
5,000
5,500
6,000
0 10,000 20,000 30,000 40,000 50,000 60,000 70,000
Repetitions
Def
lect
ion
(mic
rons
)
Edge midpoint, slab 4 Corner, slab 3 / joint 3 Corner, slab 4 / joint 3
Figure 4.2. EDMD and JDMD deflections, test load = 25 kN, Test Section 519FD.
After 37,819 load repetitions, a maximum of approximately 20 mm of permanent
deformation was recorded along the slab edge at the interface between the concrete slab and the
adjacent asphalt shoulder (Photograph 4.6). This observation clearly illustrated the reason for the
slab having had a longitudinal crack, i.e., the slab had to move downward to come in full contact
with the base.
After the initial longitudinal crack (at 2,105 repetitions) and the corner cracks (at 25,186
repetitions), the deflections stabilized up to the point where the wheel load was increased (at
55,446 reps). A sharp increase in deflections was observed at this point as a result of the
increased wheel load (Figure 4.2).
24
4.1.3 Load Transfer Efficiency, Test Section 519FD
The Load Transfer Efficiency (LTE) was calculated at joint 3 (the joint between slab 3
and slab 4) at 3 stages: at the beginning; after the first major longitudinal crack appeared (2,105
repetitions); and after two corner cracks appeared at 25,186 repetitions. These results are
summarized in Table 4.2.
Table 4.2 Load Transfer Efficiency at Joint 3, Test Section 519FDLoad Transfer Efficiency (LTE), percent
From Slab 4 to Slab 3 From Slab 3 to Slab 4Repetitions dunloaded,m × 10-6
dloaded,m × 10-6 LTE dunloaded,
m × 10-6dloaded,
m × 10-6 LTE
10 3,571 4,671 77 2,809 4,616 612,105 2,768 4,051 68 1,126 5,405 2125,186 562 2,142 26 89 2,057 4
LTE is defined as the ratio between the deflection on the unloaded slab with respect to the
deflection on the loaded slab at the joint, and was calculated for the HVS wheel running over the
joint in each direction.
The LTE was always higher when the HVS loaded wheel approached the joint from slab
4 than when it approached from slab 3. These results suggest that the crack that had formed at
the bottom of the saw-cut joint is not perfectly vertical. Instead, as the crack formed, it traveled
toward slab 4 such that slab 3 is providing more support (load transfer) when the load is
approaching from slab 4 (from the left) than when it approaches from slab 3 (from the right).
The damaging effect of the repetitive load on the joint performance can be seen in Table
4.2 by the decrease in LTE with load repetitions. As the test progressed, the HVS wheel loading
at the joint deteriorated the aggregate interlock between the two slabs causing a decrease in LTE.
After 25 000 repetitions, the joint had deteriorated to such an extent that only 26 percent of the
25
deflection was transferred when the wheel was approaching from slab 4, and 4 percent when the
HVS wheel was approaching from the slab 3 side.
4.1.4 CAM Data, Test Section 519FD
Crack activity measurements were taken at one location, on the longitudinal crack that
had formed after 2,105 repetitions. The CAM was placed across this crack close to joint 4,
which was the joint between slab 4 (the middle slab) and slab 5. The placement of the CAM can
be seen in Photograph 4.3. An example of the horizontal and vertical movement from the CAM
is given in Figure 4.3. The maximum and minimum CAM values are summarized in Table 4.3.
CAM measurements were taken after the first 10,000 repetitions.
The sign convention of the output values of the CAM with respect to Figure 4.3 is as
follows:
• vertical positive movements are when the left hand side of the crack (that is, the area
between the crack and the AC shoulder) is moving upward relative to the right hand
side (the area between the crack and the K-rail); vertical negative movements indicate
that the left hand side of the crack is moving downward relative to the right hand side.
• horizontal positive movements indicate that the gap created by the crack is closing;
horizontal negative movements indicate that the gap is opening.
Table 4.3 CAM Data, Test Load = 25 kN, Test Section 519FDHorizontal Movement, m × 10-6 Vertical Movement, m × 10-6RepetitionsClosing (+) Opening (-) Positive Negative
10,658 1 24 1 5825,186 5 24 2 5737,819 16 31 1 7955,446 49 38 51 7360,163 127 15 479 70

26
-100
0
100
200
300
400
500
-400 -300 -200 -100 0 100 200 300 400 500 600 700 800
Distance from joint (mm)
Cra
ck m
ovem
ent (
mic
rons
)
Horizontal movementVertical movement
Joint 4Slab 4 Slab 5
Figure 4.3. CAM response, Test Section 519FD.
These values are small, even after 60,000 load applications, but it is important to note that
the CAM was placed over a crack, which was approximately 1 meter away from the applied load
(see Photograph 4.3). The CAM results do not, therefore, reflect the crack activity under the
influence of a load applied directly over the crack (as would be observed with normal traffic).
One interesting observation is that the crack activity increased as the test progressed,
especially after the traffic wheel load was increased (from 25 kN to 50 kN and eventually to 100
kN). It seems as if the greater wheel loads caused a noticeable loss in horizontal contact between
the aggregate on either side of the crack, hence the increased horizontal relative movement. This
is likely due to rotation of the thin slab downward and away from the joint, which appears in both
the horizontal and vertical deflection measurements.
The same can be said about the aggregate interlock, which was restricting the relative
vertical movement across the crack. As the test progressed the interlock deteriorated and greater

27
relative vertical movements were recorded. Comparing the crack activity measured at 60,163
repetitions with the readings taken at 55,446 repetitions shows an increase in vertical positive
movement from 50.7 to 478.7 microns. This suggests that the trafficked area between the crack
and the AC shoulder got increasingly detached from the main part of slab 4 on the other side of
the crack, which caused this significant increase in vertical movement.
4.2 Test Section 520FD
Test Section 520FD was conducted on slabs 7, 8 and 9 on the South Tangent, with the 8 ×
1 m HVS test section located so that slab 8 (total length of 5.8 m) was fully tested along its edge.
The temperature control box was used during this test. The test started with a 35-kN dual wheel
load to 51,240 repetitions, and then the load was increased to 100 kN for just over another 20,000
repetitions. The test was stopped at 74,320 repetitions. An overhead photo of the entire section
with cracks can be seen in Photograph 4.7; Figure 4.4 shows the crack development.
4.2.1 Visual Observations, Test Section 520FD
Prior to the start of the test, two cracks had already developed as shown in Photograph
4.8. While not attributable to the HVS loading, these initial cracks are likely to influence the
subsequent crack development during the accelerated loading test. These are probably due to
shrinkage and curling stresses, or less likely due to construction traffic.
After about 1,000 load repetitions at 35 kN, a longitudinal crack developed along nearly
the entire length of the middle slab (slab 8) between both joints, about 1.1 m away from the edge
(Photograph 4.9). After 2,000 repetitions, the longitudinal crack had extended to link up with the

Photograph 4.7. Composite photograph of final crack pattern, Test Section 520FD.
28

0 Reps 1000 Reps
34 320 Reps 51 290 Reps 60 100 Reps 74 320 Reps
0 Reps 1000 Reps
34 320 Reps 51 290 Reps 60 100 Reps 74 320 Reps
1100
920 1590
21302500
1320 80 40
1060
Note: Loading Sequence35 kN: 10 - 0 - 51 240 Reps100 kN 51 290 -74 320 Reps
Note: Loading Sequence35 kN: 10 - 0 - 51 240 Reps100 kN 51 290 -74 320 Reps
Joint 8 Joint 7
Crack at0 Reps
12001130
Slab 9 Slab 8 Slab 7
Figure 4.4. Schematic of crack development, Test Section 520FD (not to scale).
29
30
Photograph 4.8. Corner cracks at start of test, Test Section 520FD.
Photograph 4.9. Longitudinal crack after 1,000 repetitions, Test Section 520FD.

31
Photograph 4.10. Cracks at joint 7 (J2) after 2,000 repetitions, Test Section 520FD.
Photograph 4.11. Final crack pattern after 74,000 repetitions, Test Section 520FD.

32
existing corner crack (which existed prior to the start of the test), and a transverse crack starting
about 500 mm right of joint 7 had developed in slab 7 (Photograph 4.10).
Various additional transverse cracks appeared in the mid-slab area during the test, which
proceeded to 74,000 load repetitions. The final crack pattern can be seen in Photographs 4.7 and
4.11.
4.2.2 JDMD and EDMD Data, Test Section 520FD
Two Joint Displacement Monitoring Devices (JDMDs) were placed on either side of
Joint 8 and one Edge Displacement Monitoring Device (EDMD) was placed on the edge at the
longitudinal midpoint of slab 8. The results are summarized in Tables 4.4 and 4.5 for the 25-kN
test load and the 35-kN test load, respectively.
Table 4.4 EDMD and JDMD Deflections, Test Load = 25 kN, Test Section 520FDDeflections (m × 10-6)
Corner, Joint 8Repetitions Midpoint Edge,Slab 8 Slab 9 Side Slab 8 Side
TemperatureDifference (Top-Bottom), °C
10 1,107 2,836 1,632 -1.72,000 662 3,573 2,881 -1.725,190 615 4,140 3,240 -0.855,500 607 2,308 3,037 -1.560,100 749 1,929 690 -1.3
Table 4.5 EDMD and JDMD Deflections, Test load = 35 kN, Test Section 520FDDeflections (m × 10-6)
Corner, Joint 8Repetitions Midpoint Edge,Slab 8 Slab 9 Side Slab 8 Side
TemperatureDifference (Top-Bottom), °C
10 1,309 3,052 4,007 -1.71,000 909 3,509 3,114 -1.72,000 802 3,810 3,043 -1.75,769 751 4,041 3,199 -0.840,000 671 4,186 3,304 -2.455,500 675 1,998 3,079 -1.560,100 920 2,134 825 -1.3

33
The results of the 35-kN test load are also shown in Figure 4.5. As noted for previous
tests, the results should be viewed together with the crack pattern (Figure 4.4) for correct
interpretation.
When the longitudinal crack appeared (at around 1,000 repetitions), the midpoint edge
deflection and edge deflection of slab 8 close to joint 8 (right hand side of the joint) decreased
significantly. This is similar to the behavior of the HVS test on Section 519FD. It is conjectured
that an unsupported slab corner caused the initially high deflections measured at joint 8, and as
seen on Section 519FD, could probably be due to warping in the slab causing it to curl
permanently upwards.
As soon as the longitudinal crack developed, the midpoint edge deflections dropped.
This indicated that the slab came into full contact with the base and thus the deflections
decreased. These initially high deflections caused by slab curling have a significant impact on
the backcalculated subgrade support values. Higher deflections suggest a lower subgrade
support, but this is not necessarily the case.
After the longitudinal crack formed (at 1,000 repetitions), a loss in load transfer took
place across joint 8 (see Table 4.6). This loss in distributed load across the joint caused higher
corner deflections in slab 9. These high deflections stayed constant until a large corner crack
developed at approximately 50,000 load applications (see Figure 4.4), after which the deflection
decreased.

34
0
500
1,000
1,500
2,000
2,500
3,000
3,500
4,000
4,500
0 10,000 20,000 30,000 40,000 50,000 60,000 70,000
Repetitions
Def
lect
ion
(mic
rons
)
Edge midpoint, slab 8Corner, slab 7 / joint 7Corner, slab 8 / joint 7
Figure 4.5. JDMD and EDMD deflections, test load = 35 kN, Test Section 520FD.
4.2.3 Load Transfer Efficiency, Test Section 520FD
The Load Transfer Efficiency (LTE) was calculated at joint 8 of the middle slab (slab 8).
The results are summarized in Table 4.6. LTE was calculated for the HVS wheel running in both
directions across the joint.
Table 4.6 Load Transfer Efficiency, Test Section 520FDLoad Transfer Efficiency (LTE), percent
From Slab 9 to Slab 8 From Slab 8 to Slab 9Repetitions dunloaded,m × 10-6
dloaded,m × 10-6 LTE dunloaded,
m × 10-6dloaded,
m × 10-6 LTE
10 1,437 1,564 92 1,907 2,493 771,000 1,804 3,468 52 2,174 3,138 692,000 1,409 2,987 47 1,913 3,031 6340,000 1,492 4,214 35 1,396 3,298 4260,100 839* 1,194* 70* 1,121* 824* 136*
* Results not reliable

35
The damaging effect of the repetitive load is clearly visible in the joint LTE data. After
40,000 repetitions, the joint load transfer had deteriorated to such an extent that only 35 percent
of the deflection was transferred when the wheel was approaching from slab 9 (from the left) and
42 percent when the HVS wheel was approaching slab 8 (from the right).
Between 40,000 and 60,100 repetitions, additional transverse cracks developed (see
Figure 4.4). As a result of the additional transverse cracking, the middle slab (slab 8) began to
rock under the influence of the applied load, which affected the measurement of the load transfer
efficiency as seen in Table 4.6.
4.2.4 Strain Gauge Data, Test Section 520FD
Test Section 520FD was the first section on the South Tangent equipped with strain
gauges. The gauges were placed in the middle slab (slab 8), close to the edge of the slab. Two
Dynatest and two PMR gauges were installed. The placement was as described in Section 3.2
(see Figure 3.1) and is not repeated here.
The output from these gauges is recorded in microstrain and represents the strain state of
the gauges at the time of data collection. In order to calculate the change in the strain state, the
strain gauge readings should be compared to baseline readings. In the case of the HVS test on
Section 520FD, it was possible to collect strain readings during the construction of the section
before the placement of the concrete. These strain readings (15 minutes prior to concrete
placement) were used as the baseline readings and all subsequent readings during construction
(up to 7 hours after the construction) were related to this data set. Construction took place on 10
June 1998.

36
Strain readings were collected during three stages:
1. at various intervals before, during, and after the construction of the concrete layer;
2. before, during, and after the HVS was moved onto Test Section 520FD, and
3. during the accelerated trafficking of the test section, after a prescribed number of
applied load applications.
It was decided to collect data during stage 2 because there was a concern that the weight
of the HVS on the thin 100-mm concrete section might influence the strain state of the various
gauges. Another factor, likely to influence the strain state, was the drop in temperature due to the
controlled temperature chamber placed on the section. It was therefore decided to collect strain
data from just after the temperature control chamber was erected until the temperature inside the
control chamber stabilized.
Between construction (10 June 1998) and the starting time of the HVS test on Section
520FD (23 July 1998), some change in the strain readings was observed, probably due to
shrinkage. Because of this, another set of baseline readings were taken just before the HVS was
positioned on Test Section 520FD. Static strain readings, without the influence of any load on
the section, were also recorded during the test. The strain data of stages 1 to 3 are presented in
Tables 4.7 and 4.8. The surface temperature during time of data collection is also given in the
tables.
The strain gauges were wired so that tensile strains have positive values and compression
strains have negative values.
Data collected from PMR-X (parallel to HVS traffic at mid-span) was not reliable and is
therefore not presented. The behavior of the strain gauges immediately after placement of the

Table 4.7 Strain Gauge Data Before, During, and After Concrete Construction, Test Section 520FDMidspan Strain Gauges (microstrain) Corner Strain Gauges (microstrain)
PMR PMRStage Time (min.) DynatestBottom X: Top
ParallelM: Top45 Deg.
Y: TopPerpendicular
DynatestBottom X: Top
ParallelM: Top45 Deg.
Y: TopPerpendicular
SurfaceTemp.(°C)
15 min. before -15:00 0 0 0 0 0 0 0 0 19.01 min after 1 25 -119 -110 -107 17 -65 -66 -57 19.05 min after 5 39 -88 -78 -73 14 -58 -57 -53 22.030 min after 30 -17 194 155 137 -15 170 158 159 23.645 min after 45 -147 270 124 -12 -230 276 180 56 25.81 hour after 60 -132 268 116 -28 -301 277 168 15 25.82 hours after 120 -48 295 150 -17 -186 283 164 4 27.03 hours after 180 -43 285 160 -24 -173 192 91 -10 30.06 hours after 360 33 343 217 2 -127 185 105 9 22.07 hours after 420 21 360 213 -48 -152 158 76 -26
37

Table 4.8 Strain Gauge Data Before, During, and After the HVS Was Positioned on Section, Test Section 520FDMidspan Strain Gauges (microstrain) Corner Strain Gauges (microstrain)
PMR PMRStage Time(dd:hh:mm) Dynatest
Bottom X: TopParallel
M: Top45 Deg.
Y: TopPerpendicular
DynatestBottom X: Top
ParallelM: Top45 Deg.
Y: TopPerpendicular
SurfaceTemp.(°C)
Before HVS moved 00:10:40 0 0 0 0 0 0 0 32.0while moving 00:11:10 -25 13 -11 -207 -24 96 35.0while moving II 00:11:11 -26 9 -14 -207 -40 93 37.0after HVS moved 01:11:14 -29 8 -17 -209 -21 84 39.0
01:11:35 -56 -20 10 -21 14 -29 -121 24.001:12:30 -56 -43 -10 20 20 -38 -172 21.701:13:44 -62 -53 -16 44 21 -46 -178 21.501:14:54 -52 -51 -14 74 23 -48 -183 21.4
Cooling down undertemperature control
01:15:38 -37 -65 -18 70 27 -66 -185 21.6Repetitions10 81 -12 119 15 128 89 -135 18.01,000 -30 -54 59 42 -136 -124 -272 18.42,000 26 -89 113 -46 -2 -8 -226 18.15,769 29 -1 166 91 51 31 -161 17.625,190 40 17 183 91 164 131 -208 19.740,000 49 -6 180 257 196 154 -198 19.3
HVS trafficking of TestSection 520FD
55,500 48 -20 166 282 219 218 -307 21.1Note: Missing data due to non-functioning instrument at time of data collection.
38

39
concrete is complicated by a number of factors. First, the gauges will not record any shrinkage or
expansion until the concrete has set and hardened sufficiently to force the ends of the gauge to
move with the concrete. Secondly, the concrete will expand as it heats (because if the
exothermic reaction and from the heat of the day), and will contract when it cools (at night and
after the reaction slows down). The final aspect is the permanent drying shrinkage in the slab.
This shrinkage is more severe at the top of the slab than at the bottom because the top is exposed
to wind, sunlight, and lower humidity.
Because of the complexity of the response during and immediately after construction, it is
difficult to separate the various aspects of the concrete behavior. There appears to be a shift in
the data at between 30 minutes and 2 hours after construction, which is probably caused by the
concrete setting during this time range. However, it can be seen that the parallel strains at the top
of the slab are higher than those at the bottom, indicating the development of a shrinkage
gradient, and therefore tension at the top of the slab. It is not possible to distinguish the
component of the average shrinkage through the slab that is caused by shrinkage from that caused
by cooling, as both are occurring simultaneously.
The second set of data collection took place just before the HVS was moved on to the
section on 23 July 1998. From the data presented in Table 4.8, it is clear that the weight of the
HVS on the section did not influence the strain readings of the various gauges significantly (refer
to the first block of data in Table 4.8). The surface temperature during this phase was around
39°C.
After the temperature control box was erected, the air temperature was cooled down to
the desired level (20°C ± 7°C) and various strain readings were taken. The effect of the drop in
temperature inside the box did not cause a consistent change in all the gauges. It seems as if the

40
surface of the concrete cooled down at a faster rate than the bottom of the concrete slab. This
caused some upward curling, which caused some of the upper gauges to go further into
compression and some of the bottom gauges to go into tension. However, this behavior was not
consistently observed throughout all the gauges.
After the desired temperature was reached and before the start of HVS trafficking, some
additional strain change was observed (as presented in Table 4.8). Although some variations
occurred, the static strains stayed fairly constant throughout the test while the surface temperature
was kept fairly constant (between 18 and 19°C). The variations in the strain reading might be
due to the size of the cool box. The box itself does not cover the whole slab, rather only the
section directly beneath the HVS. It is very likely that temperature variation outside the
controlled area influenced the strain readings as observed in Table 4.8 (2).
The dynamic strain response of the gauges is presented in Table 4.9. The data given are
the maximum tensile and compressive strains recorded while the 25-kN wheel moved over the
test section. As expected, the dynamic load caused the gauges to go through phases of tensile
and compressive strain (see Figure 3.3).
4.3 Test Section 521FD
HVS Test Section 521FD was completed on slabs 11, 12 and 13 on the South Tangent,
with the 8 × 1 m HVS test section located so that slab 12 (total length of 5.8 m) was fully tested
along its edge. This section was the final 100-mm FSHCC test pavement and was conducted
with the temperature control chamber in operation.

41
Table 4.9 Elastic Strain Results, Test Load = 25 kN, Test Section 520FDMaximum Strain Recorded with a 25-kN Load
(microstrain)Instrument Type, Placement, andOrientation Repetitions
10 2,000 25,190 55,000 60,100
Dynatest Bottom Tensile (+)Compression (-)
29-2
18-3
18-4
17-4
23-3
X: parallel Tensile (+)Compression (-)
Data unreliable (readings from zero to more than2,000 microstrain)
M: 45 degree Tensile (+)Compression (-)
26-25
17-17
15-18
13-22
18-20
MidspanStrainGauges PMR
Top
Y: perpendicular Tensile (+)Compression (-)
11-1
12-2
12-1
9-3
13-1
Dynatest bottom Tensile (+)Compression (-)
16-14
32-2
55-2
45-4
438-4
X: parallel Tensile (+)Compression (-)
552-364
414-194
441-185
507-186
386-4
M: 45 degree Tensile (+)Compression (-)
429-143
358-24
375-55
428-88
256-14
CornerStrainGauges PMR
Top
Y: perpendicular Tensile (+)Compression (-)
42-46
60-12
46-16
34-24
185-9
Temperature (°C) 17.9 18.1 19.7 18.5 17.4Note: Shaded data sets have been included for completeness. The apparent high (unrealistic)tensile strains may be attributable to physical bridging of micro-cracks by the gauge.
The HVS dual wheel load was started at 20 kN instead of the higher 25 kN and 35 kN
wheel loads used in Tests 519FD and 520FD. The frequency of data collection was also
increased compared with these earlier tests (see Table 3.1). After 157,719 repetitions the load
was increased to 80 kN to monitor the progression of deterioration at this higher wheel. The test
was completed after 168,319 load applications.
4.3.1 Visual Observations, Test Section 521FD
An overhead photo of the entire section with cracks can be seen in Photograph 4.12;
crack development is presented in Figure 4.6. Apart from a small corner crack at joint 12, the
complete 8-m long test section was free of any cracks prior to the start of the test (see Photograph
4.13). The crack growth pattern for Test Section 521FD was somewhat different from those
observed on Sections 519FD and 520FD (compare Figure 4.1 and 4.4 to Figure 4.6).

42
A short longitudinal crack appeared about 770 mm outside the test section after 500
repetitions (Photograph 4.14). This crack progressed towards the test pad and ended up as a
corner crack after about 1,000 repetitions (see Photograph 4.15). A longitudinal crack similar to
those seen on Sections 519FD and 520FD appeared after 142,072 load applications. A corner
crack and some additional transverse cracks appeared after 157,719 repetitions (see Photographs
4.16). The final crack pattern can be seen in Photograph 4.17.
4.3.2 JDMD and EDMD Data, Test Section 521FD
Two Joint Displacement Monitoring Devices (JDMD) were placed on either side of Joint
11 and one Edge Displacement Monitoring Device (EDMD) was placed at the midpoint edge of
the middle slab (slab 12). The results are summarized in Table 4.10, for the 20kN test load, and
displayed in Figure 4.7.
During the first part of the test (0�140,000 repetitions), the deflections stayed relatively
constant, the midpoint edge deflection being about 1.8 mm and the joint deflection around 5.3
mm and 4.2 mm on each side of joint 11. The initial cracking at joint 12 did not affect the
deflections at the midpoint edge of slab 12 and joint 11. However, this would be considered
structural failure in the analysis.
These corner and edge deflections are high for such a small load (20 kN). The most
likely explanation is that the edge of the concrete slab, similar to the slabs in the two previous
tests (519FD and 520FD), was permanently curled upwards from the initial construction. After
142,072 repetitions, a longitudinal crack about 1,200 mm from the edge appeared (see Figure
4.6) which caused the edge of the slab to come into full contact with the base. The final position
of the tested slab with respect to the asphalt concrete shoulder is shown in Photograph 4.17.

Photograph 4.12. Composite photograph of final crack pattern, Test Section 521.
43
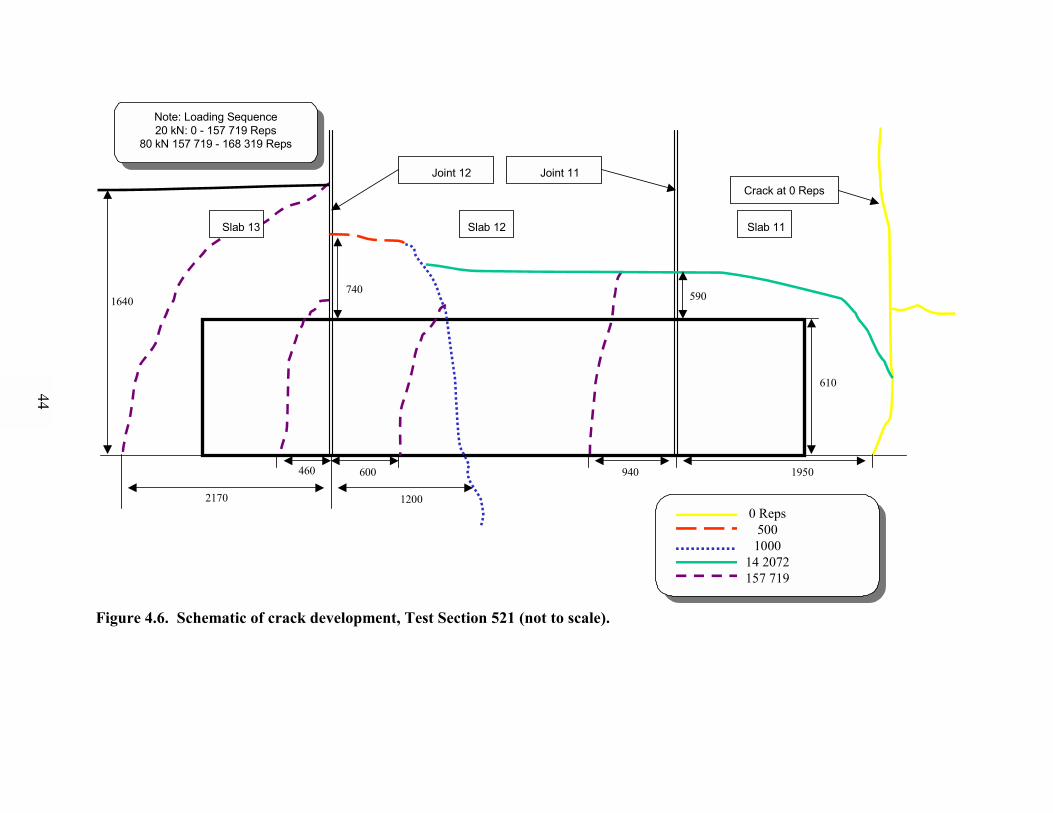
Joint 12 Joint 11
1640
0 Reps500
100014 2072157 719
0 Reps5001000
14 2072157 719
2170
460
1200
600
740
940
590
1950
610
Crack at 0 Reps
Note: Loading Sequence20 kN: 0 - 157 719 Reps
80 kN 157 719 - 168 319 Reps
Note: Loading Sequence20 kN: 0 - 157 719 Reps
80 kN 157 719 - 168 319 Reps
Slab 13 Slab 12 Slab 11
Figure 4.6. Schematic of crack development, Test Section 521 (not to scale).
44

45
Photograph 4.13. Section at beginning of test, Test Section 521FD.
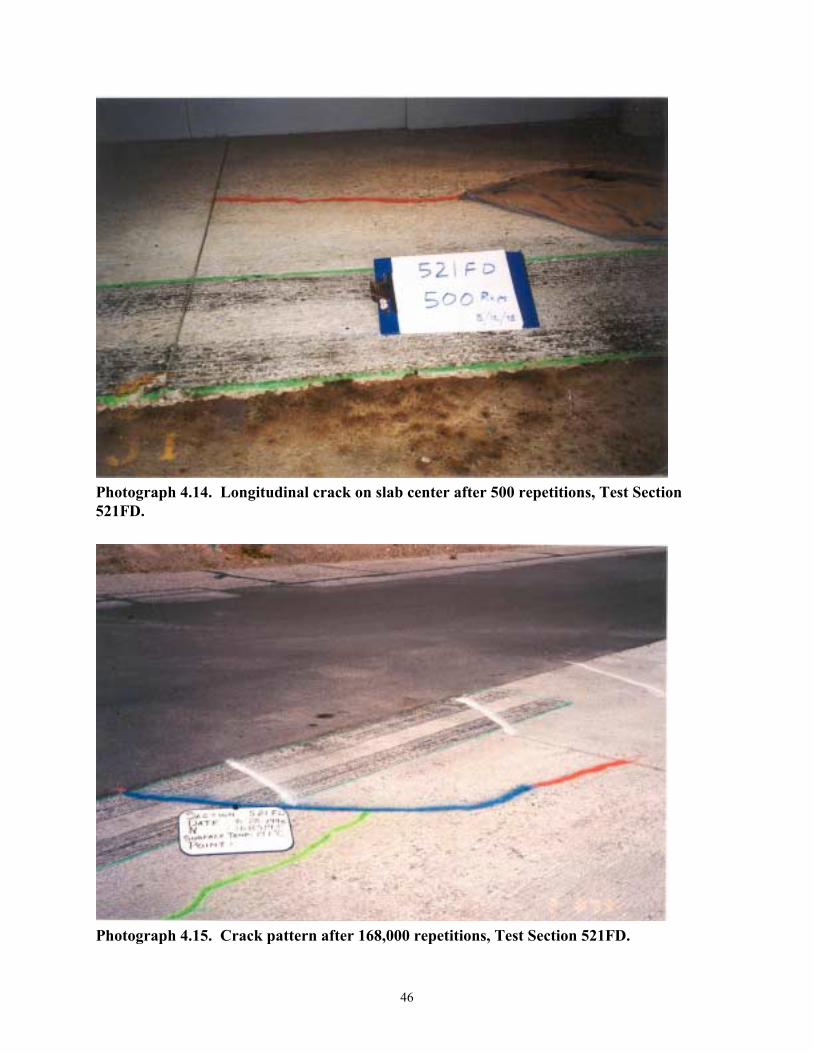
46
Photograph 4.14. Longitudinal crack on slab center after 500 repetitions, Test Section521FD.
Photograph 4.15. Crack pattern after 168,000 repetitions, Test Section 521FD.

47
Photograph 4.16. Corner cracks at joint after 157,000 repetitions, Test Section 521FD.
Photograph 4.17. Final Crack pattern after 168,319 repetitions, Test Section 521FD.

48
Table 4.10 EDMD and JDMD Deflections, Test load = 20 kN, Test Section 521FDDeflection (m × 10-6)
Corner, Joint 11Repetitions MidpointEdge, Slab 12 Slab 12 Side Slab 11 Side
TemperatureDifference(top-bottom), °C
10 1,700 4,228 3,654 -1.3500 1,767 4,205 3,514 NA1,000 2,140 4,962 4,382 NA5,000 1,728 4,409 3,420 -1.310,000 1,911 4,448 4,119 -0.820,000 1,809 4,445 3,555 NA30,000 1,935 4,802 3,836 NA`40,000 2,142 5,192 4,249 -0.450,000 1,926 5,122 3,962 -0.9106,000 2,038 5,411 4,306 -0.5125,000 ** 5,390 4,162 -1.6140,000 2,109 5,436 4,169 -0.8157,719 718 674 2,263 -0.5168,319 684 683 2,028 -0.2** No data recorded
0
500
1,000
1,500
2,000
2,500
3,000
3,500
4,000
4,500
5,000
5,500
6,000
0 20,000 40,000 60,000 80,000 100,000 120,000 140,000 160,000 180,000
Repetitions
Def
lect
ion
(mic
rons
)
Midpoint edge, slab 12Corner, slab 11 / joint 11Corner, slab 12 / joint 11
Figure 4.7. JDMD and EDMD deflections, test load = 20 kN, Test Section 521FD.

49
4.3.3 MDD Elastic Deflection Data, Test Section 521FD
Two MDDs were installed in the HVS wheelpath on Test Section 521FD, one at the
midpoint of slab 12 (MDD4), and the other at the right hand side of joint 11 (MDD12, see
Photographs 4.13 and 4.17). Both were installed between the contact areas for the HVS dual
wheels, 300 mm from the edge of the slab. For both MDD installations, deflection-monitoring
modules were installed at a depth of 50 mm (in the concrete slab), at a depth of 250 mm (bottom
of the
base course) and at a depth of 425 mm (bottom of the aggregate subbase). The results of the
peak MDD deflections can be seen in Table 4.11 and in Figure 4.8
The deflection trend is similar to that of the deflections measured by the JDMDs (see
Table 4.10): a relatively constant phase (0-140,000 repetitions) followed by a significant decrease
in the deflection occurring in the concrete slab once the load was increased and additional
cracking occurred. The deflections measured by the MDD are lower than those recorded by the
JDMDs and EDMD, but were located 305 mm from the edge of the pavement, in contrast to the
JDMDs and EDMD, which were placed at the edge.
An important observation is that the deflections of the base course (MDDs at 250 and 425
mm depth) were close to zero during the first phase of testing (0�140,000 repetitions). This
observation indicates that surface deflections originated from the 100-mm concrete slab and very
little of the total surface deflection was transferred down to the deeper layers.
The very high elastic joint edge deflection (e.g., at MDD12, deflections of over 2,800
microns were recorded) gives more credence to the theory of a cavity between the concrete and
the base course due to warping. It is conjectured that the slab was lifted off the ground so much
that the effect of the deflection in the concrete was to make the slab plane with the ground

50
Table 4.11 MDD Deflections, Test Load = 20 kN, Test Section 521FDIn-depth Deflections at Depths as Indicated (m × 10-6)
Wheelpath, LongitudinalMidpoint Slab 12 Joint 11Repetitions
50 mm 425 mm 50 mm 250 mm 425 mm10 1,171 19 2,191 39 141,000 1,198 24 2,380 52 212,105 1,482 32 3,015 81 365,000 1,325 23 2,356 67 3210,000 1,326 31 2,758 91 4420,000 1,422 48 2,482 101 5530,000 1,529 35 2,657 68 3140,000 1,529 25 2,812 66 2950,000 1,408 20 2,767 42 14106,000 1,440 22 2,880 46 17125,000 1,470 25 2,812 50 21140,000 1,501 25 2,816 60 28157,719 412 121 1,379 317 209168,319 394 * 1,312 369 252*Recorded data not reliable
0
500
1,000
1,500
2,000
2,500
3,000
0 20,000 40,000 60,000 80,000 100,000 120,000 140,000 160,000
Repetitions
Def
lect
ion
(mic
rons
)
MDD 4: 50 mmMDD 4: 425 mmMDD 12: 50 mmMDD12: 425mm
Figure 4.8. MDD deflections, test load = 20 kN, Test Section 521FD.

51
without mobilizing any significant deflection in the base layer. This would cause a very large
stress in the slab corner.
After the longitudinal crack appeared at 142,072 repetitions (see Figure 4.6), the cavity
closed and the concrete slab came in full contact with the base layer. This caused the surface
deflections to decrease and mobilized deflections in the base layer as seen by the significant
increase in deflections of the deeper layers from this point onwards.
Due to the unsupported nature of the slabs, a cantilever condition was present which
supports the cracking observed at the corner. Heath et al. (4) found that the maximum stress in
an edge-loaded slab is at the corner once the differential shrinkage strain exceeds 50
microstrain.(4)
4.3.4 MDD Permanent Deformation Data, Test Section 521FD
The permanent deformation of the upper part of the pavement was measured using the
same MDDs. Permanent deformations at depths of 50, 250, and 425 mm were recorded and the
results presented in Table 4.12 and Figure 4.9.
Table 4.12 MDD Permanent Deformation Data, Test Section 521FDIn-depth Deflections at Depths as Indicated (m × 10-6)
Wheelpath, LongitudinalMidpoint Slab 12 Joint 11Repetitions
50 mm 425 mm 50 mm 250 mm 425 mm10 0 0 0 0 01,000 284 22 240 -33 -382,105 374 16 53 -37 -4430,000 527 -67 581 -62 -9140,000 474 -70 427 -80 -10850,000 418 -71 355 -61 -93106,000 461 -90 197 -67 -98125,000 509 -77 295 -69 -101140,000 531 -79 364 -60 -96157,719 3,407 113 4,173 560 235168,319 3,677 331 4,724 813 405
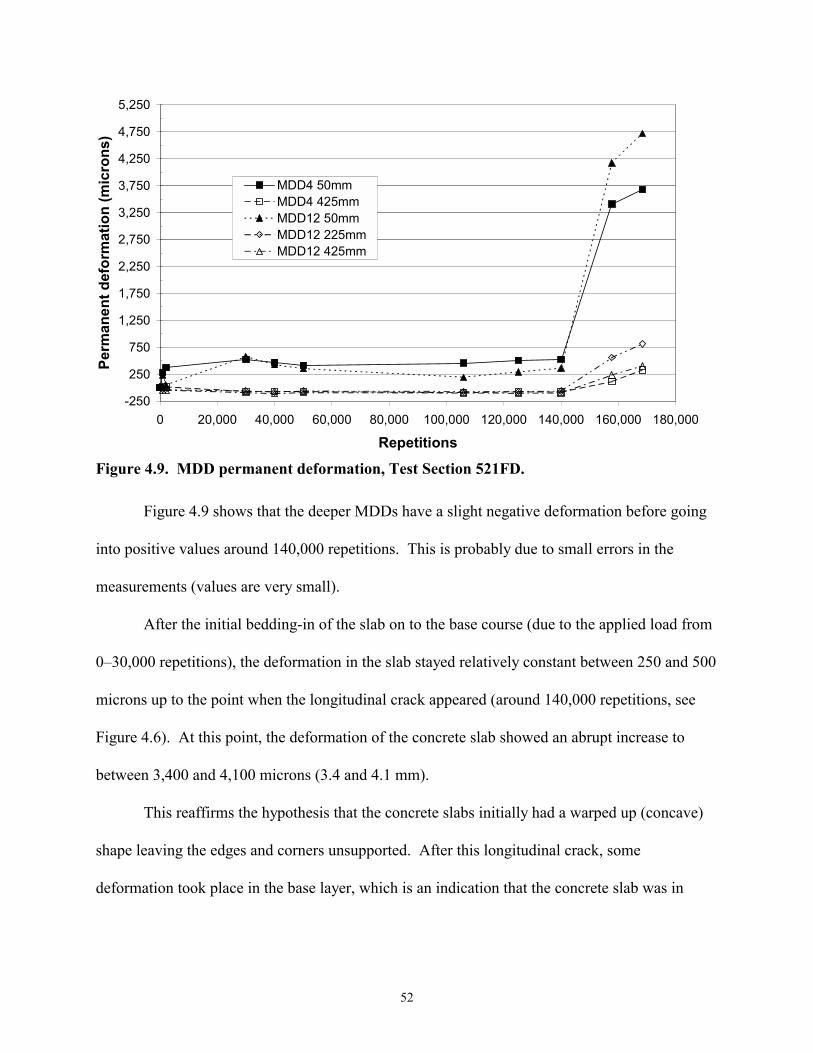
52
-250
250
750
1,250
1,750
2,250
2,750
3,250
3,750
4,250
4,750
5,250
0 20,000 40,000 60,000 80,000 100,000 120,000 140,000 160,000 180,000
Repetitions
Perm
anen
t def
orm
atio
n (m
icro
ns)
MDD4 50mmMDD4 425mmMDD12 50mmMDD12 225mmMDD12 425mm
Figure 4.9. MDD permanent deformation, Test Section 521FD.
Figure 4.9 shows that the deeper MDDs have a slight negative deformation before going
into positive values around 140,000 repetitions. This is probably due to small errors in the
measurements (values are very small).
After the initial bedding-in of the slab on to the base course (due to the applied load from
0�30,000 repetitions), the deformation in the slab stayed relatively constant between 250 and 500
microns up to the point when the longitudinal crack appeared (around 140,000 repetitions, see
Figure 4.6). At this point, the deformation of the concrete slab showed an abrupt increase to
between 3,400 and 4,100 microns (3.4 and 4.1 mm).
This reaffirms the hypothesis that the concrete slabs initially had a warped up (concave)
shape leaving the edges and corners unsupported. After this longitudinal crack, some
deformation took place in the base layer, which is an indication that the concrete slab was in
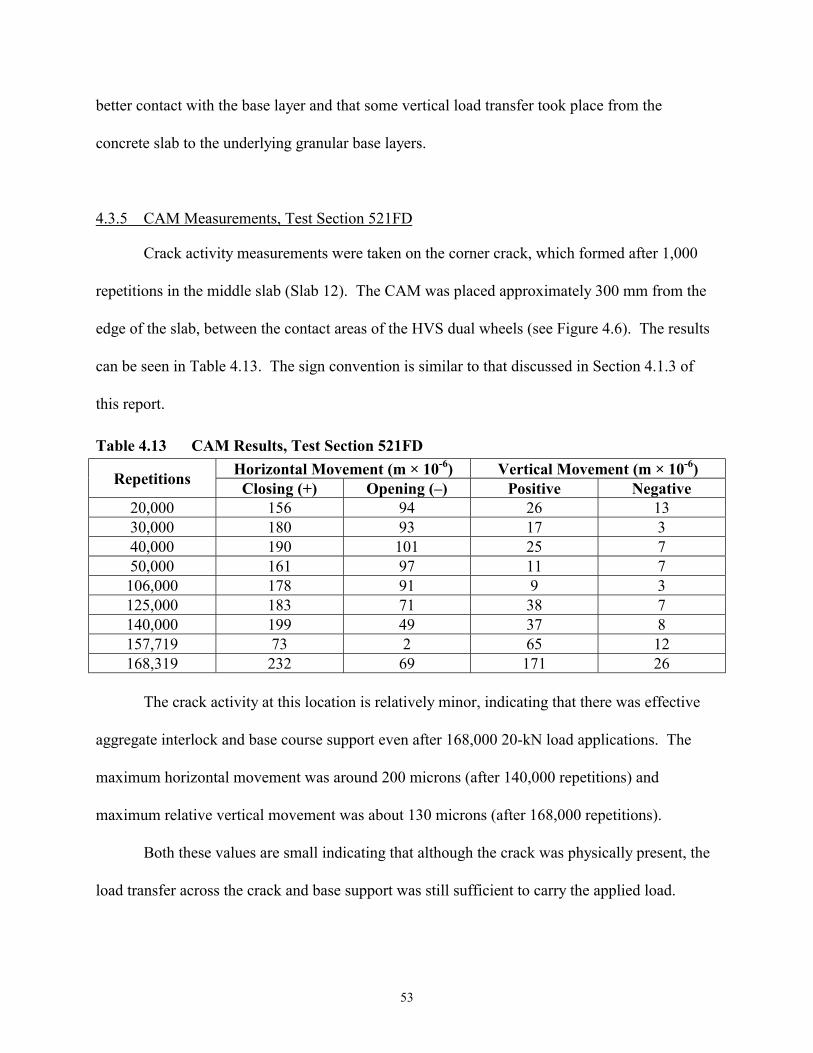
53
better contact with the base layer and that some vertical load transfer took place from the
concrete slab to the underlying granular base layers.
4.3.5 CAM Measurements, Test Section 521FD
Crack activity measurements were taken on the corner crack, which formed after 1,000
repetitions in the middle slab (Slab 12). The CAM was placed approximately 300 mm from the
edge of the slab, between the contact areas of the HVS dual wheels (see Figure 4.6). The results
can be seen in Table 4.13. The sign convention is similar to that discussed in Section 4.1.3 of
this report.
Table 4.13 CAM Results, Test Section 521FDHorizontal Movement (m × 10-6) Vertical Movement (m × 10-6)Repetitions Closing (+) Opening (�) Positive Negative
20,000 156 94 26 1330,000 180 93 17 340,000 190 101 25 750,000 161 97 11 7106,000 178 91 9 3125,000 183 71 38 7140,000 199 49 37 8157,719 73 2 65 12168,319 232 69 171 26
The crack activity at this location is relatively minor, indicating that there was effective
aggregate interlock and base course support even after 168,000 20-kN load applications. The
maximum horizontal movement was around 200 microns (after 140,000 repetitions) and
maximum relative vertical movement was about 130 microns (after 168,000 repetitions).
Both these values are small indicating that although the crack was physically present, the
load transfer across the crack and base support was still sufficient to carry the applied load.
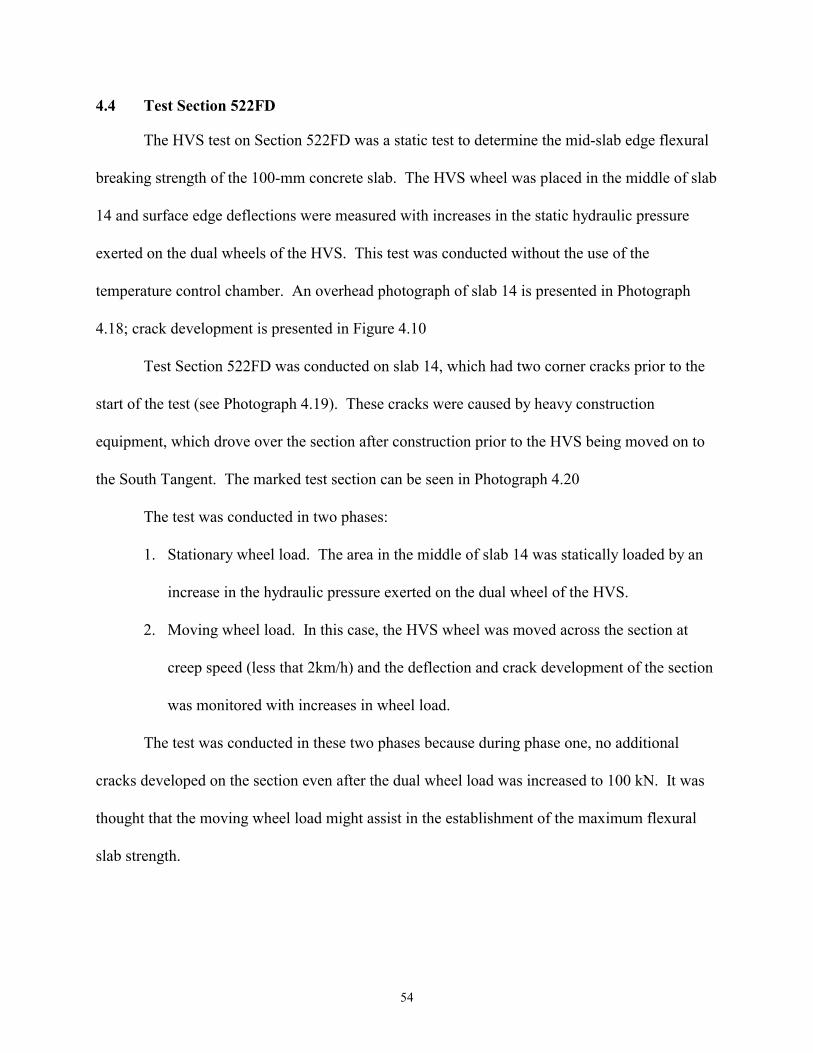
54
4.4 Test Section 522FD
The HVS test on Section 522FD was a static test to determine the mid-slab edge flexural
breaking strength of the 100-mm concrete slab. The HVS wheel was placed in the middle of slab
14 and surface edge deflections were measured with increases in the static hydraulic pressure
exerted on the dual wheels of the HVS. This test was conducted without the use of the
temperature control chamber. An overhead photograph of slab 14 is presented in Photograph
4.18; crack development is presented in Figure 4.10
Test Section 522FD was conducted on slab 14, which had two corner cracks prior to the
start of the test (see Photograph 4.19). These cracks were caused by heavy construction
equipment, which drove over the section after construction prior to the HVS being moved on to
the South Tangent. The marked test section can be seen in Photograph 4.20
The test was conducted in two phases:
1. Stationary wheel load. The area in the middle of slab 14 was statically loaded by an
increase in the hydraulic pressure exerted on the dual wheel of the HVS.
2. Moving wheel load. In this case, the HVS wheel was moved across the section at
creep speed (less that 2km/h) and the deflection and crack development of the section
was monitored with increases in wheel load.
The test was conducted in these two phases because during phase one, no additional
cracks developed on the section even after the dual wheel load was increased to 100 kN. It was
thought that the moving wheel load might assist in the establishment of the maximum flexural
slab strength.
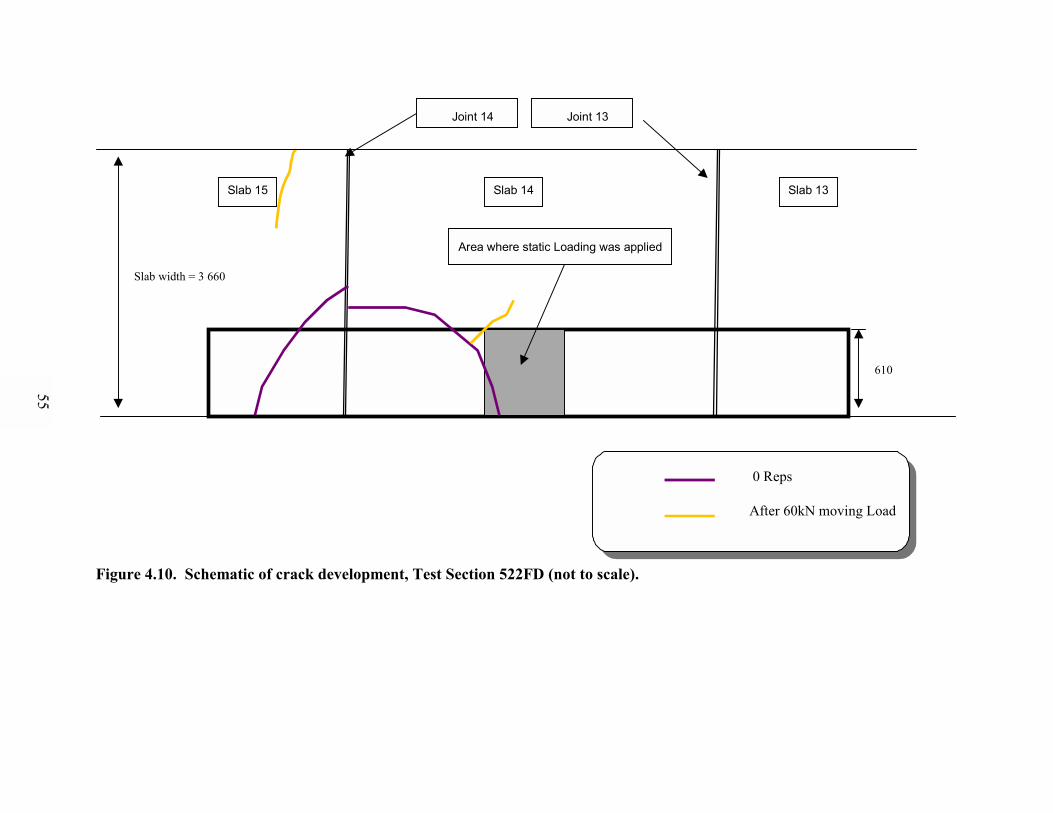
Joint 14 Joint 13
610
Slab width = 3 660
Area where static Loading was applied
Slab 15 Slab 14 Slab 13
0 Reps
After 60kN moving Load
0 Reps
After 60kN moving Load
Figure 4.10. Schematic of crack development, Test Section 522FD (not to scale).
55

56
Photograph 4.18. Photograph of final crack pattern, Test Section 522FD.
Photograph 4.19. Crack pattern prior to HVS testing, Test Section 522FD.

57
Photograph 4.20. Position of static test, Test Section 522FD.
One EDMD was used to record the elastic deflections at the edge caused by the various
load cases (Photograph 4.20) and the results are presented in Table 4.14 and Figure 4.11. The
moving wheel test was only conducted to a maximum load of 60 kN.
Even with the application of a heavy load (100 kN) and high elastic edge deflections (3.3
mm), no additional cracks developed under the static load. The moving wheel caused higher
deflections compared to the static case. After some applications of a 60-kN moving wheel two
small cracks developed, one starting outside the trafficked area on slab 14 and one transverse
crack on the untrafficked edge of the adjacent slab (slab 15). The final crack pattern can be seen
in Photographs 4.18 and 4.20.
The flexural strength of the FSHCC at 90 days was approximately 5 MPa (2). A finite
element analysis for a slab 100 mm thick indicated that the slab should crack under a load of
approximately 25 kN.

58
Table 4.14 Elastic Edge Deflections at a Range of Loads, Test Section 522FDEdge Deflection (m × 10-6) at
Type of LoadLoad (kN)Static Moving Wheel
Temperature Difference(top � bottom), °C
20 1,552 1,808 5.525 1,556 1,926 7.530 1,614 2,115 7.735 1,683 2,322 8.140 1,694 2,469 8.145 1,819 2,538 8.350 1,942 8.455 2,095 2,585 8.560 2,232 2,673 8.765 2,426 8.970 2,584 9.375 2,725 9.280 2,855 9.585 2,972 9.690 3,075 9.995 3,197.7 9.7100 3,339.7 9.3
0250500750
1,0001,2501,5001,7502,0002,2502,5002,7503,0003,2503,500
20 30 40 50 60 70 80 90 100
Load (kN)
Edge
def
lect
ion
(mic
rons
)
Static Wheel
Moving Wheel
Figure 4.11. Elastic deflections at slab edge, Test Section 522FD.

59
This field test revealed a significantly higher load could be supported without the slab
cracking, which indicates that the bending stress in the slab was substantially reduced due to the
support from the underlying layers.
4.5 Test Section 523FD
The HVS test on Test Section 523FD was the first test on the 150-mm concrete slabs.
The main objective of this series of tests was to evaluate the fatigue behavior of 150-mm thick
Fast Setting Hydraulic Cement Concrete (FSHCC) on an aggregate base under the influence of
bi-directional accelerated wheel loads with a temperature control box around the tested area and
only dry conditions. This section has no dowel bars, tie bars or a widened lane. The results of
these fatigue tests will be compared to the fatigue tests on 100- and 200-mm slabs on the same
aggregate base.
The slab widths were 3.7 m with variable joint spacing from 3.7 m to 5.8 m. All the test
sections on the South Tangent have 150-mm thick Class 2 aggregate base resting on a compacted
granular subgrade. Sections have perpendicular transverse joints with the slab size matching the
existing adjacent slabs.
4.5.1 Visual Observations, Test Section 523FD
Photograph 4.21 shows an overhead view of the test section and crack pattern. Figure
4.12 shows crack development for Section 523FD. Several cracks existed before trafficking
began (see Photograph 4.22). The first crack under applied loading appeared at 89,963
repetitions on slab number 17 as a corner crack and as a longitudinal crack on slab number 16
(Photograph 4.23).

Photograph 4.21. Composite photograph of final crack pattern, Test Section 523FD.
60

Joint 17 Joint 16
610
Slab width = 3 660
Note: Loading Sequence
45 kN: 0 - 151 151 Reps
Note: Loading Sequence
45 kN: 0 - 151 151 Reps
0 Reps500
89 963
0 Reps500
89 963
2 000
1 580
Slab 18 Slab 17 Slab 16
Figure 4.12. Schematic of crack development, Test Section 523FD (not to scale).
61
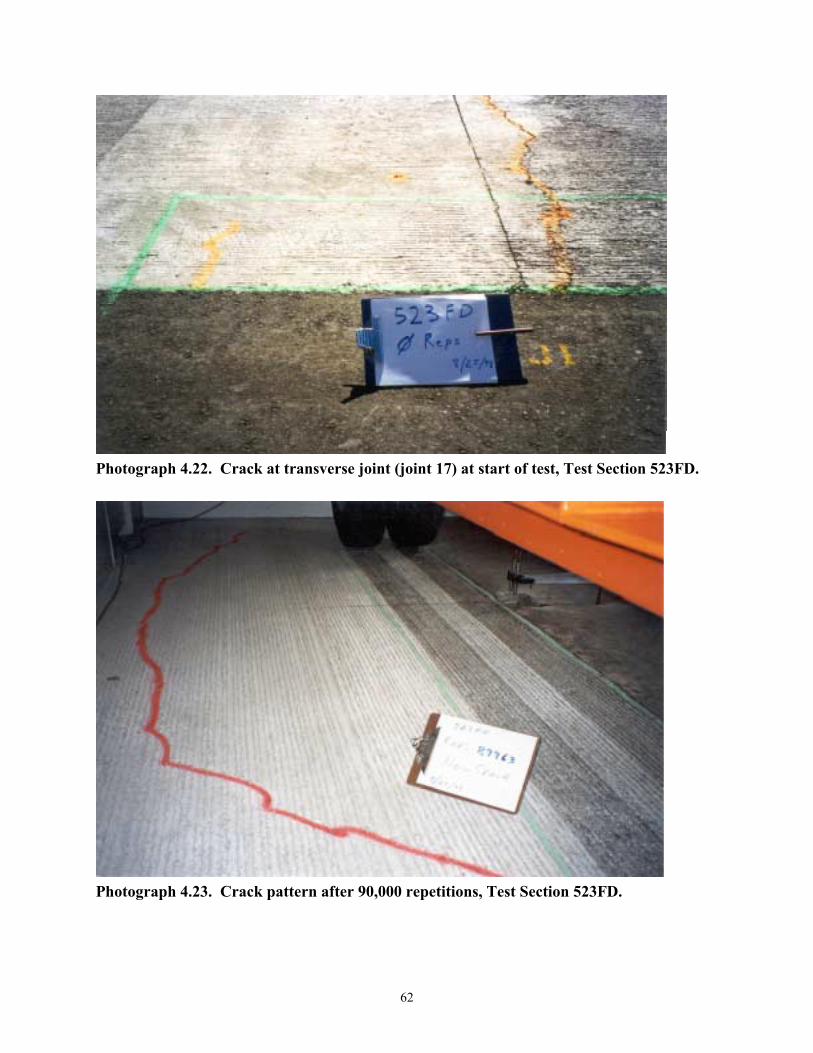
62
Photograph 4.22. Crack at transverse joint (joint 17) at start of test, Test Section 523FD.
Photograph 4.23. Crack pattern after 90,000 repetitions, Test Section 523FD.

63
4.5.2 JDMD and EDMD Data, Test Section 523FD
Tables 4.15 to 4.18 summarize the results of the maximum elastic deflection at the mid-
slab edge of slab 17, as well as the maximum corner deflections on either side of joint 16. Table
4.19 summarizes the permanent deformations occurring at the edge and corner of the slab.
Tables 4.15 to 4.17 show deflection data for when the HVS wheel is running in each direction
across the joint. In terms of maximum mid-slab deflection, wheel direction does not seem to
make a difference.
Table 4.18 and Figure 4.13 are the average displacements at the edge and slab corner over
the loading history of Test Section 523FD. The corner displacements show a gradual increase
with load repetitions until around 90,000 repetitions when the first crack appeared on slab
numbers 16 and 17. Once this transverse crack appeared and propagated to the joint, the
displacements at the slab corner decreased significantly. The edge deflections steadily increased
throughout the test but were not affected by the corner crack.
The most likely reason that the corner displacements decreased once the crack developed
was that the slab settled onto the base and was more fully supported. The edge of the slab was
probably curled up throughout the test and was never in full contact with the base and therefore
the deflection never decreased after first cracking. After first cracking the corner and edge
displacements were not very sensitive to additional repetitions by the 45-kN wheel load.
When comparing the corner deflections at joint 16 from Table 4.18, there is a difference
between the displacements even though the LVDTs are only 50 mm apart. This is evidenced by
the relatively high coefficient of variation between the corner deflection measurements. The
displacement on the slab 16 side of joint 16 was greater than that measured on the slab 17 side
(left-hand side) until the first crack developed. After the corner crack formed on slab 17 and a

64
Table 4.15 Midpoint Edge Deflections under a 45-kN Wheel Load, Test Section 523FDMidpoint Edge Deflections, Slab 17 (m × 10-6)
Load DirectionRepetitions
FromSlab 18
FromSlab 16
Avg. Std.Dev.
C.O.V.(%)
TemperatureDifference
(Top � Bottom), °C
10 637 624 631 8.6 1.4 NA100 665 685 675 14.4 2.1 -2.0500 667 694 681 18.8 2.8 -2.0
1,000 664 655 660 6.6 1.0 -2.05,000 816 846 831 21.2 2.6 -1.010,000 702 780 741 55.1 7.4 -0.415,000 880 895 887 10.0 1.0 -1.020,000 694 680 687 9.8 1.4 -0.430,000 869 874 842 3.5 0.4 -1.340,000 883 911 897 20.0 2.2 -0.650,000 932 946 939 10.1 1.1 -0.360,000 936 951 943 11.0 1.2 -0.670,000 959 962 961 2.7 0.3 -1.089,963 970 974 972 3.0 0.3 -0.7133,148 1,025 1,040 1,032 10.6 1.0 -0.7151,151 1,015 1,041 1,028 19.0 1.9 -0.5
Table 4.16 Corner Deflections under a 45-kN Wheel Load, Slab 17, Test Section 523FDCorner Deflections, Slab 17/Joint 16 (m × 10-6)
Load DirectionRepetitions FromSlab 17
FromSlab 16
Avg. Std.Dev.
C.O.V.(%)
TemperatureDifference
(Top � Bottom), °C
10 1,974 1,785 1,880 133.4 7.1 NA100 2,145 2,116 2,131 21 1 -2.0500 2,129 2,114 2,122 10.2 0.5 -2.0
1,000 2,213 2,176 2,194 26.2 1.2 -2.05,000 2,746 2,730 2,738 11.3 0.4 -1.010,000 2,600 2,586 2,593 9.8 0.4 -0.415,000 3,023 3,015 3,019 5.9 0.2 -1.020,000 2,618 2,619 2,618 0.5 0 -0.430,000 2,955 2,949 2,952 4.5 0.2 -1.3640,000 3,079 3,076 3,078 2.4 0.1 -0.650,000 3,224 3,229 3,226 3.4 0.1 -0.360,000 3,304 3,317 3,310 8.8 0.3 -0.670,000 3,333 3,342 3,337 5.9 0.2 -1.089,963 2,080 2,104 2,092 16.7 0.8 -0.7133,148 2,147 2,151 2,149 2.5 0.1 -0.7151,151 2,237 2,249 2,243 8.8 0.4 -0.5

65
Table 4.17 Corner Deflections under a 45-kN Wheel Load, Slab 16, Test Section 523FDCorner Deflections, Slab 16/Joint 16 (m × 10-6)
Load DirectionRepetitions FromSlab 17
FromSlab 16
Avg. Std.Dev.
C.O.V.(%)
TemperatureDifference
(Top � Bottom), °C
10 2,306 1,958 2,132 245.9 11.5 NA100 2,623 2,594 2,609 20.5 0.8 -2.0500 2,625 2,622 2,624 2 0.1 -2.0
1,000 2,691 2,958 2,674 23.2 0.9 -2.05,000 3,185 3,190 3,188 3.9 0.1 -1.010,000 3,092 3,067 3,080 17.5 0.6 -0.415,000 3,376 3,368 3,372 5.3 0.2 -1.020,000 2,958 2,933 2,946 176 0.6 -0.430,000 3,243 3,223 3,233 13.9 0.4 -1.340,000 3,343 3,350 3,347 4.8 0.1 -0.650,000 3,491 3,495 3,493 3.3 0.1 -0.360,000 3,595 3,591 3,593 3 0.1 -0.670,000 3,599 3,597 3,598 1.5 0 -1.089,963 1,607 1,610 1,660 2 0.1 -0.7133,148 1,661 1,658 1,660 2 0.1 -0.7151,151 1,582 1,584 1,583 0.9 0.1 -0.5
Table 4.18 Average of all Deflections under a 45-kN Wheel Load, Test Section 523FDDeflections (m × 10-6)
Repetitions MidpointEdge,Slab 17
CornerSlab 17/Joint 16
CornerSlab 16/Joint 16
Std.Dev.
C.O.V.(%)
TemperatureDifference
(Top � Bottom),°C
10 631 1,880 2,132 218 10.8 NA100 675 2,131 2,609 277 11.7 -2.0500 681 2,122 2,624 290 12.2 -2.0
1,000 660 2,194 2,674 278 11.4 -2.05,000 831 2,738 3,188 260 8.8 -1.010,000 741 2,593 3,080 281 9.9 -0.415,000 887 3,019 3,372 204 6.4 -1.020,000 687 2,618 2,946 189 6.8 -0.430,000 872 2,952 3,233 163 5.3 -1.340,000 897 3,078 3,347 155 4.8 -0.650,000 939 3,226 3,493 154 4.6 -0.360,000 943 3,310 3,593 163 4.7 -0.670,000 961 3,337 3,598 150 4.3 -1.089,963 972 2,092 1,609 279 15.1 -0.7133,148 1,032 2,149 1,660 283 14.8 -0.7151,151 1,028 2,243 1,583 381 19.9 -0.5

66
Table 4.19 EDMD and JDMD Permanent Pavement Deformations, Test Section 523FDPermanent Deformation (m × 10-6)Repetitions
Midpoint Edge, Slab 17 Corner Slab 17/Joint 16 Corner Slab 16/Joint 1620,000 0 0 030,000 -167 -271 -26340,000 -93 -242 -31350,000 -121 -303 -43660,000 -199 -367 -53070,000 -196 -378 -54089,963 -185 2,178 1,157133,148 -128 2,612 1,506151,151 -100 2,816 1,535
0
500
1,000
1,500
2,000
2,500
3,000
3,500
4,000
0 20,000 40,000 60,000 80,000 100,000 120,000 140,000 160,000
Repetitions
Def
lect
ion
(mic
rons
)
Edge midpoint, slab 17
Corner, slab 16 / joint 16
Corner, slab 17 / joint 16
Figure 4.13. JDMD deflections, Test Section 523FD.

67
longitudinal crack formed on slab 16, the corner deflection on the slab 16 side was less than on
the slab 17 side.
The reason for this change was probably due to the corner crack completely severing the
corner from slab 17 while the longitudinal crack on slab 16 did not propagate all the away across.
This also indicates, as expected, that the traveling wheel load drives crack propagation and since
the wheel only loaded slab 16 for a 1-m length, the crack did not traverse the whole slab length of
4.0 m.
A chart showing permanent deformation at joint 16 and the slab midpoint edge versus
HVS wheel repetitions is shown in Figure 4.14. There was minimal permanent deformation at
the corner and slab edge midpoint until around 75,000 repetitions at which point corner
permanent deformation in the pavement system started accumulating. This permanent
deformation most likely began due to a loss in local stiffness of the slab, which in turn slightly
increased the elastic deflection and the pressure on the base and subgrade.
After the first cracking at 90,000 repetitions, there was not a significant increase in
permanent deformation at the corner or edge of the slab. This can be expected since the elastic
deflections at the corner of the slab decreased between 40 and 50 percent after cracking. In
Figure 4.14, there is a slight negative trend in the permanent deformation of the slab system in
the beginning of the test. Because the base and subgrade cannot expand under wheel loading, the
only explanation for this behavior is a different zero load position caused by either the rocking of
the slab or the ambient temperature outside the box. The latter explanation (temperature effect)
is probably the most likely answer.

68
-1,000
-500
0
500
1,000
1,500
2,000
2,500
3,000
0 20,000 40,000 60,000 80,000 100,000 120,000 140,000 160,000
Repetitions
Perm
anen
t def
orm
atio
n (m
icro
ns)
Edge midpoint, slab 17
Corner, slab 16 / joint 16
Corner, slab 17 / joint 16
Figure 4.14. JDMD permanent deformation, Test Section 523FD.
Table 4.20 shows the load transfer efficiency (LTE) with the number of repetitions for
both wheel directions and two wheel locations. LTE is calculated by dividing the unloaded slab
corner deflection by the loaded slab corner deflection. The load transfer is calculated for the
wheel load moving across the joint in each direction. For each wheel direction, LTE is calculated
when the wheel is on each slab adjacent to the joint. Therefore, four LTEs are calculated for
each joint at which deflection is measured.
Table 4.20 shows that the average LTE differs only little according to which direction the
wheel load moved across the joint. The surface temperature of the slab was 26 degrees Celsius
during the first reading, which probably affected the deflection measurements and the first LTE
calculation. When deflection data was collected at 100 repetitions, the surface temperature was
19°C, which was near the target temperature of 20°C in the temperature control box. The LTE

69
Table 4.20 Load Transfer Efficiency at Joint 16, Test Section 523FDLoad Transfer Efficiency, LTE (%) at Joint 16
Slab17/Joint 16 Slab 16/Joint 16Repetitions
From Slab16 to 17
From Slab17 to 16
Average From Slab16 to 17
From Slab17 to 16
Average
TemperatureDifference
(Top�Bottom),°C
10 40.5 41.5 41 60.9 61.5 61 NA100 43.9 44.7 44 45.0 46.8 46 -2.0500 49.0 46.2 48 39.9 41.3 41 -2.0
1,000 47.9 46.2 47 38.4 39.0 39 -2.05,000 37.8 39.2 38 40.9 40.8 41 -1.0
10,000 32.6 31.3 32 33.9 35.0 34 -0.415,000 38.2 34.9 37 39.5 39.7 40 -1.020,000 23.0 23.3 23 30.3 31.9 31 -0.430,000 29.8 29.5 30 35.3 35.7 35 -1.340,000 32.3 29.5 31 37.6 36.8 37 -0.650,000 32.8 30.1 31 37.6 36.8 37 -0.360,000 33.5 32.5 33 37.0 36.6 37 -0.670,000 32.7 30.6 32 36.7 37.2 37 -1.089,963 8.9 10.2 10 30.5 39.9 35 -0.7
133,148 9.1 5.9 7 38.7 40.3 39 -0.7151,151 3.6 6.0 5 44.7 67.2 56 -0.5
was also affected by the crack in the slab because the joint will behave differently depending on
how close the crack is to the deflection sensors.
Table 4.20 shows that LTE is much more dependent on which side the slab is loaded than
the direction of the wheel travel. This trend is consistent before and after cracking occurred on
the test section. The difference in the measured LTE for the same wheel direction but different
slabs is more extreme, especially after cracking began on slab 17.
Overall, the LTE shows a decrease with number of load repetitions. Furthermore the
initial load transfer efficiency was quite low, approximately 45 percent. HWD testing measured
the average LTE in section 3 (the 150-mm thick slabs) to be approximately 64 percent at 90 days
after construction (2). The low LTE can be associated with shrinkage of the concrete, which
opens the joints and decreases the aggregate interlock. The concrete used in Palmdale was found
to have a higher free shrinkage as compared to normal Type I/II cement.(4)Table 4.20 shows that
the deterioration of LTE occurs very quickly and levels off to a minimum value approaching 30

70
percent load transfer efficiency prior to cracking. Once cracking has occurred near the joint, the
LTE can approach zero or even increase due to slab rocking or settling.
The most likely explanation for the directional behavior of the LTE at one joint is the
shape of the joint crack. This trend was also seen in the 100-mm thick sections and in HVS Test
Section 516CT (3). If the joint crack is not perpendicular to the surface, then LTE will be biased
toward one slab. In this test, the top of the joint crack must have traveled down from the saw cut
at the joint toward slab 17 in order to produce higher LTE on slab 16 compared with slab 17.
4.5.3 CAM Data, Test Section 523FD
Table 4.21 shows the results recorded with the Crack Activity Meter. These
measurements were taken at two stages: at the beginning of the test, and after 10,000 load
applications. The CAM was placed between the wheel paths of the dual wheels across joint 16.
Table 4.21 CAM Results, Test Section 523FDHorizontal Movement (m × 10-6)* Vertical Movement (m × 10-6)*RepetitionsClosing (+) Opening (�) Positive Negative
10 332 -20 962 -96610,000 265 -96 352 -2,745**
* Symbols and explanations presented in Section 4.1.3 apply here as well.** Data not reliable. LVDT probably went out of range.
The values presented in Table 4.21 are high, with the total vertical joint movement at the
beginning of the test almost 2 mm (962 and 966 microns combined), which indicates a noticeable
joint movement even at a test load of 45 kN. These results suggest that the aggregate interlock
required to prevent vertical joint movement was low. At 10,000 repetitions, the vertical activity
became so high that the LVDT recording the vertical movement went out of range and no useful
conclusion from this data set can be drawn.

71
4.6 Test Section 524FD
The HVS test on Test Section 524FD was conducted on slab numbers 19, 20, and 21 on
the South Tangent. Slab 20 (5.7-m total length) was fully tested, together with some area on
either side of joints 19 and 20. The test section was trafficked with a 45-kN dual wheel load for
the entire 119,784 repetitions. This test used the temperature control box and bi-directional
trafficking. Photograph 4.24 shows an overhead view of the test section with cracks; Figure 4.15
shows the crack development.
4.6.1 Visual observations and JDMD and EDMD results, Test Section 524FD
A corner crack first appeared on slab 19 after 30,000 repetitions. The first crack
appearing on the middle slab (20) was identified at 64,000 repetitions and started at joint 19,
appearing initially to be a longitudinal crack, but ultimately turning into a large corner crack by
103,000 repetitions (Photograph 4.25).
4.6.2 JDMD and EDMD Data, Test Section 524FD
Tables 4.22 to 4.25 summarize the results of the maximum deflection at the mid-slab
edge of slab 20, and the corner edge deflections on either side of joint 19. Table 4.22 shows that
the repeatability of the midpoint edge deflections is less than 5 percent for the majority of the
readings. Tables 4.23 and 4.24 show that there is little effect from wheel direction on the
measured maximum corner deflections on either side of joint 19.
Table 4.25 summarizes the average maximum deflections of the mid-slab edge and corner
deflections. The corner displacements measured on slab numbers 19 and 20 are very similar up
to 30,000 repetitions. The coefficient of variation between corner measurements was less than 3
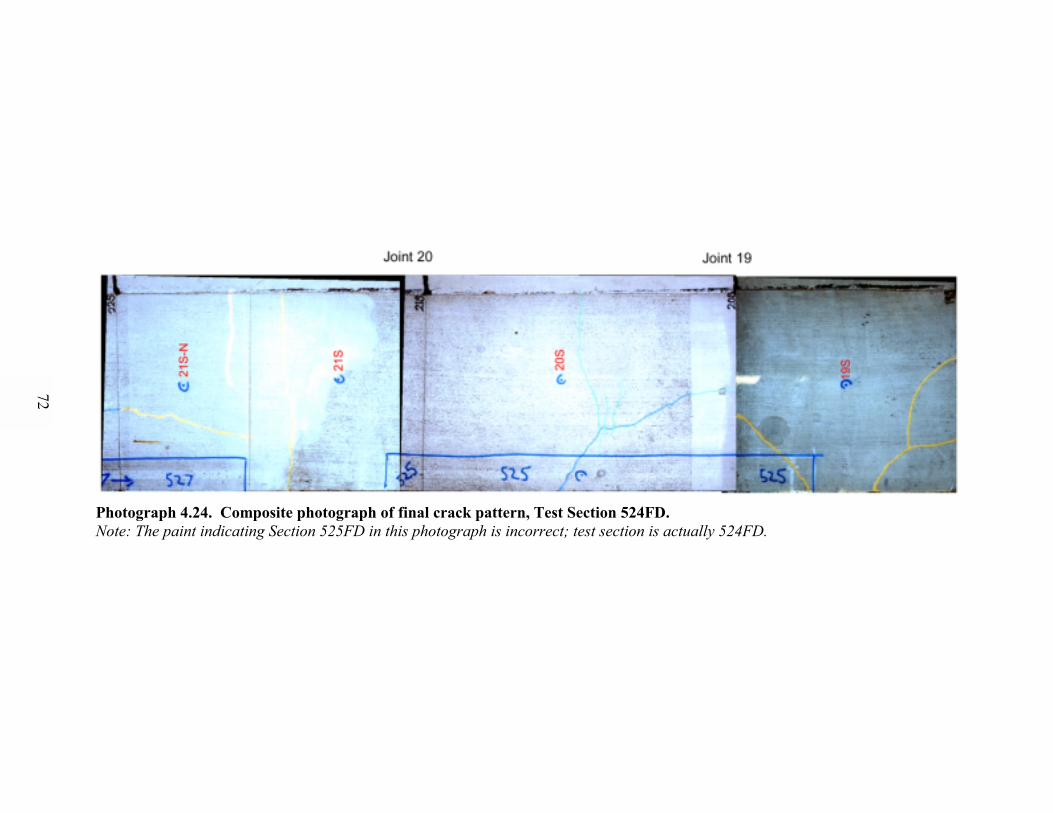
Photograph 4.24. Composite photograph of final crack pattern, Test Section 524FD.Note: The paint indicating Section 525FD in this photograph is incorrect; test section is actually 524FD.
72

Joint 20 Joint 19
610
Slab width = 3 660
Note: Loading Sequence
45 kN: 0 - 119 784 Reps
Note: Loading Sequence
45 kN: 0 - 119 784 Reps
30 000 Reps 64 000
102 935
30 000 Reps 64 000
102 935
Slab 21 Slab 20 Slab 19
Figure 4.15. Schematic of crack development, Test Section 524FD (not to scale).
73

74
Photograph 4.25. Crack pattern at completion of HVS trafficking, Test Section 524FD.
Table 4.22 Midpoint Edge Deflections under a 45-kN Wheel Load, Slab 20, Test Section524FD
Midpoint Edge Deflections (m × 10-6) at Slab 20Load DirectionRepetitions
From Slab21
From Slab19
Average Std. Dev. C.O.V. (%)
Temperaturedifference
(Top�Bottom), °C
10 1,069 1,079 1,074 6.8 0.6 NA100 1,115 1,089 1,102 18.9 1.7 NA500 1,215 1,202 1,209 9.2 0.8 NA
1,000 1,248 1,170 1,209 55.1 4.6 -1.105,000 1,300 1,237 1,269 44.5 3.5 -0.3019,353 1,415 1,291 1,353 87.7 6.5 -0.8030,000 1,160 1,214 1,187 38.4 3.2 -0.4040,000 937 913 925 17.0 1.8 NA64,332* 914 853 883 43.0 4.9 -0.10102,935 892 785 839 75.1 9.0 -0.10119,784 898 794 846 73.2 8.7 0.10
*corner crack appeared

75
Table 4.23 Corner Deflections under a 45-kN Wheel Load, Slab 20, Test Section 524FDCorner Deflections (m × 10-6) at Slab 20/Joint 19Load Direction
Repetitions
From Slab20
From Slab19
Average Std. Dev. C.O.V. (%)Temperature
difference(Top�Bottom), °C
10 2,624 2,645 2,635 15.1 0.6 NA100 2,976 2,992 2,984 11.3 0.4 NA500 3,188 3,194 3,191 3.7 0.1 NA
1,000 3,361 3,350 3,356 7.4 0.2 -1.105,000 3,532 3,549 3,540 11.8 0.3 -0.3019,353 3,776 3,765 3,770 7.8 0.2 -0.8030,000 3,294 3,323 3,308 19.9 0.6 -0.4040,000 1,842 1,910 1,876 48.4 2.6 NA64,332* 1,748 1,724 1,736 16.7 1.0 -0.10102,935 1,361 1,341 1,351 13.7 1.0 -0.10119,784 1,348 1,323 1,336 18.3 1.4 0.10
*corner crack appeared
Table 4.24 Corner Deflections under a 45-kN Wheel Load, Slab 19, Test Section 524FDCorner Deflections (m × 10-6) at Slab 19/Joint 19Load Direction
Repetitions
FromSlab 20
FromSlab 19
Average Std. Dev. C.O.V. (%)Temperaturedifference(Top�Bottom),°C
10 1,069 1,079 1,074 6.8 0.6 NA100 1,115 1,089 1,102 18.9 1.7 NA500 1,215 1,202 1,209 9.2 0.8 NA1,000 1,248 1,170 1,209 55.1 4.6 -1.105,000 1,300 1,237 1,269 44.5 3.5 -0.3019,353 1,415 1,291 1,353 87.7 6.5 -0.8030,000 1,160 1,214 1,187 38.4 3.2 -0.4040,000 937 913 925 17.0 1.8 NA64,332* 914 853 883 43.0 4.9 -0.10102,935 892 785 839 75.1 9.0 -0.10119,784 898 794 846 73.2 8.7 0.10*corner crack appeared

76
Table 4.25 Average of all Deflections under a 45-kN Wheel Load, Test Section 524FDAverage Deflections (m × 10-6)
Repetitions Midspan Edge,Slab 20
CornerSlab 20/Joint 19
CornerSlab 19/Joint 19
Temperaturedifference(Top�Bottom), °C
10 1,074 2,635 2,556 NA100 1,102 2,984 2,989 NA500 1,209 3,191 3,234 NA1,000 1,209 3,356 3,466 -1.15,000 1,269 3,540 3,522 -0.319,353 1,353 3,770 3,837 -0.830,000 1,187 3,308 3,259 -0.440,000 925 1,876 2,141 NA64,332* 883 1,736 1,901 -0.1102,935 839 1,351 1,310 -0.1119,784 846 1,336 1,308 0.1*corner crack appeared
percent until the appearance of the first crack. This differs from the measurements on Test
Section 523FD where the coefficient of variation approached 13 percent. After 30,000
repetitions, a corner crack developed in slab 19 which affected the deflection measurement at the
corner of slab 19 more than on the corner of slab 20.
Figure 4.16 is the plot of elastic deformation versus the number of HVS wheel repetitions
(Tables 4.22 to 4.24). The plot of JDMD readings in Figure 4.16 shows a rapid increase in
deflection values at the corners of the slab at the beginning of the test. After 30,000 repetitions a
corner crack formed in slab 19 near joint 19, and resulted in a significant decrease of corner
deflections on both sides of joint 19. The slab 20 side of the joint was a little higher than the
other side (slab 19) because the crack initiated on slab 19. Similar decreases in deflection were
seen previously on Test Section 523FD and on the 100-mm test sections.
The midpoint edge deflections increased until 20,000 repetitions then steadily decreased
over the rest of the test, but did not decrease markedly when crack development began occurring
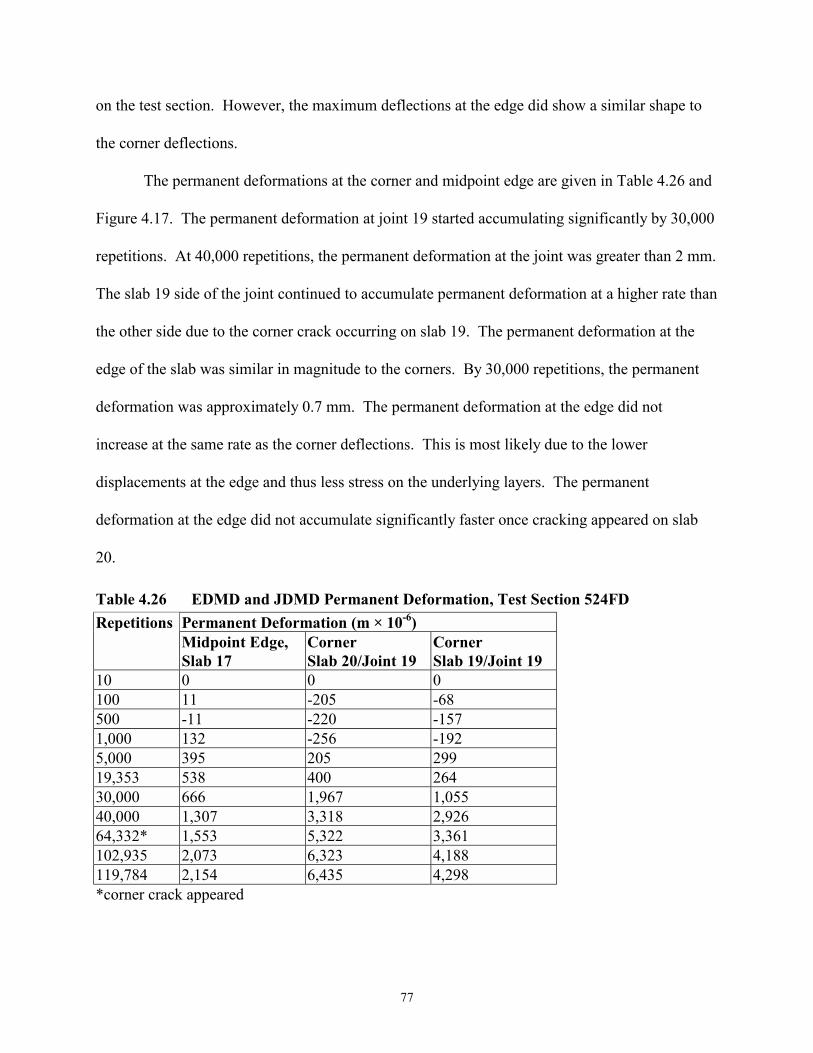
77
on the test section. However, the maximum deflections at the edge did show a similar shape to
the corner deflections.
The permanent deformations at the corner and midpoint edge are given in Table 4.26 and
Figure 4.17. The permanent deformation at joint 19 started accumulating significantly by 30,000
repetitions. At 40,000 repetitions, the permanent deformation at the joint was greater than 2 mm.
The slab 19 side of the joint continued to accumulate permanent deformation at a higher rate than
the other side due to the corner crack occurring on slab 19. The permanent deformation at the
edge of the slab was similar in magnitude to the corners. By 30,000 repetitions, the permanent
deformation was approximately 0.7 mm. The permanent deformation at the edge did not
increase at the same rate as the corner deflections. This is most likely due to the lower
displacements at the edge and thus less stress on the underlying layers. The permanent
deformation at the edge did not accumulate significantly faster once cracking appeared on slab
20.
Table 4.26 EDMD and JDMD Permanent Deformation, Test Section 524FDPermanent Deformation (m × 10-6)RepetitionsMidpoint Edge,Slab 17
CornerSlab 20/Joint 19
CornerSlab 19/Joint 19
10 0 0 0100 11 -205 -68500 -11 -220 -1571,000 132 -256 -1925,000 395 205 29919,353 538 400 26430,000 666 1,967 1,05540,000 1,307 3,318 2,92664,332* 1,553 5,322 3,361102,935 2,073 6,323 4,188119,784 2,154 6,435 4,298*corner crack appeared
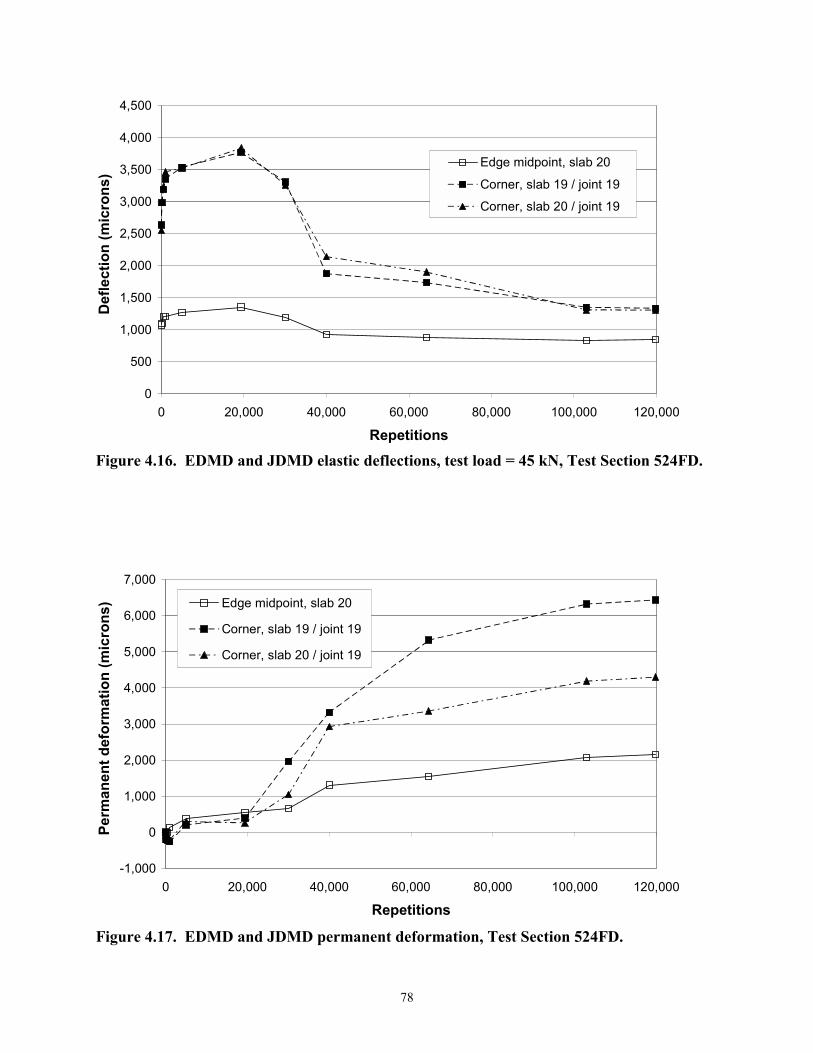
78
0
500
1,000
1,500
2,000
2,500
3,000
3,500
4,000
4,500
0 20,000 40,000 60,000 80,000 100,000 120,000
Repetitions
Def
lect
ion
(mic
rons
)
Edge midpoint, slab 20
Corner, slab 19 / joint 19
Corner, slab 20 / joint 19
Figure 4.16. EDMD and JDMD elastic deflections, test load = 45 kN, Test Section 524FD.
-1,000
0
1,000
2,000
3,000
4,000
5,000
6,000
7,000
0 20,000 40,000 60,000 80,000 100,000 120,000
Repetitions
Perm
anen
t def
orm
atio
n (m
icro
ns) Edge midpoint, slab 20
Corner, slab 19 / joint 19
Corner, slab 20 / joint 19
Figure 4.17. EDMD and JDMD permanent deformation, Test Section 524FD.
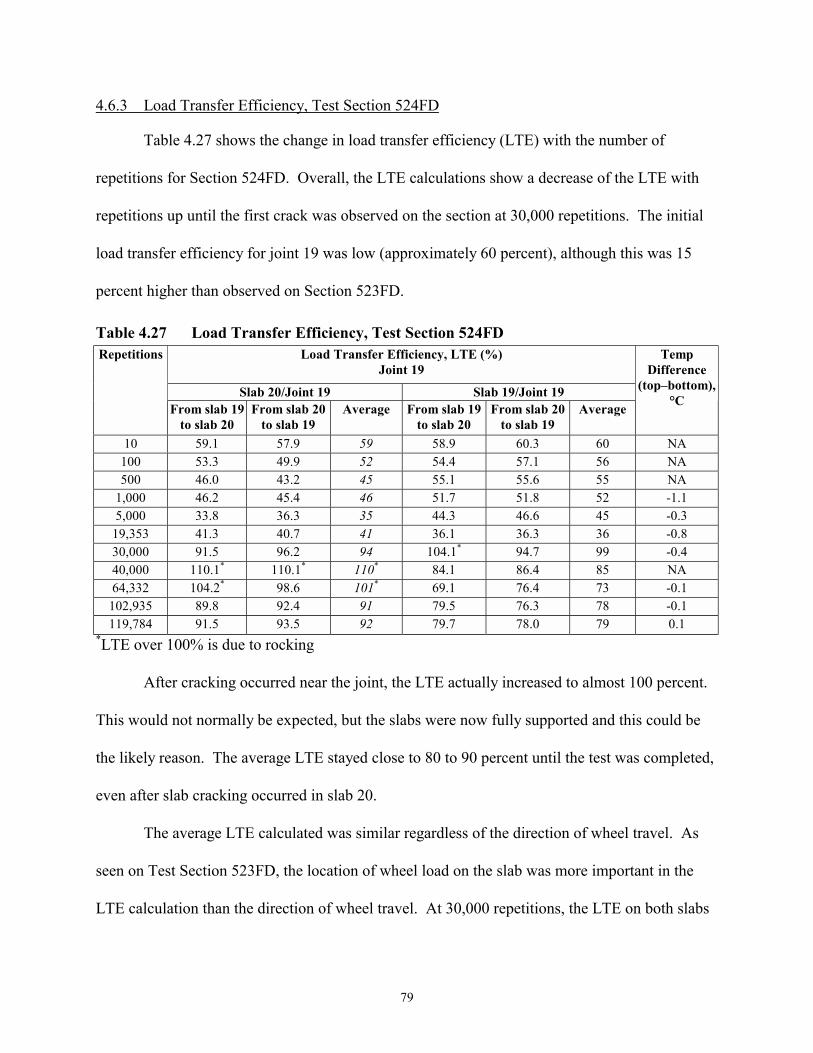
79
4.6.3 Load Transfer Efficiency, Test Section 524FD
Table 4.27 shows the change in load transfer efficiency (LTE) with the number of
repetitions for Section 524FD. Overall, the LTE calculations show a decrease of the LTE with
repetitions up until the first crack was observed on the section at 30,000 repetitions. The initial
load transfer efficiency for joint 19 was low (approximately 60 percent), although this was 15
percent higher than observed on Section 523FD.
Table 4.27 Load Transfer Efficiency, Test Section 524FDLoad Transfer Efficiency, LTE (%)
Joint 19
Slab 20/Joint 19 Slab 19/Joint 19
Repetitions
From slab 19to slab 20
From slab 20to slab 19
Average From slab 19to slab 20
From slab 20to slab 19
Average
TempDifference
(top�bottom),°C
10 59.1 57.9 59 58.9 60.3 60 NA100 53.3 49.9 52 54.4 57.1 56 NA500 46.0 43.2 45 55.1 55.6 55 NA
1,000 46.2 45.4 46 51.7 51.8 52 -1.15,000 33.8 36.3 35 44.3 46.6 45 -0.3
19,353 41.3 40.7 41 36.1 36.3 36 -0.830,000 91.5 96.2 94 104.1* 94.7 99 -0.440,000 110.1* 110.1* 110* 84.1 86.4 85 NA64,332 104.2* 98.6 101* 69.1 76.4 73 -0.1
102,935 89.8 92.4 91 79.5 76.3 78 -0.1119,784 91.5 93.5 92 79.7 78.0 79 0.1
*LTE over 100% is due to rocking
After cracking occurred near the joint, the LTE actually increased to almost 100 percent.
This would not normally be expected, but the slabs were now fully supported and this could be
the likely reason. The average LTE stayed close to 80 to 90 percent until the test was completed,
even after slab cracking occurred in slab 20.
The average LTE calculated was similar regardless of the direction of wheel travel. As
seen on Test Section 523FD, the location of wheel load on the slab was more important in the
LTE calculation than the direction of wheel travel. At 30,000 repetitions, the LTE on both slabs

80
approached 100 percent. There was no change in LTE after the middle slab (slab 20) had
developed a larger corner crack.
4.6.4 Strain Gauge Data, Test Section 524FD
Strain gauge measurements were taken in order to monitor the change in dynamic strain
within the concrete slab. The dynamic strain has two components: elastic and permanent. Figure
3.2 shows the instrument locations on Section 524FD. Strain gauges were installed at two
locations in slab 20: at 2.87 m from joint 20 (near the middle of the slab) and the other one at 0.3
m from joint 19 (close to joint 19). The strain gauges consisted of Dynatest and Tokyo Sokki
strain gauges, and their positions in the slab are described below.
• Dynatest in the middle of slab 20: Dynatest #0 (parallel to travel)
• Dynatest at joint 19: Dynatest #12 (perpendicular to travel)
• Tokyo Sokki in the middle slab 20:
· Direction 1: PMR-X (parallel to travel)
· Direction 2: PMR-M (45 degrees)
· Direction 3: PMR-Y (perpendicular to travel)
• Tokyo Sokki at joint 19:
· Direction 1: PMR-X (parallel to travel)
· Direction 2: PMR-M (45 degrees)
· Direction 3: PMR-Y (perpendicular to travel)
81
The Dynatest strain gauges were installed at 40 mm from the bottom of the slab and the
Tokyo Sokki strain gauges were installed at 40 mm from the top of the slab. The distance from
the slab edge and joint was 0.3 m.
4.6.4.1 Dynamic Response
Table 4.28 shows the strain gauge results when a moving 45-kN load was applied over
the pavement surface. These results are elastic responses of the concrete slab, which was defined
as the peak strain (positive or negative) minus the no-load (baseline) strain value. Figure 4.18
compares the maximum strain outputs at the same location. In the figure and table, positive
numbers indicate tension and negative readings are compression.
Figure 4.18 shows that the maximum tensile stress occurred with the Dynatest strain at
the bottom of the slab while the maximum compressive stress was measured with the PMR-X
gauge. Both of these gauges are oriented parallel to the direction of wheel travel. Table 4.28
shows the PMR-X indicated slightly higher strains throughout the test but any deviation in strain
gauge depth or slab thickness will cause these two gauges to provide different values. The PMR-
M gauges should have the second highest compressive strain since they are oriented 45 degrees
to the direction of travel. Finally, because the PMR-Y is oriented perpendicular to the slab edge,
it should have a close to zero strain reading.
Figure 4.18 shows that the maximum strains parallel to the wheel are approximately
constant until the large corner crack that began at joint 19 intersected the edge of the pavement
(see Figure 4.15). At 30,000 repetitions, the corner crack on slab 19 was having no effect on the
strain outputs at the slab midpoint edge. However, at 103,000 repetitions, all of the measured
strain values at the slab midpoint edge dropped to almost zero strain. This can be attributed to

Table 4.28 Dynamic Strain Response under a 45-kN Test Load, Test Section 524FDMaximum Strain Recorded with a 45-kN Load (microstrain) at Given Repetitions
Instrument Type, Placement & Orientation 10 100 500 1,000 5,000 19,353 30,000 45,386 64,332 102,935 119,784Tensile (+) 57 60 58 65 62 69 63 62 62 3 63
Dynatest bottom Compression (-) -16 -13 -16 -12 -14 -14 -13 -8 -8 -3 -15Tensile (+) 7 9 16 10 14 13 12 4 5 3 32
X: parallel Compression (-) -66 -64 -58 -65 -64 -76 -74 -74 -76 -4 -60Tensile (+) 15 16 22 15 19 18 20 13 15 3 24
M: 45 degree Compression (-) -33 -32 -29 -37 -34 -41 -37 -39 -38 -4 -26Tensile (+) 5 6 8 6 7 8 7 6 7 2 9
Midspanstraingauges PMR top
Y: perpendicular Compression (-) -8 -3 -2 -3 -3 -3 -4 -3 -3 -4 -7Tensile (+) 3 3 6 6 4 6 5 2 2 3 4
Dynatest bottom Compression (-) -15 -12 -10 -8 -8 -9 -9 -10 -10 -4 -7Tensile (+) 15 15 19 15 17 19 20 18 18 3 20
X: parallel Compression (-) -20 -23 -22 -22 -18 -17 -13 -11 -12 -4 -10Tensile (+) 6 9 0 0 0 9 10 7 7 3 7
M: 45 degree Compression (-) -33 -31 0 0 0 -34 -29 -21 -20 -4 -16Tensile (+) 9 9 0 0 0 10 10 7 7 4 8
Cornerstraingauges PMR top
Y: perpendicular Compression (-) -11 -12 0 0 0 -13 -13 -8 -7 -6 -6Temperature (°C) 17.4 17.4 18.2 17.0 18.5 18.8 19.3 20.0 20.0 20.0 20.0
82

83
-100
-80
-60
-40
-20
0
20
40
60
80
0 20,000 40,000 60,000 80,000 100,000 120,000
Repetitions of HVS wheel load
Stra
in (m
icro
stra
in)
Dynatest (bottom-max) PMR - X (top-max) PMR-M (top-max) PMR-Y (top-max)Dynatest (bottom-min) PMR-X (top-min) PMR-M (top-min) PMR-Y (top-min)
+ve = tension-ve = compression
Figure 4.18. Dynamic strain response at edge midpoint, slab 20, Test Section 524FD.
the unloading of the slab due to the relative proximity of the gauges to the newly formed crack.
After approximately 20,000 more repetitions (119,784), the elastic strain reading had increased
again. This could be a result of more damage accumulating in the vicinity of the gauges.
The measurements at the corner of the slab give small strain values so it is difficult to
make any meaningful comment about trends. There appears to be a drop in strain at 103,000
repetitions for PMR-X, which was the same time a corner crack fully developed on slab 20.
4.6.4.2 Permanent Strain Response
The permanent strain readings of the gauges located near the slab 20 midpoint edge and
near joint 19 are shown in Table 4.29. Figure 4.19 shows the variations of the strain values for
the strain gauges installed at the slab midpoint edge whereas Figure 4.20 shows the static
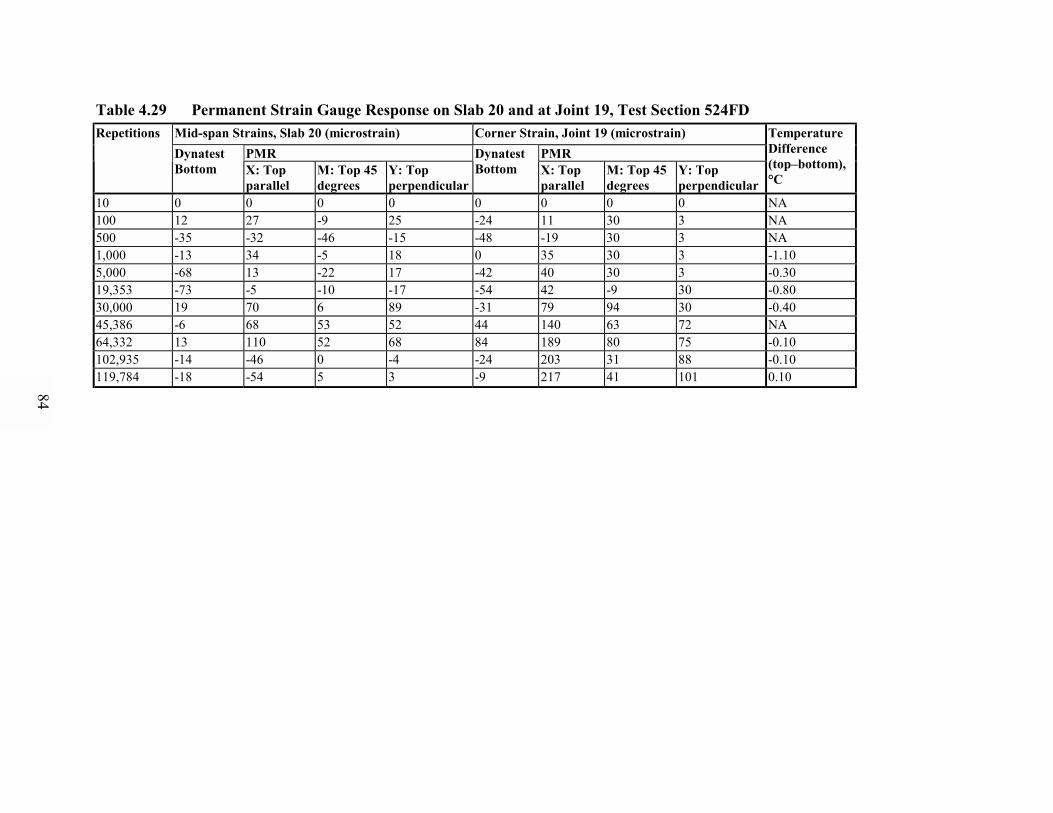
Table 4.29 Permanent Strain Gauge Response on Slab 20 and at Joint 19, Test Section 524FDMid-span Strains, Slab 20 (microstrain) Corner Strain, Joint 19 (microstrain)
PMR PMRRepetitions
DynatestBottom X: Top
parallelM: Top 45degrees
Y: Topperpendicular
DynatestBottom X: Top
parallelM: Top 45degrees
Y: Topperpendicular
TemperatureDifference(top�bottom),°C
10 0 0 0 0 0 0 0 0 NA100 12 27 -9 25 -24 11 30 3 NA500 -35 -32 -46 -15 -48 -19 30 3 NA1,000 -13 34 -5 18 0 35 30 3 -1.105,000 -68 13 -22 17 -42 40 30 3 -0.3019,353 -73 -5 -10 -17 -54 42 -9 30 -0.8030,000 19 70 6 89 -31 79 94 30 -0.4045,386 -6 68 53 52 44 140 63 72 NA64,332 13 110 52 68 84 189 80 75 -0.10102,935 -14 -46 0 -4 -24 203 31 88 -0.10119,784 -18 -54 5 3 -9 217 41 101 0.10
84

85
-100
-50
0
50
100
150
0 20,000 40,000 60,000 80,000 100,000 120,000
Repetitions of HVS wheel load
Stra
in (m
icris
trai
n)
Dynatest (bottom) PMR-X (top) PMR-M (top) PMR-Y (top)
+ve = tension-ve = compression
Figure 4.19. Static strain response, slab 20, Test Section 524FD.
-100
-50
0
50
100
150
200
250
0 20,000 40,000 60,000 80,000 100,000 120,000
Repetitions of HVS wheel load
Stra
in (m
icro
stra
in)
Dynatest-bottom PMR-X (top) PMR-M (top) PMR-Y (top)
+ve = tension-ve = compression
Figure 4.20. Static strain response near joint 19, Test Section 524FD.
86
responses recorded at joint 19. The permanent strain values from the edge midpoint showed no
consistent trend, which indicates that there was no significant permanent strain or micro-cracking
near the gauge.
At joint 19, the PMR-X gauge on the top of the slab showed significant permanent strain
accumulation compared with the other gauges. The PMR-Y gauge also had a steady increase in
permanent strain, but not as large as the PMR-X gauge. The Dynatest and PMR-M gauge did not
show any consistent trend in permanent strain accumulation.
The varying results in permanent strain measurements make it very difficult to establish
trends. Roesler (1998) found permanent strain results to be highly dependent on the location of
the micro cracking area relative to the gauge (5).
4.7 Test Section 525FD
HVS Test Section 525FD was conducted on slab numbers 22, 23, and 24 on the South
Tangent. Slab 23 (total length of 5.7 m) was fully tested, together with some area on either side
of joints 22 and 23. A 45-kN dual wheel load was applied for the entire 5,000 repetitions with
the HVS wheel run in the bi-directional trafficking mode. The temperature control box was not
used in this test. Photograph 4.26 shows an overhead view of the test section with cracks at the
end of HVS trafficking.
4.7.1 Visual Observations, Test Section 525FD
The first crack appeared on the middle slab (slab 23) by 1,000 repetitions. As seen in
Photograph 4.26, the HVS produced a corner crack at joint 22 that was approximately
symmetrical (1.7 by 1.66 m). This crack was similar to failure modes experienced on the other

Photograph 4.26. Composite photograph of final crack pattern, Test Section 525FD.
87
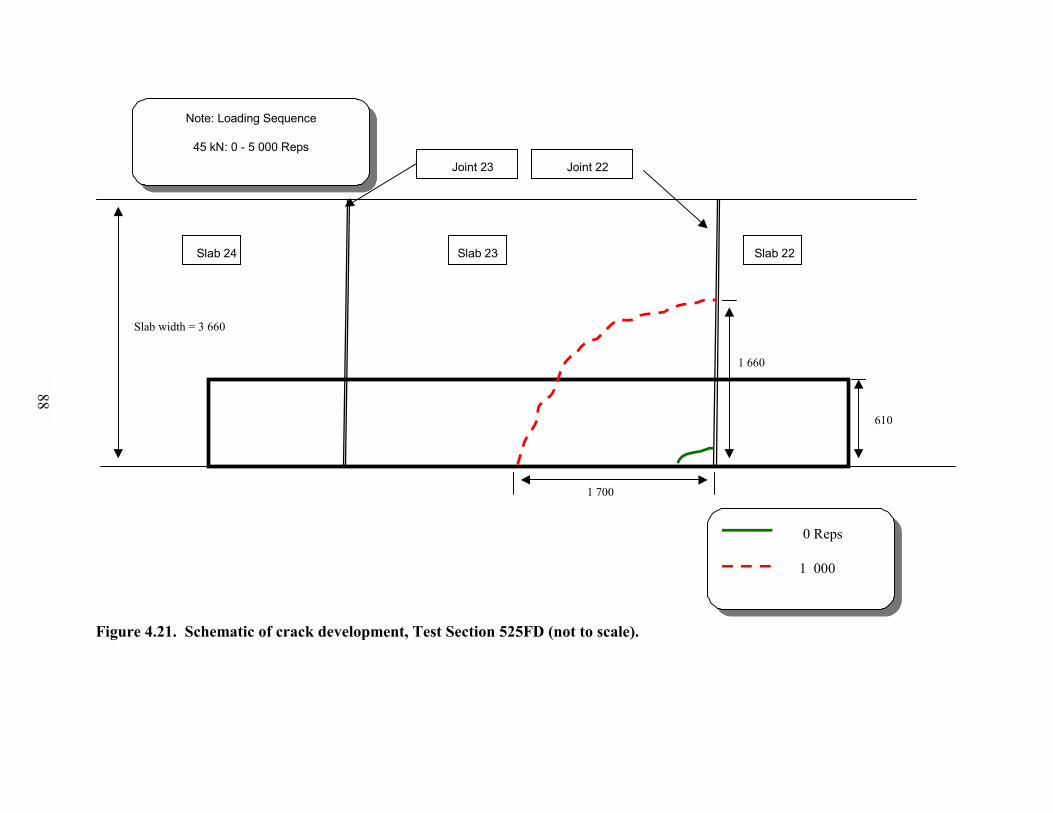
Joint 23 Joint 22
610
Slab width = 3 660
Note: Loading Sequence
45 kN: 0 - 5 000 Reps
Note: Loading Sequence
45 kN: 0 - 5 000 Reps
0 Reps
1 000
0 Reps
1 000
1 700
1 660
Slab 24 Slab 23 Slab 22
Figure 4.21. Schematic of crack development, Test Section 525FD (not to scale).
88

89
Photograph 4.27. Corner crack after 1,000 repetitions, Test Section 525FD.
150-mm thick test sections under accelerated trafficking mode (see Photograph 4.27).
4.7.2 JDMD and EDMD Data, Test Section 525FD
Tables 4.30 to 4.33 show the joint and edge deflection results on Section 525FD; Table
4.34 shows the permanent deformation values. The elastic deflections at the corners and edge
were large from the beginning, which gave an indication that the slab would crack earlier than
the other 150-mm sections. Tables 4.30 to 4.32 show that there is little difference in the
measured slab deflections relative to the direction of wheel travel. The coefficient of variation is
less than 5 percent for the majority of the measurements. The deflections at the corner were
slightly higher when the wheel was traveling from slab 22 onto slab 23 (the main slab tested),
while the edge midpoint deflection was higher when the wheel was traveling from slab 24 onto
slab 23.

90
Table 4.30 Midpoint Edge Deflections under a 45-kN Wheel Load, Slab 23,Test Section 525FD
Midpoint Edge Deflections (m × 10-6)Load Direction
Repetitions
From Slab 24 From Slab 22Average Std. Dev. C.O.V. (%)
Temperature Difference(top� bottom), °C
10 1,565 1,503 1,534 43.7 2.9 4.0100 1,559 1,498 1,529 43.3 2.8 4.0500 1,322 1,258 1,290 45.1 3.5 5.31,000 1,435 1,388 1,412 33.5 2.4 5.35,000 1,082 1,053 1,067 20.3 1.9 0.3
Table 4.31 Corner Deflections under a 45-kN Wheel Load, Slab 23/Joint 22, Test Section525FD
Corner Deflections (m × 10-6)Load DirectionRepetitionsFrom Slab 23 From Slab 22 Average Std. Dev. C.O.V. (%)
Temperature Difference(top�bottom), °C
10 3,132 3,344 3,238 149.8 4.6 4.0100 3,282 3,431 3,357 105 3.1 4.0500 3,056 3,178 3,117 85.7 2.7 5.31,000 2,690 2,832 2,761 100.5 3.6 5.35,000 2,933 3,052 2,993 84.1 2.8 0.3
Table 4.32 Corner Deflections under a 45-kN Wheel Load, Slab 22/Joint 22, Test Section525FD
Corner Deflections (m × 10-6)Load DirectionRepetitionsFrom Slab 23 From Slab 22 Average Std. Dev. C.O.V. (%)
Temperature Difference(top�bottom), °C
10 2,962 3,323 3,142 255.7 8.1 4.0100 3,147 3,401 3,274 179.2 5.5 4.0500 3,078 3,185 3,132 75.8 2.4 5.31,000 1,382 1,441 1,411 41.2 2.9 5.35,000 1,333 1,342 1,338 6.2 0.5 0.3
Table 4.33 Average Midpoint Edge and Corner Deflections under a 45-kN Wheel Load,Test Section 525FD
Average Deflections (m × 10-6)RepetitionsEdge Midpoint,Slab 23
Corner, Slab23/Joint 22
Corner, Slab22/Joint 22
TemperatureDifference (Top�Bottom),°C
10 1,534 3,238 3,142 4.0100 1,529 3,357 3,274 4.0500 1,290 3,117 3,132 5.31,000 1,412 2,725 1,411 5.35,000 1,067 2,993 1,338 0.3
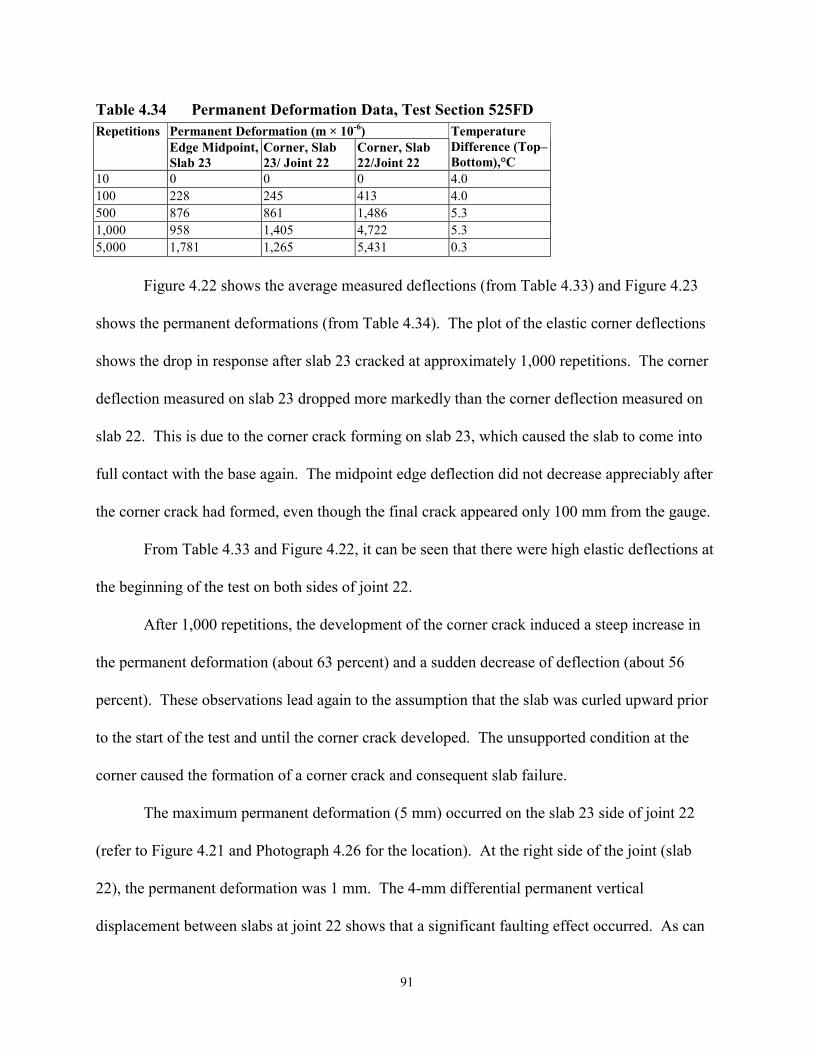
91
Table 4.34 Permanent Deformation Data, Test Section 525FDPermanent Deformation (m × 10-6)RepetitionsEdge Midpoint,Slab 23
Corner, Slab23/ Joint 22
Corner, Slab22/Joint 22
TemperatureDifference (Top�Bottom),°C
10 0 0 0 4.0100 228 245 413 4.0500 876 861 1,486 5.31,000 958 1,405 4,722 5.35,000 1,781 1,265 5,431 0.3
Figure 4.22 shows the average measured deflections (from Table 4.33) and Figure 4.23
shows the permanent deformations (from Table 4.34). The plot of the elastic corner deflections
shows the drop in response after slab 23 cracked at approximately 1,000 repetitions. The corner
deflection measured on slab 23 dropped more markedly than the corner deflection measured on
slab 22. This is due to the corner crack forming on slab 23, which caused the slab to come into
full contact with the base again. The midpoint edge deflection did not decrease appreciably after
the corner crack had formed, even though the final crack appeared only 100 mm from the gauge.
From Table 4.33 and Figure 4.22, it can be seen that there were high elastic deflections at
the beginning of the test on both sides of joint 22.
After 1,000 repetitions, the development of the corner crack induced a steep increase in
the permanent deformation (about 63 percent) and a sudden decrease of deflection (about 56
percent). These observations lead again to the assumption that the slab was curled upward prior
to the start of the test and until the corner crack developed. The unsupported condition at the
corner caused the formation of a corner crack and consequent slab failure.
The maximum permanent deformation (5 mm) occurred on the slab 23 side of joint 22
(refer to Figure 4.21 and Photograph 4.26 for the location). At the right side of the joint (slab
22), the permanent deformation was 1 mm. The 4-mm differential permanent vertical
displacement between slabs at joint 22 shows that a significant faulting effect occurred. As can
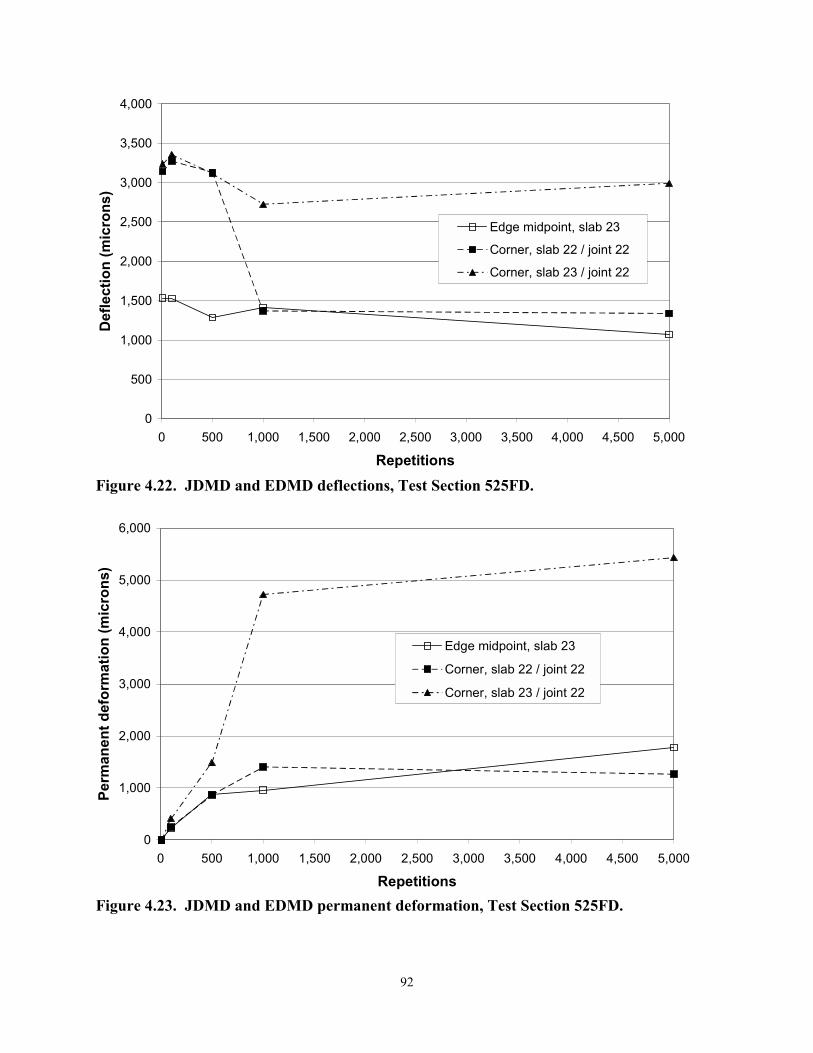
92
0
500
1,000
1,500
2,000
2,500
3,000
3,500
4,000
0 500 1,000 1,500 2,000 2,500 3,000 3,500 4,000 4,500 5,000
Repetitions
Def
lect
ion
(mic
rons
)
Edge midpoint, slab 23
Corner, slab 22 / joint 22
Corner, slab 23 / joint 22
Figure 4.22. JDMD and EDMD deflections, Test Section 525FD.
0
1,000
2,000
3,000
4,000
5,000
6,000
0 500 1,000 1,500 2,000 2,500 3,000 3,500 4,000 4,500 5,000
Repetitions
Perm
anen
t def
orm
atio
n (m
icro
ns)
Edge midpoint, slab 23
Corner, slab 22 / joint 22
Corner, slab 23 / joint 22
Figure 4.23. JDMD and EDMD permanent deformation, Test Section 525FD.

93
be seen in Table 4.35, the load transfer efficiency at the beginning of the test was quite poor
(about 62 percent). The permanent deformation at the midpoint edge of the middle slab was
approximately 2 mm.
Table 4.35 Load Transfer Efficiency (LTE), Test Section 525FDLoad Transfer Efficiency, LTE (%) at Joint 22Repetitions
From Slab 22 to Slab 23 From Slab 23 to Slab 22
Temperaturedifference
(top�bottom), °C10 26.8 61.7 4.0100 13.6 54.1 4.0500 4.8 35.6 5.3
1,000 12.6 111.4 5.35,000 25.7 113.2 0.3
Other factors such as voids and concrete stiffness may have also contributed to the rapid
failure of the slab since the initial deflections were not much higher than those recorded on the
previously tested sections at the same 45-kN load.
4.7.3 Load Transfer Efficiency, Test Section 525FD
The Load Transfer Efficiency values (Table 4.35) calculated when the wheel moved from
slab 23 to slab 22 show that the LTE decreased with load applications. After the crack occurred,
the results became unreliable.
4.8 Test Section 526FD
HVS testing on Test Section 526FD was conducted on slabs 26, 27 and 28. An 85-kN
load was used throughout the test. The test was completed after 23,625 load applications. The
temperature control chamber was used.

94
4.8.1 Visual Observations, Test Section 526FD
The first mid-slab crack developed after only 100 repetitions (Photograph 4.28). This
crack is attributable to the higher HVS wheel load of 85 kN compared with the previous tests
(45-kN wheel load). After 500 repetitions, a longitudinal crack and a corner crack had developed
(Photograph 4.29). The complete section is shown in Photograph 4.30; crack development is
presented in Figure 4.24. Slab 28 had a transverse crack prior to the start of HVS testing of Test
Section 526FD, caused by shrinkage and curling stresses without any traffic loading.
4.8.2 JDMD and EDMD Data, Test Section 526FD
The elastic deformation values recorded by the JDMD and EDMD are presented in Table
4.36 and the permanent deformation values in Table 4.37.
The midpoint edge and corner cracks that initially appeared on both sides of joint 26 are
nearly symmetrical. They were followed by transverse cracks that occurred after 500 repetitions.
In addition, they look almost symmetrical with respect to the two cracks that formed on each side
of joint 26. Two other cracks formed after 500 repetitions on each side of joint 27.
Figures 4.25 and 4.26 show the deflection and permanent deformation during the test.
The high test load (85 kN, see Table 3.4) applied from the beginning of the test caused high
deflections compared to the responses measured during previous tests.
A significant decrease in deflection values was noticeable after 500 repetitions. After this
point, all measured deflections stabilized at almost the same magnitude (between 1,100 microns
and 1,900 microns), as shown in Figure 4.25.
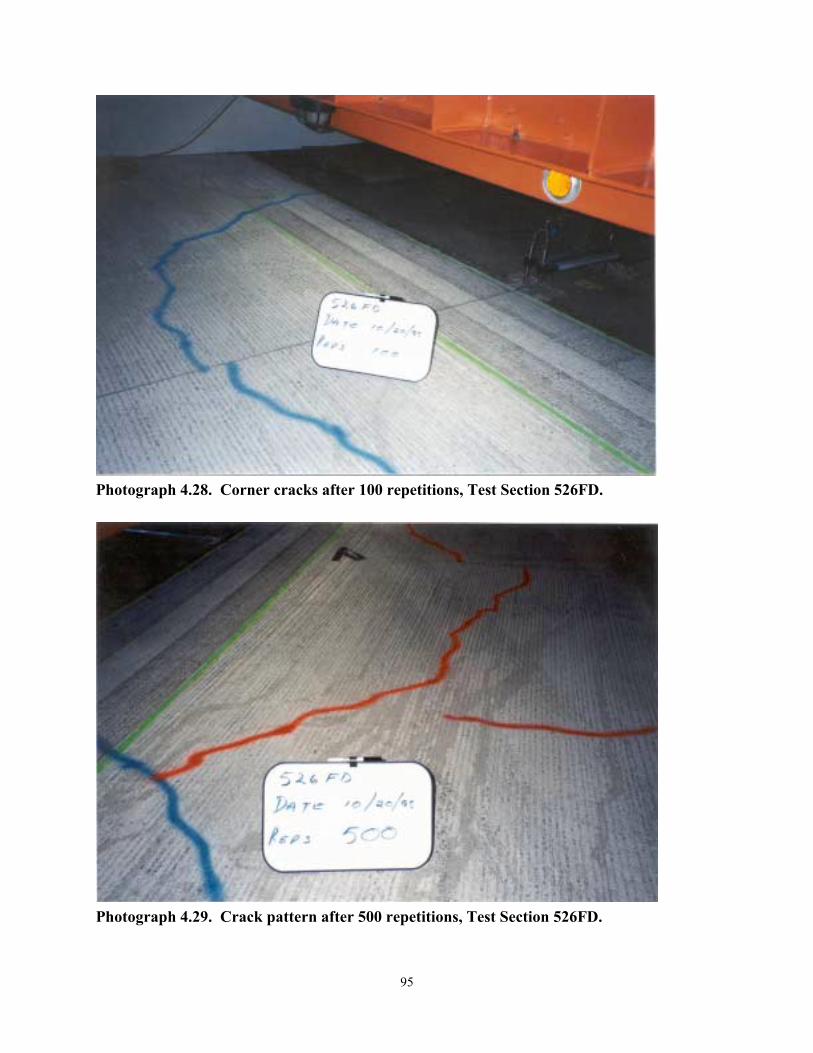
95
Photograph 4.28. Corner cracks after 100 repetitions, Test Section 526FD.
Photograph 4.29. Crack pattern after 500 repetitions, Test Section 526FD.

Photograph 4.30. Composite photograph of final crack pattern, Test Section 526FD.
96

Joint 27 Joint 26
610
Slab width = 3 660
Note: Loading Sequence
85 kN: 0 - 23 625 Reps
Note: Loading Sequence
85 kN: 0 - 23 625 Reps
0 Reps 100 500
0 Reps 100 500
Slab 28 Slab 27 Slab 26
Figure 4.24. Schematic of crack development, Test Section 526FD (not to scale).
97

98
Table 4.36 EDMD and JDMD Deflections, 85-kN Test Load, Test Section 526FDDeflections (m × 10-6)
Corner, Joint 26Repetitions
Midpoint Edge,Slab 27 Slab 26 Side Slab 27 Side
TemperatureDifference (top�
bottom), °C10 2,131 4,604 4,510 NA
100 2,195 4,169 3,937 -0.6500 1,095 1,914 1,415 0.2
1,000 1,137 1,838 1,355 0.25,000 1,173 1,592 1,361 0.4
10,000 1,148 1,455 1,351 0.923,625 1,172 1,496 1,268 NA
Table 4.37 EDMD and JDMD Permanent Deformation, Test Section 526FDPermanent Deformation (m × 10-6)
Corner, Joint 26Repetitions
MidpointEdge, Slab27
Slab 26Side
Slab 27Side
TemperatureDifference(top-bottom)(°C)
10 0 0 0 NA100 417 299 86 -0.6500 3,066 6,666 7,680 0.21,000 3,258 7,116 8,133 0.25,000 3,768 7,905 8,906 0.410,000 4,166 8,323 9,248 0.923,625 4,644 8,691 9,826 NA
0
500
1,000
1,500
2,000
2,500
3,000
3,500
4,000
4,500
5,000
0 5,000 10,000 15,000 20,000 25,000
Repetitions
Def
lect
ion
(mic
rons
) Edge midpoint, slab 27
Corner, slab 26 / joint 26
Corner, slab 27 / joint 26
Figure 4.25. EDMD and JDMD deflections, Test Section 526FD.
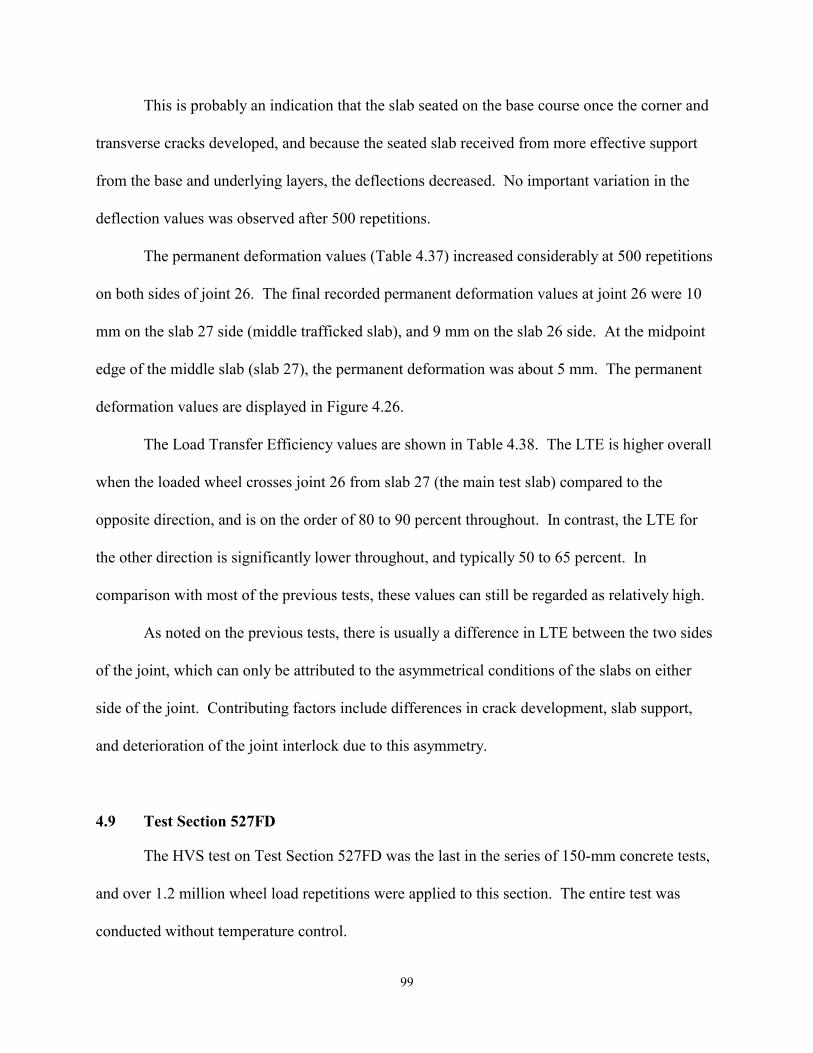
99
This is probably an indication that the slab seated on the base course once the corner and
transverse cracks developed, and because the seated slab received from more effective support
from the base and underlying layers, the deflections decreased. No important variation in the
deflection values was observed after 500 repetitions.
The permanent deformation values (Table 4.37) increased considerably at 500 repetitions
on both sides of joint 26. The final recorded permanent deformation values at joint 26 were 10
mm on the slab 27 side (middle trafficked slab), and 9 mm on the slab 26 side. At the midpoint
edge of the middle slab (slab 27), the permanent deformation was about 5 mm. The permanent
deformation values are displayed in Figure 4.26.
The Load Transfer Efficiency values are shown in Table 4.38. The LTE is higher overall
when the loaded wheel crosses joint 26 from slab 27 (the main test slab) compared to the
opposite direction, and is on the order of 80 to 90 percent throughout. In contrast, the LTE for
the other direction is significantly lower throughout, and typically 50 to 65 percent. In
comparison with most of the previous tests, these values can still be regarded as relatively high.
As noted on the previous tests, there is usually a difference in LTE between the two sides
of the joint, which can only be attributed to the asymmetrical conditions of the slabs on either
side of the joint. Contributing factors include differences in crack development, slab support,
and deterioration of the joint interlock due to this asymmetry.
4.9 Test Section 527FD
The HVS test on Test Section 527FD was the last in the series of 150-mm concrete tests,
and over 1.2 million wheel load repetitions were applied to this section. The entire test was
conducted without temperature control.
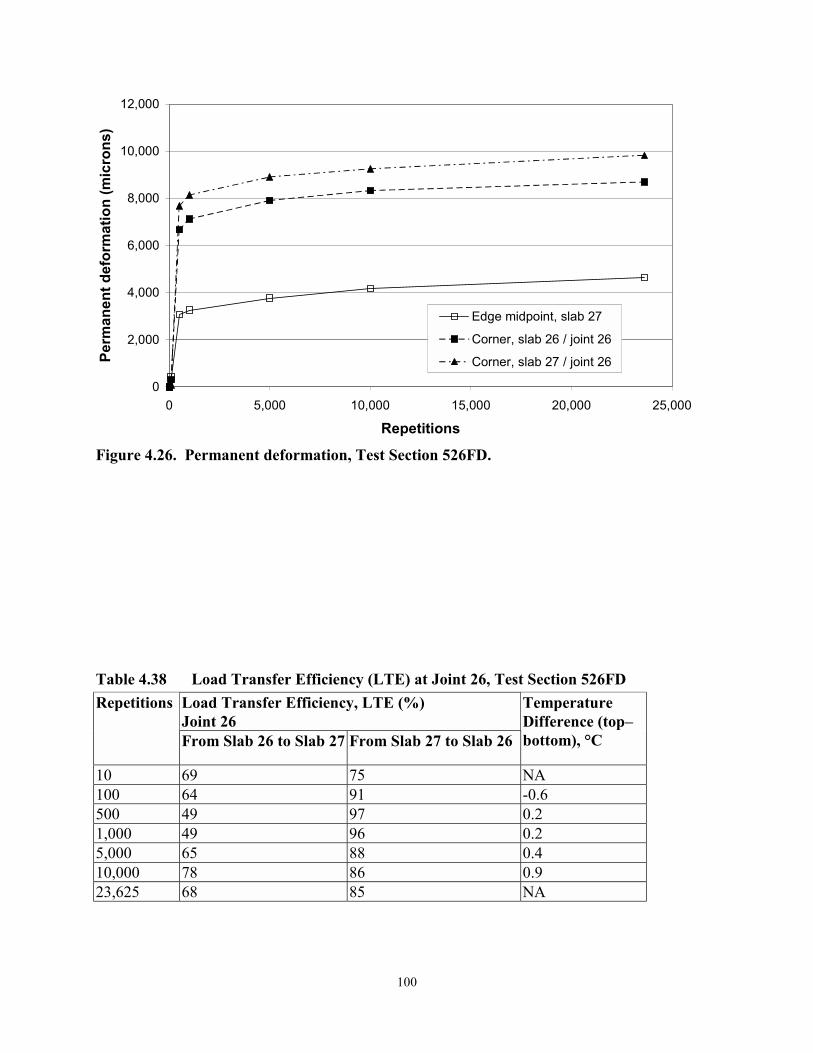
100
0
2,000
4,000
6,000
8,000
10,000
12,000
0 5,000 10,000 15,000 20,000 25,000
Repetitions
Perm
anen
t def
orm
atio
n (m
icro
ns)
Edge midpoint, slab 27
Corner, slab 26 / joint 26
Corner, slab 27 / joint 26
Figure 4.26. Permanent deformation, Test Section 526FD.
Table 4.38 Load Transfer Efficiency (LTE) at Joint 26, Test Section 526FDLoad Transfer Efficiency, LTE (%)Joint 26
Repetitions
From Slab 26 to Slab 27 From Slab 27 to Slab 26
TemperatureDifference (top�bottom), °C
10 69 75 NA100 64 91 -0.6500 49 97 0.21,000 49 96 0.25,000 65 88 0.410,000 78 86 0.923,625 68 85 NA

101
This section was initially trafficked with a 35-kN dual wheel load (to 723,438
repetitions), and the load was then increased to 45 kN for the remainder of the test to a total of
1,233,969 repetitions. The test load levels when deflection measurements were taken were 35
kN for repetitions to 723,438 and 40 kN thereafter. This is normal HVS practice, especially for
cemented slab or base pavements: not to use higher test loads when conducting measurements
than those applied during the traffic history to ensure that inadvertent damage is not caused
during deflection measurements. The 40-kN load represents a half Standard Axle load (variously
defined as 80 kN, 8,160 or 8,200kg, or 18,000lb./18 kip) used as the primary standard for
deflection measurements.
4.9.1 Visual Observations, Test Section 527FD
Test Section 527FD included slabs 21, 22, and 23. A photograph of the full test section
with cracks at the end of HVS trafficking is presented in Photograph 4.31; crack development is
presented in Figure 4.27.
4.9.2 JDMD and EDMD Data, Test Section 527FD
The JDMD and EDMD deflection data are presented in Table 4.39 and the permanent
deformation data in Table 4.40; these data are presented graphically in Figures 4.28 and 4.29,
respectively. A corner crack at slab 23 existed prior to the start of the test (see Photograph 4.32).
The crack started at the edge of slab 23 and curled towards joint 22 (between slabs 23 and 22).
Table 4.39 indicates that the deflections were sensitive to temperature differentials within
the slab. During the daytime, a positive temperature difference existed (surface temperature
warmer than the bottom of the slab) which caused the slab to curl downwards, leading to

102
increased support at the edges of the slab. In this curled down state (daytime), the recorded
deflections were lower than nighttime deflections. During the night, slab curling in the opposite
direction occurred (slab curls up at the edges) so that less support was provided at the edges and
thus, edge deflections were higher.
Deflections on both sides of joint 21 were broadly similar for the first part of the test
(wheel load of 35 kN up to 723,438 repetitions) and in the order of 1,000 microns on the edge
and 2,000 to 2,500 microns at the joint (Figure 4.28). This suggests that there was no significant
deterioration under the trafficking load, with good slab support and aggregate interlock at the
joint being maintained.
When the wheel load was increased to 40 kN, however, the joint deflections dropped
noticeably (see Figure 4.28). In addition, deflections measured on each side of the joint differed
until the end of the test: those on the slab 22 side (main trafficked slab) were generally higher
than those on the slab 21 side.
At the end of the test, deflections on each side of the joint were approximately 1,500
microns. Deflection at the midpoint edge of slab 21 dropped to 350 microns. This may have
been due to the cracks that formed on slab 21 at 890,000 repetitions and on slab 22 at 1,133,694
repetitions, which caused the slab to seat and come into full contact with the base layers similar
to conditions observed in other tests.
The accumulation of permanent deformation at the joint is shown in Figure 4.29. The
trend is similar to that of the elastic deflections. A steady increase in the permanent movement
of the slab at all three recorded positions (midpoint slab edge and each side of joint 21) occurred

Photograph 4.31. Composite photograph of final crack pattern, Test Section 527FD.
103

Joint 22 Joint 21
610
Slab width = 3 660
Note: Loading Sequence
35 kN: 0 - 1 233 969 Reps
Note: Loading Sequence
35 kN: 0 - 1 233 969 Reps
0 Reps 129 805 890 000
1 133 694
0 Reps 129 805 890 000
1 133 694
Slab 23 Slab 22 Slab 21
1 700 1 500
1 000
Figure 4.27. Schematic of crack development, Test Section 527FD (not to scale).
104
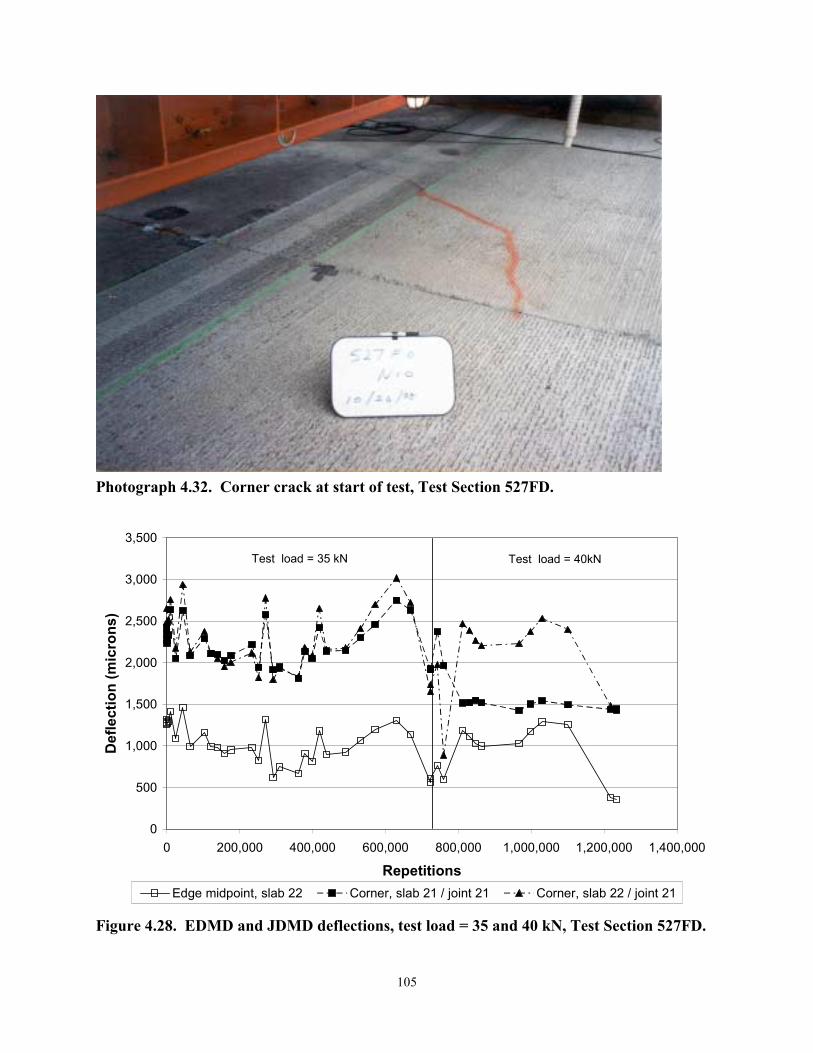
105
Photograph 4.32. Corner crack at start of test, Test Section 527FD.
0
500
1,000
1,500
2,000
2,500
3,000
3,500
0 200,000 400,000 600,000 800,000 1,000,000 1,200,000 1,400,000
Repetitions
Def
lect
ion
(mic
rons
)
Edge midpoint, slab 22 Corner, slab 21 / joint 21 Corner, slab 22 / joint 21
Test load = 35 kN Test load = 40kN
Figure 4.28. EDMD and JDMD deflections, test load = 35 and 40 kN, Test Section 527FD.

106
Table 4.39 EDMD and JDMD Deflections, Test Load = 35 and 40 kN, Test Section527FD
Deflection (m × 10-6)Corner, Joint 21
RepetitionsMidpointEdge, Slab 22 Slab 21 Side Slab 22 Side
TemperatureDifference (top-bottom), °C
Test load = 35 kN10 1,264 2,343 2,485 -0.3100 1,317 2,415 2,651 -0.3500 1,274 2,234 2,485 0.01,000 1,285 2,273 2,493 0.45,000 1,298 2,334 2,515 -1.210,000 1,415 2,636 2,757 1.324,639 1,092 2,054 2,177 3.444,126 1,465 2,627 2,940 NA63,823 991 2,085 2,130 -0.6102,913 1,159 2,290 2,376 -3.0120,837 990 2,114 2,113 0.2139,543 980 2,100 2,053 3.5157,820 909 2,025 1,952 3.4175,869 951 2,085 2,005 2.7233,374 978 2,218 2,119 -0.5252,121 826 1,945 1,818 -1.5271,306 1,316 2,576 2,778 -3.6291,508 620 1,916 1,798 0.1309,517 748 1,951 1,933 2.1360,939 670 1,813 1,832 NA378,914 905 2,134 2,185 NA398,313 812 2,052 2,081 0.8417,729 1,180 2,420 2,655 0.8437,509 899 2,139 2,159 1.5490,928 925 2,147 2,176 1.4531,485 1,064 2,301 2,412 -0.3571,386 1,195 2,461 2,701 -0.7630,633 1,301 2,751 3,018 -3.8668,205 1,139 2,633 2,727 NATest load increased to 40 kN723,438 560 1,916 1,653 5.8723,600 604 1,930 1,735 5.7742,218 763 2,372 1,975 NA759,493 597 1,967 889 -0.5811,727 1,187 1,517 2,468 -3.8830,394 1,115 1,521 2,390 3.5847,623 1,027 1,548 2,269 -1.3863,483 998 1,519 2,205 0.3966,586 1,026 1,427 2,231 1.0997,540 1,175 1,503 2,375 2.81,029,411 1,287 1,542 2,534 5.61,100,314 1,259 1,494 2,401 NA1,218,163 382 1,439 1,482 NA1,233,969 352 1,445 1,429 NA

107
Table 4.40 Permanent Deformation, Test Section 527FDPermanent Deformation (m × 10-6)
Corner, Joint21Repetitions
Midpoint Edge,Slab 22 Slab 21 Side Slab 22 Side
10 0 0 0100 3,280 3,726 955500 3,358 4,043 1,2331,000 3,501 4,151 1,3085,000 3,711 3,819 1,51810,000 3,764 3,870 1,46824,639 4,138 4,352 2,05344,126 3,707 3,581 1,07663,823 4,555 4,767 2,299102,913 4,515 4,749 2,113120,837 4,822 5,102 2,384139,543 4,854 5,232 2,584157,820 5,092 5,336 2,737175,869 4,996 5,232 2,698233,374 4,971 5,174 2,655252,121 5,188 5,545 2,990271,306 4,661 4,810 1,953291,508 6,040 7,159 4,533309,517 6,032 7,192 4,644360,939 6,339 7,628 5,039378,914 6,139 7,393 4,683398,313 6,253 7,556 4,801417,729 5,844 7,166 4,163437,509 6,168 7,451 4,640490,928 6,207 7,635 4,662531,485 6,047 7,444 4,394571,386 5,897 7,238 4,066630,633 6,146 7,592 4,558668,205 6,342 7,757 4,854723,438 6,844 8,482 5,685723,600 6,919 8,575 5,841742,218 6,713 8,074 5,510759,493 6,389 8,035 4,815811,727 6,670 10,557 5,036830,394 6,624 10,560 5,150847,623 6,766 10,622 5,264863,483 6,834 10,766 5,403966,586 6,552 10,870 5,089997,540 6,445 10,852 5,0361,029,411 6,332 10,860 4,9221,100,314 6,296 10,986 4,9251,218,163 7,663 11,281 6,2651,233,969 7,656 11,407 6,305

108
0
2,000
4,000
6,000
8,000
10,000
12,000
0 200,000 400,000 600,000 800,000 1,000,000 1,200,000 1,400,000
Repetitions
Perm
anen
t def
orm
atio
n (m
icro
ns)
Edge midpoint, slab 22 Corner, slab 21 / joint 21 Corner, slab 22 / joint 21
Figure 4.29. EDMD and JDMD permanent deformation, Test Section 527FD.
during the 35-kN loading phase. After the load was increased to 40 kN, an increased rate of
permanent deformation was observed. The slab 21 side of joint 21 recorded the most movement,
with over 11 mm at the end of the test, compared with the slab 22 side having 6.3 mm.
As seen in Photograph 4.31, slab 23 had a corner crack from the outset, about 1.7 m from
the edge. After 129,805 repetitions, a new longitudinal crack at about 1.5 m from the edge of the
tested slab (slab 22) formed. Shortly after the load was increased to 40 kN (after 890,000
repetitions), a longitudinal crack formed on slab 21. This new crack developed through the entire
width of the slab, also about 1.5 m from the edge.
The Load Transfer Efficiency values for Section 527FD are shown in Table 4.41. For the
first 271,306 repetitions, load transfer deteriorates progressively with the increased number of
applied load cycles: from approximately 80 percent to 50 percent with the load wheel running

109
Table 4.41 Load Transfer Efficiency, Test Section 527FDLoad Transfer Efficiency, LTE (%)Joint 21
Repetitions
From Slab 22 to Slab 21 From Slab 21 to Slab 22
TemperatureDifference(top�bottom), °C
Test load = 35 kN10 81.1 69.0 -0.3100 83.3 64.9 -0.3500 82.6 62.4 0.01,000 82.9 64.2 0.45,000 80.0 65.5 -1.210,000 81.2 72.7 1.324,639 77.4 66.2 3.444,126 83.2 65.3 NA63,823 49.6 46.7 -0.6102,913 53.9 59.0 -3.0120,837 53.3 66.8 0.2139,543 48.1 67.6 3.5157,820 44.7 64.8 3.4175,869 40.6 60.3 2.7233,374 36.8 56.8 -0.5252,121 29.7 51.5 -1.5271,306 49.2 42.8 -3.6291,508 3.2 8.7 0.1309,517 5.4 4.9 2.1360,939 10.1 3.8 NA378,914 12.9 3.6 NA398,313 12.3 11.1 0.8417,729 20.3 7.3 0.8437,509 15.7 25.3 1.5490,928 23.0 12.6 1.4531,485 23.0 7.2 -0.3571,386 32.5 16.5 -0.7630,633 25.7 15.8 -3.8668,205 15.8 7.9 NA723,438 8.9 12.7 5.8Test load = 40 kN723,600 10.0 2.5 5.7742,218 18.9 11.8 NA759,493 5.8 1.4 -0.5811,727 88.6 5.5 -3.8830,394 73.8 3.7 3.5847,623 67.0 1.6 -1.3863,483 50.0 6.0 0.3966,586 82.4 9.5 1.0997,540 82.0 11.6 2.81,029,411 92.1 15.3 5.61,100,314 97.4 10.7 NA1,218,163 41.0 14.3 NA1,233,969 33.8 11.3 NA

110
from slab 21 to slab 22, and from roughly 70 percent to 40 percent when running in the opposite
direction.
The readings taken from 291,508 repetitions onward show that a significant change had
occurred (LTEs dropping to less than 10 percent initially) consistent with formation of new
cracks. It will be noted, however, that this change was not detected in the visual crack
observations (Figure 4.29), and that the appearance of visible cracks does not seem to necessarily
coincide with any marked changes in LTE.
4.10 Test Section 528FD
The HVS test on Test Section 528FD was the first test conducted on the 200-mm thick
concrete sections. It was performed on slabs 34, 35 and 36 on the South Tangent with
temperature control. As shown in Figure 4.30, slab 35 (total length of 4.7 m) was fully tested,
together with some area on either side of joints 34 and 35 (on slabs 34 and 36).
A 40-kN dual wheel load was used for the entire duration of the test to a total of 83,045
repetitions. An overhead photograph of the test section after HVS trafficking is presented in
Photograph 4.33.
4.10.1 Visual Observations, Test Section 528FD
Prior to the start of the HVS test on Section 528FD, no cracks were visible on the test
section. After approximately 56,912 load repetitions, a transverse crack developed in the middle
slab (slab 35) between both joints (see Photograph 4.34). This crack pattern suggests that the
slab failed due to fatigue and if time permitted, the crack may have developed into a corner
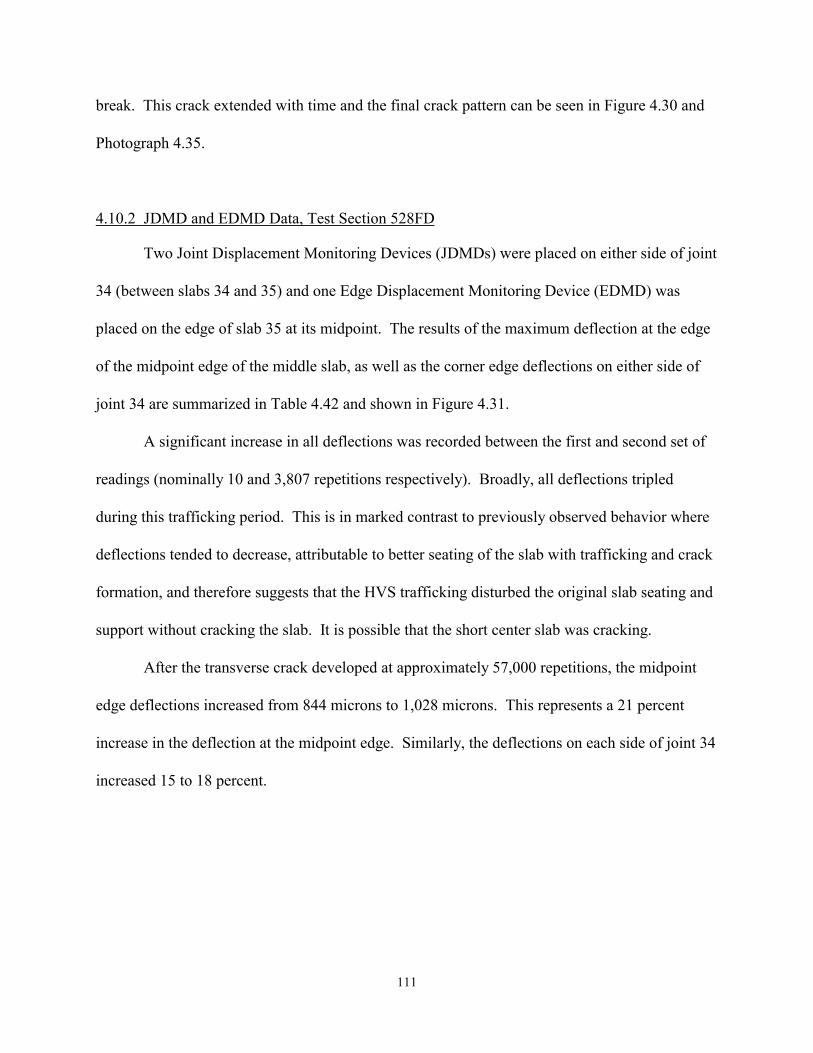
111
break. This crack extended with time and the final crack pattern can be seen in Figure 4.30 and
Photograph 4.35.
4.10.2 JDMD and EDMD Data, Test Section 528FD
Two Joint Displacement Monitoring Devices (JDMDs) were placed on either side of joint
34 (between slabs 34 and 35) and one Edge Displacement Monitoring Device (EDMD) was
placed on the edge of slab 35 at its midpoint. The results of the maximum deflection at the edge
of the midpoint edge of the middle slab, as well as the corner edge deflections on either side of
joint 34 are summarized in Table 4.42 and shown in Figure 4.31.
A significant increase in all deflections was recorded between the first and second set of
readings (nominally 10 and 3,807 repetitions respectively). Broadly, all deflections tripled
during this trafficking period. This is in marked contrast to previously observed behavior where
deflections tended to decrease, attributable to better seating of the slab with trafficking and crack
formation, and therefore suggests that the HVS trafficking disturbed the original slab seating and
support without cracking the slab. It is possible that the short center slab was cracking.
After the transverse crack developed at approximately 57,000 repetitions, the midpoint
edge deflections increased from 844 microns to 1,028 microns. This represents a 21 percent
increase in the deflection at the midpoint edge. Similarly, the deflections on each side of joint 34
increased 15 to 18 percent.

Photograph 4.33. Composite photograph of final crack pattern, Test Section 528FD.
112
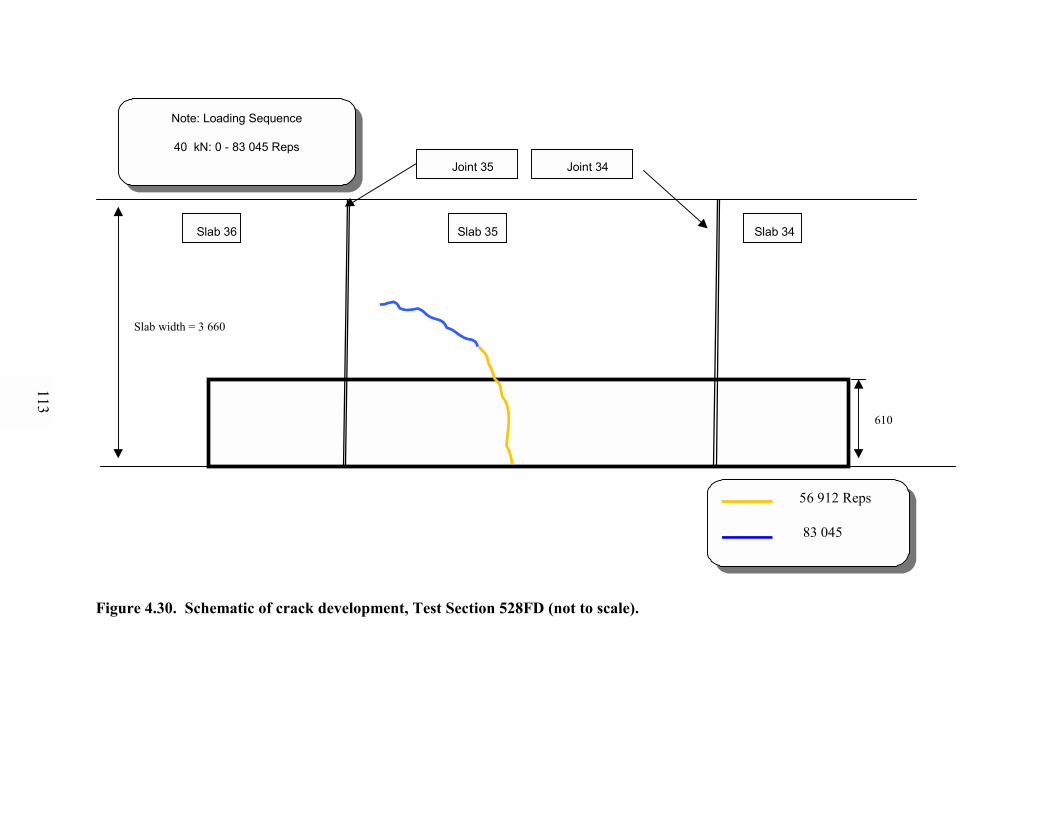
Joint 35 Joint 34
610
Slab width = 3 660
Note: Loading Sequence
40 kN: 0 - 83 045 Reps
Note: Loading Sequence
40 kN: 0 - 83 045 Reps
56 912 Reps
83 045
56 912 Reps
83 045
Slab 36 Slab 35 Slab 34
Figure 4.30. Schematic of crack development, Test Section 528FD (not to scale).
113

114
Photograph 4.34. Transverse crack after 52,000 repetitions, Test Section 528FD.
Photograph 4.35. Final crack pattern after 83,000 repetitions, Test Section 528FD.

115
Table 4.42 EDMD and JDMD Deflections, Test Load = 40 kN, Test Section 528FDDeflection (m × 10-6)
Corner, Joint34Repetitions
MidpointEdge, Slab 35 Slab 35 Side Slab 34 Side
TemperatureDifference (top�bottom), °C
10 287 434 602 NA3,807 819 1,287 1,751 -0.715,554 755 1,174 1,777 -0.227,347 958 1,324 1,954 -1.030,783 844 1,753 1,751 3.075,227 1,028 2,031 2,072 -1.183,045 992 1,951 2,066 -1.3
0
500
1,000
1,500
2,000
2,500
0 10,000 20,000 30,000 40,000 50,000 60,000 70,000 80,000 90,000
Repetitions
Def
lect
ion
(mic
rons
)
Edge midpoint, slab 35Corner, slab 34 / joint 34Corner, slab 35 / joint 34
Figure 4.31. EDMD and JDMD deflections, test load = 40 kN, Test Section 528FD.
4.10.3 Load Transfer Efficiency, Test Section 528FD
The Load Transfer Efficiency (LTE) was calculated at joint 34 (the joint between slab 35
and slab 34), and the results are summarized in Table 4.43. It was calculated for the HVS wheel
running in both directions. LTE is defined as the ratio of the deflection on the unloaded slab to
the maximum deflection on the loaded slab at the joint.

116
Table 4.43 Load Transfer Efficiency at Joint 34, Test Section 528FDLoad Transfer Efficiency, LTE (%),Joint 34
Repetitions
From Slab 35 toSlab 34
From Slab 34 toSlab 35
TemperatureDifference (top�bottom), °C
10 82.3 21.9 NA3,807 86.3 31.9 -0.715,554 116.6 41.3 -0.227,347 100.7 31.9 -1.030,783 71.7 67.8 3.075,227 39.7 30.0 -1.183,045 42.2 22.9 -1.3
The LTE was always higher when the HVS loaded wheel approached the joint from slab
35 (the main trafficked slab) than when it approached from the opposite side. These results
suggest that the crack which had formed at the bottom of the saw-cut joint is not perfectly
vertical, propagated down toward the inner slab (35), thus providing more support (load transfer)
when the load is approaching from slab 35.
It would be assumed that as the test progressed, the aggregate interlock between the two
slabs would deteriorate causing a decrease in LTE. From Table 4.43 this tendency is not clearly
apparent, possibly highlighting the fact that load transfer also depends on support conditions,
cracking, and temperature/environmental conditions.
4.10.4 Strain Gauge Data, Test Section 528FD
Strain measurements were taken at two locations stated previously in Section 3.2. The
gauges in the middle of the center slab (slab 35) did not produce any reliable results and the data
were disregarded. The strain gauge adjacent to joint 35 was the only gauge that indicated
significant differences in strain levels within the slab. However, the crack pattern suggests that

117
these strain levels had no direct correlation to the failure of the slab. The maximum tensile
strains are summarized in Table 4.44.
Table 4.44 Dynamic Strain Data, Test Load = 40 kN, Test Section 528FDMaximum Tensile Strain (microstrain)RepetitionsDynatest PMR X PMR M PMR Y
10 0.0 231 0.0 0.03,807 359 92 166 80515,554 198 103 150 89027,347 388 69 122 79530,783 300 57 358 51375,227 284 95 130 88483,045 267 64 408 514
4.11 Test Section 529FD
HVS Test Section 529FD was completed on slabs 30, 31 and 32 on the South Tangent,
with the 8 ×1 m HVS test section located so that slab 31 was tested along its entire edge. The
test started with a 40-kN dual wheel load, which was kept constant to 88,110 repetitions, after
which it was increased to 60 kN for an additional 264,214 repetitions. The test was stopped at
352,324 load repetitions. The crack pattern, as it developed with time, can be seen in Figure
4.32. A composite photograph of Test Section 529FD can be seen in Photograph 4.36.
4.11.1 Visual Observations, Test Section 529FD
After 88,110 40-kN load repetitions and another 142,020 60-kN load repetitions (totaling
230,130 load applications), a corner crack developed on slab 30 which is directly adjacent to the
middle slab (slab 31) (see Photograph 4.37). After an additional 92,403 60-kN load repetitions, a
longitudinal corner crack developed at joint 30 and propagated toward the slab edge midpoint of
slab 31. Finally, after 14,997 more repetitions at 60 kN, the crack initiating from joint 31
developed into a longitudinal and transverse break (Photograph 4.38).

118
4.11.2 JDMD and EDMD Data, Test Section 529FD
Two Joint Displacement Monitoring Devices (JDMDs) were placed on either side of joint
31 (between slabs 31 and 32) and one Edge Displacement Monitoring Device (EDMD) was
placed on the edge at the midpoint of slab 31. The results are summarized in Table 4.45 for the
40-kN test load and Table 4.46 for the 60-kN test load.
The results are shown in Figure 4.33 (40-kN test load) and Figure 4.34 (60-kN test load).
The joint where the deflections were monitored (joint 31) was not the joint where corner breaks
occurred, and the only significant trend is that the deflections increase with increasing
repetitions.
4.11.3 Load Transfer Efficiency, Test Section 529FD
The Load Transfer Efficiency (LTE) was calculated at joint 31, and the results are
summarized in Table 4.47. LTE was calculated for the HVS wheel running in both directions.
From 29,000 load repetitions (when the LVDT was corrected) to the end of the loading
cycle, there is little to suggest that any significant change in LTE occurred. There was, however,
a marked difference in the values for the two directions. In the case of wheel travel from slab 32
to slab 31, the LTE remained in the order of 110 to 120 percent throughout. In contrast, crossing
the joint in the opposite direction gave LTEs typically from 10 to 30 percent.
It is conjectured that the sawed joint did not propagate straight down to the base. It
appears that the crack propagated down toward slab 32, which is directly to the left of the mid-
slab (slab 31).
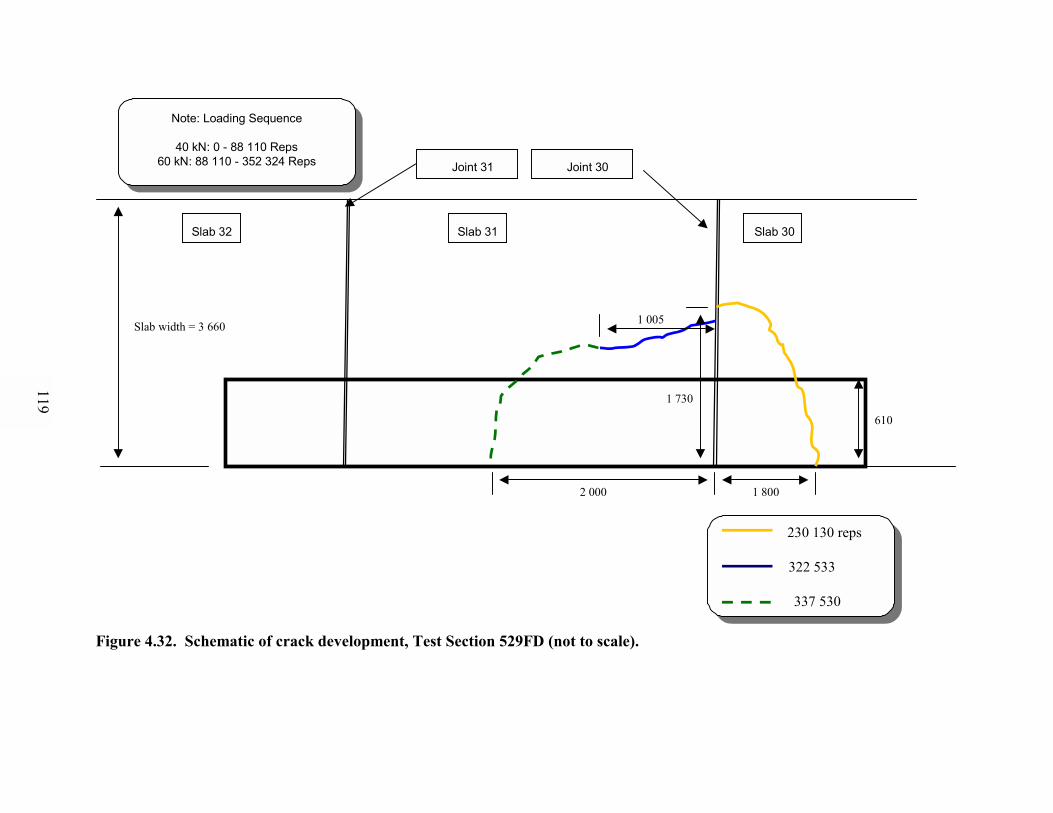
Joint 31 Joint 30
610
Slab width = 3 660
Note: Loading Sequence
40 kN: 0 - 88 110 Reps60 kN: 88 110 - 352 324 Reps
Note: Loading Sequence
40 kN: 0 - 88 110 Reps60 kN: 88 110 - 352 324 Reps
230 130 reps
322 533
337 530
230 130 reps
322 533
337 530
2 000
1 730
1 800
1 005
Slab 32 Slab 31 Slab 30
Figure 4.32. Schematic of crack development, Test Section 529FD (not to scale).
119

Photograph 4.36. Composite photograph of final crack pattern, Test Section 529FD.
120
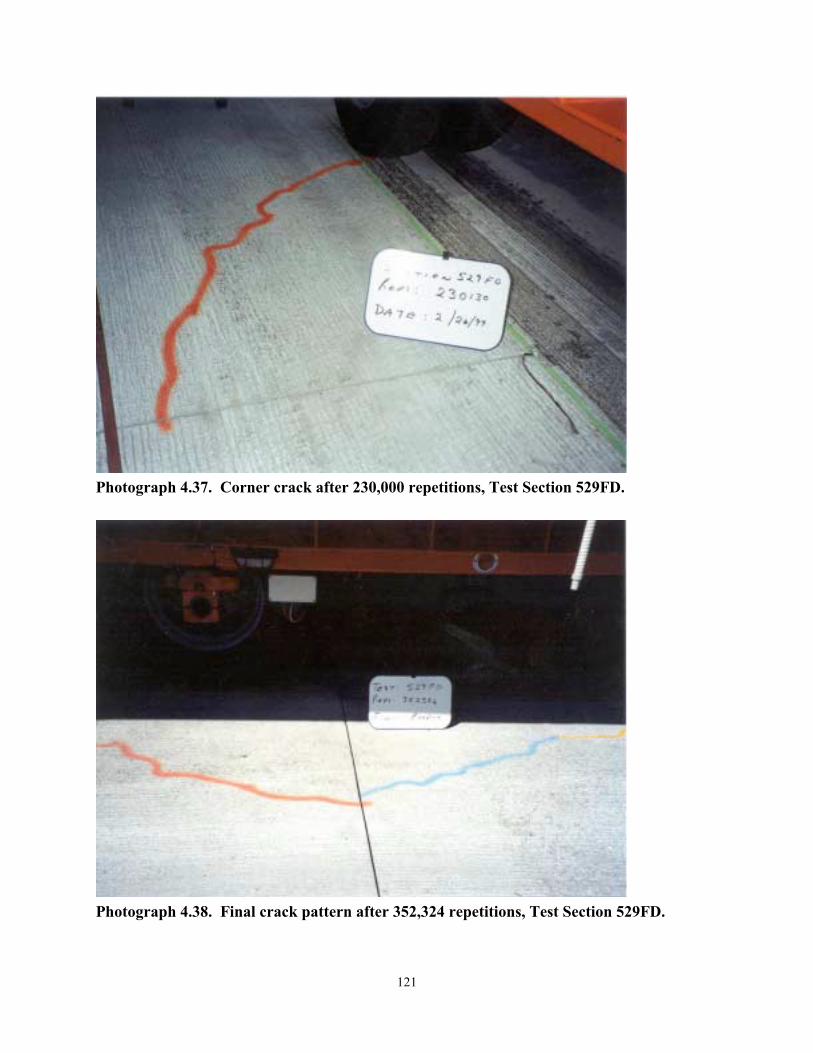
121
Photograph 4.37. Corner crack after 230,000 repetitions, Test Section 529FD.
Photograph 4.38. Final crack pattern after 352,324 repetitions, Test Section 529FD.

122
Table 4.45 EDMD and JDMD Deflections, Test Load = 40 kN, Test Section 529FDDeflection (m × 10-6)
Corner, Joint 31Repetitions
Midpoint Edge,Slab 31 Slab 32 Side Slab 31 Side
TemperatureDifference (top�bottom),°C
10 188 748 11 7.53,641 667 1,249 11 5.516,641 779 1,388 9 2.429,015 840 1,646 784* 1.343,090 781 1,357 815 7.188,110 855 1,597 812 2.4*Reset LVDT due to instrument failure
Table 4.46 EDMD and JDMD Deflections, Test Load = 60 kN, Test Section 529FDDeflection (m × 10-6)
Corner, Joint 31Repetitions
Midpoint Edge,Slab 31 Slab 32 Side Slab 31 Side
TemperatureDifference (top�bottom), °C
0 951 1,725 903 2.42,861 950 2,048 1,068 3.414,985 1,060 1,868 1,081 2.017,646 964 2,015 1,119 3.530,368 1,050 1,771 1,097 2.946,114 1,165 2,082 1,230 0.161,743 1,182 2,274 1,417 -1.4109,788 1,127 1,910 1,117 0.6126,306 906 1,646 1,050 1.6142,020 824 1,621 1,176 2.8157,811 885 1,572 1,122 2.2174,249 1,023 2,100 1,178221,140 970 2,167 1,262 1.1234,423 975 2,248 1,299 0.7249,420 899 2,322 1,359 -1.1264,214 907 2,339 1,325 -0.5

123
0
500
1,000
1,500
2,000
2,500
0 10,000 20,000 30,000 40,000 50,000 60,000 70,000 80,000 90,000
Repetitions
Def
lect
ion
(mic
rons
)
Edge midpoint, slab 31Corner, slab 31 / joint 31Corner, slab 32 / joint 31
Figure 4.33. Elastic surface deflections, test load = 40 kN, Test Section 529FD.
0
500
1,000
1,500
2,000
2,500
0 50,000 100,000 150,000 200,000 250,000 300,000
Repetitions
Def
lect
ion
(mic
rons
)
Edge midpoint, slab 31Corner, slab 31 / joint 31Corner, slab 32 / joint 31
Figure 4.34. Elastic surface deflections, test load = 60 kN, Test Section 529FD.

124
Table 4.47 Load Transfer Efficiency, Joint 31, Test Section 529FDLoad Transfer Efficiency,LTE (%),Joint 31
Repetitions
From Slab 32to Slab 31
From Slab 31to Slab 32
TemperatureDifference(top�bottom),°C
Test load = 40 kN10 -251.6* 0.1 7.53,641 -2,621.3* 0.3 5.516,641 -2,225.7* 0.0 2.429,015 123.0 -0.9 1.343,090 119.5 18.9 7.188,110 116.8 10.0 2.4Test load = 60 kN88,110 114.0 11.6 2.490,971 113.6 9.4 3.4103,095 113.5 21.3 2.0105,756 115.9 13.2 3.5118,478 117.6 26.6 2.9134,224 116.7 16.1 0.1149,853 108.9 25.9 -1.4197,898 113.8 14.7 0.6214,416 111.2 22.2 1.6230,130 110.3 37.6 2.8245,921 108.9 36.2 2.2262,359 110.9 7.9309,250 110.2 12.1 1.1322,533 110.5 13.7 0.7337,530 111.7 15.2 -1.1352,324 109.2 9.0 -0.5* Not reliable due to LVDT failure
4.12 Test Section 530FD
The HVS test on Test Section 530FD was completed on slabs 38, 39 and 40 on the South
Tangent, with the 8 × 1 m HVS test section located so that slab 39 was tested along its entire
edge. The test started with a 40-kN dual wheel load, which was kept constant up to 64,227
repetitions, then increased to 60 kN for an additional 752,448 repetitions and finally up to 90 kN

125
for an additional 30,170 repetitions. The test was stopped at a cumulative total of 846,845 load
repetitions. The test was conducted with temperature control.
The crack pattern, as it developed with time, can be seen in Figure 4.35. Photograph 4.39
presents an overhead view of the test section at the completion of HVS trafficking. Photograph
4.39 also clearly shows evidence of the Weigh-In-Motion piezometers that were installed on slab
40. Photograph 4.40 presents another view of the cracks on Test Section 530FD.
4.12.1 Visual Observations, Test Section 530FD
After 64,227 40-kN load repetitions and 227,457 60-kN load repetitions (totaling 291,684
load applications), a corner crack developed on slab 38. After an additional 524,991 60-kN load
repetitions and 30,170 90-kN load repetitions (totaling 830,463 repetitions), a transverse crack
developed at joint 38 and propagated toward the longitudinal edge of slab 39. This is the same
failure mode as experienced on the previous section (529FD).
4.12.2 JDMD and EDMD Data, Test Section 530FD
Two Joint Displacement Monitoring Devices (JDMDs) were placed on either side of joint
38 (between slabs 38 and 39) and one Edge Displacement Monitoring Device (EDMD) was
placed at the midpoint edge of the middle slab (slab 39). The results are summarized in Tables
4.48, 4.49 and 4.50 for the 40-, 60-, and 90-kN test loads, respectively. The surface deflections
as detailed in these tables are shown in Figures 4.36 to 4.38.

Joint 39 Joint 38
610
Slab width = 3 660
Note: Loading Sequence
40 kN: 0 - 64 227 Reps60 kN: 64 227 - 816 674 Reps
90 kN: 816 674 - 846 844 Reps
Note: Loading Sequence
40 kN: 0 - 64 227 Reps60 kN: 64 227 - 816 674 Reps
90 kN: 816 674 - 846 844 Reps
291 684 Reps
830 463
291 684 Reps
830 463
1 340
1 440
1400
1 290
Slab 40 Slab 39 Slab 38
Figure 4.35. Schematic of crack development, Test Section 530FD (not to scale).
126
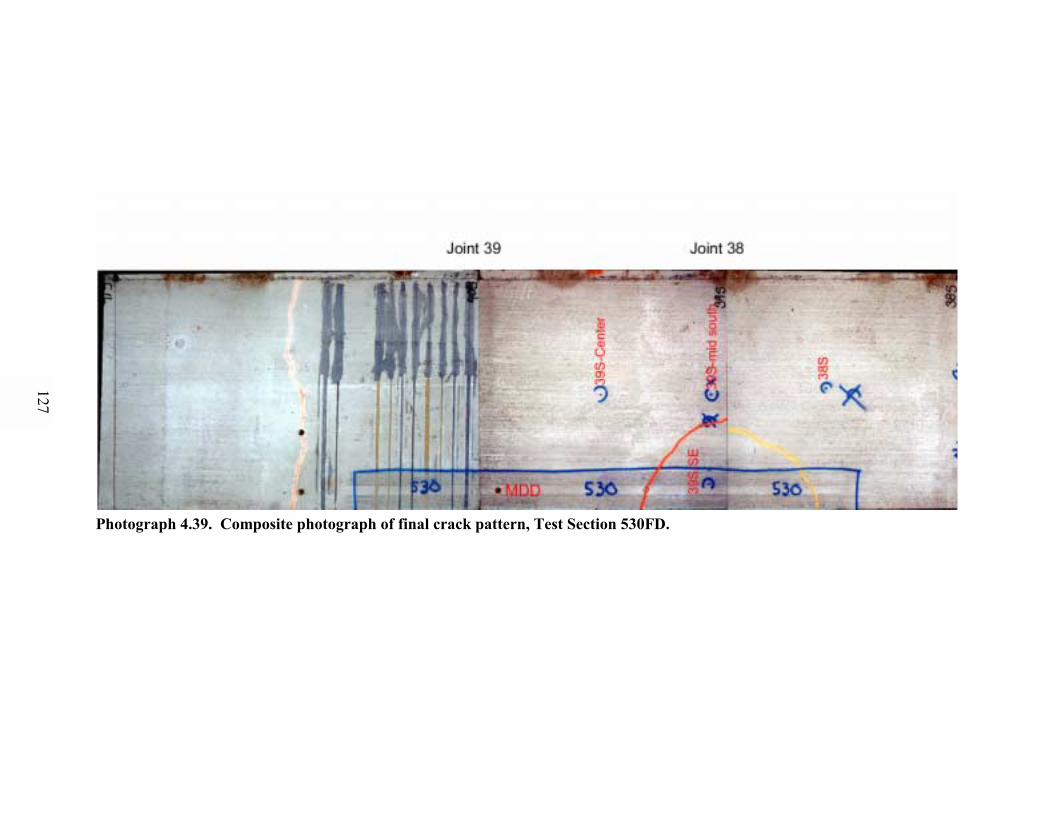
Photograph 4.39. Composite photograph of final crack pattern, Test Section 530FD.
127

128
Photograph 4.40. Final crack pattern at the end of the test (846,844 repetitions), TestSection 530FD.
Table 4.48 EDMD and JDMD Deflections, Test Load = 40 kN, Test Section 530FDDeflection (m × 10-6)
Corner, Joint 38Repetitions
Edge Midpoint,Slab 39 Slab 39 Side Slab 38 Side
TemperatureDifference (top�bottom), °C
0 552 1,552 2,277 -1.12,500 642 1,674 2,053 -0.45,000 636 1,626 1,056 0.514,000 645 1,669 1,958 -0.263,157 700 1,811 2,201 1.064,227 557 1,362 2,002 3.2

129
Table 4.49 EDMD and JDMD Deflections, Test Load = 60 kN, Test Section 530FDDeflection (m × 10-6)
Corner, Joint 38Repetitions
Edge Midpoint,Slab 39 Slab 39 Side Slab 38 Side
Temperature Difference(top�bottom), °C
40 kN Load0 711 1,699 2,408 3.2973 909 2,267 2,746 -0.516,161 971 2,496 3,168 0.032,197 988 2,581 3,210 -0.247,558 995 2,511 3,153 2.497,539 988 2,512 3,102 1.5111,092 1,062 2,743 3,343 -1.1126,508 1,000 2,621 3,293 1.0141,336 1,024 2,690 3,376 0.5157,003 1,020 2,529 3,088 1.0203,411 975 2,592 3,034 0.7213,992 1,039 2,756 3,380 -1.1227,457 989 2,676 2,425 -0.3242,558 996 2,499 1,830 1.1255,649 972 2,380 1,536 0.4303,026 1,018 2,523 1,697 0.5318,207 1,019 2,558 1,716 0.1388,303 670 1,762 1,257 -0.9404,454 715 2,097 1,680 3.1447,175 906 2,421 1,782 -0.7460,778 956 2,552 1,775 0.1508,219 955 2,558 1,648 0.0523,308 963 2,581 1,687 -0.2538,949 967 2,698 1,775 -0.5554,430 1,039 2,721 1,674 -0.5570,085 1,026 2,794 1,742 -0.5617,323 1,055 2,737 1,643 -0.4633,148 887 2,685 1,526 -0.3647,556 1,039 2,757 1,612 0.0662,575 950 2,656 1,514 0.2677,160 962 2,655 1,555 -0.1724,820 794 2,583 1,406 -0.5737,478 996 2,797 1,589 -0.3752,448 1,007 2,815 1,649 0.1
Table 4.50 EDMD and JDMD Deflections, Test Load = 90 kN, Test Section 530FDDeflection (m × 10-6)
Corner, Joint 38Repetitions
Edge Midpoint,Slab 39 Slab 39 Side Slab 38 Side
TemperatureDifference (top�bottom), °C
0 1,160 3,065 1,744 NA1,000 862 2,571 1,211 0.114,789 1,398 1,210 1,076 -1.230,170 1,446 1,239 1,297 -0.1
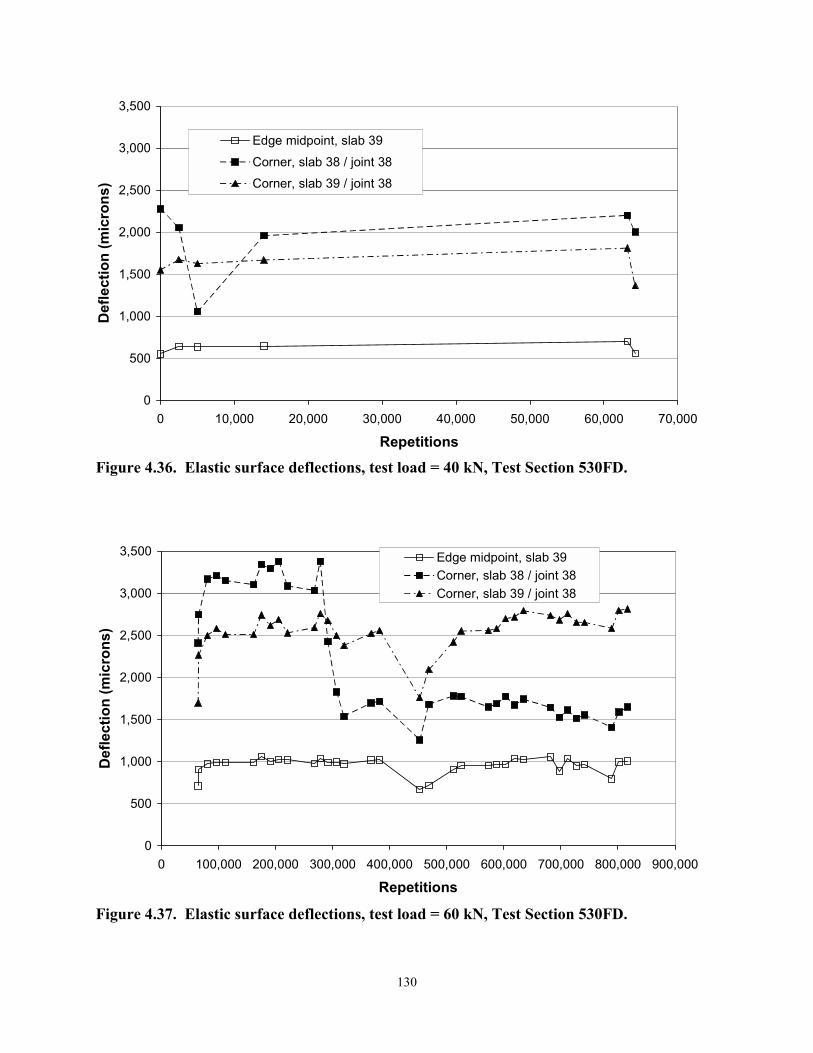
130
0
500
1,000
1,500
2,000
2,500
3,000
3,500
0 10,000 20,000 30,000 40,000 50,000 60,000 70,000
Repetitions
Def
lect
ion
(mic
rons
)
Edge midpoint, slab 39Corner, slab 38 / joint 38Corner, slab 39 / joint 38
Figure 4.36. Elastic surface deflections, test load = 40 kN, Test Section 530FD.
0
500
1,000
1,500
2,000
2,500
3,000
3,500
0 100,000 200,000 300,000 400,000 500,000 600,000 700,000 800,000 900,000
Repetitions
Def
lect
ion
(mic
rons
)
Edge midpoint, slab 39Corner, slab 38 / joint 38Corner, slab 39 / joint 38
Figure 4.37. Elastic surface deflections, test load = 60 kN, Test Section 530FD.

131
0
500
1,000
1,500
2,000
2,500
3,000
3,500
815,000 820,000 825,000 830,000 835,000 840,000 845,000 850,000
Repetitions
Def
lect
ion
(mic
rons
)
Mid-span edge, slab 39
Corner, slab 38 / joint 38
Corner, slab 39 / joint 38
Figure 4.38. Elastic surface deflections, test load = 90 kN, Test Section 530FD.
While the test load was 40 kN (to 64,227 repetitions), the deflections stayed relatively
constant, in the order of 0.6 mm at the edge midpoint and 1.6 to 2 mm on either side of joint 38.
After 227,457 repetitions at 60 kN (291,684 total repetitions), a corner crack developed on slab
38. This is shown in Figure 4.37, where the deflection reading of the JDMD on the slab 38 side
of the joint decreases significantly. When the load was raised to 90 kN, a corner crack developed
on slab 39 at approximately 5,000 90kN load repetitions (830,463 total repetitions), which is
shown by the drop in deflection for the slab 39 side of the joint in Figure 4.38.
4.12.3 Load Transfer Efficiency, Test Section 530FD
The Load Transfer Efficiency (LTE) was calculated at joint 38; the results are
summarized in Table 4.51. LTE was calculated for the HVS wheel running in both directions
across the joint.

132
Table 4.51 again highlights the difference in LTE between crossing the joint in different
directions observed throughout this test series, and the underlying asymmetry between conditions
of adjacent slabs. Until the appearance of the first visible crack at 290,000 repetitions, LTEs
seemed to have settled around 25 and 35 percent for the both directions of wheel travel. A
marked increase then occurred when running from slab 39 to slab 38 (which cracked), from
approximately 25 percent to 70 percent and higher. The difference running across the joint in the
other direction is far less, initially increasing from approximately 35 to approximately 45 percent,
but then decreasing again to around 35 percent.
The formation of the visible crack in slab 39 near the end of the test at 830,000 repetitions
seems to cause another change in LTEs as might be expected, but the limited data are
inconclusive other than indicating a possible reduction in LTE.
4.12.4 MDD Elastic Deflection Data, Test Section 530FD
One MDD was installed on Section 530FD, near joint 39 on slab 39. This MDD was
installed between the wheel paths of the dual wheels about 0.3 m from the edge of the slab.
MDD modules were installed inside the 200-mm thick concrete slab at a depth of 50 mm as well
as at the top of the base course (225 mm) and the top of the in-situ soil (425 mm). The results of
the peak MDD deflections can be seen in Table 4.52 and Figure 4.39.
Figure 4.39 shows that the deflection of the concrete is significantly higher than the
aggregate base or subgrade. This may result from curling of the slab in an upward direction.
This same trend is noted for the 100- and 150-mm test sections.

133
Table 4.51 Load Transfer Efficiency, Joint 38, Test Section 530FDLoad Transfer Efficiency, LTE (%) Joint 38RepetitionsFrom slab 38 to slab 39 From slab 39 to slab 38
Temperature Difference(top�bottom), °C
40-kN trafficking load0 16 83 -1.12,500 39 63 -0.45,000 93 14 0.514,000 55 70 -0.263,157 31 67 1.064,227 7 60 3.260-kN trafficking load64,227 10 65 3.265,200 15 50 -0.580,388 19 50 0.096,424 22 48 -0.2111,785 29 51 2.4161,766 30 43 1.5175,319 26 41 -1.1190,735 26 42 1.0205,563 28 46 0.5221,230 25.8 33 1.0267,638 27 28 0.7278,219 27 35 -1.1291,684 70 46 -0.3306,785 80 48 1.1319,876 87 36 0.4367,253 85.6 39 0.5382,434 86 41 0.1452,530 98 29 -0.9468,681 89 39 3.1511,402 102 50 -0.7525,005 99 45 0.1572,446 109 36 0.0587,535 103 38 -0.2603,176 99 42 -0.5618,657 101 39 -0.5634,312 108 40 -0.5681,550 105 37 -0.4697,375 110 31 -0.3711,783 105 36 0.0726,802 106 34 0.2741,387 99 35 -0.1789,047 109 30 -0.5801,705 105 34 -0.3816,675 101 37 0.190-kN trafficking load816,675 114 32 NA817,675 138 19 0.1830,464 67 48 -1.2846,845 49 23 -0.1

134
4.12.5 MDD Permanent Deformation Data, Test Section 530FD
The permanent deformation for the pavement layers was measured using the same MDD;
the results are presented in Table 4.53 and Figure 4.40.
From the preceding tables and Figure 4.40 at some 450,000 load repetitions, there is a
significant increase in the concrete permanent deformation and a decrease in both the base and
subgrade deformation values. This may be due to movement of the modules inside the MDD
hole, or a crack in the concrete layer that was not discovered because it was either microscopic or
initiated at the bottom of the layer.
4.13 Test Section 531FD
Test Section 531FD was conducted on slabs 41, 42 and 43 and was the last HVS test
performed on the South Tangent. The test was conducted with temperature control. As shown in
Figure 4.41, slab 42 (total length of 4.7 m) was fully tested, together with some area on either
side of joints 41 and 42. The test started with a 40-kN dual wheel load, which was kept constant
up to 31,318 repetitions, after which it was increased to 70 kN for an additional 33,997
repetitions. The test was stopped at 65,315 total load repetitions. The crack pattern, as it
developed with time, can be seen in Figure 4.41. A photo composite of the test section with
cracks after HVS trafficking is presented in Photograph 4.41.
It should be noted that Weigh-In-Motion piezometer instrumentation (WIM) was installed
in slab 43.

135
Table 4.52 MDD Deflections, Joint 39, Test Section 530FDMDD In-depth Deflections (m × 10-6), Joint 39Depth from Surface
Repetitions
50 mm 250 mm 425 mm
TemperatureDifference (Top�Bottom), °C
40-kN trafficking load0 1,144 124 49 -1.12,500 1,161 121 49 -0.45,000 1,107 105 39 0.514,000 1,119 99 39 -0.263,157 1,236 105 40 1.064,227 1,074 273 129 3.260-kN trafficking load64,227 1,257 327 161 3.265,200 1,696 253 106 -0.580,388 1,881 188 92 0.096,424 1,925 172 85 -0.2111,785 1,828 210 107 2.4161,766 1,870 207 107 1.5175,319 2,037 161 80 -1.1190,735 1,932 188 96 1.0205,563 1,970 183 95 0.5221,230 1,865 203 110 1.0267,638 1,932 175 92 0.7278,219 2,033 164 85 -1.1291,684 1,992 165 87 -0.3306,785 2,002 174 96 1.1319,876 1,959 169 93 0.4367,253 2,080 163 89 0.5382,434 2,115 140 76 0.1452,530 1,447 278 137 -0.9468,681 1,530 220 113 3.1511,402 1,833 104 47 -0.7525,005 2,045 135 68 0.1572,446 2,019 114 62 0.0587,535 2,036 124 67 -0.2603,176 2,131 108 60 -0.5618,657 2,166 90 50 -0.5634,312 2,208 85 51 -0.5681,550 2,175 90 56 -0.4697,375 2,181 85 55 -0.3711,783 2,170 85 55 0.0726,802 2,061 92 58 0.2741,387 2,063 96 60 -0.1789,047 1,980 67 46 -0.5801,705 2,128 72 50 -0.3816,675 2,132 85 58 0.190-kN trafficking load816,675 2,240 154 104 NA817,675 1,852 198 132 0.1830,464 2,330 183 116 -1.2846,845 2,319 201 124 -0.1
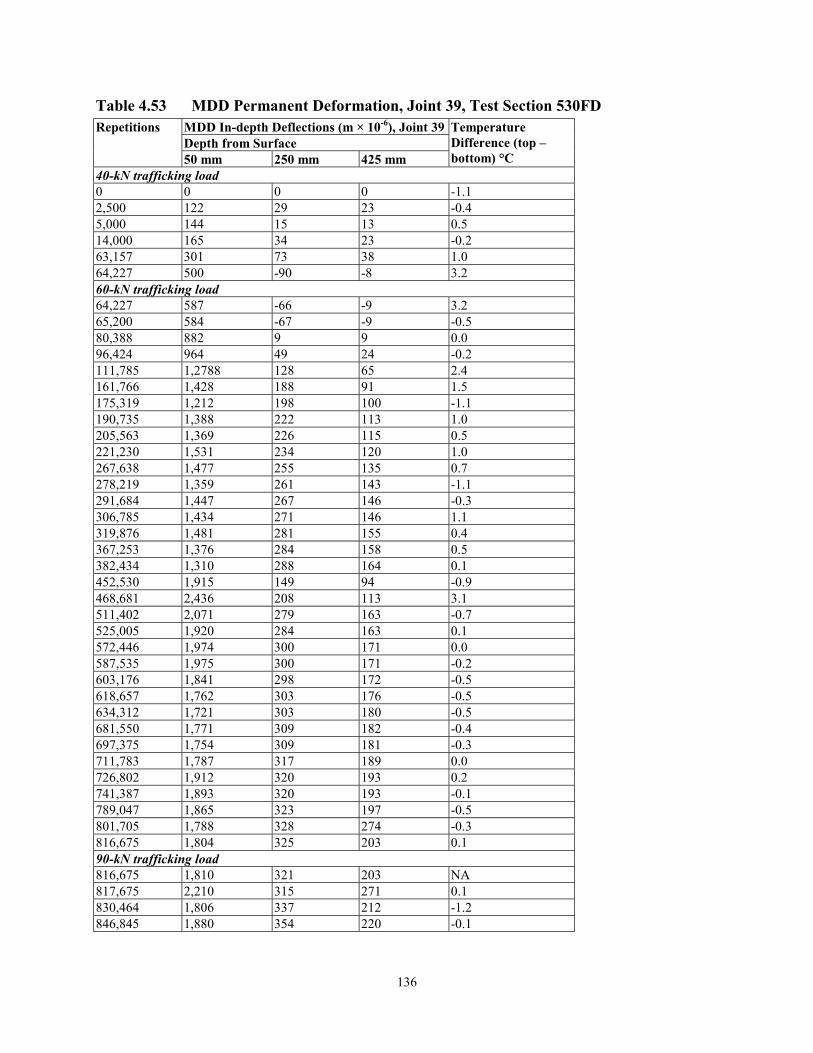
136
Table 4.53 MDD Permanent Deformation, Joint 39, Test Section 530FDMDD In-depth Deflections (m × 10-6), Joint 39Depth from Surface
Repetitions
50 mm 250 mm 425 mm
TemperatureDifference (top �bottom) °C
40-kN trafficking load0 0 0 0 -1.12,500 122 29 23 -0.45,000 144 15 13 0.514,000 165 34 23 -0.263,157 301 73 38 1.064,227 500 -90 -8 3.260-kN trafficking load64,227 587 -66 -9 3.265,200 584 -67 -9 -0.580,388 882 9 9 0.096,424 964 49 24 -0.2111,785 1,2788 128 65 2.4161,766 1,428 188 91 1.5175,319 1,212 198 100 -1.1190,735 1,388 222 113 1.0205,563 1,369 226 115 0.5221,230 1,531 234 120 1.0267,638 1,477 255 135 0.7278,219 1,359 261 143 -1.1291,684 1,447 267 146 -0.3306,785 1,434 271 146 1.1319,876 1,481 281 155 0.4367,253 1,376 284 158 0.5382,434 1,310 288 164 0.1452,530 1,915 149 94 -0.9468,681 2,436 208 113 3.1511,402 2,071 279 163 -0.7525,005 1,920 284 163 0.1572,446 1,974 300 171 0.0587,535 1,975 300 171 -0.2603,176 1,841 298 172 -0.5618,657 1,762 303 176 -0.5634,312 1,721 303 180 -0.5681,550 1,771 309 182 -0.4697,375 1,754 309 181 -0.3711,783 1,787 317 189 0.0726,802 1,912 320 193 0.2741,387 1,893 320 193 -0.1789,047 1,865 323 197 -0.5801,705 1,788 328 274 -0.3816,675 1,804 325 203 0.190-kN trafficking load816,675 1,810 321 203 NA817,675 2,210 315 271 0.1830,464 1,806 337 212 -1.2846,845 1,880 354 220 -0.1

137
0
250
500
750
1,000
1,250
1,500
1,750
2,000
2,250
2,500
0 100,000 200,000 300,000 400,000 500,000 600,000 700,000 800,000 900,000
Repetitions
Elas
tic d
efle
ctio
ns (m
icro
ns)
ConcreteBaseSubgrade
40 kN 60 kN 90 kN
Figure 4.39. In-depth MDD deflections, Test Section 530FD.
-250
0
250
500
750
1,000
1,250
1,500
1,750
2,000
2,250
2,500
0 100,000 200,000 300,000 400,000 500,000 600,000 700,000 800,000 900,000
Repetitions
Perm
anen
t def
orm
atio
n (m
icro
ns)
ConcreteBaseSubgrade
40 kN 60 kN 90 kN
Figure 4.40. Permanent deformation, Test Section 530FD.

138
4.13.1 Visual Observations, Test Section 531FD
Prior to the start of HVS testing, no cracks were visible on the Section 531FD. After
31,318 40-kN load repetitions and 31,495 70-kN load repetitions (a total of 62,813 load
repetitions), a transverse crack developed in the middle slab (slab 42) and a longitudinal crack
developed across the WIM instrumentation in slab 43. This crack pattern suggests that the slab
failed due to fatigue and if time permitted, the crack may have appeared to be a corner break (see
Photograph 4.42).
4.13.2 JDMD and EDMD Data, Test Section 531FD
Two Joint Displacement Monitoring Devices (JDMDs) were placed on either side of joint
41 (between slabs 41 and 42) and one Edge Displacement Monitoring Device (EDMD) was
placed on the edge of slab 42 at its edge midpoint (midway between the two joints). The
maximum deflection at the midpoint edge of the middle slab, and the corner edge deflections on
either side of joint 41, are summarized in Table 4.54 for the 40-kN loading and Table 4.55 for the
70-kN loading. The data are also shown in Figures 4.42 and 4.43 for the 40- and 70-kN load
cases, respectively.
The deflections recorded at both load levels remained relatively constant. The failure that
occurred (crack pattern) developed somewhat prematurely, which may be the result of a lack of
aggregate interlock at joint 42 due to the installation of the WIM instrumentation.
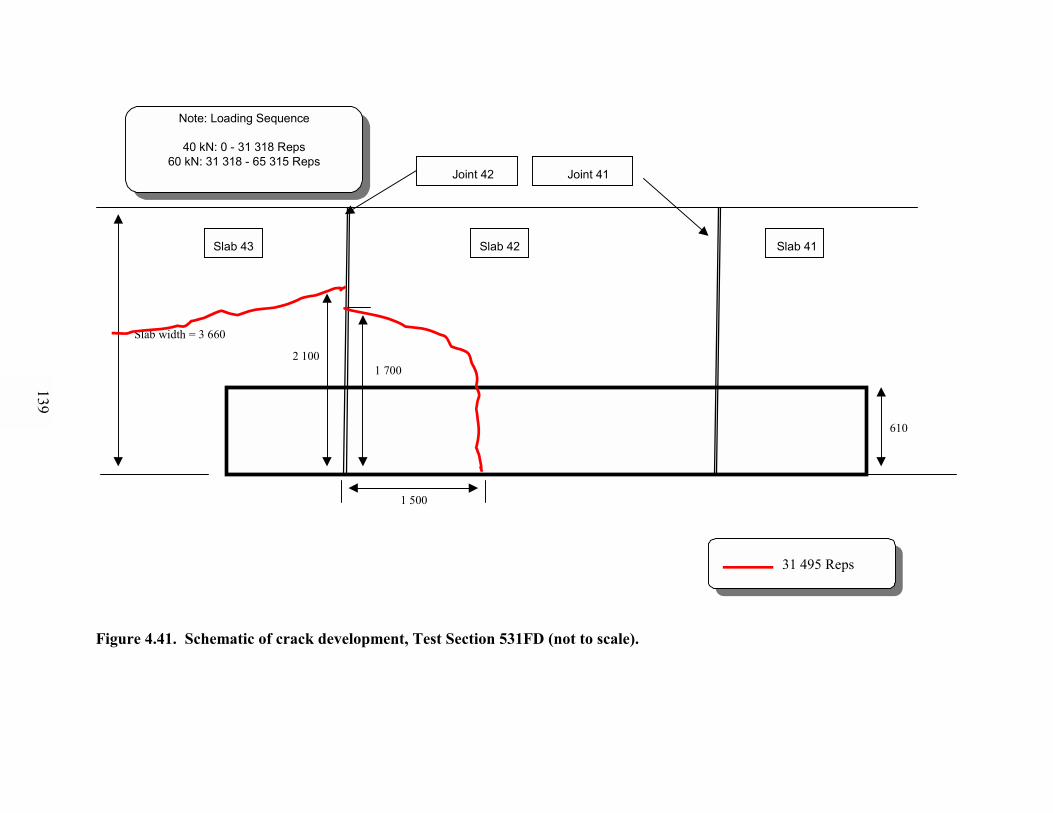
Joint 42 Joint 41
610
Slab width = 3 660
Note: Loading Sequence
40 kN: 0 - 31 318 Reps60 kN: 31 318 - 65 315 Reps
Note: Loading Sequence
40 kN: 0 - 31 318 Reps60 kN: 31 318 - 65 315 Reps
31 495 Reps
31 495 Reps
1 500
1 7002 100
Slab 43 Slab 42 Slab 41
Figure 4.41. Schematic of crack development, Test Section 531FD (not to scale).
139

Photograph 4.41. Composite photograph of final crack pattern, Test Section 531FD.
140

141
Photograph 4.42. Final crack pattern after 65,315 repetitions, Test Section 531FD.
Table 4.54 EDMD and JDMD Deflections, Test Load = 40 kN, Test Section 531FDDeflection (m × 10-6)
Corner, Joint 41Repetitions
Edge Midpoint,slab 42 Slab 42 Side Slab 41 Side
TemperatureDifference(top�bottom), °C
0 851 2,212 1,679 2.02,500 688 1,606 1,424 -0.55,000 754 1,652 1,600 0.915,259 752 1,792 1,651 0.431,318 682 1,618 1,559 -0.7
Table 4.55 EDMD and JDMD Deflections, Test Load = 70 kN, Test Section 531FDDeflection (m × 10-6)
Corner, Joint 41Repetitions
Edge Midpoint,slab 42 Slab 42 Side Slab 41 Side
TemperatureDifference(top�bottom), °C
0 932 2,241 1,784 0.62,500 891 2,063 2,159 2.014,191 957 2,422 2,520 -1.331,495 1,065 2,041 2,560 -1.533,997 1,012 2,254 2,083 -1.4

142
0
500
1,000
1,500
2,000
2,500
3,000
0 5,000 10,000 15,000 20,000 25,000 30,000 35,000 40,000
Repetitions
Def
lect
ion
(mic
rons
)
Edge midpoint, slab 42Corner, slab 41 / joint 41Corner, slab 42 / joint 41
Figure 4.42. Elastic surface deflections, test load = 40 kN, Test Section 531FD.
0
500
1,000
1,500
2,000
2,500
3,000
30,000 35,000 40,000 45,000 50,000 55,000 60,000 65,000 70,000
Repetitions
Def
lect
ion
(mic
rons
)
Edge midpoint, slab 42
Corner,, slab 41 / joint 41
Corner, slab 42 / joint 41
Figure 4.43. Elastic surface deflections, test load = 70 kN, Test Section 531FD.

143
4.13.3 Load Transfer Efficiency, Test Section 531FD
The Load Transfer Efficiency (LTE) was calculated at joint 41 (the joint between slabs 41
and slab 42) for the HVS wheel traveling in both directions. The results are summarized in Table
4.56.
The LTE was relatively constant throughout the entire test. These results suggest that the
crack at the sawed joint propagated relatively straight down to the bottom of the concrete.
Table 4.56 Load Transfer Efficiency at Joint 41, Test Section 531FDLoad Transfer Efficiency, LTE (%), Joint 41RepetitionsFrom Slab 41 to Slab 42 From Slab 42 to Slab 41
Temperature Difference(top�bottom), °C
Test load 40kN0 81.9 37.9 2.02,500 49.7 50.7 -0.55,000 59.0 70.4 0.915,259 68.1 64.8 0.431,318 73.3 72.1 -0.7Test load 70 kN31,318 74.5 55.4 0.633,818 71.4 87.3 2.045,509 71.3 83.8 -1.362,813 51.2 101.6 -1.565,315 56.3 52.6 -1.4

144
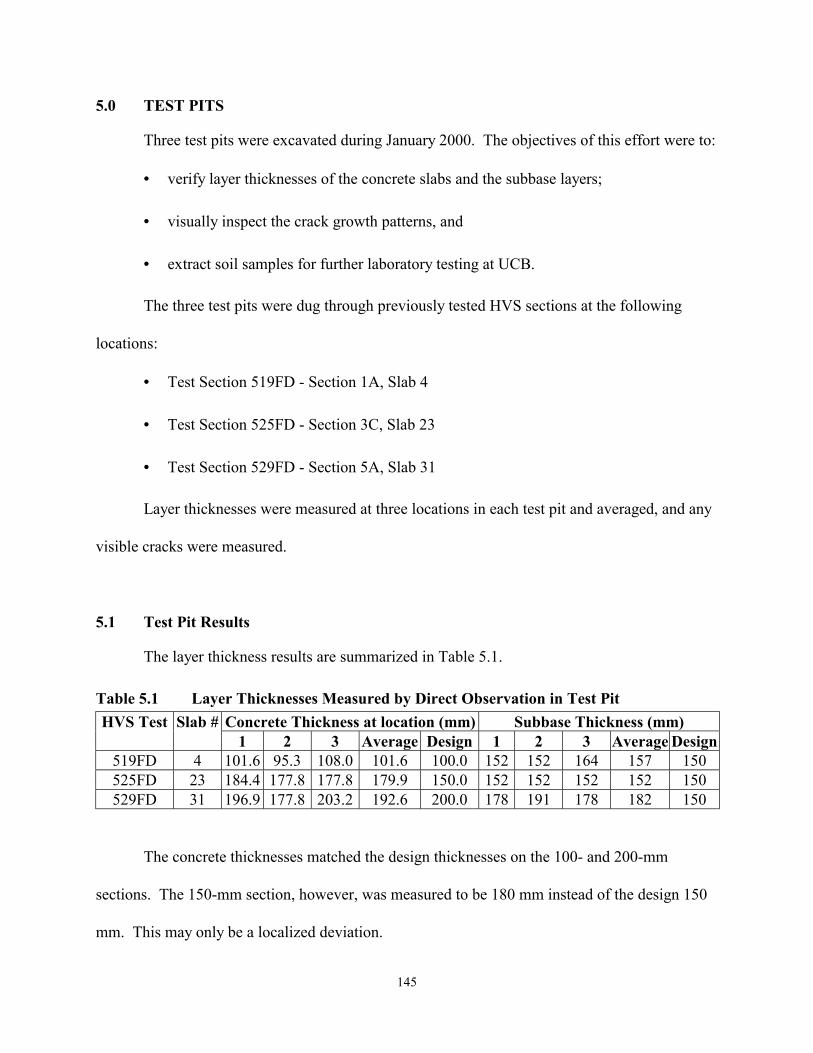
145
5.0 TEST PITS
Three test pits were excavated during January 2000. The objectives of this effort were to:
• verify layer thicknesses of the concrete slabs and the subbase layers;
• visually inspect the crack growth patterns, and
• extract soil samples for further laboratory testing at UCB.
The three test pits were dug through previously tested HVS sections at the following
locations:
• Test Section 519FD - Section 1A, Slab 4
• Test Section 525FD - Section 3C, Slab 23
• Test Section 529FD - Section 5A, Slab 31
Layer thicknesses were measured at three locations in each test pit and averaged, and any
visible cracks were measured.
5.1 Test Pit Results
The layer thickness results are summarized in Table 5.1.
Table 5.1 Layer Thicknesses Measured by Direct Observation in Test PitConcrete Thickness at location (mm) Subbase Thickness (mm)HVS Test Slab #
1 2 3 Average Design 1 2 3 Average Design519FD 4 101.6 95.3 108.0 101.6 100.0 152 152 164 157 150525FD 23 184.4 177.8 177.8 179.9 150.0 152 152 152 152 150529FD 31 196.9 177.8 203.2 192.6 200.0 178 191 178 182 150
The concrete thicknesses matched the design thicknesses on the 100- and 200-mm
sections. The 150-mm section, however, was measured to be 180 mm instead of the design 150
mm. This may only be a localized deviation.

146
The subbase thickness was consistent with the design thickness under the 100- and 150-
mm concrete sections, but under the 200-mm concrete section, an average subbase thickness of
182 mm was measured for a design thickness of 150 mm.
The various layers seemed to be in good condition. The respective concrete slabs did not
show any sign of a honeycomb structure and no air pockets were noted. The aggregate base
layer, as well as the subgrade layer exhibited good compaction.
5.1.1 Crack Patterns
• Section 1A, Slab 4, Test Section 519FD. Two cracks were found in the first test pit
(519FD). The first crack, on one face of the test pit, went completely through the
concrete layer and the second crack (visible on the opposite face of the test pit) went
75 percent through the slab from its origin at the top. Photograph 5.1 shows the
location of the test pit in relation to the HVS test pad. The crack, which was
measured, had formed after 2,105 load applications (see figure 4.1) and can be seen in
Photograph 5.2.
• Section 3C, Slab 23, Test Section 525FD. The crack observed on Test Section
525FD after 1,000 load applications (see Figure 4.20) is shown in Photograph 5.3.
From the photograph it is clear that the crack went all the way through the 150-mm
concrete slab.
• Section 5A, Slab 31, Test Section 529FD. On slab 31 on Section 529FD, a surface
crack was reported after 337,530 load applications (see Figure 4.29) but after the test
pit was dug it became evident that this was only a surface crack. This crack did not
penetrate the concrete to any visible extent (see Photograph 5.4).

147
Photograph 5.1. Location of test pit prior to excavation on Test Section 519FD.
Photograph 5.2. Crack on Test Section 519FD.

148
Photograph 5.3. Crack on Test Section 525FD.
Photograph 5.4. Surface crack that did not propagate to bottom of concrete, Test Section529FD.

149
6.0 FWD RESULTS
In this section, the Falling Weight Deflectometer (FWD) data recorded before and after
HVS testing is presented. In view of the large data set, only processed data parameters are
presented in this section. Raw deflection data is presented in Appendix A.
FWD measurements were taken at 1, 7, 50, 90, 200, and 270 days after construction of
the concrete pavement. The sequence of these six test groups relative to the HVS testing is
shown in Figure 6.1. It should be noted that the FWD testing was performed only on the
concrete sections with a thickness of 200 mm or greater, thus only these HVS test sections are
shown in Figure 6.1.
A spreadsheet macro was developed to transpose raw FWD data into an electronic format
that is convenient for further processing and analysis. Instructions for using this macro are
provided in Appendix A. This appendix also contains an explanation of the available data as well
as of the directory structure for the data files. It should be noted that for second level data
analysis purposes, all of the tables and figures contained in this section are mirrored by
31-Mar 31-May 31-Jul 30-Sep 30-Nov 30-Jan 1-Apr 1-Jun 1-Aug
HVS TEST 528FD
HVS TEST 529FD
HVS TEST 530FD
HVS TEST 531FDNote: Dots denote FWD measurements at different curing times (shown in days)
1 7 50 90 200 270
Figure 6.1. Timeline showing time of FWD testing and start and duration of HVS testingon 200-mm thick slabs.

150
spreadsheet files which are listed in Appendix A.
6.1 Effect of Curing on Backcalculated Stiffness
Concrete slab and subgrade stiffnesses were backcalculated using the ELMOD software.
A two-layer model was assumed with the first layer being the concrete slab, and the second layer
(referred to as the subgrade) consisting of the aggregate base and subgrade. Backcalculated
stiffnesses for the concrete slabs and subgrade at different curing times are listed in Table 6.1.
The change in concrete and subgrade stiffness with increasing curing time is shown in Figure 6.2.
The trends observed from these figures are decreasing subgrade stiffness and a tendency for
decreased stiffness versus curing age for the concrete. These trends are also reflected in the raw
deflection data for the different HVS tests (see Appendix A).
The tendency for the deflections to increase with increased curing age may be attributable
to curling effects, which cause less consistent seating of the concrete slab on the subgrade, rather
than weakening of the concrete slabs. Care should therefore be taken in the interpretation of the
backcalculated stiffnesses. For second level analysis, it is recommended that a more rigorous
backcalculation study be undertaken for the slabs situated within the HVS sections, particularly
with respect to temperature. It can particularly be seen that backcalculated concrete stiffness is
lowest at 90 days during the hottest time of the year, and highest at 200 days in mid-winter.
6.2 Effect of Curing on Load Transfer Efficiency
The Load Transfer Efficiency (LTE) between different slabs at different curing ages is
summarized in Table 6.2. No apparent relationship exists between the LTE and the curing age.
It should be noted that temperature variations are not accounted for in these plots. The LTE
percentages at different curing ages are shown in Figure 6.3.

151
Table 6.1 Concrete and Subgrade Stiffness for Different Curing Ages (Based onDeflections Measured at Slab Center)
Stiffness ofSlab Number Station (ft.)Concrete Subgrade
Curing Period(days)
230.1 27,428 386 1230.1 23,377 324 7230.1 23,460 173 50230.1 13,786 124 90
31Middle slab forTest Section529FD
230.1 24,378 152 200211.1 36,694 276 1211.1 39,323 290 7211.1 40,406 317 50210.1 44,698 297 90
32Edge Slab forTest Section529FD
210.1 48,169 221 200197.1 25,765 262 1196.1 32,720 276 7197.1 23,281 324 50195.1 35,542 200 90
33
195.1 23,771 262 200183.1 22,908 262 1184.1 24,764 283 7183.1 29,718 235 50183.1 29,774 228 90
34Edge Slab forTest Section528FD
183.1 43,870 145 200167.1 34,942 290 1168.1 36,860 269 7167.1 43,235 290 50166.1 51,032 276 90
35Middle Slab forTest Section528FD
167.1 85,636 179 200147.1 28,614 331 1150.1 26,462 290 7147.1 31,160 255 50147.1 39,765 262 90
36Edge slab ofTest Section528FD
147.1 37,060 269 200133.1 37,384 352 1133.1 53,641 228 7133.1 32,023 159 50133.1 32,264 186 90
37
133.1 84,077 186 200

152
Slab Number Station (ft.) Stiffness of Curing Period(days)
120.1 41,034 449 1120.1 56,235 290 7120.1 33,596 338 50120.1 36,453 338 90
38Edge Slab forTest Section530FD
120.1 64,494 276 200105.1 38,233 435 1106.1 46,092 442 7105.1 66,123 421 50105.1 84,484 297 90
39Middle slab forTest Section530FD
105.1 62,652 248 20085.1 40,234 421 188.1 52,392 297 784.1 26,489 269 5084.1 32,044 283 90
40Edge Slab forTest Section530FD
83.1 66,585 242 20072.1 25,026 352 173.1 47,651 311 772.1 59,726 242 5072.1 42,366 248 90
41Edge Slab forTest Section531FD
72.1 63,066 242 20060.1 33,341 338 160.1 42,835 304 760.1 42,918 255 5060.1 50,805 242 90
42Middle Slab forTest Section531FD
60.1 51,819 193 20044.1 31,436 317 143.1 33,396 297 744.1 20,528 69 5044.1 17,678 104 90
43Edge Slab forTest Section531FD
44.1 16,325 90 20027.1 24,350 352 126.1 22,349 345 726.1 30,395 262 5027.1 29,808 221 90
44
27.1 23,067 193 2008.1 49,390 380 19.1 61,182 345 78.1 57,229 317 508.1 62,107 380 90
45
8.1 52,406 248 200

153
SLAB 31
0
10,000
20,000
30,000
40,000
50,000
60,000
70,000
80,000
90,000
100,000
0 50 100 150 200 250
Curing Age (Days)
Con
cret
e St
iffne
ss M
Pa
0
50
100
150
200
250
300
350
400
450
Subg
rade
St
iffne
ss M
Pa
Concrete Subgrade
SLAB 32
0
10,000
20,000
30,000
40,000
50,000
60,000
70,000
80,000
90,000
100,000
0 50 100 150 200 250
Curing Age (Days)
Con
cret
e St
iffne
ss M
Pa
0
50
100
150
200
250
300
350
Subg
rade
St
iffne
ss M
Pa
Concrete Subgrade
SLAB 33
0
10,000
20,000
30,000
40,000
50,000
60,000
70,000
80,000
90,000
100,000
0 50 100 150 200 250
Curing Age (Days)
Con
cret
e St
iffne
ss M
Pa
0
50
100
150
200
250
300
350
Subg
rade
St
iffne
ss M
Pa
Concrete Subgrade
SLAB 34
0
10,000
20,000
30,000
40,000
50,000
60,000
70,000
80,000
90,000
100,000
0 50 100 150 200 250
Curing Age (Days)
Con
cret
e St
iffne
ss M
Pa
0
50
100
150
200
250
300
Subg
rade
St
iffne
ss M
Pa
Concrete Subgrade
SLAB 35
0
10,000
20,000
30,000
40,000
50,000
60,000
70,000
80,000
90,000
100,000
0 50 100 150 200 250
Curing Age (Days)
Con
cret
e St
iffne
ss M
Pa
0
50
100
150
200
250
300
350
Subg
rade
St
iffne
ss M
Pa
Concrete Subgrade
SLAB 36
0
10,000
20,000
30,000
40,000
50,000
60,000
70,000
80,000
90,000
100,000
0 50 100 150 200 250
Curing Age (Days)
Con
cret
e St
iffne
ss M
Pa
0
50
100
150
200
250
300
350
Subg
rade
St
iffne
ss M
Pa
Concrete Subgrade
SLAB 37
0
10,000
20,000
30,000
40,000
50,000
60,000
70,000
80,000
90,000
100,000
0 50 100 150 200 250
Curing Age (Days)
Con
cret
e St
iffne
ss M
Pa
0
50
100
150
200
250
300
350
400
Subg
rade
St
iffne
ss M
Pa
Concrete Subgrade
SLAB 38
0
10,000
20,000
30,000
40,000
50,000
60,000
70,000
80,000
90,000
100,000
0 50 100 150 200 250
Curing Age (Days)
Con
cret
e St
iffne
ss M
Pa
0
50
100
150
200
250
300
350
400
450
500
Subg
rade
St
iffne
ss M
Pa
Concrete Subgrade
Figure 6.2. Curing age versus stiffness of the concrete and subgrade for different slabs(based on deflections measured at slab center).
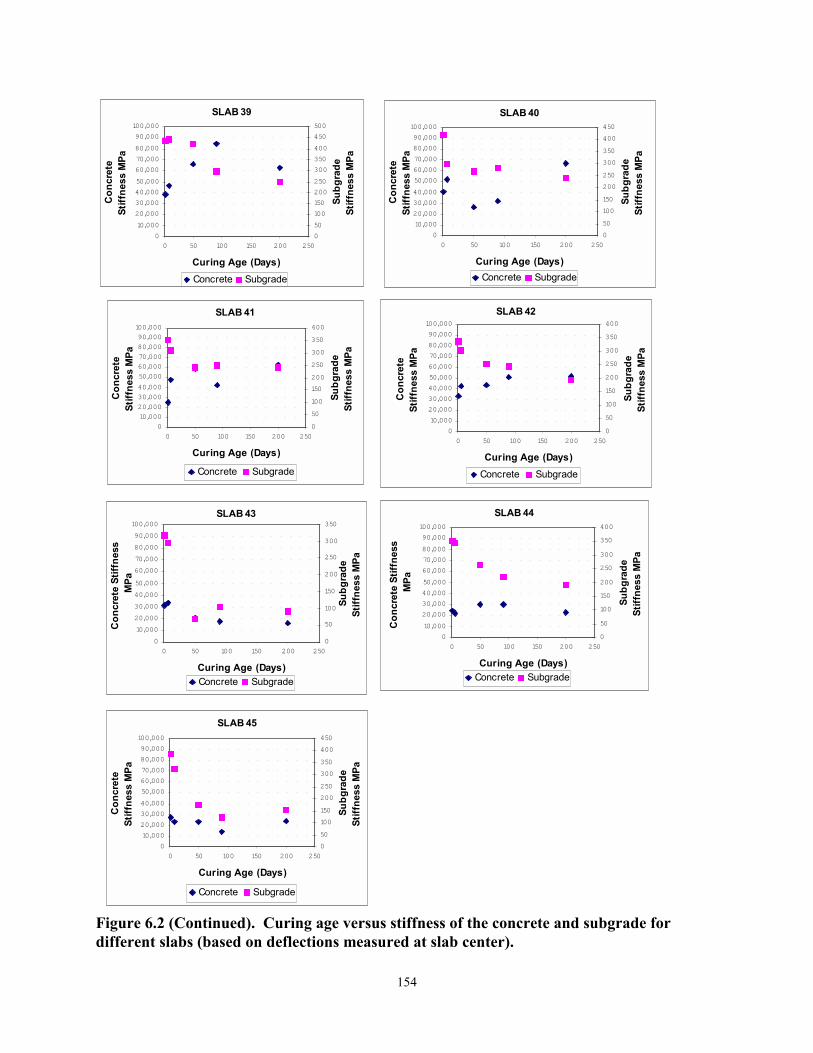
154
SLAB 39
0
10,000
20,000
30,000
40,000
50,000
60,000
70,000
80,000
90,000
100,000
0 50 100 150 200 250
Curing Age (Days)
Con
cret
e St
iffne
ss M
Pa
0
50
100
150
200
250
300
350
400
450
500
Subg
rade
St
iffne
ss M
Pa
Concrete Subgrade
SLAB 40
0
10,000
20,000
30,000
40,000
50,000
60,000
70,000
80,000
90,000
100,000
0 50 100 150 200 250
Curing Age (Days)
Con
cret
e St
iffne
ss M
Pa
0
50
100
150
200
250
300
350
400
450
Subg
rade
St
iffne
ss M
Pa
Concrete Subgrade
SLAB 41
0
10,000
20,000
30,000
40,000
50,000
60,000
70,000
80,000
90,000
100,000
0 50 100 150 200 250
Curing Age (Days)
Con
cret
e St
iffne
ss M
Pa
0
50
100
150
200
250
300
350
400Su
bgra
de
Stiff
ness
MPa
Concrete Subgrade
SLAB 42
0
10,000
20,000
30,000
40,000
50,000
60,000
70,000
80,000
90,000
100,000
0 50 100 150 200 250
Curing Age (Days)
Con
cret
e St
iffne
ss M
Pa0
50
100
150
200
250
300
350
400
Subg
rade
St
iffne
ss M
Pa
Concrete Subgrade
SLAB 43
0
10,000
20,000
30,000
40,000
50,000
60,000
70,000
80,000
90,000
100,000
0 50 100 150 200 250
Curing Age (Days)
Con
cret
e St
iffne
ss
MPa
0
50
100
150
200
250
300
350
Subg
rade
St
iffne
ss M
Pa
Concrete Subgrade
SLAB 44
0
10,000
20,000
30,000
40,000
50,000
60,000
70,000
80,000
90,000
100,000
0 50 100 150 200 250
Curing Age (Days)
Con
cret
e St
iffne
ss
MPa
0
50
100
150
200
250
300
350
400
Subg
rade
St
iffne
ss M
Pa
Concrete Subgrade
SLAB 45
0
10,000
20,000
30,000
40,000
50,000
60,000
70,000
80,000
90,000
100,000
0 50 100 150 200 250
Curing Age (Days)
Con
cret
e St
iffne
ss M
Pa
0
50
100
150
200
250
300
350
400
450
Subg
rade
St
iffne
ss M
Pa
Concrete Subgrade
Figure 6.2 (Continued). Curing age versus stiffness of the concrete and subgrade fordifferent slabs (based on deflections measured at slab center).

155
6.3 HVS Sections on 200-mm Thick Slabs: Effect of Curing on Centerline Deflections
The influence of curing time on the deflections taken within the HVS test sections is
illustrated in Figures 6.4 through 6.6. The deflections shown in these figures have been
normalized to 66.7 kN, and are centerline deflections taken at the transverse joints and at the
center of the middle slab of each HVS test section. In all cases, the deflections at the transverse
joints are significantly higher than those situated at the center of the given slab. A general
increase in deflections with curing time is noted in all cases. This observation corresponds with
the trend noted for some of the slabs in Figure 6.2.
6.4 Load Transfer Efficiency Recorded After HVS Testing
After all HVS tests were completed, FWD measurements were recorded across all joints
as well as over visible cracks on the slabs. These measurements are summarized in Tables 6.3a
through 6.3d. Measurements were taken approximately twelve hours apart during the coolest
part of the night and hottest part of the day, at each of the following positions (See Figure 6.7):
• At the center of the transverse joint;
• At the corner of the slab on the shoulder side of the pavement;
• At the corner of the slab on the k-rail side of the pavement; and
At the longitudinal joint, on the k-rail side of the pavement.
6.5 Deflection Data Recorded after HVS testing
The deflection data measured during day and nighttime at the center of each slab are
summarized in Table 6.4. Air and surface temperatures are also reported.

156
Table 6.2 Joint Load Transfer Efficiency at Various Curing Ages
Slab Number Joint Number Station (feet) K-Joint LTE (%) Curing (days)
237.20 1237.20 7237.20 50
32: Edge Slabof Test Section529FD
30
237.20
No Data No Data
90221.20 627 70 1221.20 190 26 7221.20 78 47 50
32: Edge Slabof Test Section529FD
31
221.20 105 27 90203.20 694 96 1203.20 351 75 7203.20 121 77 5033 32
203.20 172 65 90191.20 698 81 1191.20 350 63 7191.20 79 84 50
34: Edge Slabof Test Section528FD
33
191.20 179 74 90178.20 587 92 1178.20 313 66 7178.20 51 77 50
35: Middle Slabof Test Section528FD
34
178.20 71 69 90159.20 774 77 1159.20 500 38 7159.20 65 52 50
36: Edge Slabof Test Section528FD
35
159.20 121 42 90141.20 803 88 1141.20 417 58 7141.20 83 51 5037 36
141.20 130 44 90129.20 689 67 1129.20 383 40 7129.20 86 66 50
38: Edge Slabof Test Section530FD
37
129.20 142 67 90116.20 832 93 1116.20 578 44 7116.20 81 70 50
39: Middle Slabof Test Section530FD
38
116.20 161 45 9097.20 827 52 197.20 496 16 797.20 229 69 50
40: Edge Slabof Test Section530FD
39
97.20 343 38 90
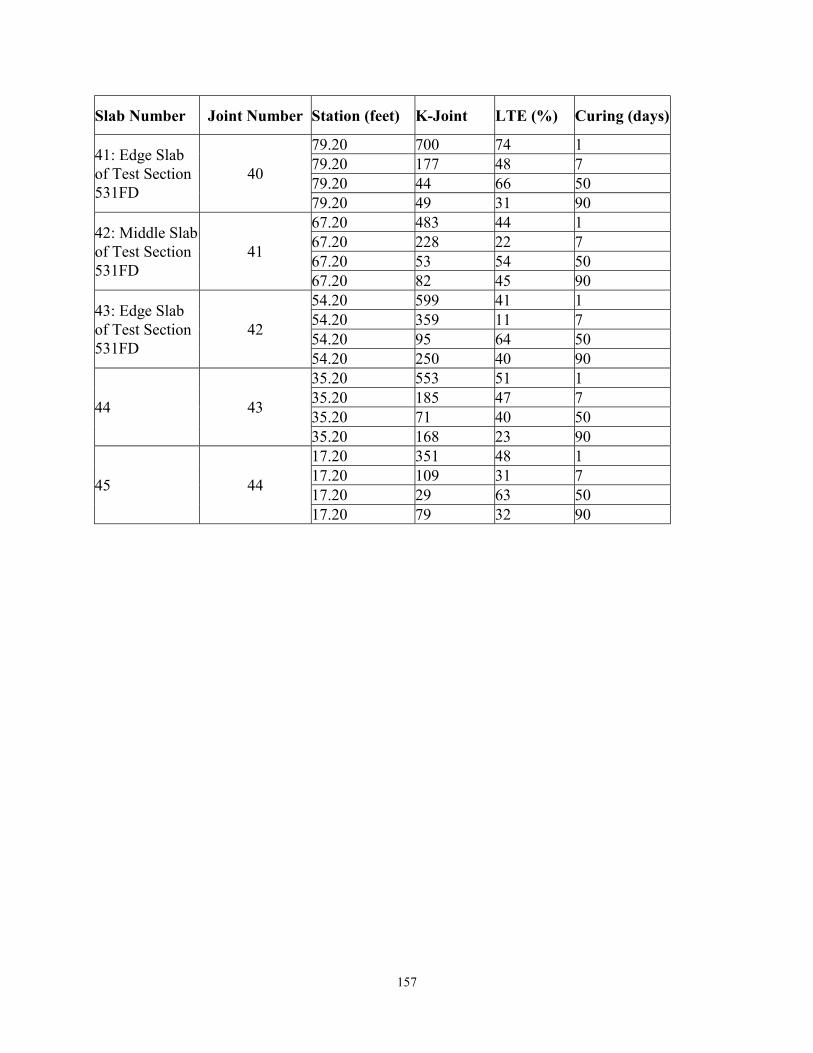
157
Slab Number Joint Number Station (feet) K-Joint LTE (%) Curing (days)
79.20 700 74 179.20 177 48 779.20 44 66 50
41: Edge Slabof Test Section531FD
40
79.20 49 31 9067.20 483 44 167.20 228 22 767.20 53 54 50
42: Middle Slabof Test Section531FD
41
67.20 82 45 9054.20 599 41 154.20 359 11 754.20 95 64 50
43: Edge Slabof Test Section531FD
42
54.20 250 40 9035.20 553 51 135.20 185 47 735.20 71 40 5044 43
35.20 168 23 9017.20 351 48 117.20 109 31 717.20 29 63 5045 44
17.20 79 32 90

158
SLAB 32
0102030405060708090
100
0 20 40 60 80 100
Curing Age (Days)
Load
Tra
nsfe
r Effi
cien
cy (%
)SLAB 33
01020304050
60708090
100
0 20 40 60 80 100
Curing Age (Days)
Load
Tra
nsfe
r Effi
cien
cy (%
)
SLAB 34
0
10
20
30
40
50
60
70
80
90
100
0 20 40 60 80 100
Curing Age (Days)
Load
Tra
nsfe
r Effi
cien
cy (%
)
SLAB 35
0
10
20
30
40
50
60
70
80
90
100
0 20 40 60 80 100
Curing Age (Days)
Load
Tra
nsfe
r Effi
cien
cy (%
)
SLAB 36
0
10
20
30
40
50
60
70
80
90
100
0 20 40 60 80 100
Curing Age (Days)
Load
Tra
nsfe
r Effi
cien
cy (%
)
SLAB 37
0
10
20
30
40
50
60
70
80
90
100
0 20 40 60 80 100
Curing Age (Days)
Load
Tra
nsfe
r Effi
cien
cy (%
)
Figure 6.3. Load transfer efficiency versus curing age

159
SLAB 38
0102030405060708090
100
0 20 40 60 80 100
Curing Age (Days)
Load
Tra
nsfe
r Effi
cien
cy (%
)SLAB 39
0
10
20
30
40
50
60
70
80
90
100
0 20 40 60 80 100
Curing Age (Days)
Load
Tra
nsfe
r Effi
cien
cy (%
)
SLAB 40
0102030405060708090
100
0 20 40 60 80 100
Curing Age (Days)
Load
Tra
nsfe
r Effi
cien
cy (%
)
SLAB 41
0
10
20
30
40
50
60
70
80
90
100
0 20 40 60 80 100
Curing Age (Days)
Load
Tra
nsfe
r Effi
cien
cy (%
)
SLAB 42
010
2030
4050
6070
80
90100
0 20 40 60 80 100
Curing Age (Days)
Load
Tra
nsfe
r Effi
cien
cy (%
)
SLAB 43
0
10
20
30
40
50
60
70
80
90
100
0 20 40 60 80 100
Curing Age (Days)
Load
Tra
nsfe
r Effi
cien
cy (%
)
Figure 6.3. Load transfer efficiency versus curing age (continued).
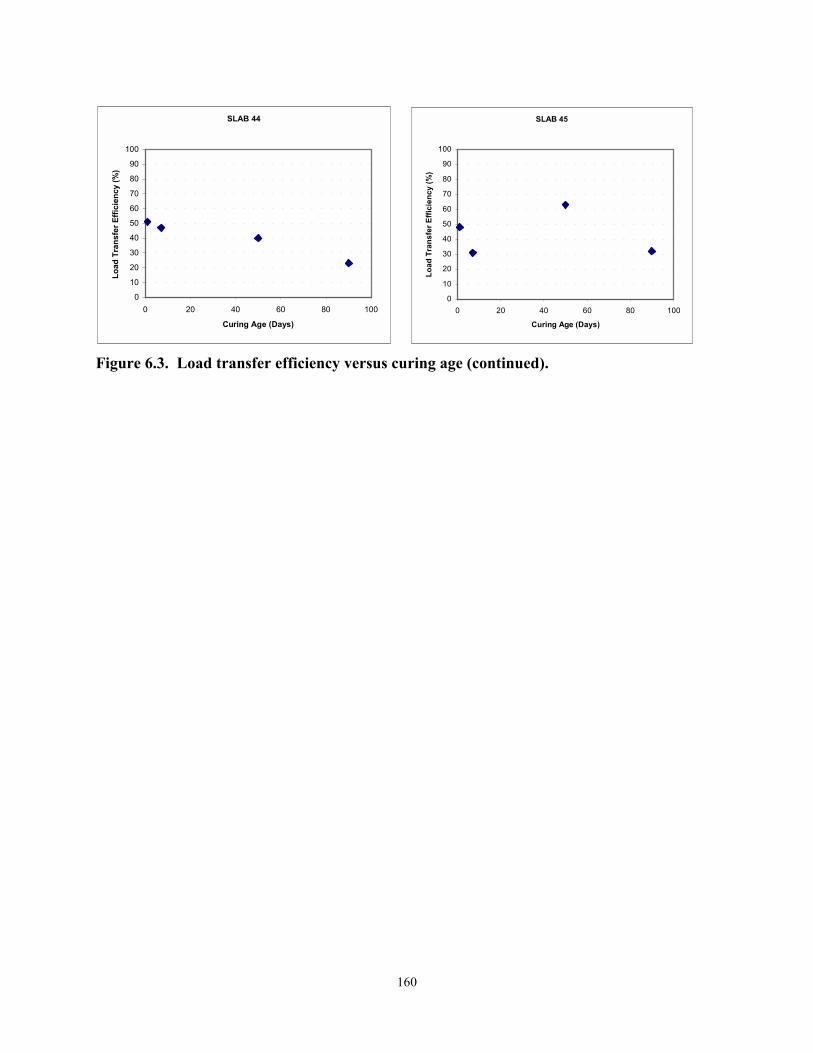
160
SLAB 44
0
10
20
30
40
50
60
70
80
90
100
0 20 40 60 80 100
Curing Age (Days)
Load
Tra
nsfe
r Effi
cien
cy (%
)SLAB 45
0
10
20
30
40
50
60
70
80
90
100
0 20 40 60 80 100
Curing Age (Days)
Load
Tra
nsfe
r Effi
cien
cy (%
)
Figure 6.3. Load transfer efficiency versus curing age (continued).

161
HVS Test Section 528FD Centreline Deflections Normalized to 66.7 kN
Shoulder
Slab 36 Slab 35 Slab 34
HVS Test AreaK-Rail
Position Station (ft) Slab 1 7 54 90 200A 178.2 35 157 250 577 465 857B 183.1 35 158 146 156 156 190C 191.2 34 174 270 517 355 596
Deflection (micron) for a Curing Time of (days)
0100200300400500600700800900
1000
0 50 100 150 200 250Curing Time (days)
Max
imum
Def
lect
ion
at 6
6.7
kN
(mic
ron)
A B C
A (178.2) B (183.1) C (191.2)
Figure 6.4. HWD deflections versus curing time, Test Section 528FD.

162
HVS Test Section 530FD Centreline Deflections Normalized to 66.7 kN
Shoulder
Slab 40 Slab 39 Slab 38
HVS Test AreaK-Rail
Position Station (ft) Slab 1 7 54 90 200A 116.2 39 130 184 396 295 393B 120.1 39 90 109 118 115 168C 128.2 39 155 224 534 388 555
Deflection (micron) for a Curing Time of (days)
0100200300400500600700800900
1000
0 50 100 150 200 250Curing Time (days)
Max
imum
Def
lect
ion
at 6
6.7
kN
(mic
ron)
A B C
A (116.2) B (120.1) C (128.2)
Figure 6.5. HWD deflections versus curing time, Test Section 530FD.

163
HVS Test Section 531FD Centreline Deflections Normalized to 66.7 kN
Shoulder
Slab 43 Slab 42 Slab 41
HVS Test AreaK-Rail
Position Station (ft) Slab 1 7 54 90 200A 67.2 42 242 375 694 506 570B 72.1 42 127 110 120 131 147C 79.2 41 176 348 571 561 779
Deflection (micron) for a Curing Time of (days)
0100200300400500600700800900
1000
0 50 100 150 200 250
Curing Time (days)
Max
imum
Def
lect
ion
at 6
6.7
kN
(mic
ron)
A B C
A (67.1) B (72.1) C (79.2)
Figure 6.6. HWD deflections versus curing time, Test Section 531FD.
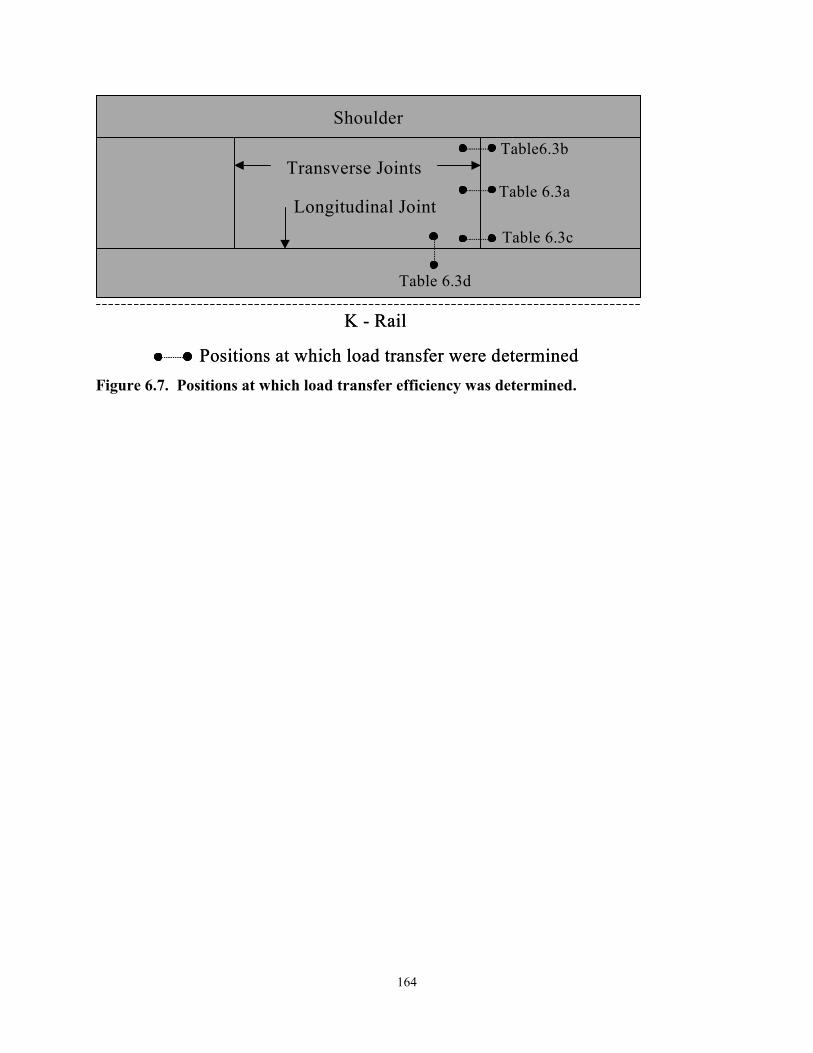
164
Shoulder
K - Rail
Longitudinal Joint
Transverse Joints
Positions at which load transfer were determined
Table 6.3a
Table6.3b
Table 6.3c
Table 6.3d
Shoulder
K - Rail
Longitudinal Joint
Transverse Joints
Positions at which load transfer were determined
Table 6.3a
Table6.3b
Table 6.3c
Table 6.3d
Figure 6.7. Positions at which load transfer efficiency was determined.

Table 6.3a Transverse Joint Load Transfer Efficiency, Center of Transverse Joint (Refer to Figure 6.4)Night Measurement Day Measurement
Load (kN) Load (kN)Location44.5 66.7 89.0 Temperature (°C) 44.5 66.7 89.0 Temperature (°C)
Slab Section Joint
Station(ft) Load Transfer Efficiency (%) Surface Air
Station(ft) Load Transfer Efficiency (%) Surface Air
45 45 17 24 22 23 0 2 17 9 22 33 8 744 44 35 25 24 31 35 19 31 41 9 744
N/ACrack 44 46 60 68 -2 2 26 98 98 98 9 6
41 41 80 10 13 20 0 3 79 17 21 26 8 841 531 Crack 90 94 94 94 1 3 90 94 94 94 8 640 40 98 16 29 41 1 3 97 20 27 40 9 638 530 38 130 10 15 24 1 3 130 19 20 22 8 737 37 142 9 10 13 1 3 142 16 18 21 8 637 N/A Crack 150 97 97 96 1 2 150 96 96 96 8 736 36 160 58 63 67 1 3 160 60 64 68 8 736 Crack 170 93 92 92 1 3 169 93 92 93 8 735 35 179 49 50 53 1 3 179 56 58 61 8 634
528
34 193 28 46 58 2 3 192 51 61 68 8 633 N/A 33 204 17 18 20 2 3 204 25 26 29 9 732 32 223 16 18 22 1 3 222 19 24 30 9 632 529 Crack 231 77 80 83 2 2
165

Table 6.3b Corner Load Transfer Efficiency, Shoulder Side Corner (See Figure 6.4)Night Measurement Day Measurement
Load (kN) Load (kN)Location44.5 66.7 89.0 Temperature (°C) 44.5 66.7 89.0 Temperature (°C)
Slab Section Joint
Station(ft) Load Transfer Efficiency (%) Surface Air
Station(ft) Load Transfer Efficiency (%) Surface Air
45 N/A 45 18 24 38 46 -1 2 17 22 37 49 8 644 35 19 27 35 0 2 35 7 20 31 8 644 N/A Crack 44 84 86 87 0 3
43 531 43 55 56 64 68 0 3 54 50 57 63 8 641 80 40 48 56 0 3 79 35 39 45 8 641 531 Crack 89 96 96 96 1 3 88 94 95 95 8 740 98 38 47 55 2 3 97 24 36 47 8 740 530 Crack 107 77 78 79 1 338 130 29 33 37 2 2 129 33 39 42 7 738 530 Crack 134 62 67 71 134 52 59 64 8 537 142 17 26 35 2 3 141 13 24 36 8 637 N/A Crack 151 99 99 99 1 2 151 97 97 97 8 636 160 96 95 95 2 2 160 95 95 95 7 636 N/A Crack 169 95 95 94 1 2 169 90 91 92 7 5
35 N/A 35 179 30 32 34 179 36 38 39 8 634 N/A 34 192 22 33 41 1 2 192 23 27 33 7 733 N/A 33 204 11 15 26 1 2 204 10 12 22 6 7
32 222 16 24 34 1 2 222 18 28 38 6 632 529
Crack 229 97 97 96 331 242 7 15 19
Crack 255 49 53 56Crack 261 93 94 94
31 529
Crack 267 24 39 49 1 3
166

Table 6.3c Corner Load Transfer Efficiency, K-rail Side Corner (See Figure 6.4)Night Measurement Day Measurement
Load (kN) Load (kN)Location44.5 66.7 89.0 Temperature (°C) 44.5 66.7 89.0 Temperature (°C)
Slab Section Joint
Station(ft) Load Transfer Efficiency (%) Surface Air
Station(ft) Load Transfer Efficiency (%) Surface Air
45 17 8 10 10 0 3 18 9 11 13 9 845 N/A Crack 26 12 11 11 0 3 27 13 15 15 9 744 36 13 14 15 0 3 36 13 14 16 9 844 N/A Crack 45 7 9 10 0 3
43* 531 43 55 6 7 8 0 4 55 7 9 10 9 841 80 18 19 20 0 4 79 22 23 25 9 841 531 Crack 91 5 6 6 1 3 91 14 16 17 10 8
40 530 40 98 4 5 5 1 4 98 12 14 15 10 838 530 38 130 5 6 6 1 4 129 9 10 11 10 8
37 142 4 4 4 1 4 142 8 9 6 10 837 N/A Crack 149 5 5 6 2 3 149 22 23 25 10 736 160 6 7 8 2 3 160 10 11 12 10 836 528 Crack 170 10 10 10 2 4 170 28 27 25 9 8
35 528 35 180.3 11 11 12 2 4 179 13 15 16 9 834 528 34 192 12 13 13 2 3 192 16 18 19 9 933 N/A 33 204 12 13 13 2 3 204 12 13 15 8 8
32 223 9 10 11 3 3 223 18 18 19 9 832 529 Crack 231 9 9 9 2 3
167

Table 6.3d Longitudinal Joint Load Transfer Efficiency, K-rail Side Longitudinal Joint (See Figure 6.4)Night Measurement Day Measurement
Load (kN) Load (kN)Location44.5 66.7 89.0 Temperature (°C) 44.5 66.7 89.0 Temperature (°C)
Slab Section Joint
Station(ft) Load Transfer Efficiency (%) Surface Air
Station(ft) Load Transfer Efficiency (%) Surface Air
46 N/A 46 10 17 19 20 0 3 10 17.9 20.4 22.8 8 845 21 12 12 13 0 2 20 19.0 21.6 23.2 8 845 N/A Crack 30 7 8 10 0 3 30 13.3 16.5 18.1 9 844 38 13 15 13 0 3 37 10.3 12.4 13.3 8 844 N/A Crack 48 8 11 13 0 4 48
42 531 42 74 7 9 10 -1 4 73 18 21 19 8 941 531 41 84 10 12 13 0 4 84 25 25 25 10 740 530 40 101 3 5 5 1 3 100 13 15 16 10 739 530 39 123 10 11 11 0 4 123 15 17 18 10 838 530 38 136 9 10 10 1 4 135 17 19 19 10 8
37 144 5 6 7 1 4 143 19 19 18 10 837 N/A Crack 154 7 7 8 2 3 154 17 19 19 10 736 165 13 12 11 2 4 164 36 35 33 9 836 528 Crack 173 10 11 11 1 3 173 16 17 18 9 7
35 528 35 185 12 13 14 2 3 185 15 17 17 9 834 528 34 200 13 14 14 2 3 197 16 18 19 8 933 N/A 33 212 12 14 14 3 3 213 21 22 22 9 8
32 225 34 32 29 2 3 22532 529Crack 235 3 4 8 2 4 235 8 10 11 9 8
168

169
Table 6.4 Maximum Deflection at Center of Slabs, Day and NightDeflection (m × 10-6) @
Given LoadSlab Number Station(ft.) Time
SurfaceTemperature
(°C)
AirTemperature
(°C) 44.5 kN 66.7 kN 89 kN10 Day 8 6 277 369 47046 11 Night -1 2 336 482 63126 Day 8 6 311 429 55245 27 Night 0 2 381 523 68337 Day 8 6 586 773 96238 Night 0 3 569 751 94848 Day 8 6 362 498 64144
49 Night 0 3 343 468 60672 Day 8 6 297 425 57142 (Section 531FD Center Slab) 74 Night 0 3 346 473 62682 Day 8 7 557 770 98983 Night 1 3 615 809 1,01991 Day 8 7 469 629 79341 (Section 531FD Edge Slab)
92 Night 2 3 441 604 777Day 7 6 252 348 45040 (Section 530FD) 101 Night 1 3 307 418 535
119 Day 7 7 308 411 52039 (Section 530FD Center Slab) 123 Night 2 2 334 447 57138 (Section 530FD Edge Slab) 136 Day 8 5 528 713 911
144 Day 8 6 797 1,056 1,288145 Night 2 3 820 1,079 1,347
Day 8 6 517 709 90837154 Night 1 2 581 789 1,024162 Day 7 6 666 902 1,139164 Night 2 2 614 835 1.080
Day 7 5 370 516 67536 (Section 528FD Edge Slab)172 Night 1 2 395 548 724185 Day 8 6 233 332 45235 (Section 528FD Center Slab) 186 Night 1 2 213 303 413197 Day 7 7 229 321 43134 (Section 528FD Edge Slab) 198 Night 1 2 221 312 417
Day 6 7 289 419 56733 212 Night 1 2 253 365 495223 Day 6 6 573 808 1,066233 Day 7 7 399 529 66632 (Section 529FD Edge Slab)234 Night 1 3 407 557 716
31 (Section 529FD Center Slab) 272 Night 1 3 524 709 922

170

171
7.0 CONCRETE CORE MEASUREMENTS
Two sets of cores are described in this section. The first set was taken from the South
tangent approximately 40 days after construction. The second set was taken after all HVS testing
had been completed on the South Tangent early in 2001.
7.1 40-Day Core Properties
All the measured core properties with some useful statistics are shown in Tables 7.1�7.3
for Sections 1, 3, and 5, respectively. The following sections further describe the data.
7.1.1 Slab Thicknesses
The true uncut lengths of the cores were measured to determine the as-built slab
thicknesses. In the case of Section 1 where the specified slab thickness is 100 mm, the average
slab thickness was 107.3 mm with a high of 124.5 mm and a low of 81.3 mm. In the case of
Section 3 (specified thickness 150 mm) the average value was 163 mm with a maximum value of
200 mm and a minimum of 135.5 mm. For Section 5 (specified thickness 200 mm), the average
thickness was 211.4 mm with a maximum of 227.5 mm and a minimum of 196 mm.
In general, it can be said that the slab thicknesses as measured from the four cores that
were extracted from each section tend to be slightly thicker than the design thicknesses. The
variability in core lengths is of concern, especially for an experimental concrete slab. With the
limited samples taken the distribution of the slab thickness also seem to be skewed toward the
thick side.

172
Table 7.1 Palmdale South Tangent Section 1 Cores Properties,44 Days After Construction
Core Number Location UncutLength (cm)
Density(kg/m3)
CompressiveStrength (MPa)
1A-4 Section 1-A 8.1 2,321 37.81B-8 Section 1-B 11.0 2,397 26.41C-12 Section 1-C 12.5 2,375 31.81D-14 Section 1-D 11.4 2,389 23.4
Average 10.7 2,370 31.1Low 8.1 2,321 26.4
High 12.5 2,397 37.7Std. Dev. 1.8 34 5.0
50th Percentile 11.2 2,382 30.190th Percentile 12.1 2,395 36.010th Percentile 9.0 2,337 27.0
Table 7.2 Palmdale South Tangent Section 3 Cores Properties,44 Days After Construction
Core Number Location Uncut Length(cm)
Density(kg/m3)
CompressiveStrength (MPa)
3A-17 Section 3-A 15.1 2,117 12.23B-20 Section 3-B 16.6 2,382 22.03C-25 Section 3-C 13.6 2,348 45.63D-28 Section 3-D 20.0 2,383 34.0
Average 16.3 2,307 28.4Low 13.6 2,117 12.2
High 20.0 2,383 45.6Std. Dev. 2.8 129 14.5
50th Percentile 15.8 2,365 28.090th Percentile 19.0 2,383 42.110th Percentile 14.0 2,186 15.1

173
Table 7.3 Palmdale South Tangent Section 5 Cores Properties,44 Days After Construction
Core Number Location Uncut Length(cm)
Density(kg/m3)
CompressiveStrength (MPa)
5A-32 Section 5-A 19.6 2,337 36.55B-36 Section 5-B 21.7 2,445 27.95C-40 Section 5-C 22.8 2,434 34.75D-44 Section 5-D 20.5 2,312 21.7
Average 21.1 2,445 30.2Low 19.6 2,312 21.7
High 22.8 2,397 36.5Std. Dev. 1.4 67 6.8
50th Percentile 21.1 2,385 31.390th Percentile 22.4 2,442 35.910th Percentile 19.9 2,320 23.5
7.1.2 Core Densities
Some useful statistics of the core densities taken from Sections 1, 3 and 5 (South
Tangent) are also shown in Tables 7.1�7.3. Only the bulk densities calculated using ParafilmTM
procedure are shown in the table. The corresponding volumetric densities as calculated from
measured sample dimensions and weights are (as can be expected) somewhat higher than the
densities obtained using Parafilm with an average conversion factor of 0.9768. The conversion
factor is fairly consistent. The average Parafilm densities of all the samples taken on the South
Tangent is 2,353 kg/m3, with a maximum value of 2,444 kg/m3 and a minimum value of 2,116
kg/m3.
7.1.3 Compressive Strength
The well-known fact that concrete strength development is very dependent on concrete
density is well demonstrated by the compressive strength data obtained from the Palmdale cores.
It can be seen that when Parafilm density values approach 2,300 kg/m3, the compressive strength

174
drops significantly. The average compressive strength of all the samples taken from Sections 1,
3, and 5 is 29.9 MPa. The lowest strength recorded is 12.2 MPa and corresponds to the lowest
Parafilm density measured of 2,116.97 kg/m3. Slab strengths, where the early setting of concrete
occurred during construction vibration, may be affected due to voids. Samples taken during
construction and tested at 8 hours, 7 days and 90 days are included in Reference (2).
7.2 Observations from Cores Taken after HVS Testing
After all HVS testing was completed, 37 100-mm diameter cores (9 from Section 1 and
14 each from Sections 3 and 5, respectively) were extracted from the South Tangent for more
detailed investigation. The time of coring was approximately 960 days after construction. Most
of these cores were taken from concrete judged intact and uncracked while the positions of others
correspond to cracks and instrument positions. Some useful statistics from these cores are shown
in Tables 7.4�7.7.
7.2.1 Core Lengths
In general, the measured uncut core lengths confirms the observations from the cores
taken earlier, i.e., that the slabs are somewhat thicker than called for in the design specifications.
The average slab thicknesses (from uncut core dimensions) are 111.9, 178.3, and 200.4 mm for
Sections 1, 3, and 5, respectively.
Core lengths from Section 3, however, show a 50th percentile thickness of 177.5 mm and
a high of 200 mm as compared to the design specification of 150 mm. The variability in slab
thickness, especially for Section 3, must be noted for further analysis.

175
7.2.2 Core Densities
Only volumetric densities were calculated from core dimensions and weights. Parafilm
densities were however estimated using the average conversion factor of 0.9768. The densities
from this set of cores are very similar to those of the 40-day cores (2,360 kg/m2 estimated
average Parafilm for the post-HVS testing cores and an average of 2,353 kg/m3 from the 40-day
cores, with a maximum of 2,425 kg/m3 and a minimum of 2,240 kg/m3).
7.2.3 Compression Strength of Cores
The relationship between compressive strength and core density is more clear in the set of
cores taken after HVS testing. Seven cores were tested and show a definite trend (refer to Figure
7.1). The straight line fit to the trend is:
16.41019980 -)(kg/mdensity Parafilm. (MPa) strengtheCompressiv 3×=
The highest measured compressive strength was 74.6 MPa, corresponding to an estimated
Parafilm density of 2,425 kg/m3; the lowest value was 42.8 MPa, corresponding to an estimated
Parafilm density of 2,272 kg/m3. Cylindrical specimens taken during construction, cured under
standard laboratory conditions, and tested after 90 days had a maximum compressive strength of
approximately 55 MPa and an average strength of approximately 44 MPa. When these strengths
are compared to the average of 61.7 MPa and high of 74 MPa of the cores taken after HVS
testing, it is evident that significant strength development took place after 90 days.

176
Table 7.4 Properties of Palmdale cores, South Tangent, Section 1, Sample Size = 9Uncut Length
(cm)Volumetric Density
(kg/m3)Estimated Parafilm Density*
(kg/m3)Average 11.2 2,449 2,392Low 9.4 2,437 2,381High 12.9 2,476 2,419Std. Dev. 1.2 12 1150th Percentile 10.9 2,446 2,38990th Percentile 12.3 2,458 2,40110th Percentile 10.0 2,439 2,3825th Percentile 9.7 2,438 2,381
Table 7.5 Properties of Palmdale cores, South Tangent, Section 3, Sample Size = 14Uncut Length
(cm)Volumetric Density
(kg/m3)Estimated Parafilm Density*
(kg/m3)Average 17.8 2,402 2,346Low 16.5 2,294 2,241High 20.2 2,441 2,384Std. Dev. 1.0 37 3650th Percentile 17.8 2,403 2,34790th Percentile 18.8 2,429 2,37310th Percentile 16.9 2,366 2,3115th Percentile 16.7 2,338 2,284
Table 7.6 Properties of Palmdale cores, South Tangent, Section 5, Sample Size = 14
Uncut Length(cm)
Volumetric Density(kg/m3)
Estimated Parafilm Density*
(kg/m3)
Average 20.0 2,417 2,361Low 18.2 2,326 2,272High 21.7 2,483 2,425Std. Dev. 1.2 46 4550th Percentile 20.2 2,420 2,36490th Percentile 21.6 2,467 2,40910th Percentile 18.6 2,375 2,3125th Percentile 18.4 2,351 2,296

177
Table 7.7 Properties of Palmdale cores, South Tangent, all Sections Average, SampleSize = 37
Uncut Length(cm)
Volumetric Density(kg/m3)
Estimated Parafilm Density*
(kg/m3)Average N/A 2,417 2,360Low N/A 2,294 2,241High N/A 2,483 2,425Std. Dev. N/A 41 4050th Percentile N/A 2,422 2,36690th Percentile N/A 2,453 2,39610th Percentile N/A 2,374 2,3195th Percentile N/A 2,342 2,288
0
10
20
30
40
50
60
70
80
2260 2280 2300 2320 2340 2360 2380 2400 2420 2440
Density (kg/m3)
Com
pres
sive
Stre
ngth
(MPa
)
Figure 7.1. Density versus compressive strength, cores taken after HVS testing.
178
7.2.4 Instrument Position
Instrument positions were measurable on two cores. Both of these cores were extracted
from Section 5, slab 39. The position of the one core was center and the other mid-south. In
both cases, the instrument was the Carlson A-8 strain meter. The distance of the instruments
from the pavement surface was 68 mm and 75 mm, respectively; (the design location depth was
40 mm).
7.3 Observations and Comment on Day/Night Cores
Six pairs of cores were extracted from Section 5 (South Tangent). These cores were
taken on joints, one of each pair during daytime and one during nighttime on the same joint. The
joints were fixed in place using an injected methacrylate epoxy adhesive to �capture� the joint
width at the specified day and night times (3�5 a.m. for night, 1�3 p.m. for day). The goal of this
procedure was to observe joint shrinkage and contraction due to thermal effects. Measurements
taken of these cores include saw cut depth, saw cut width (both at the top and bottom of the cut)
as well as the crack opening at the bottom of the core.
7.3.1 Saw cut depth and width
The saw cut depths from all the cores were very consistent with an average depth of 63.08
mm, a low of 62 mm and a high of 65 mm. There was also no significant difference observed
between the top and bottom of the saw cuts on the cores. The average saw cut opening was
about 5.9 mm. More statistics are shown in Table 7.8.

Table 7.8 Saw Cut Statistics: Day and Night CoresDay Time Readings Night Time ReadingsOpening at Saw CutTop (mm)
Opening at Saw CutBottom (mm)
Opening at Saw CutTop (mm)
Opening at Saw CutBottom (mm)
Saw cutdepth(mm) Side 1 Side 2 Side 1 Side 2 Side 1 Side2 Side1 Side2
Average 63.1 5.8 5.9 5.6 5.8 6.3 6.2 6.0 5.6Low 62.0 5.5 5.6 5.4 5.4 5.7 5.7 5.6 5.3High 65.0 6.4 6.1 6.2 6.1 6.5 6.7 6.4 6.6Std. Dev. 0.8 0.3 0.3 0.3 0.3 0.3 0.4 0.4 0.550th Percentile 63.0 5.7 5.9 5.5 5.8 6.3 6.1 6.1 5.790th Percentile 63.9 6.1 6.1 6.0 6.1 6.5 6.6 6.4 6.410th Percentile 62.1 5.5 5.6 5.4 5.5 6.0 5.9 5.6 5.4
179

180
7.3.2 Day/night measurements of saw cut openings and cracks at the bottom of the cores
From the statistics shown in Table 7.8, no significant difference can be detected between
day/night measurements of the saw cut openings.
Six pairs of day/night measurements of crack openings at the bottom of the cores are
shown in Table 7.9. At first glance, there seem to be a more or less 50 percent decrease in crack
opening at night on three pairs of the cores. The day/night crack openings for the remaining
three pairs are generally lower in magnitude and the differences between day and night openings
for these pairs are less significant to insignificant.
It should be noted that this experiment was performed during the winter with snow
present on one of the days when coring took place. Therefore, the temperature difference and
resulting thermal expansion and contraction of the slabs between day and night would not be as
great as would be expected during the summer months. Further investigation and a repetition of
the experiment during a period of greater daily temperature fluctuation is required before any
meaningful conclusions can be drawn.
Table 7.9 Day/Night Measurements of Crack Openings at Bottom of CoresOpening at Crack Bottom (mm)Position JointBottom Side 1 Bottom Side 2
Comments
A 32S/33S DAY 1.1 1.1 Joint cloggedB 32S/33S NIGHT 0.55 0.55 Joint cloggedB 33S/34S DAY 0.94 0.94 Joint cloggedA 33S/34S NIGHT 1.1 0.94 Joint cloggedA 34S/35S DAY 1.4 1.4 Joint cloggedB 34S/35S NIGHT 0.7 0.7 Joint cloggedB 35S/36S DAY 0.7 0.7 Joint cloggedA 35S/36S NIGHT 0.7 0.7 Joint cloggedA 36S/37S DAY 1.6 1.6 Joint cloggedB 36S/37S NIGHT 0.82 0.82 Joint cloggedB 37S/38S DAY 0.9 0.9 Joint cloggedA 37S/38S NIGHT 0.7 0.7 Joint cloggedNote: Position A: Core position close to center of slabPosition B: Core position closer to barrier

181
8.0 TEMPERATURE DATA
Temperatures were collected from thermocouples every 2 hours for the duration of each
HVS test. This section summarizes all temperature data in graphical format. The complete raw
temperature data can be found in Appendix B.
The following temperature data were recorded:
• Air temperature outside the temperature control chamber
• Air temperature inside the temperature control chamber
• Surface temperature inside the temperature control chamber
• In-depth concrete pavement temperatures at 50, 100, 150, and 200-mm depths
Only the temperature of the concrete slab has been recorded and in cases where the
concrete thickness was less than 200 mm, the temperature at the bottom of the concrete layer is
reported (i.e. for the 100-mm sections, in-depth temperatures were recorded at 0, 50, and 100
mm). In some cases, more than one thermocouple was installed. Appendix B details all
collected thermocouple data.

182

183
9.0 REFERENCES
1. CAL/APT Contract Team. �Test Plan for CAL/APT Goal LLPRS�Rigid Phase III,�Institute of Transportation Studies, Pavement Research Center, University of California,Berkeley, April 1998.
2. Roesler, J., Scheffy, C., Ali, A., and Bush, D. �Construction, Instrumentation, and MaterialTesting of Fast-Setting Hydraulic Cement Concrete Pavement in Palmdale, California,�Institute of Transportation Studies, Pavement Research Center, University of California,Berkeley, Draft Report to Caltrans, March 1999.
3. Roesler, J., du Plessis, L., Hung, D., Bush, D., Harvey, J. �CAL/APT Goal LLPRS � RigidPhase III: Concrete Test Section 516CT Report,� Institute of Transportation Studies,Pavement Research Center, University of California, Berkeley, Draft Report to Caltrans,September, 1998.
4. Heath, A. C., J. R. Roesler, J. T. Harvey. �Quantifying Longitudinal, Corner and TransverseCracking in Jointed Concrete Pavements.� Transportation Research Board Annual MeetingCD-ROM. 2000.
5. Roesler, J. Fatigue of Concrete Beams and Slabs. Ph.D. Thesis, University of Illinois,Urbana-Champaign, IL, 1998.

184
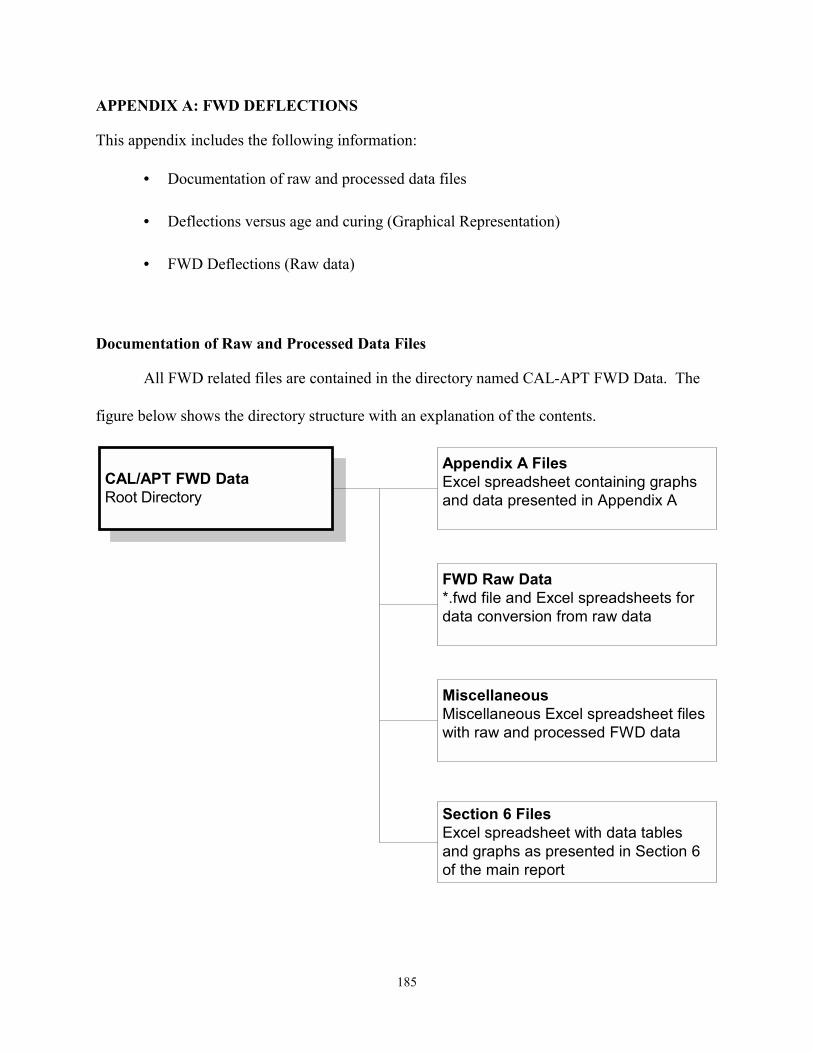
185
APPENDIX A: FWD DEFLECTIONS
This appendix includes the following information:
• Documentation of raw and processed data files
• Deflections versus age and curing (Graphical Representation)
• FWD Deflections (Raw data)
Documentation of Raw and Processed Data Files
All FWD related files are contained in the directory named CAL-APT FWD Data. The
figure below shows the directory structure with an explanation of the contents.
CAL/APT FWD DataRoot Directory
CAL/APT FWD DataRoot Directory
Appendix A FilesExcel spreadsheet containing graphsand data presented in Appendix A
FWD Raw Data*.fwd file and Excel spreadsheets fordata conversion from raw data
MiscellaneousMiscellaneous Excel spreadsheet fileswith raw and processed FWD data
Section 6 FilesExcel spreadsheet with data tablesand graphs as presented in Section 6of the main report

186
The raw data files containing the Falling Weight Deflectometer (FWD) data (*.fwd files)
are contained in the directory named �FWD Raw Data�. A hardcopy of most of these files is
provided in translated format in the following sections. For second level analysis, the data can be
electronically accessed by means of the spreadsheet titled �FWD conversion 1.xls�. This
spreadsheet contains a macro that processes the raw FWD data into a format from which data can
be readily processed for graphical representation and further analysis.
The macro is run from the command button called �Import FWD,� which is embedded in
the first page of the spreadsheet. When this button is clicked, a file-open dialog box appears.
Users can use this dialog to browse and select any file with the �FWD� extension. When the file
is selected, the data is extracted from the raw data file to the first sheet of the spreadsheet. The
data shows all relevant information from the raw data file, including:
• File name;
• Data of file creation (as entered by the operator at the time of measurement);
• Comments;
• Plate and sensor configuration;
• Station position for all deflections (all drops);
• Surface and air temperature for all deflections (all drops);
• Time of measurement for all deflections (all drops);
• Plate pressure for all deflections (all drops);
• Deflections for all stations (all drops);

187
The Autofilter property (Data!Filter!Autofilter) can be used to filter the data for a
specific criterion (e.g., range of stations, drop number). The filtered data can be copied and
pasted to another sheet for further analysis.
Deflections versus Curing Age for HVS Sections
The graphs show the variation in the normalized maximum deflection at different curing
ages. The HVS test position is also indicated in the figures. The deflections were recorded along
the slab centerline and were normalized for an applied load of 66.7 kN (943.6 kPa).
Deflections versus Curing Age for all 200 mm thick slabs
The attached graphs show the FWD maximum deflections at different times after
construction. Slab numbers are also indicated in the graphs. The deflections (in micron) were
normalized for an applied load of 66.7 kN (943.6 kPa).
FWD Deflections (Raw Data)
Charts plotting the converted raw FWD data are shown below. The data can be accessed
in the Pavement Research Center Database.

188
4sctr1d.fwd
0100200
300400500600700
800900
1000
0 50 100 150 200 250
Station (ft)
Norm
aliz
ed M
ax. D
efle
ctio
n (m
icro
n)
98/06/12
5sctr7d.fwd
0100200300400500
600700800900
1000
0 50 100 150 200 250
Station (ft)
Norm
aliz
ed M
ax. D
efle
ctio
n (m
icro
n)
98/06/18

189
6sctr54d.fwd
0100200300400500
600700800900
1000
0 50 100 150 200 250
Station (ft)
Norm
aliz
ed M
ax. D
efle
ctio
n (m
icro
n)
98/08/04
7sctr90d.fwd
0100200
300400500600700
800900
1000
0 50 100 150 200 250
Station (ft)
Norm
aliz
ed M
ax. D
efle
ctio
n (m
icro
n)
98/09/09

190
8sctr200.fwd
0100200300400500600700800900
1000
0 50 100 150 200 250
Station (ft)
Norm
aliz
ed M
ax. D
efle
ctio
n (m
icro
n)
99/01/07
9sctr270.fwd
0100200300400500
600700800900
1000
0 50 100 150 200 250
Station (ft)
Norm
aliz
ed M
ax. D
efle
ctio
n (m
icro
n)
99/03/24

191
10sc330.fwd
0100200300400500
600700800900
1000
0 50 100 150 200 250
Station (ft)
Norm
aliz
ed M
ax. D
efle
ctio
n (m
icro
n)
99/06/16
11SCd2.FWD
0100200300400500
600700800900
1000
0 50 100 150 200 250
Station (ft)
Norm
aliz
ed M
ax. D
efle
ctio
n (m
icro
n)
1/2/2007

192

193
APPENDIX B: THERMOCOUPLE DATA
This appendix presents an example of the thermocouple data generated during the testing
of the South Tangent pavement test sections. The complete data can be accessed using the
Pavement Research Center Database.
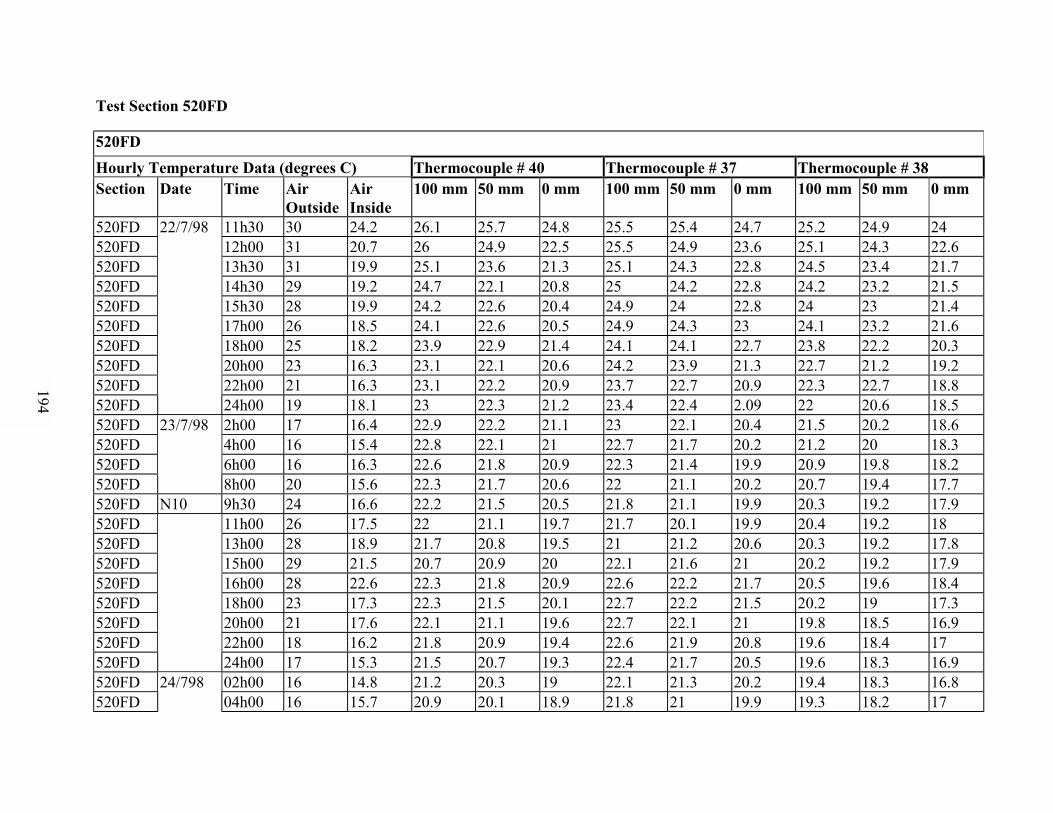
Test Section 520FD
520FDHourly Temperature Data (degrees C) Thermocouple # 40 Thermocouple # 37 Thermocouple # 38Section Date Time Air
OutsideAirInside
100 mm 50 mm 0 mm 100 mm 50 mm 0 mm 100 mm 50 mm 0 mm
520FD 11h30 30 24.2 26.1 25.7 24.8 25.5 25.4 24.7 25.2 24.9 24520FD 12h00 31 20.7 26 24.9 22.5 25.5 24.9 23.6 25.1 24.3 22.6520FD 13h30 31 19.9 25.1 23.6 21.3 25.1 24.3 22.8 24.5 23.4 21.7520FD 14h30 29 19.2 24.7 22.1 20.8 25 24.2 22.8 24.2 23.2 21.5520FD 15h30 28 19.9 24.2 22.6 20.4 24.9 24 22.8 24 23 21.4520FD 17h00 26 18.5 24.1 22.6 20.5 24.9 24.3 23 24.1 23.2 21.6520FD 18h00 25 18.2 23.9 22.9 21.4 24.1 24.1 22.7 23.8 22.2 20.3520FD 20h00 23 16.3 23.1 22.1 20.6 24.2 23.9 21.3 22.7 21.2 19.2520FD 22h00 21 16.3 23.1 22.2 20.9 23.7 22.7 20.9 22.3 22.7 18.8520FD
22/7/98
24h00 19 18.1 23 22.3 21.2 23.4 22.4 2.09 22 20.6 18.5520FD 2h00 17 16.4 22.9 22.2 21.1 23 22.1 20.4 21.5 20.2 18.6520FD 4h00 16 15.4 22.8 22.1 21 22.7 21.7 20.2 21.2 20 18.3520FD 6h00 16 16.3 22.6 21.8 20.9 22.3 21.4 19.9 20.9 19.8 18.2520FD
23/7/98
8h00 20 15.6 22.3 21.7 20.6 22 21.1 20.2 20.7 19.4 17.7520FD N10 9h30 24 16.6 22.2 21.5 20.5 21.8 21.1 19.9 20.3 19.2 17.9520FD 11h00 26 17.5 22 21.1 19.7 21.7 20.1 19.9 20.4 19.2 18520FD 13h00 28 18.9 21.7 20.8 19.5 21 21.2 20.6 20.3 19.2 17.8520FD 15h00 29 21.5 20.7 20.9 20 22.1 21.6 21 20.2 19.2 17.9520FD 16h00 28 22.6 22.3 21.8 20.9 22.6 22.2 21.7 20.5 19.6 18.4520FD 18h00 23 17.3 22.3 21.5 20.1 22.7 22.2 21.5 20.2 19 17.3520FD 20h00 21 17.6 22.1 21.1 19.6 22.7 22.1 21 19.8 18.5 16.9520FD 22h00 18 16.2 21.8 20.9 19.4 22.6 21.9 20.8 19.6 18.4 17520FD 24h00 17 15.3 21.5 20.7 19.3 22.4 21.7 20.5 19.6 18.3 16.9520FD 02h00 16 14.8 21.2 20.3 19 22.1 21.3 20.2 19.4 18.3 16.8520FD
24/79804h00 16 15.7 20.9 20.1 18.9 21.8 21 19.9 19.3 18.2 17
194
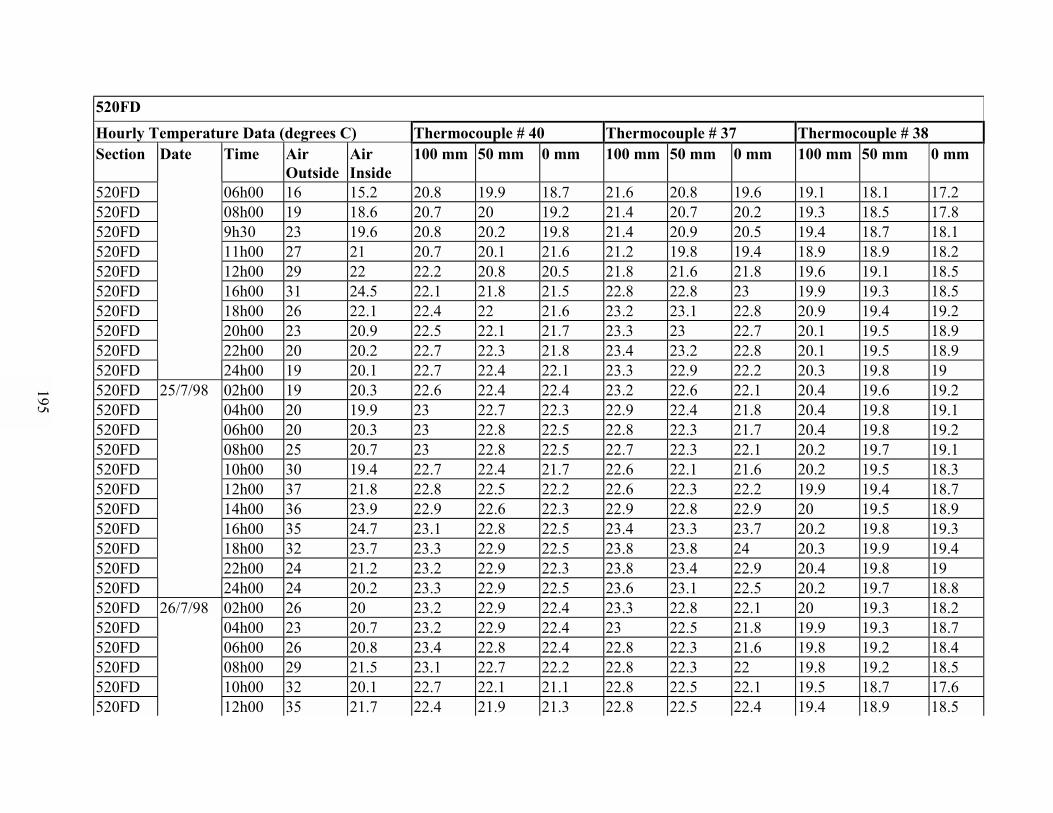
520FDHourly Temperature Data (degrees C) Thermocouple # 40 Thermocouple # 37 Thermocouple # 38Section Date Time Air
OutsideAirInside
100 mm 50 mm 0 mm 100 mm 50 mm 0 mm 100 mm 50 mm 0 mm
520FD 06h00 16 15.2 20.8 19.9 18.7 21.6 20.8 19.6 19.1 18.1 17.2520FD 08h00 19 18.6 20.7 20 19.2 21.4 20.7 20.2 19.3 18.5 17.8520FD 9h30 23 19.6 20.8 20.2 19.8 21.4 20.9 20.5 19.4 18.7 18.1520FD 11h00 27 21 20.7 20.1 21.6 21.2 19.8 19.4 18.9 18.9 18.2520FD 12h00 29 22 22.2 20.8 20.5 21.8 21.6 21.8 19.6 19.1 18.5520FD 16h00 31 24.5 22.1 21.8 21.5 22.8 22.8 23 19.9 19.3 18.5520FD 18h00 26 22.1 22.4 22 21.6 23.2 23.1 22.8 20.9 19.4 19.2520FD 20h00 23 20.9 22.5 22.1 21.7 23.3 23 22.7 20.1 19.5 18.9520FD 22h00 20 20.2 22.7 22.3 21.8 23.4 23.2 22.8 20.1 19.5 18.9520FD 24h00 19 20.1 22.7 22.4 22.1 23.3 22.9 22.2 20.3 19.8 19520FD 02h00 19 20.3 22.6 22.4 22.4 23.2 22.6 22.1 20.4 19.6 19.2520FD 04h00 20 19.9 23 22.7 22.3 22.9 22.4 21.8 20.4 19.8 19.1520FD 06h00 20 20.3 23 22.8 22.5 22.8 22.3 21.7 20.4 19.8 19.2520FD 08h00 25 20.7 23 22.8 22.5 22.7 22.3 22.1 20.2 19.7 19.1520FD 10h00 30 19.4 22.7 22.4 21.7 22.6 22.1 21.6 20.2 19.5 18.3520FD 12h00 37 21.8 22.8 22.5 22.2 22.6 22.3 22.2 19.9 19.4 18.7520FD 14h00 36 23.9 22.9 22.6 22.3 22.9 22.8 22.9 20 19.5 18.9520FD 16h00 35 24.7 23.1 22.8 22.5 23.4 23.3 23.7 20.2 19.8 19.3520FD 18h00 32 23.7 23.3 22.9 22.5 23.8 23.8 24 20.3 19.9 19.4520FD 22h00 24 21.2 23.2 22.9 22.3 23.8 23.4 22.9 20.4 19.8 19520FD
25/7/98
24h00 24 20.2 23.3 22.9 22.5 23.6 23.1 22.5 20.2 19.7 18.8520FD 02h00 26 20 23.2 22.9 22.4 23.3 22.8 22.1 20 19.3 18.2520FD 04h00 23 20.7 23.2 22.9 22.4 23 22.5 21.8 19.9 19.3 18.7520FD 06h00 26 20.8 23.4 22.8 22.4 22.8 22.3 21.6 19.8 19.2 18.4520FD 08h00 29 21.5 23.1 22.7 22.2 22.8 22.3 22 19.8 19.2 18.5520FD 10h00 32 20.1 22.7 22.1 21.1 22.8 22.5 22.1 19.5 18.7 17.6520FD
26/7/98
12h00 35 21.7 22.4 21.9 21.3 22.8 22.5 22.4 19.4 18.9 18.5
195

520FDHourly Temperature Data (degrees C) Thermocouple # 40 Thermocouple # 37 Thermocouple # 38Section Date Time Air
OutsideAirInside
100 mm 50 mm 0 mm 100 mm 50 mm 0 mm 100 mm 50 mm 0 mm
520FD 14h00 39 22.7 22.8 21.4 23.1 22.9 23 22.9 19.4 19.4 19.2520FD 16h00 37 25.5 22.4 22 21.2 23.4 23.4 23.8 19.9 19.6 19.2520FD 18h00 34 23.2 22.5 21.2 20.1 23.8 23.5 22.8 20.1 19.8 19.7520FD 20h00 30 21.8 22.5 21.9 20.6 23.7 23.4 23 20.2 19.7 18.9520FD 22h00 28 21.2 22.6 22.1 21.5 23.7 23.3 22.7 20.1 19.4 18.5520FD 24h00 28 20.5 22.6 22 21.4 23.5 23 22.3 19.7 19.1 18.2520FD 02h00 28 20.1 22.6 22.1 21.3 23.2 22.8 21.9 19.6 18.9 17.9520FD 04h00 27 19.1 22.5 21.9 21.2 23 22.6 21.5 19.4 18.9 18.2520FD 06h00 27 20.2 22.3 21.8 21 22.8 22.3 21.5 19.5 18.8 17.9520FD 08h00 30 20.3 22.1 21.5 20.9 22.5 21.9 21.1 19.2 18.6 17.8520FD 10h00 32 20.5 22 21.1 20.6 22.6 22.3 21.3 19.1 18.4 17.6520FD 12h00 34 21.7 22.1 21.7 21.2 22.9 22.7 22.8 19.2 18.8 18.5520FD 14h00 38 22.8 22.2 22.1 21.6 23.4 23.1 22.9 19.1 19.5 19.3520FD 16h00 37 25.3 22.3 21.4 20.8 23.7 23.5 23.1 20 19.6 19.5520FD 18h00 36 24.7 22.5 22.9 20.4 23.8 23.6 23.5 20.1 19.8 19.6520FD 20h00 32 22.9 22.5 21.9 21 24 23.9 23.7 20.2 19.8 19.3520FD 22h00 28 22.8 22.5 21.9 21.2 24.2 23.9 23.6 20.1 19.7 19.1520FD 24h00 28 17.9 22.5 21.8 20.8 24.2 23.7 23.1 20 19.2 17.8520FD 02h00 27 17.1 22.1 21.5 20.4 23.7 23.2 22.2 19.2 18.3 16.8520FD
27/7/98
04h00 27 17.1 22 21.3 20.3 23.4 22.8 21.8 18.8 17.9 16.8520FD 06h00 25 17.8 21.8 21.1 20.2 23 22.4 21.4 18.6 17.9 16.9520FD 08h00 29 18.9 21.6 20 20.2 22.8 22.3 21.7 18.6 17.9 17.3520FD 12h00 37 21.3 21.9 20.2 20.7 23.2 22.9 22.8 19 18.8 18.5520FD 14h00 37 24.9 21.8 21.4 21 23.3 23.4 23.7 19.2 18.9 18.9520FD 16h00 37 31.4 22.3 22 22.1 24.1 24.3 25.6 19.7 19.8 20.3520FD 18h00 34 27.8 22.8 22.7 22.6 24.8 25.1 25.7 20.3 20.5 20.7520FD
28/7/98
20h00 29 23.6 23 22.6 22.1 25 24.9 24.8 20.5 20.4 20.2
196
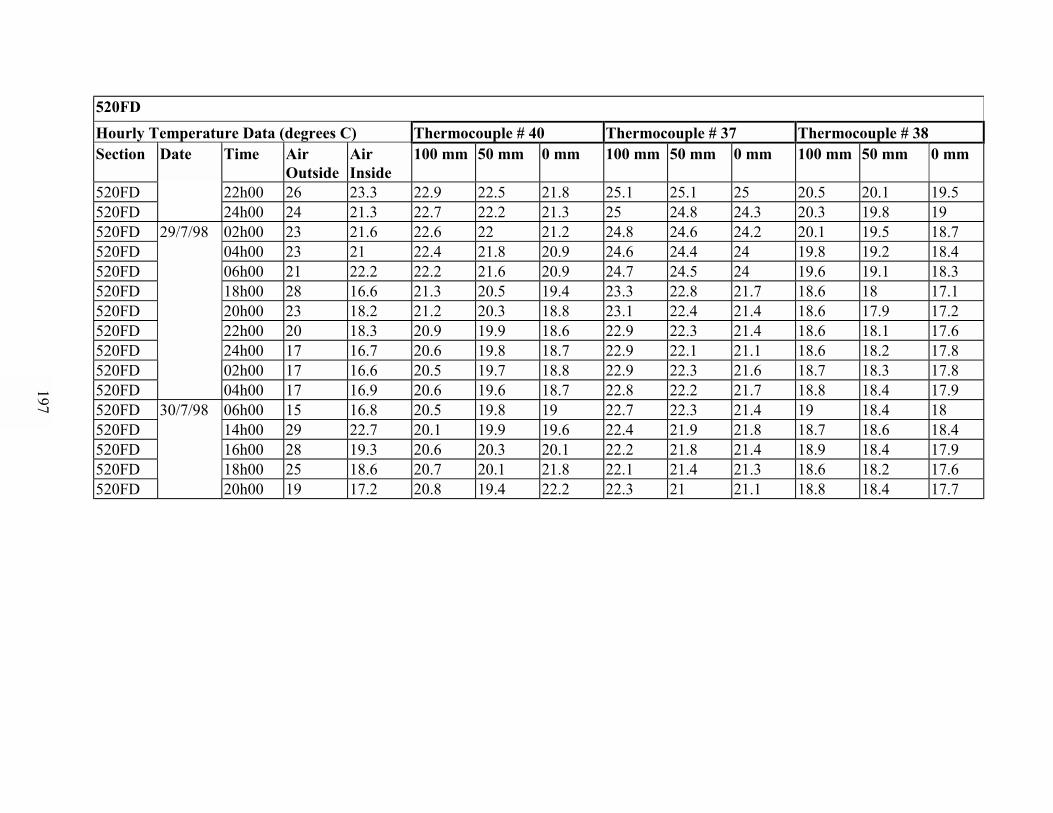
520FDHourly Temperature Data (degrees C) Thermocouple # 40 Thermocouple # 37 Thermocouple # 38Section Date Time Air
OutsideAirInside
100 mm 50 mm 0 mm 100 mm 50 mm 0 mm 100 mm 50 mm 0 mm
520FD 22h00 26 23.3 22.9 22.5 21.8 25.1 25.1 25 20.5 20.1 19.5520FD 24h00 24 21.3 22.7 22.2 21.3 25 24.8 24.3 20.3 19.8 19520FD 02h00 23 21.6 22.6 22 21.2 24.8 24.6 24.2 20.1 19.5 18.7520FD 04h00 23 21 22.4 21.8 20.9 24.6 24.4 24 19.8 19.2 18.4520FD 06h00 21 22.2 22.2 21.6 20.9 24.7 24.5 24 19.6 19.1 18.3520FD 18h00 28 16.6 21.3 20.5 19.4 23.3 22.8 21.7 18.6 18 17.1520FD 20h00 23 18.2 21.2 20.3 18.8 23.1 22.4 21.4 18.6 17.9 17.2520FD 22h00 20 18.3 20.9 19.9 18.6 22.9 22.3 21.4 18.6 18.1 17.6520FD 24h00 17 16.7 20.6 19.8 18.7 22.9 22.1 21.1 18.6 18.2 17.8520FD
29/7/98
02h00 17 16.6 20.5 19.7 18.8 22.9 22.3 21.6 18.7 18.3 17.8520FD 04h00 17 16.9 20.6 19.6 18.7 22.8 22.2 21.7 18.8 18.4 17.9520FD 06h00 15 16.8 20.5 19.8 19 22.7 22.3 21.4 19 18.4 18520FD 14h00 29 22.7 20.1 19.9 19.6 22.4 21.9 21.8 18.7 18.6 18.4520FD 16h00 28 19.3 20.6 20.3 20.1 22.2 21.8 21.4 18.9 18.4 17.9520FD 18h00 25 18.6 20.7 20.1 21.8 22.1 21.4 21.3 18.6 18.2 17.6520FD
30/7/98
20h00 19 17.2 20.8 19.4 22.2 22.3 21 21.1 18.8 18.4 17.7
197
![Experimental Investigation of Properties of Concrete ... · ASTM C143/C143M [31] Standard test method for slump of hydraulic-cement concrete Ultrasonic Pulse Velocity (UPV) test ASTM](https://static.fdocuments.us/doc/165x107/5e7905a68c63df5bd2597cd6/experimental-investigation-of-properties-of-concrete-astm-c143c143m-31-standard.jpg)