Hurricane Damage: Effects of Climate Change and Coastal Development
Upload
congressional-budget-officeCategory
view
1.202download
0
Congressional Budget Office
Hurricane Damage: Effects of Climate Change and
Coastal Development
June 5, 2015
As developmental work for analysis for the Ranking Member of the Senate Budget Committee, the information in this presentation is preliminary and is being circulated to stimulate discussion and critical comment. The analysis and presentation were prepared in collaboration with Tristan Hanon and Jon Sperl. David Austin, Maureen Costantino, Joseph Kile, Jeffrey Kling, Bo Peery and Jeanine Rees, all of CBO, provided helpful comments. Kerry Emanuel of the Massachusetts Institute of Technology, Thomas Knutson of the National Oceanic and Atmospheric Administration, and Paul Wilson of Risk Management Solutions provided data and helpful comments. The assistance of external participants implies no responsibility for the final product, which rests solely with CBO.
Presentation at the Summer Conference of the Association of the Environmental and Resource Economists
Terry DinanSenior Adviser, Microeconomic Studies Division
2C O N G R E S S I O N A L B U D G E T O F F I C E
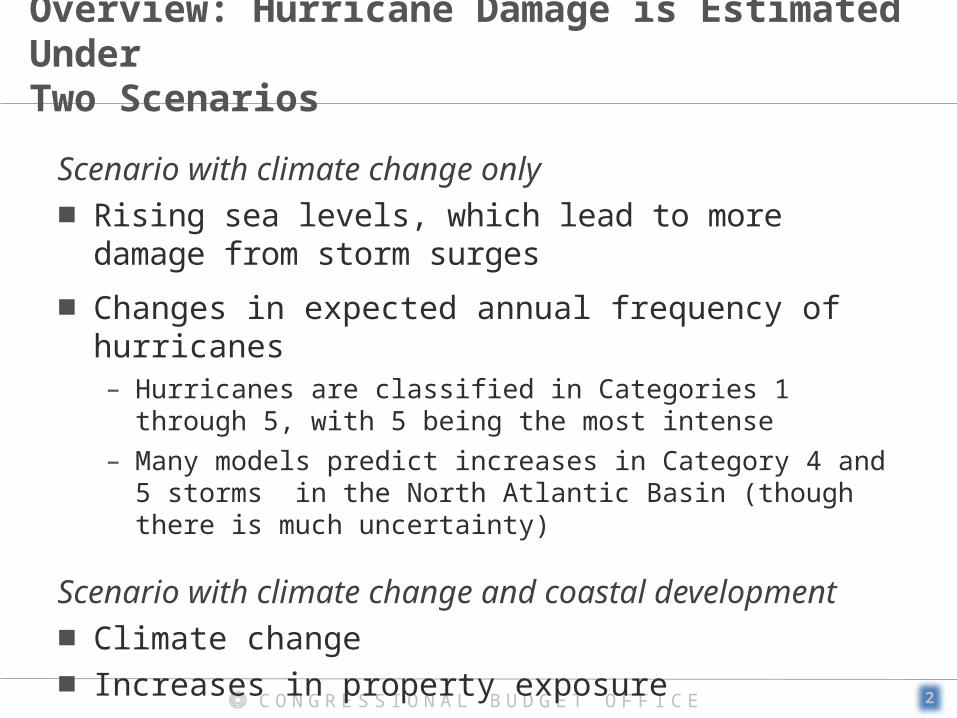
Overview: Hurricane Damage is Estimated Under Two Scenarios
Scenario with climate change only ■ Rising sea levels, which lead to more damage from storm surges
■ Changes in expected annual frequency of hurricanes– Hurricanes are classified in Categories 1 through 5, with 5 being the
most intense– Many models predict increases in Category 4 and 5 storms in the
North Atlantic Basin (though there is much uncertainty)
Scenario with climate change and coastal development ■ Climate change■ Increases in property exposure

3C O N G R E S S I O N A L B U D G E T O F F I C E
Overview: Method and Reported Outcomes
■ A Monte Carlo simulation is used to estimate future hurricane damage.
■ 5,000 simulations are used to capture uncertainty in factors that affect hurricane damage.
■ Annual results include:– Distribution of damage estimates– Expected damage (mean of estimates) – “Likely range,” indicating the range around the mean that contains
two-thirds of the estimates

4C O N G R E S S I O N A L B U D G E T O F F I C E
Preliminary Results
■ Compared with current conditions, expected hurricane damage in 2075, measured in 2015 dollars, would:– Double under the scenario with climate change only– Increase five-fold under the scenario with climate change and coastal
development
■ Hurricane damage is projected to grow more quickly than GDP under scenario with climate change and coastal development; in 2075: – Expected damage as a share of GDP would be roughly 40 percent
higher than under current conditions– But dollar amounts would still be small relative to GDP; increase in
expected damage would be less than 0.1 percent of GDP
■ Estimates are uncertain and likely range grows substantially over time.
5C O N G R E S S I O N A L B U D G E T O F F I C E
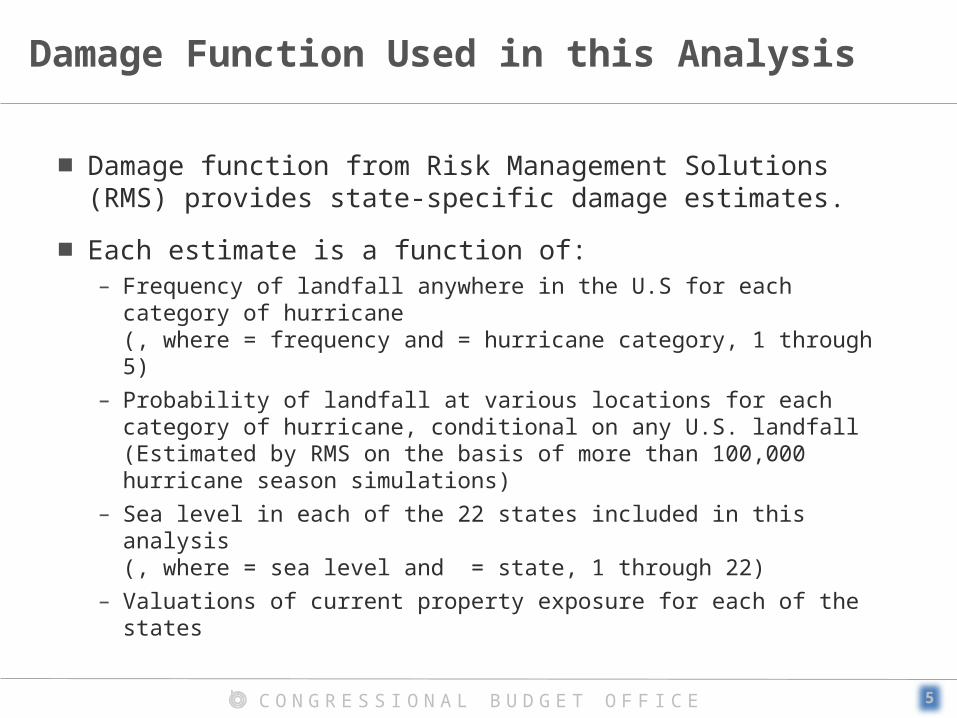
Damage Function Used in this Analysis
■ Damage function from Risk Management Solutions (RMS) provides state-specific damage estimates.
■ Each estimate is a function of: – Frequency of landfall anywhere in the U.S for each category of
hurricane(, where = frequency and = hurricane category, 1 through 5)
– Probability of landfall at various locations for each category of hurricane, conditional on any U.S. landfall (Estimated by RMS on the basis of more than 100,000 hurricane season simulations)
– Sea level in each of the 22 states included in this analysis (, where = sea level and = state, 1 through 22)
– Valuations of current property exposure for each of the states

6C O N G R E S S I O N A L B U D G E T O F F I C E
Preliminary Damage Estimate in Reference Case
■ The reference case is estimated damage under current conditions (with no additional climate change or coastal development); it is based on estimates of current: – Hurricane frequencies (average over the past 100 years)– State-specific sea levels – Valuation of property exposure by state
■ Reference case estimated damage is $29 billion (2015 dollars)
■ Estimate reflects average conditions; actual damage could be more or less depending on actual hurricane occurrences and locations of landfall.

7C O N G R E S S I O N A L B U D G E T O F F I C E
Approach for Estimating Effects of Climate Change Only in Selected Years (e.g., 2025)

8C O N G R E S S I O N A L B U D G E T O F F I C E
Distribution of Projected Sea Level Rise in Two States: Florida and Texas
0.0 0.5 1.0 1.5 2.0 2.5 3.0 3.5 4.0 4.5
Sea Level Rise (Feet)
Florida, 2075Average = 1.5
Florida, 2025Average = 0.3
Florida, 2050Average = 0.8
Texas, 2050Average = 1.2
Texas, 2025Average = 0.4
Texas, 2075Average = 2.1

9C O N G R E S S I O N A L B U D G E T O F F I C E
0 0.1 0.2 0.3 0.4 0.5 0.6 0.7 0.8 0.9 1 1.1
Projections by Emanuel
Projections by Knutson
2075
Reference Case
2025
Projected Frequencies of Landfalls of Category 2 Hurricanes,Estimated by Two Modelers
Each “●” indicates a projection made by the modeler based on a unique set of hurricane-influencing factors, such as sea surface temperature. Those factors were obtained from various Atmospheric Oceanic General Circulation Models, with each model projecting outcomes based on a given concentration of greenhouse gases in the atmosphere.

10C O N G R E S S I O N A L B U D G E T O F F I C E
0 0.1 0.2 0.3 0.4 0.5 0.6 0.7 0.8 0.9 1 1.1
Projections by Emanuel
Projections by Knutson
2075
Reference Case
2025
Projected Frequencies of Landfalls of Category 4 Hurricanes,Estimated by Two Modelers
Each “●” indicates a projection made by the modeler based on a unique set of hurricane-influencing factors, such as sea surface temperature. Those factors were obtained from various Atmospheric Oceanic General Circulation Models, with each model projecting outcomes based on a given concentration of greenhouse gases in the atmosphere.
11C O N G R E S S I O N A L B U D G E T O F F I C E
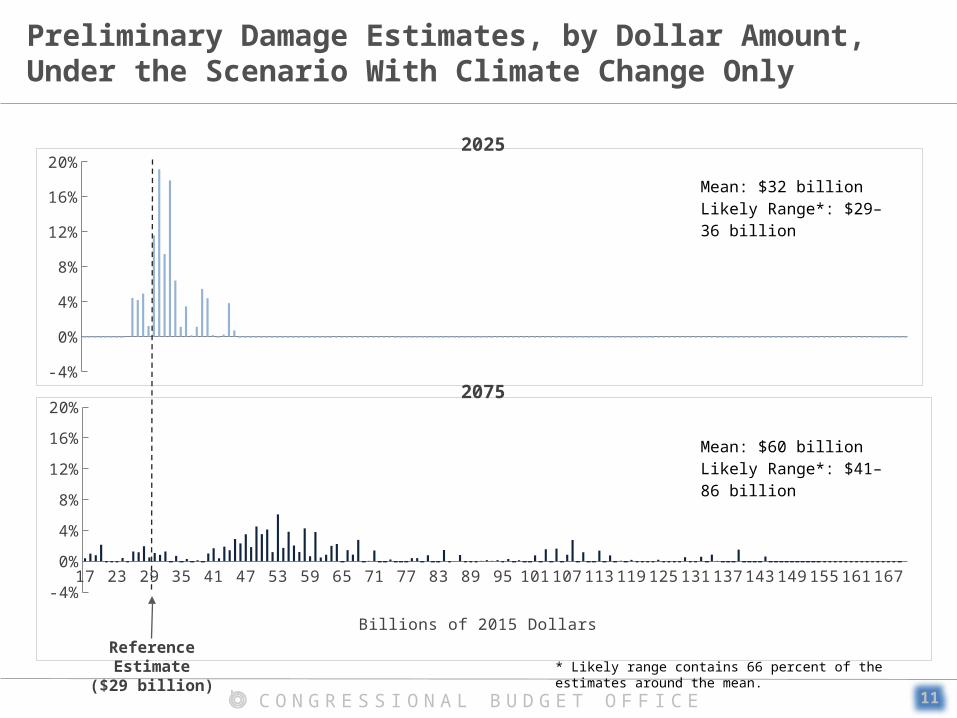
Preliminary Damage Estimates, by Dollar Amount, Under the Scenario With Climate Change Only
17 22 27 32 37 42 47 52 57 62 67 72 77 82 87 92 97 102 107 112 117 122 127 132 137 142 147 152 157 162 167-4%
0%
4%
8%
12%
16%
20%
Billions of 2015 Dollars
-4%
0%
4%
8%
12%
16%
20%
Mean: $60 billionLikely Range*: $41–86 billion
Mean: $32 billionLikely Range*: $29–36 billion
2025
2075
* Likely range contains 66 percent of the estimates around the mean.Reference Estimate
($29 billion)
12C O N G R E S S I O N A L B U D G E T O F F I C E
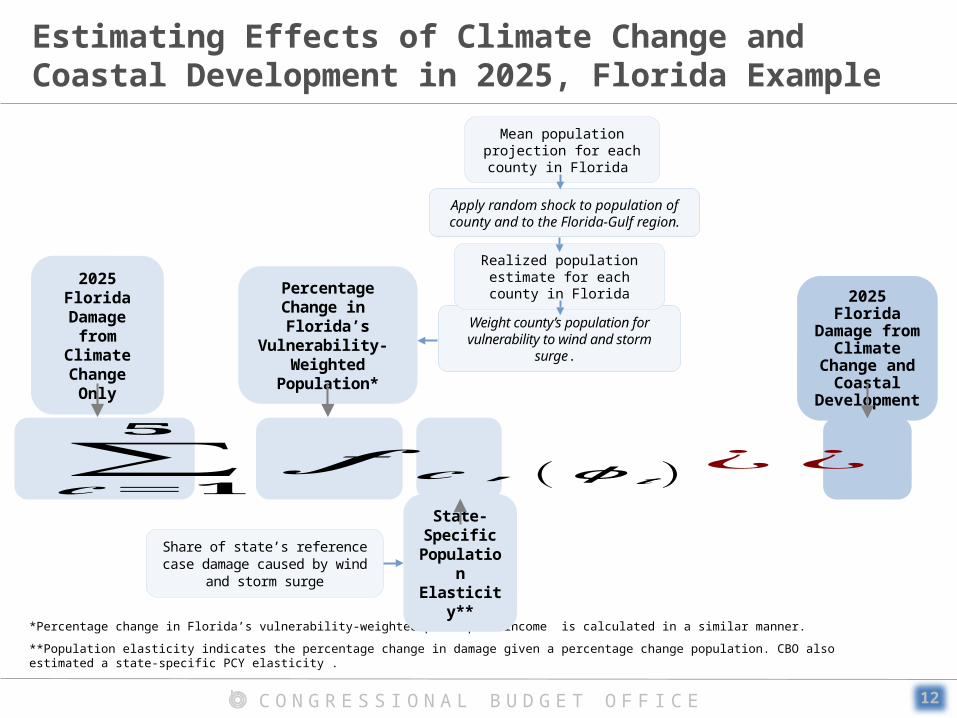
Estimating Effects of Climate Change and Coastal Development in 2025, Florida Example
*Percentage change in Florida’s vulnerability-weighted per capita income is calculated in a similar manner.
**Population elasticity indicates the percentage change in damage given a percentage change population. CBO also estimated a state-specific PCY elasticity .
2025 Florida Damage from
Climate Change and Coastal
Development
2025 FloridaDamage from
Climate Change Only
State-SpecificPopulation Elasticity**
Share of state’s reference case damage caused by wind and storm surge
Percentage Change in Florida’s Vulnerability- Weighted Population*
Mean population projection for each county in Florida
Apply random shock to population of county and to the Florida-Gulf region.
Weight county’s population for vulnerability to wind and storm surge.
Realized population estimate for each county in Florida
∑𝒄=𝟏
𝟓
𝒇 𝒄 , (ɸ 𝒕 )¿¿

13C O N G R E S S I O N A L B U D G E T O F F I C E
Applying Random Shocks to Generate County Population Estimates for Each Simulation, Florida Example
Mean Population Projection for Each County in Florida
Based on projected U.S. population growth and
county’s share of historic U.S. population growth
County-Specific Standard Error
Size-basedpercentage of
Correlation Coefficient
Correlation between county and regional
growth in the Florida-Gulf Region
County population shock based on random draw from N(0,1)
Sea-Level-Rise-Adjusted County Draw Adjustment slows population growth if
SLR significantly increases expected damage. For example, county draw is cut in half (doubled if negative) if SLR
doubles mean estimate of climate only damage in Florida.
Florida-Gulf Region Population Shock
Based on random draw from N(0,1)
Realized Population Estimate for Each County in Florida
A similar method is used to estimate each county’s per-capita income for each simulation.
𝑷𝒐𝒑 𝒚 , 𝒕+𝝈𝒚 ,𝒕𝑷𝒐𝒑∗𝝆𝑷𝒐𝒑𝑹∗𝒁𝑹 , 𝒕+𝝈𝒚 ,𝒕
𝑷𝒐𝒑 (𝟏−𝝆𝑷𝒐𝒑𝑹𝟐)𝟏/𝟐
∗ 𝑨𝒅𝒋𝑾 𝒚 ,𝒕=𝑷𝒐𝒑 𝒚 , 𝒕

14C O N G R E S S I O N A L B U D G E T O F F I C E
Weighting County Population for Vulnerability to Wind and Storm Surge Damage
Vulnerability-Weighted Population Estimates for Florida
County-Specific Wind Weight*
County’s share of increase in probability-weighted wind damage in Florida if $100 of additional property
were added to each county
(Based on maps from the National Hurricane Center, output from FEMA’s Hazus model, and RMS reference case data)
Florida’s Wind Weight*
Wind damage as a share of total hurricane damage in Florida’s
reference case estimate
Realized Population Estimate for Each County in Florida
* County-specific weights for storm surge damage () and state-specific weights for storm surge damage ( ) were also calculated.
A similar method is also used to estimate each county’s per capita income for each simulation.
∑𝒚=𝟏
𝒏
�̂�𝒐𝒑𝒚 , 𝒕∗[(𝒘𝒊𝒏𝒅𝒘𝒕¿¿ 𝒚 ∗𝒘𝒊𝒏𝒅𝒘𝒕 𝒊)+(𝒔𝒖𝒓𝒈𝒆𝒘𝒕 𝒚∗𝒔𝒖𝒓𝒈𝒆𝒘𝒕 𝒊)]=𝑾𝒕𝑷𝒐𝒑𝒊 , 𝒕 ¿

15C O N G R E S S I O N A L B U D G E T O F F I C E
Elasticity Estimates
■ Elasticity indicates a percentage change in hurricane damage for a given percentage change in population (or per capita income).
■ Only a limited number of estimates are available.– Reflect both intentional and unintentional changes in vulnerability– Vary across countries
■ The Bakkensen and Mendelsohn study is main source of U.S. elasticity estimates (results apply mainly to wind damage): – Per capita income elasticity = 1.15– Population elasticity not significantly different from zero

16C O N G R E S S I O N A L B U D G E T O F F I C E
Elasticity Estimates Used in CBO’s Analysis
■ For wind:– Per-capita income elasticity = 1– Population elasticity = 0.25
■ For storm surge:– Per capita income elasticity = 0.75– Population elasticity = 0.5

17C O N G R E S S I O N A L B U D G E T O F F I C E
Implications of Elasticity Estimates Used in CBO’s Analysis
■ Doubling of both population and per capita income (roughly a 400 percent increase in GDP) would cause damage to increase by 250 percent.
■ Damage due only to coastal development (holding climate constant) grows at roughly 60 percent of the growth rate of GDP. – Denser development can reduce:
• Wind damage per structure (if buildings are closer together)• Storm surge damage per structure (if buildings are taller)
– More expensive construction may be less vulnerable to damage.

18C O N G R E S S I O N A L B U D G E T O F F I C E
Preliminary Damage Estimates, by Dollar Amount, Under the Scenario with Climate Change and Coastal Development
0%
4%
8%
12%
16%
20%
Mean: $37 billionLikely Range*: $32–42 billion
2025
2075
* Likely range contains 66 percent of the estimates around the mean.
24 38 52 66 80 94 108 122 136 150 164 178 192 206 220 234 248 262 276 290 304 318 332 346 360 374 388 402 416 4300%
4%
8%
12%
16%
20%
Billions of 2015 Dollars
Mean: $156 billionLikely Range*: $104–226 billion
Reference Estimate($29 billion)

19C O N G R E S S I O N A L B U D G E T O F F I C E
Preliminary Damage Estimates, by Share of GDP, Under the Scenario with Climate Change and Coastal Development
-4%
0%
4%
8%
12%
16%
20%
Reference Estimate0.17%
2025
2075
Mean: 0.18%Likely Range*: 0.15%–0.20%
* Likely range contains two-thirds of the estimates around the mean.
0.06%0.08%
0.10%0.12%
0.14%0.16%
0.18%0.20%
0.22%0.24%
0.26%0.28%
0.30%0.32%
0.34%0.36%
0.38%0.40%
0.42%0.44%
0.46%0.48%
0.50%0.52%
0.54%0.56%
0.58%0.60%
0.62%0.64%
0.66%0.68%
0%
4%
8%
12%
16%
20%
Damage Measured as a Share of GDP
Mean: 0.24%Likely Range*: 0.16%–0.35%
20C O N G R E S S I O N A L B U D G E T O F F I C E
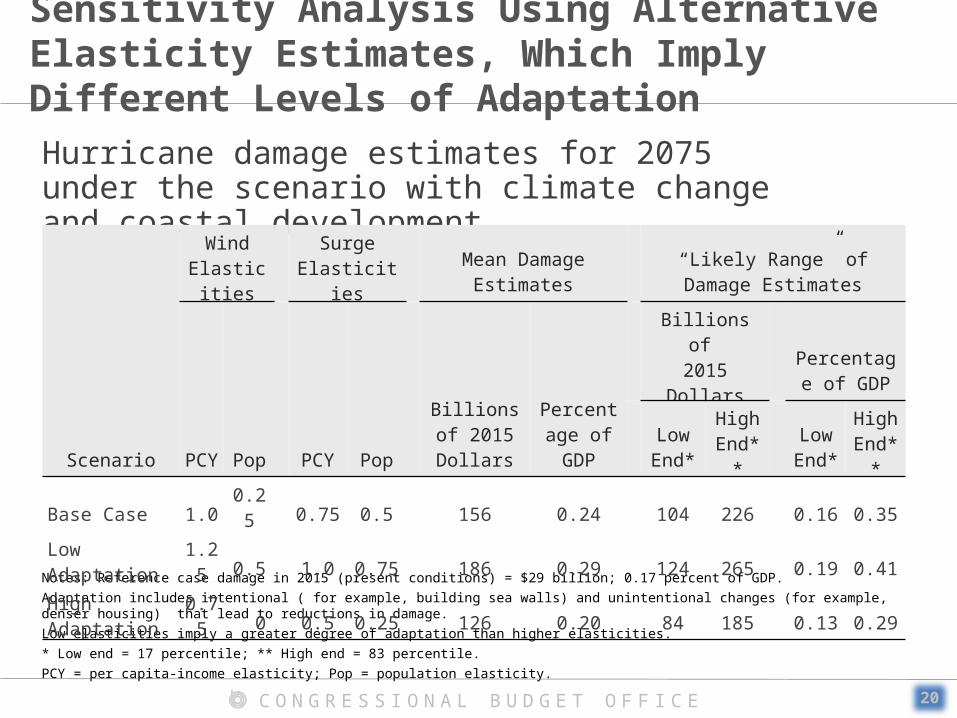
Sensitivity Analysis Using Alternative Elasticity Estimates, Which Imply Different Levels of Adaptation
Notes: Reference case damage in 2015 (present conditions) = $29 billion; 0.17 percent of GDP.Adaptation includes intentional ( for example, building sea walls) and unintentional changes (for example, denser housing) that lead to reductions in damage.Low elasticities imply a greater degree of adaptation than higher elasticities.* Low end = 17 percentile; ** High end = 83 percentile.PCY = per capita-income elasticity; Pop = population elasticity.
Hurricane damage estimates for 2075 under the scenario with climate change and coastal development
Scenario
Wind Elasticities
SurgeElasticities Mean Damage Estimates
“Likely Range” of Damage Estimates
PCY Pop PCY PopBillions of
2015 DollarsPercentage
of GDP
Billions of 2015 Dollars
Percentage of GDP
LowEnd*
HighEnd**
LowEnd*
HighEnd**
Base Case 1.0 0.25 0.75 0.5 156 0.24 104 226 0.16 0.35
Low Adaptation 1.25 0.5 1.0 0.75 186 0.29 124 265 0.19 0.41
High Adaptation 0.75 0 0.5 0.25 126 0.20 84 185 0.13 0.29

21C O N G R E S S I O N A L B U D G E T O F F I C E
Summary
■ This analysis is preliminary and results are subject to change.
■ By 2075, climate change and coastal development cause expected damage to be five times greater than today (measured in 2015 dollars).– Likely range is three times to eight times greater
■ The economy in 2075 is projected to be nearly four times larger than it is today.
■ In combination, climate change and coastal development cause damage to increase more rapidly than GDP.
■ In contrast, damage due only to coastal development grows more slowly than GDP.

22C O N G R E S S I O N A L B U D G E T O F F I C E
Summary (Continued)
■ The mean estimate of damage is:– 0.17 percent of GDP under current conditions– 0.24 percent of GDP in 2075– The increase in the mean estimate of damage as a percentage of GDP
in 2075 (relative to today) accounts for less than 0.1 percent of GDP
■ Estimates are uncertain. – Measured in 2015 dollars, the likely range in 2075 is 12 times larger
than in 2025– Measured as a share of GDP, the likely range in 2075 is 4 times larger
than in 2025

23C O N G R E S S I O N A L B U D G E T O F F I C E
Key Sources Used in This Analysis
■ Laura A. Bakkensen and Robert O. Mendelsohn, Risk and Adaptation: Evidence From Global Tropical Cyclone Damages and Fatalities, Working Paper (The University of Arizona, August 2014), www.ncsu.edu/cenrep/workshops/documents/Bakkensen.pdf.
■ Kerry A. Emmanual, “Downscaling CMIP5 Climate Models Shows Increased Tropical Cyclone Activity Over the 21st Century,” Proceedings of the National Academy of Sciences, vol. 110, no. 30 (July 2013), www.pnas.org/content/110/30/12219. Additional data was provided to CBO by the author.

24C O N G R E S S I O N A L B U D G E T O F F I C E
Key Sources Used in This Analysis (Continued)
■ Trevor Houser and others, American Climate Prospectus: Economic Risks in the United States (Rhodium Group, October 2014), Technical Appendix III: Detailed Sectoral Models, http://rhg.com/reports/climate-prospectus. Houser and others provides a description of the RMS model.
■ Thomas R. Knutson and others, “Dynamical Downscaling Projections of Twenty-First-Century Atlantic Hurricane Activity: CMIP3 and CMIP5 Model-Based Scenarios,” Journal of Climate, vol. 26, no. 17 (September 2013), http://journals.ametsoc.org/doi/abs/10.1175/JCLI-D-12-00539.1. Additional data was provided to CBO by the author.
25C O N G R E S S I O N A L B U D G E T O F F I C E
Key Sources Used in This Analysis (Continued)
■ Robert E. Kopp and others, “Probabilistic 21st and 22nd Century Sea-Level Projections at a Global Network of Tide-Gauge Sites,” Earth’s Future, vol. 2, no. 8 (August 2014), http://onlinelibrary.wiley.com/doi/10.1002/2014EF000239/full. Risk Management Solutions based its sea-level-rise projections on Kopp and others.
■ Risk Management Solutions, “Catastrophe Models,” www.rms.com/products/models-cat.