Evaluation of “Climatology of Storm Reports Relative to Upper-Level Jet Streaks” by Clark et al.
Upload
nguyendangCategory
view
218download
0
1
Delaware Coastal Storm Climatology and Damage Assessment
1871 - 2009
Final Report
Submitted to
Delaware Department of Natural Resources and Environmental Control
March 15, 2011
“This project was funded, in part, through a grant from the Delaware National Estuarine Research
Reserve with funding from the Office of Ocean and Coastal Resource Management, National Oceanic
and Atmospheric Administration under award numbers NA08NOS4200047
Co-Investigator Co-Investigator
Dr. Daniel J. Leathers Dr. Robert Scarborough
Department of Geography Delaware National Estuarine Research Reserve
213 Pearson Hall Research Coordinator
302-831-8764 302-739-3436
[email protected] [email protected]
Co-Investigator
Dr. David R. Legates
Dept. of Geography
210 Pearson Hall
302-831-4920 [email protected]

2
Project Report Summary
With more than 250 miles of shoreline, and with no point in the State more than 8 miles
from tidal waters, Delaware is a State that is significantly impacted by coastal storm events. In
the period from 1980 through 2005, the United States suffered more than 500 billion dollars in
losses from severe weather events, 40% of which were associated with coastal storms. As
Delaware’s coastal development and population continue to increase, the risk of significant
damages and loss of life along Delaware’s coastline is greatly enhanced. An excellent example
of the impact of coastal storms along the northeast coast of the United States was seen recently
with the coastal storm event of November 12 -19, 2009 with estimated damages of more than
100 million dollars from North Carolina through New England. Although Delaware has been
greatly impacted by past coastal storms, very little information has been compiled on the
frequency and characteristics of storms events and the damage caused by the storms along the
Atlantic and Delaware Bay coastlines of the State, at least in the last three decades. Technical
Report #4 of the Delaware Coastal Management Program, published in 1977, represents the last
significant study of coastal storms and associated damages across Delaware.
As part of a cooperative effort between the University of Delaware and several Delaware
State Agencies to better monitor conditions along the Delaware coastline and to provide advance
warning of impending coastal flooding events, a climatology of coastal storms and coastal storm
damage along the Delaware coast for the period 1871 through 2009 was completed. A major
thrust of this project has been to determine areas of the State most susceptible to damage from
coastal storms and the type and magnitude of damage associated with these events. Significant
coastal storms were identified using diverse meteorological data, storm reports, newspaper
accounts, and other weather related archives. Characteristics of the storms identified in this
project include storm provenance (place of origin and path), meteorological distinctives
associated with the storm (wind speed, wind direction, precipitation type and amount,
temperature, etc.), and ocean characteristics during the event (tide levels, wave heights, wave
periods, wave energies, etc.). In addition, damages associated with each storm were presented
with as fine a spatial resolution as possible (i.e. statewide, county, municipality, etc.). The
coastal storm climatology and damage estimates are visualized using Geographic Information
Science technology on an accompanying web page (www.deos.udel.edu/coastalstorm) and are
summarized in this final report.

3
1.0 Problem Statement:
Previous meteorological events have shown the Delaware coastline to be highly
vulnerable to damage from coastal storms. Population in the coastal area of the State grew by
more than 50% between 1990 and 2000, and Sussex County with coastline along the Atlantic
Ocean, Delaware Bay and the Inland Bays is the fastest growing county in the State. No detailed
compilation of the frequency of coastal storms, their meteorological and oceanic characteristics
and the damages caused by the storms has been completed in more than 30 years. As the
coastline has evolved over that time (population increases, development, infrastructure
expansion), the need to determine the areas most susceptible to coastal storm damage has
become a major concern of the State. This project represents a portion of a multi-year project
that seeks to develop a real-time coastal flood monitoring system for the State of Delaware and
to develop the capacity for greater hazard resiliency along the coast.
2.0 Coastal Storm Climatology
2.1 Data and Methods
Completion of the coastal storm climatology for Delaware depended foremost upon the
identification of coastal storms that have significantly impacted the Delaware coastline.
Delaware is affected by two general types of coastal storms; those of tropical origin (tropical
storms and hurricanes) and by coastal mid-latitude cyclones. Coastal storms of tropical origin
generally affect the Delaware coast during the period from May through December, and although
they can occur at any time, mid-latitude cyclones are most prevalent during the months from
October through May. For this climatology, two separate analyses were conducted.
One analysis considered coastal mid-latitude cyclones. All mid-latitude cyclones
affecting the Delaware coastline during the months from October through May were identified
by conducting a qualitative inspection of daily weather maps from the NOAA Central Library
U.S. Daily Weather Maps Project
(http://docs.lib.noaa.gov/rescue/dwm/data_rescue_daily_weather_maps.html). All storms
exhibiting at least one closed isobar which moved through one of two coastal “zones” (Figure
2.1a) were identified by inspection of the daily weather maps. This analysis was conducted for
the October through May storm season for the period 1945 through 2009. Thus approximately
15,800 daily weather maps were analyzed for this phase of the project. For each storm that was
identified the year, month, and day of occurrence was recorded, along with the zone of
occurrence and the central pressure of the storm. Zone 1 included the latitude/longitude box
from 70o to 80
o W and 35
o to 40
o N, while Zone 2 encompassed the area of 70
o to 80
o W and 30
o
to 35o N (Figure 2.1a).
The second analysis identified all storms of tropical origin for the May through
December season for the period 1871 through 2009. Storms of tropical origin affecting the
Delaware coast were identified using the NOAA “Historical Hurricane Tracks” GIS resource
(http://csc.noaa.gov/hurricanes/#) and “The Atlantic Hurricane Database Re-analysis Project”
(HURDAT) data set (http://www.aoml.noaa.gov/hrd/data_sub/re_anal.html). All tropical storms
and hurricanes that had a portion of their track within 200 miles of Lewes Delaware (Figure
2.1b) were identified and available data concerning the storm recorded. Data recorded included

4
the date the storm passed within 200 miles of the Delaware coastline, the storms position, central
pressure and Saffir-Simpson category.
It is important to note that the months from October through December were included in
both the mid-latitude cyclone and tropical analyses. This overlap is necessary because coastal
systems with either mid-latitude or tropical characteristics may occur during these months.
In order to identify storms of meteorological importance to Delaware, precipitation data
were obtained from the National Climatic Data Center (NCDC) U.S. High Resolution
Cooperative data set for Lewes, Milford, Newark University Farm, and Porter Reservoir stations
in Delaware (http://cdo.ncdc.noaa.gov/pls/plclimprod/poemain.accessrouter?datasetabbv=SOD ).
Tide height data were obtained for Reedy Point and Lewes Delaware from the NOAA National
Ocean Service web site (http://tidesandcurrents.noaa.gov/). To be considered a storm of
“meteorological importance” precipitation of at least 2.54 cm (1.0 inches) must have occurred at
one cooperative observing site and/or tidal flooding must have occurred at one or more of the
tidal observing stations (minor tidal flooding begins at approximately 7 feet MLLW at Reedy
Point and 6 feet MLLW at Lewes). In addition, significant storms identified in “Report #4 of the
Delaware Coastal Management Program, published in 1977”, are also included as storms of
meteorological importance.
2.2 Results of Combined Storm Climatology
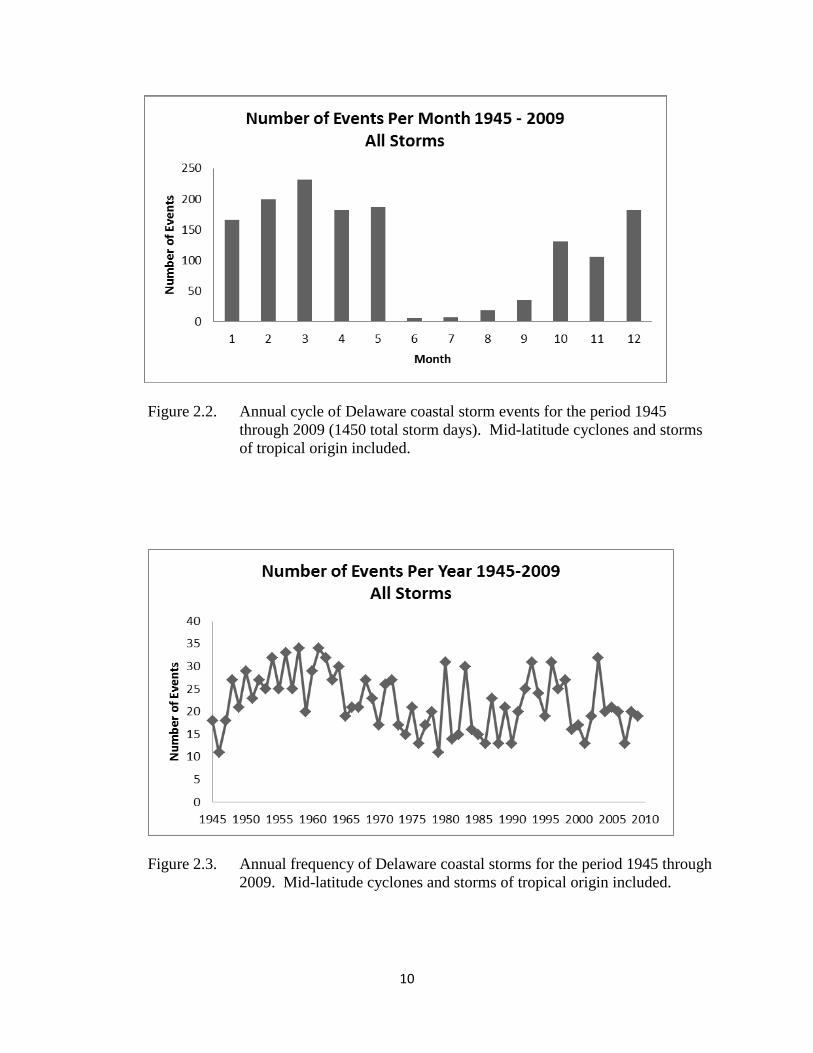
Of the 1512 storm days identified in the combined analysis (mid-latitude cyclones and
tropical storms), 1397 were classified as mid-latitude cyclones, and 115 as systems with tropical
characteristics. The overlapping period of record between the mid-latitude cyclone and tropical
storm data sets was used to determine the annual cycle of storms affecting the Delaware coast
(1945-2009). The number of coastal storms impacting the coast reaches a maximum during the
period from mid-winter though the spring, with March having the greatest activity (Figure 2.2).
The frequency of storms reach a minimum during the summer months as the majority of mid-
latitude systems move to the north of the Delaware coast. It is important to note that the storms
identified during the months of June through September are purely those with tropical origins.
Although some mid-latitude systems could occur during these months, the numbers are very
small. An ancillary analysis is ongoing to determine the exact number of mid-latitude systems
during these months.
The number of storms that have occurred annually during the period 1945 through 2009
is shown in Figure 2.3. No long-term trend is apparent in the time series. However, an
indication of decadal variability is apparent in the figure. A maximum in the annual storm
frequencies is evident in the 1950s and early 1960s. Storms were less frequent on an annual
basis during the 1970s and 1980s and in the last 20 years frequencies have been variable and
generally of intermediate values.
A spreadsheet with information on all 1512 storms is included as Appendix 1 to this
report. Storm information includes date of occurrence, zone of occurrence, central pressure,
storm name (if applicable), storm type (mid-latitude or tropical), and the precipitation amounts at
Lewes, Milford, Newark and Wilmington, DE associated with the storm.

5
2.3 Results of Tropical Systems Climatology
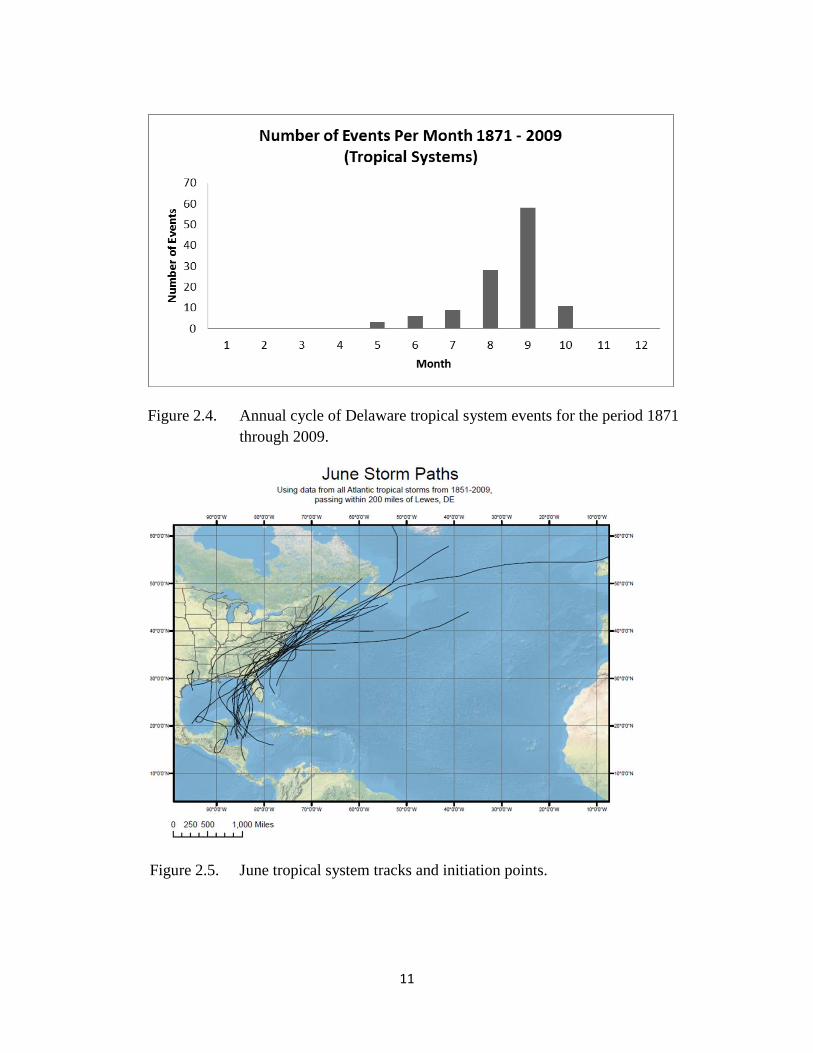
The climatology of tropical systems was investigated for the May through December
season for the period 1871 through 2009. Figure 2.4 shows the annual cycle of tropical systems
affecting the Delaware coastline. The months from August through October have the highest
frequency of storm events, with September having the most activity. This is not surprising as it
follows the seasonal cycle of tropical systems for the entire Atlantic Basin. Figures 2.5 through
2.10 show the tracks and initiation points for tropical systems that affected the Delaware
coastline for the months of June through November 1871 through 2009. In June, most systems
that affect the Delaware coastline develop in the Gulf of Mexico or in the western Caribbean Sea
(Figure 2.5). July development occurs in several areas including the Gulf of Mexico, the U.S.
Atlantic coast and even in the eastern Atlantic (Figure 2.6). During August and September, the
majority of storms that affect the Delaware coast are of the “Cape Verde” type, forming off the
African coast in the eastern Atlantic and moving under the influence of the semi-permanent
Bermuda high pressure system along the Atlantic Coast of the United States (Figures 2.7 and
2.8). By October and November, the Western Atlantic, the Caribbean Sea and the Gulf of
Mexico become the areas from which storms affecting Delaware are initiated (Figures 2.9 and
2.10).
The decadal frequency of tropical systems impacting the Delaware coastline is shown in
Figure 2.11. Once again, decadal-scale variability is evident in this figure with higher numbers
of storms in the late 1800s, the 1940s through the 1960s and again during the last decade. Less
frequent storms of tropical origin affected the region in the period from 1910 through the 1920s
and during the twenty-year period from 1970 through 1989.
A spreadsheet with information on tropical systems affecting the Delaware coastline is
included as Appendix 2a to this report. Storm information includes date of occurrence, zone of
occurrence, central pressure, storm name (if applicable), storm intensity (Saffir-Simpson Scale),
and the precipitation amounts at Lewes, Milford, Newark and Wilmington, DE associated with
the storm. Appendix 2b gives the daily weather map for each storm while within 200 miles of
Lewes Delaware from the NOAA Central Library U.S. Daily Weather Maps Project
(http://docs.lib.noaa.gov/rescue/dwm/data_rescue_daily_weather_maps.html).
2.4 Meteorologically Significant Coastal Storms
Coastal flooding and stream flooding are arguably the two most important impacts
resulting from coastal storms of all types in Delaware. In order to identify storms that had a
significant impact on the State, precipitation data were collected from four locations across
Delaware and tidal data from two “long-term” monitoring sites located along the coast (see
Section 2.1 above). In order to be considered a “significant meteorological storm”, precipitation
of at least 2.54 cm (1.0 inches) and/or tidal departures above a critical threshold (Reedy Point 7’
MLLW; Lewes 6’ MLLW) had to be observed for at least one station. The analysis identified
282 storm days that met the criteria described above for significant meteorological storms.
Figure 2.12 shows the annual cycle of significant meteorological storms. Unlike the annual
cycle of all storms, significant meteorological storms reach a maximum during both the spring
and autumn seasons with the highest number of significant events occurring during the months of
March and April, and again during September and October. This is likely due to the extreme
6
nature of mid-latitude systems that impact the Delmarva during the spring, and systems of
tropical origin that impact the coast during the autumn.
The interannual frequency of meteorologically significant storms is shown in
Figure 2.13. It is important to note that prior to 1980, the number of storms is determined in
large part by the availability of meteorological and/or tidal data available for a storm to be
classified as a significant meteorological storm. Over the last 30-year period, there is significant
interannual variability in the number of significant storms affecting the Delaware coastline. The
number of significant storms range from a maximum of 11 in 1983 to a minimum of only one
storm during several years. A spreadsheet with information on meteorologically significant
storms affecting the Delaware coastline is included as Appendix 3a to this report. Storm
information includes date of occurrence, precipitation amounts at Lewes, Milford, Newark and
Wilmington, DE, maximum tidal levels at Reedy Point and Lewes, DE, zone of occurrence,
central storm pressure, storm type and comments. This list of storms is used in the ongoing
analysis of coastal storm damage along the Delaware coastline. Maps showing the
meteorological conditions on the 282 days that the significant storms affected Delaware are
available in Appendix 3b
(http://docs.lib.noaa.gov/rescue/dwm/data_rescue_daily_weather_maps.html).
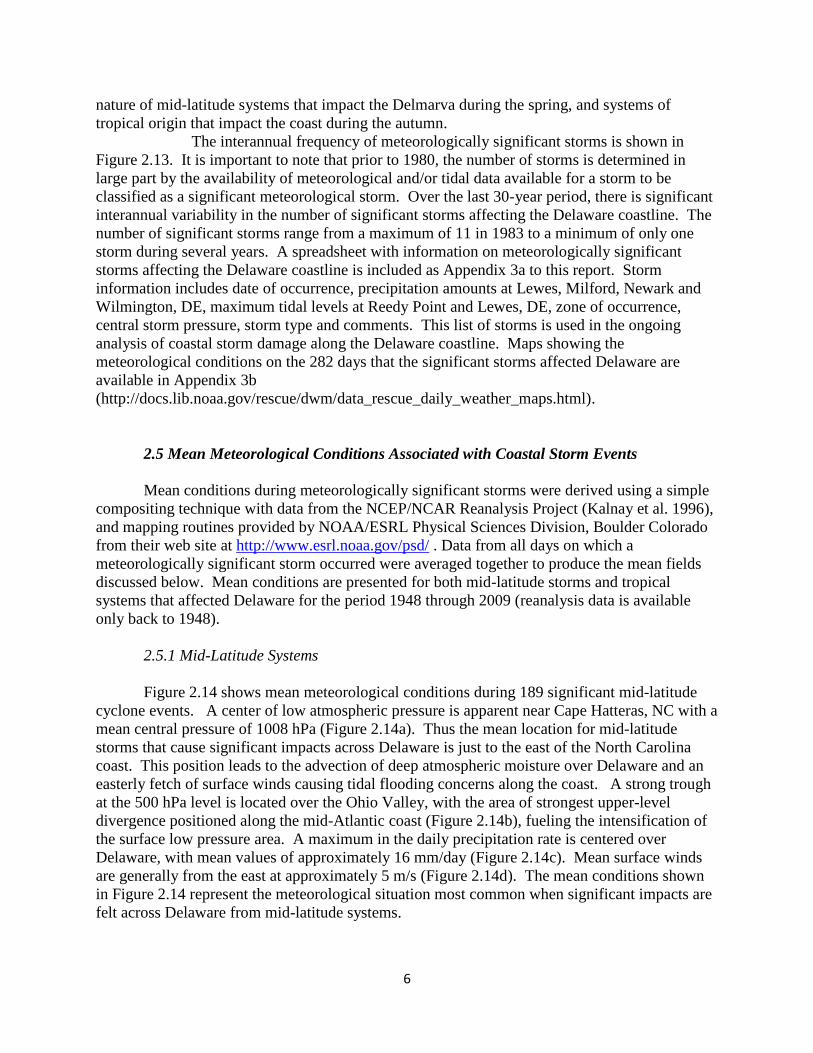
2.5 Mean Meteorological Conditions Associated with Coastal Storm Events
Mean conditions during meteorologically significant storms were derived using a simple
compositing technique with data from the NCEP/NCAR Reanalysis Project (Kalnay et al. 1996),
and mapping routines provided by NOAA/ESRL Physical Sciences Division, Boulder Colorado
from their web site at http://www.esrl.noaa.gov/psd/ . Data from all days on which a
meteorologically significant storm occurred were averaged together to produce the mean fields
discussed below. Mean conditions are presented for both mid-latitude storms and tropical
systems that affected Delaware for the period 1948 through 2009 (reanalysis data is available
only back to 1948).
2.5.1 Mid-Latitude Systems
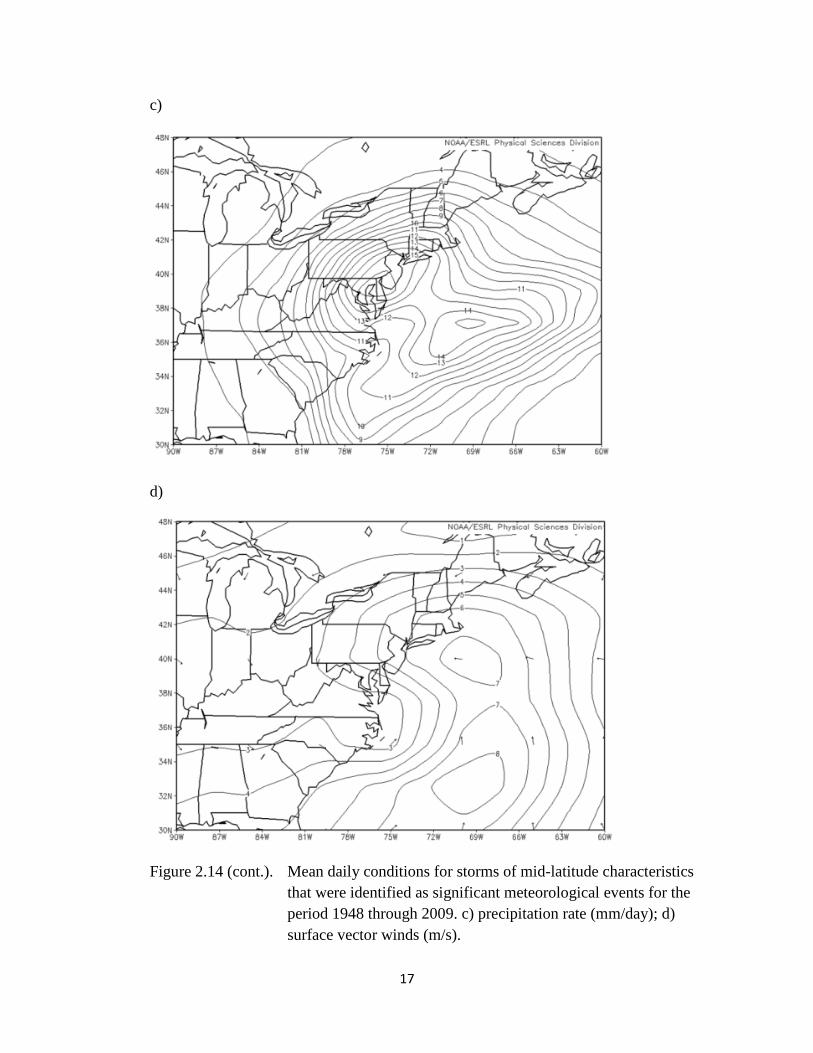
Figure 2.14 shows mean meteorological conditions during 189 significant mid-latitude
cyclone events. A center of low atmospheric pressure is apparent near Cape Hatteras, NC with a
mean central pressure of 1008 hPa (Figure 2.14a). Thus the mean location for mid-latitude
storms that cause significant impacts across Delaware is just to the east of the North Carolina
coast. This position leads to the advection of deep atmospheric moisture over Delaware and an
easterly fetch of surface winds causing tidal flooding concerns along the coast. A strong trough
at the 500 hPa level is located over the Ohio Valley, with the area of strongest upper-level
divergence positioned along the mid-Atlantic coast (Figure 2.14b), fueling the intensification of
the surface low pressure area. A maximum in the daily precipitation rate is centered over
Delaware, with mean values of approximately 16 mm/day (Figure 2.14c). Mean surface winds
are generally from the east at approximately 5 m/s (Figure 2.14d). The mean conditions shown
in Figure 2.14 represent the meteorological situation most common when significant impacts are
felt across Delaware from mid-latitude systems.
7
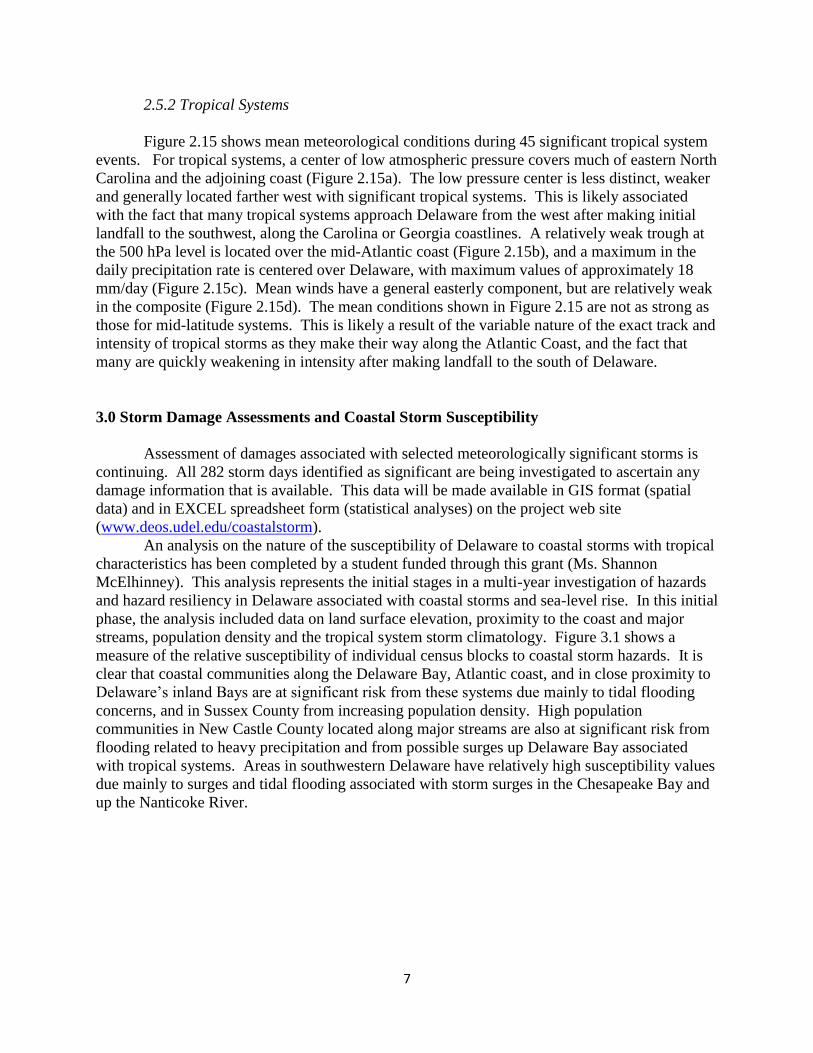
2.5.2 Tropical Systems
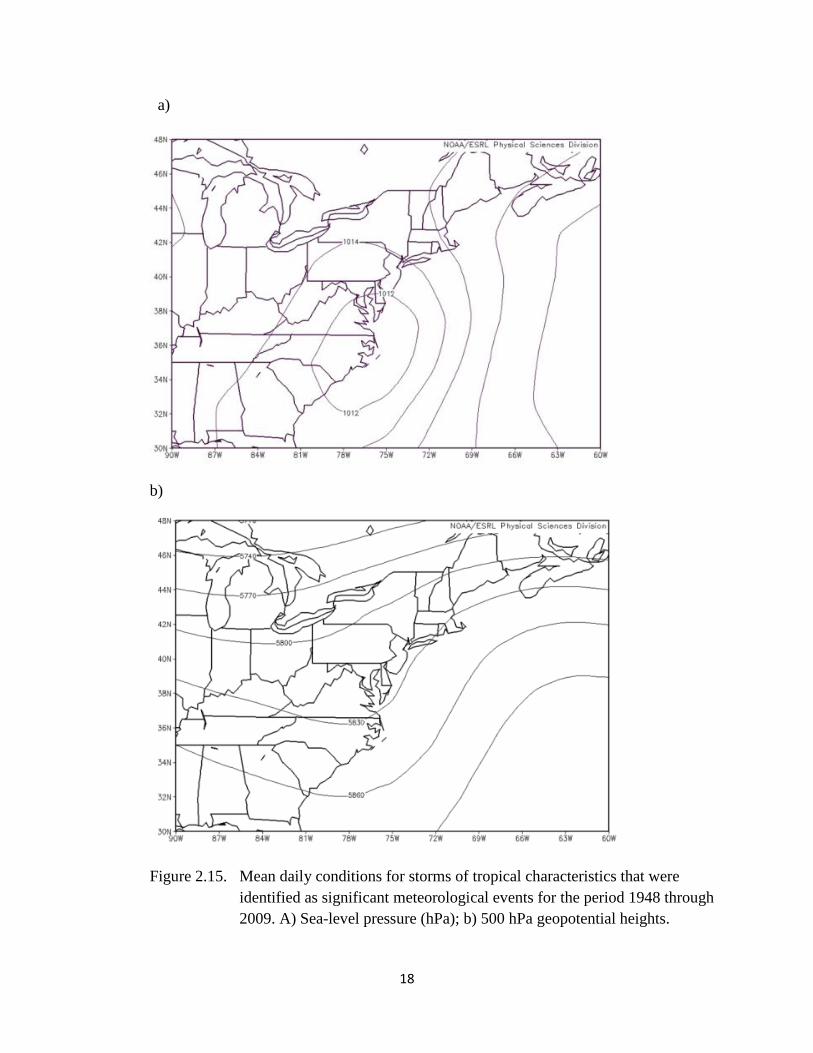
Figure 2.15 shows mean meteorological conditions during 45 significant tropical system
events. For tropical systems, a center of low atmospheric pressure covers much of eastern North
Carolina and the adjoining coast (Figure 2.15a). The low pressure center is less distinct, weaker
and generally located farther west with significant tropical systems. This is likely associated
with the fact that many tropical systems approach Delaware from the west after making initial
landfall to the southwest, along the Carolina or Georgia coastlines. A relatively weak trough at
the 500 hPa level is located over the mid-Atlantic coast (Figure 2.15b), and a maximum in the
daily precipitation rate is centered over Delaware, with maximum values of approximately 18
mm/day (Figure 2.15c). Mean winds have a general easterly component, but are relatively weak
in the composite (Figure 2.15d). The mean conditions shown in Figure 2.15 are not as strong as
those for mid-latitude systems. This is likely a result of the variable nature of the exact track and
intensity of tropical storms as they make their way along the Atlantic Coast, and the fact that
many are quickly weakening in intensity after making landfall to the south of Delaware.
3.0 Storm Damage Assessments and Coastal Storm Susceptibility
Assessment of damages associated with selected meteorologically significant storms is
continuing. All 282 storm days identified as significant are being investigated to ascertain any
damage information that is available. This data will be made available in GIS format (spatial
data) and in EXCEL spreadsheet form (statistical analyses) on the project web site
(www.deos.udel.edu/coastalstorm).
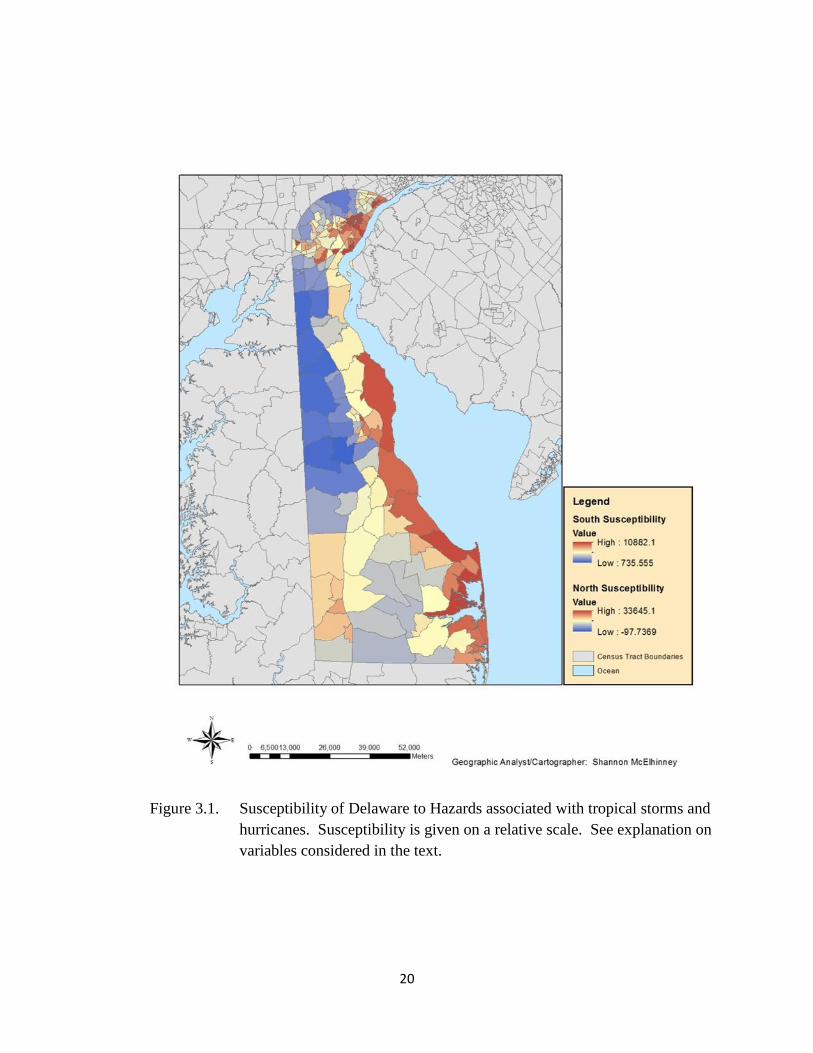
An analysis on the nature of the susceptibility of Delaware to coastal storms with tropical
characteristics has been completed by a student funded through this grant (Ms. Shannon
McElhinney). This analysis represents the initial stages in a multi-year investigation of hazards
and hazard resiliency in Delaware associated with coastal storms and sea-level rise. In this initial
phase, the analysis included data on land surface elevation, proximity to the coast and major
streams, population density and the tropical system storm climatology. Figure 3.1 shows a
measure of the relative susceptibility of individual census blocks to coastal storm hazards. It is
clear that coastal communities along the Delaware Bay, Atlantic coast, and in close proximity to
Delaware’s inland Bays are at significant risk from these systems due mainly to tidal flooding
concerns, and in Sussex County from increasing population density. High population
communities in New Castle County located along major streams are also at significant risk from
flooding related to heavy precipitation and from possible surges up Delaware Bay associated
with tropical systems. Areas in southwestern Delaware have relatively high susceptibility values
due mainly to surges and tidal flooding associated with storm surges in the Chesapeake Bay and
up the Nanticoke River.

8
4.0 Other Deliverables Generated by this Project
Other major deliverables that will result from this project include:
1) The publication of a report detailing the results of the storm climatologies, damage
assessment and hazard susceptibility estimates. This report will follow the general
format of the last major report on coastal storms in Delaware; Technical Report #4 of
the Delaware Coastal Management Program, published in 1977. The report will be
made available to the public on DNREC web sites.
2) The publication of at least two peer reviewed journal articles from this work. One
will concentrate on a climatology of tropical systems affecting Delaware. The
second will be a general climatology of coastal storms, the damages associated with
them and hazard resiliency along the Delaware coastline.
3) Construction of a public accessible web site to house data, maps, and other
deliverables from this project is well underway (www.deos.udel.edu/coastalstorm ).
Data on coastal storms will continue to be added to site into the future (as more
storms occur and as new data sources become available).
5.0 References
Delaware Coastal Management Program, 1977: Coastal Storm Damage 1923 – 1974. Technical
Report #4, Delaware Coastal Management Program, Document No. 1003-78-01-05,
Dover, DE, 441 pgs.
Kalnay, E. and Coauthors, 1996: The NCEP/NCAR Reanalysis 40-year Project. Bull. Amer.
Meteor. Soc., 77, 437-471.

9
a)
b)
Figure 2.1. a) Zones used to identify the position of mid-latitude cyclones for the
October through May season for the period 1945 through 2009. b) 200-
mile radius around Lewes, DE for inclusion of tropical storm events.
10
Figure 2.2. Annual cycle of Delaware coastal storm events for the period 1945
through 2009 (1450 total storm days). Mid-latitude cyclones and storms
of tropical origin included.
Figure 2.3. Annual frequency of Delaware coastal storms for the period 1945 through
2009. Mid-latitude cyclones and storms of tropical origin included.
11
Figure 2.4. Annual cycle of Delaware tropical system events for the period 1871
through 2009.
Figure 2.5. June tropical system tracks and initiation points.

12
Figure 2.6. July tropical system tracks and initiation points.
.
Figure 2.7. August tropical system tracks and initiation points.

13
Figure 2.8. September tropical system tracks and initiation points.
Figure 2.9. October tropical system tracks and initiation points.

14
Figure 2.10. November tropical system tracks and initiation points.
Figure 2.11. Decadal frequency of tropical systems that affected Delaware 1871
through 2009.

15
Figure 2.12. Annual cycle of “significant meteorological storms” affecting the
Delaware coastline 1893 through 2009 (precipitation data unavailable
before 1893).
Figure 2.13. Interannual variability of “significant meteorological storms” affecting the
Delaware coastline. Note that the identification of an event was
dependent upon availability of meteorological and tidal data early in
the record. Consistent meteorological and tidal data available from
1980 through 2009.

16
a)
b)
Figure 2.14. Mean daily conditions for storms of mid-latitude characteristics that were
identified as significant meteorological events for the period 1948 through
2009. a) Sea-level pressure (hPa); b) 500 hPa geopotential heights.
17
c)
d)
Figure 2.14 (cont.). Mean daily conditions for storms of mid-latitude characteristics
that were identified as significant meteorological events for the
period 1948 through 2009. c) precipitation rate (mm/day); d)
surface vector winds (m/s).
18
a)
b)
Figure 2.15. Mean daily conditions for storms of tropical characteristics that were
identified as significant meteorological events for the period 1948 through
2009. A) Sea-level pressure (hPa); b) 500 hPa geopotential heights.

19
c)
d)
Figure 2.15 (cont.). Mean daily conditions for storms of tropical characteristics that
were identified as significant meteorological events for the period
1948 through 2009. c) precipitation rate (mm/day); d) surface
vector winds (m/s).
20
Figure 3.1. Susceptibility of Delaware to Hazards associated with tropical storms and
hurricanes. Susceptibility is given on a relative scale. See explanation on
variables considered in the text.