Human Resource Practices in Multinational Companies · PDF fileii ACKNOWLEDGEMENTS This...
101
Human Resource Practices in Multinational Companies in Ireland: A Large-Scale Survey © Patrick Gunnigle, Jonathan Lavelle and Anthony McDonnell with David Collings, Michael Morley, Thomas Turner and Joseph Wallace November 2007 Employment Relations Research Unit Department of Personnel and Employment Relations University of Limerick
Transcript of Human Resource Practices in Multinational Companies · PDF fileii ACKNOWLEDGEMENTS This...

Human Resource Practices in Multinational Companies in
Ireland: A Large-Scale Survey
© Patrick Gunnigle, Jonathan Lavelle and Anthony McDonnell
with
David Collings, Michael Morley, Thomas Turner and Joseph Wallace
November 2007
Employment Relations Research UnitDepartment of Personnel and Employment Relations
University of Limerick

i
CONTENTS
Acknowledgements ...................................................................................ii
Abbreviations and conventions ................................................................iv
Executive summary ..................................................................................v
1 Objectives and methodology..............................................................1
2 Profiling multinational companies in Ireland...................................7
3 The HR function ................................................................................20
4 Pay and performance management...................................................33
5 Employee representation and consultation.......................................43
6 Employee involvement and communication .....................................56
7 Training, development and organisational learning ........................66
8 Conclusions ........................................................................................80
References .................................................................................................85

ii
ACKNOWLEDGEMENTS
This extensive survey of human resource management practices (HRM) in multinational companies (MNCs) in Ireland would not have been possible without the cooperation of a large number of people and institutions.
First and foremost, we acknowledge the senior HR executives in almost 300 companies (including the pilot surveys) and thank them all for their time and insights on HR and general management practice in their respective organisations.
Possibly the greatest initial challenge in this project was to develop an accurate population list of MNCs in Ireland. A significant shortcoming in previous research stemmed from a lack of representativeness in the MNC populations utilised. This was largely due to the omission of certain categories, such as non-grant aided foreign MNCs or Irish-owned MNCs. Some two years ago we embarked on the painstaking process of reviewing and building our MNC population list using diverse sources. A strong base was provided by the industrial promotions agencies. We specifically wish to acknowledge the help of Marcus Breathnach, Michael Fitzgibbon and Debbie Quinn of Forfás, Jim Barry and Enda McDonnell of Enterprise Ireland, and Noirin Lynch, Siobhan Kelleher and Michelle O’Neill of IDA Ireland. We also wish to thank Bill Moss of Bill Moss Partnership Limited for his help in sourcing the best available external company databases. Other individuals and institutions provided additional intelligence and input on our MNC population listing. John Cullen and John Mangan of the Irish Management Institute provided particularly useful advice and direction, as did Eoin O’Malley of the Economic and Social Research Institute (ESRI). The help and advice of Aoife Geraghty of the Library & Information Services, University of Limerick in securing access to the various external databases is also acknowledged.
To help complete the fieldwork phase of this study, we engaged the ESRI. We are particularly indebted to Dr. Dorothy Watson, Head of the ESRI Survey Unit, for her immense expertise, assistance and hard work throughout the fieldwork phase. We also acknowledge the input of various members of the ESRI team, notably Sylvia Blackwell, Shirley Gorby and Carley Cheevers.
A research project of this scale requires adequate finance. We thank the University of Limerick Research Office, particularly Prof. Vincent Cunnane, Vice President (Research) and Eileen O’Connor, for providing initial funding. The Labour Relations Commission, through their Research and Advisory Service, provided additional financial assistance. This was critically important in bringing the project to fruition and we particularly wish to thank Kieran Mulvey (Chief Executive), Declan Morrin and Larry O’Grady for their support and also fortheir observations and constructive comments as the project progressed.
We are indebted also to the Chartered Institute of Personnel and Development (CIPD) in Ireland for their assistance. We particularly acknowledge the input of Michael McDonnell, Wendy Sullivan, Brid O’Brien and Don Hegarty in promoting the relevance of this study to the HR community in Ireland and for highlighting the importance of academic inquiry of this nature.

iii
Last, but certainly not least, we wish to thank our international partners. This study was conducted in parallel with similar surveys in Canada, Mexico, Spain and the UK, while plans are afoot for surveys in Australia and Singapore. We particularly wish to thank the UK team for inviting us to participate in this study. Both the UK and Canadian teams provided invaluable assistance on instrument design. Subsequent meetings and exchanges with our international partners have proved both stimulating and constructive. At extreme risk of leaving somebody out, we therefore wish to thank the following:
• Australia: John Burgess (University of Newcastle) • Canada: Gregor Murray, Pierre-Antoine Harvey, Patrice Jalette (University of
Montreal), Jacques Bélanger (University of Laval), Christian Lévesque (HEC Montréal)
• Mexico: Jorge Carrillo (El Colegio de la Frontera Norte, Tijuana)• Singapore: Peter Waring (University of New South Wales – Asia) • Spain: Javier Quintanilla, Lourdes Susaeta (IESE, University of Navarra)• UK: Paul Edwards, Paul Marginson, Duncan Adam (Warwick University), Anthony
Ferner, Olga Tregaskis (De Montfort University), Tony Edwards (King’s College, London).

iv
ABBREVIATIONS AND CONVENTIONS
CIPD = Chartered Institute of Personnel & Development
CUL = Cranfield-University of Limerick
Double counting = where the same MNC is listed twice or more, often under differing registered or trade names.
EPOC = Employee Direct Participation in Organisational Change Study
ESRI = Economic and Social Research Institute
EU = European Union
EWC = European Works Council
FD = Forced Distribution (in performance appraisal rankings)
FDI = Foreign Direct Investment
HPWS = High Performance Work Systems
HR = Human Resource
HRIS = Human Resource Information System
HRM = Human Resource Management
I&C = Information and Consultation
IBEC = Irish Business and Employers Confederation
IDA = Industrial Development Agency
IFSC = International Financial Services Centre
Irish operations = All the operations (subsidiary companies, business divisions, etc.) of an MNC within the Republic of Ireland
IT = Information Technology
KG = Key Group
LOG = Largest Occupational Group
MNC = Multinational Company
OECD = Organisation for Economic Trade and Development
PCN = Parent Country National
PRP = Performance Related Pay
R&D = Research and Development
T&D = Training and Development
TCN = Third Country Nationals
UK = United Kingdom
UNCTAD = United Nations Commission for Trade and Development
US = United States of America

v
EXECUTIVE SUMMARY
Chapter 1 Objectives & Methodology
1. As one of the most MNC dependent economies in the world, Ireland represents an excellent locale for studying MNCs.
2. This is the first representative study to be conducted on the human resource (HR) practices of multinational companies (MNCs) in Ireland. Both foreign-owned and Irish-owned MNCs are covered.
3. The analysis is based on 262 (216 foreign-owned and 46 Irish-owned) face-to-face interviews with the most senior HR person responsible for HR in the Irish operations. This equates to an overall response rate of 63 per cent, a 61 per cent response in foreign-owned MNCs and 78 per cent in Irish-owned MNCs.
4. The survey explores five substantive areas:a. The HR functionb. Pay and performance managementc. Employee representation and consultationd. Employee involvement and communicatione. Training, development and organisational learning
5. In asking about policy and practice in these areas, the survey looks at three categories of staff. These are ‘managers’, the ‘largest occupational group’ (LOG), and the ‘key group’.
Chapter 2Profiling Multinational Companies in Ireland
1. Foreign-owned MNCs in Ireland primarily come from the US, UK or mainland Europe.
2. Only a small proportion of MNCs in Ireland originate in Asia or other countries outside of Europe and the US.
3. There are however a substantial number of indigenous MNCs. 4. The majority of MNCs in Ireland are now located in the service sector. The remainder
are mostly involved in manufacturing. However, a number of MNCs engage in both service and manufacturing operations and can therefore be classified as ‘multi-sector’.
5. Firms vary greatly in terms of their Irish and worldwide employment where indigenous MNCs tend to be the largest domestic employers whilst foreign firms have the largest worldwide employment.
6. Foreign-owned MNCs tend to be relatively new to the country with two thirds having established since 1980.
7. Among foreign-owned MNCs, opening a ‘greenfield site’ facility is the predominant form of entry into Ireland.
8. Irish-owned MNCs are late internationalisers, with seven in ten having established foreign operations since 1980. Just over half internationalised through the establishment of ‘greenfield’ sites rather than through merger/acquisition.
9. Irish MNCs have expanded internationally quickly. Over eight in ten have operations in more than two countries.
10. The great majority of MNCs have two or more sites in Ireland.11. Respondents predominantly believe the Irish operations are of great importance to the
overall performance of the parent company. Furthermore the majority of MNCs also report that the importance of the Irish operations has increased over the past five years.
12. An overwhelming majority of respondents are extremely satisfied with various measures of the Irish labour force, such as quality of graduates, and the workforce’s

vi
ability to learn new skills. However, one noticeable concern was in relation to the availability of university graduates.
13. Perhaps not surprisingly, cost concerns are clearly the most important area of disquiet among MNCs. General operating costs and labour costs are the most important influencing factors in whether the Irish operations receive new investment or new mandates from the parent company.
14. Seven in every ten MNCs indicate that male employees make up in excess of half of the workforce.
15. The use of ‘atypical’ forms of employment (i.e. part-time and temporary workers) is relatively low.
16. Just over half of the MNCs recognise a ‘key group’ of employees which range from analysts to chemists to research and development (R&D) staff.
Chapter 3 The HR Function
1. Some 54 per cent of all MNCs in Ireland have a HR information system (HRIS). 2. 39 per cent of firms reported usage of shared services centres. Of significance and
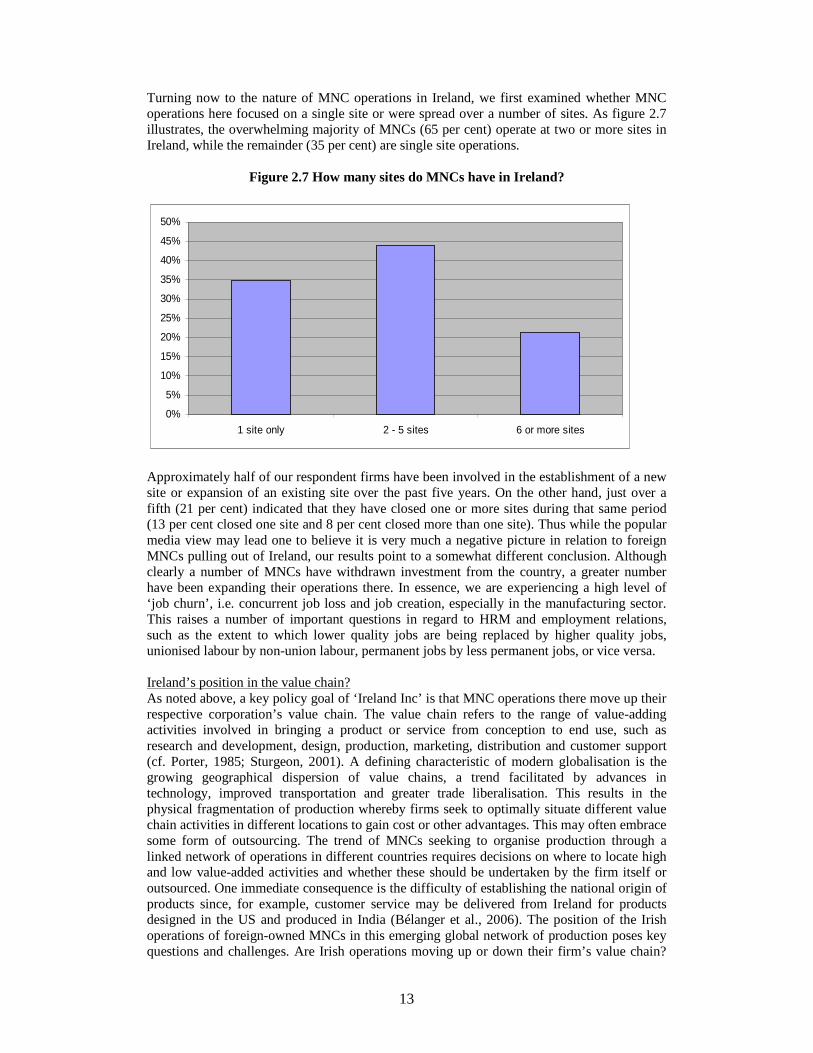
somewhat surprising is that the level of utilisation of shared services centres is higher amongst Irish MNCs than foreign MNCs.
3. UK and US owned MNCs are also much more likely to have a shared services centre than MNCs from the rest of Europe or the rest of world.
4. There may also be an interesting sectoral effect between foreign and Irish MNCs. Two thirds of foreign MNCs engaged in multiple sectors have a shared services centre whereas the corresponding figure for Irish MNCs is just 17 per cent.
5. The use of HR policy formation bodies/committees was quite widespread (59 per cent) amongst MNCs, slightly higher than the figure found in the UK (53 per cent). The prevalence of these bodies was higher in foreign-owned than among indigenous MNCs.
6. Nationality was once more found to be a source of variation between firms with US owned firms most likely to have such a body/committee.
7. Companies engaged in multiple sectors were much more likely also to have such a committee, with 93 per cent of all foreign-owned MNCs having one. On the indigenous owned side, manufacturing MNCs most commonly had a HR policy formation body (73 per cent).
8. In terms of networking between HR managers in different countries, MNCs are broadly speaking, using a number of different mechanisms. Clearly the most popular mechanism is regular face-to-face meetings (78 per cent), followed by virtual networks (74 per cent). The figures differ slightly amongst foreign and Irish-owned companies, with foreign MNCs more likely to engage with these methods.
9. The findings indicate a high level of monitoring by senior international level management among both foreign-owned and Irish-owned firms.
10. The most monitored areas were employment numbers, labour costs, and issues relating to managerial grades (pay and career progression).
11. The level on monitoring was lowest in relation to absenteeism and workforce diversity.
Chapter 4Pay and Performance Management
1. The vast majority of MNCs aim to have pay levels at or above the median/midpoint for all employees. Multinationals in the service sector consistently aim to be in the 1st or 2nd pay quartile compared to MNCs in the manufacturing or multi-sector.
2. The vast majority of MNCs report the utilisation of performance appraisal schemes.

vii
3. Foreign-owned MNCs are more likely to use performance appraisals than Irish-owned MNCs.
4. The use of ‘forced distribution’ and peer/360 degree feedback are more common in foreign-owned MNCs.
5. Variable or performance related pay (PRP) is extensively used for all employees, particularly for the ‘key group’ and managers.
6. US MNCs are marginally more likely to use PRP systems.7. Employee share ownership, profit sharing and share options are used by
approximately one third of MNCs for each category of employees. 8. Foreign MNCs tend to have considerable discretion in the area of pay policy, variable
pay and performance appraisal. 9. Irish-owned MNCs afford significantly lower levels of discretion in all reward and
appraisal areas. 10. MNCs located in the manufacturing sector report greater discretion in the allocation
of rewards to all employees.
Chapter 5Employee Representation and Consultation
1. 61 per cent of all MNCs engage with trade unions with union recognition highest among manufacturing sector and lowest among US MNCs.
2. Whilst reporting high level of union recognition in Ireland, Irish-owned MNCs report lower levels of union recognition abroad.
3. We find the existence of non-union structures in 32 per cent of all MNCs with a significant growth in these types of structures over the past three years.
4. We point to the emergence of a trend of unionised MNCs not recognising unions in their new sites, a phenomenon referred to as ‘double-breasting’. Almost 6 in 10 MNCs are engaging in some form of double-breasting, with it particularly prominent among US MNCs.
5. There is high collective bargaining coverage amongst the largest occupational group (LOG) with a strong sectoral effect where 79 per cent of MNCs have coverage greater than 75 per cent.
6. National collective bargaining is the preferred method of pay determination for this particular group of employees with individual measures the most common method of pay determination amongst managers.
7. Unionised MNCs are much more likely to follow the terms of national level agreements. Where national level agreements have an influence on non-union MNCs, they are much more likely to report to paying above the terms of these national agreements.
8. There is evidence of high levels of information and consultation provided with a significant minority reporting that the Information and Consultation Directive had initiated changes in employee consultation.
9. There are high levels of discretion afforded to subsidiaries of foreign MNCs over trade union recognition, union involvement in decision-making and employee consultation.
10. In contrast low levels of discretion are afforded by Irish MNCs to its foreign subsidiaries.
Chapter 6Employee Involvement and Communication
1. There is a comparatively high usage of individual communication mechanisms. 2. Problem solving groups are present in nearly three-quarters of companies and these
were the most common form of direct involvement.

viii
3. 55 per cent of companies had formally designed teams – this is much lower than the 73 per cent figure found in the equivalent UK survey.
4. Despite impressions to the contrary formally designed teams were not more likely to be present in US companies.
5. Variation by country of origin was substantial with 84 per cent of American MNCs having problem-solving groups.
6. Eighty-five per cent of manufacturing companies had problem-solving groups as against 66 per cent in the service sector. In contrast 56 per cent of service organisations had formal teams as against 51 per cent in manufacturing.
7. The main communication mechanisms are the traditional ones of meetings between line managers and employees, meetings with the whole workforce and systematic use of the management chain. These mechanisms are also considered the most important.
8. There is also significant growth of newer forms of communication via emails, newsletters and use of a company Intranet.
9. There is a much lower usage of attitude and opinion surveys and only three respondents – one per cent of the total - considered these the most important communication mechanism.
10. Seventy three per cent of companies provided information on the financial position of the company in Ireland and sixty-two per cent on investment in Ireland and fifty-nine per cent on staffing plans in Ireland.
11. American companies were to the fore in financial and investment information provision.
12. Irish MNCs reported higher provision of information on staffing plans in Ireland compared to foreign-owned MNCs.
13. MNCs generally appear to have a high degree of discretion over most forms of direct communication mechanisms, with the exception of attitude and opinion surveys.
Chapter 7Training, Development and Organisational Learning
1. A majority of respondents indicate that the training and development expenditure of the Irish operations congregates in the “greater than 1 per cent but less than 4 per cent of the annual pay bill” category.
2. The biggest ‘spenders’ (i.e. those spending in excess of 4 per cent) are US owned MNCs followed by UK and European MNCs.
3. Almost two thirds of firms have a succession planning system, with the overwhelming majority of these being global in orientation.
4. Relatively few differences were found according to nationality of the MNC or industrial sector. However multi-sector MNCs are the most likely to have a global system.
5. In terms of country of origin, US-owned MNCs are most commonly found to have a global succession planning system.
6. Just over half of multinationals have a formal management development programme. Again, these programmes tend to be global in reach rather than local programmes.
7. US-owned firms were found to be the most likely to use all of the management development interventions explored.
8. Some 57 per cent of firms that identified a ‘key group’ report they have a specific development programme for these employees.
9. While less than half of multinationals have a formal organisational learning policy in their Irish operations, a much larger percentage indicated the use of a number of mechanisms for organisational learning purposes.
10. The most popular mechanisms used are international informal networks and international project groups.
11. Foreign-owned MNCs (54 per cent) were substantially more likely to have a formal organisation learning policy compared to indigenous Irish MNCs (29 per cent).

ix
12. Parent country nationals no longer dominate the expatriate population. A substantial number of firms indicated the use of third country nationals in addition to parent country nationals.
13. The findings indicate a variance between the levels of discretion afforded to local management across various T&D policy areas. However on a whole there are relatively high levels of autonomy afforded to local management.
14. Not surprisingly US-owned MNCs are least likely to report full discretion across all of the policy areas examined.
Chapter 8Conclusions
1. The MNC population in Ireland is composed of a diverse mix of companies, particularly in regard to factors such as size and sector.
2. The majority of MNCs in Ireland are now located in the service sector, though manufacturing remains an important area of MNC activity.
3. Irish-owned MNCs comprise in excess of 10 per cent of the total MNC population.4. It appears that we are experiencing a high level of ‘job churn’ in MNCs i.e.
concurrent job loss and job creation, particularly in the manufacturing sector.5. Respondents in foreign-owned MNCs were broadly optimistic about the position of
the Irish operations within their respective corporation’s value chain.6. Most expressed satisfaction in regard to various aspects of the Irish labour force,
including the quality of graduate supply and workforce capacity to learn new skills. 7. However, a substantial proportion was also concerned about the decline in the
competitive standing of the Irish economy.8. Particular anxiety was expressed with regard to increased operating costs (including
labour costs).9. Concern over future labour supply was an important source of unease among MNCs.10. Over half the MNC population surveyed reported the presence of ‘key group’.11. Country of origin remains a demonstrably influential factor in explaining divergence
in HR practice. Significant differences were found between US, UK, European, Rest of World and Irish MNCs in relation to many of the different facets of HR explored.
12. A number of notable differences were also found according to the industrial sector.

1
CHAPTER 1
OBJECTIVES AND METHODOLOGY
IntroductionWithout doubt, a large measure of Ireland’s economic progress stems from its success in attracting inward foreign direct investment (FDI) by foreign-owned multinational companies (MNCs). Indeed, many other countries have examined the ‘Irish story’ to establish if they can replicate its recent ascent to prosperity. Not surprisingly, Ireland is one of the world’s most FDI-dependent economies, the result of a consistent policy stance of wooing inward FDI via a package of incentives, the most significant of which has been a comparatively low level of corporation tax (cf. Gunnigle and McGuire, 2001; Barry, 2002; Gunnigle et al., 2005). Notwithstanding this, the success of outward FDI in more recent times has been phenomenal if not widely known. Indeed Irish MNCs are growing at an extraordinary rate.
This chapter will briefly summarise the importance of inward and outward FDI in the Irish economy and thereby provide a rationale for the study of MNCs in Ireland. The study’s objectives will then be detailed. Following this, the research methodology employed is set out before finally outlining the structure of the report.
Inward FDI: The end of the millennium saw the height of the FDI boom when total global FDI inflows reached an all time high of $1.4 trillion (UNCTAD, 2006). By 2003 this figure had fallen to $537 billion, while the most recent figures (2005) indicate a substantial recovery to $916 billion. Ireland has been one of the major beneficiaries of the global FDI boom. It was the largest net recipient of FDI in the OECD in the period 1993-2003, recording a cumulative balance of inflows over outflows of $71billion and making it the world's 11th largest recipient of inward FDI1. These figures represent an extraordinary performance, given that Ireland accounts for a small fraction of the European Union (EU) population. Table 1.1, detailing FDI inflows into selected countries over the period 1997 – 2005, shows the staggering growth in FDI inflows achieved by Ireland in this relatively short time period.
Table 1.1 FDI inflows 1997-2005 ($million)2
Adapted from OECD (2006). p: projected; e: estimate.
In spite of 9/11, the dot.com downturn and more recently the pattern of MNCs closing operations in Ireland, manufacturing investment in Ireland in 2004 amounted to some $10.4 billion (3rd in the world after the UK and Canada) while total US FDI in Ireland amounted to $73billion – a figure several times larger than that for China (UNCTAD, 2004). Indeed MNCs currently account for almost 50 per cent of manufacturing employment in Ireland (Buckley and Ruane, 2006). The most recent data on employment in foreign-owned MNCs from the state development agencies show that there are 982 foreign firms in Ireland employing in
1 Figures compiled from OECD International Direct Investment Statistics, http://www.oecd.org.2 Where a negative figure is shown this reflects subsidiaries repaying loans to the parent company.
1997 1998 1999 2000 2001 2002 2003 2004P 2005EIreland 2,709.6 8.856.3 18,211.2 25,784.2 9,652.7 29,350 22,802.8 11,165.4 -22,759.1
Germany 12,243.4 24,596.7 56,077.3 198,313 26,419 53,570.8 29,228.2 -15,122.9 32,642.9
Czech Republic
1,301.1 3,716.4 6.326.2 4,980.2 5,644.6 8,483.5 2,108.7 4,975 10,987.5
UK 33,244.9 74,348.9 87,972.8 118.823.8 52,650.2 24,051.9 16,845.9 56, 253.2 164,499.2
US 105,603 179,045 289,444 321,274 167,021 80,841 67,091 133,162 109,754
Poland 4,908.2 6,365 7,270 9,343 5,714 4,131 4,870 12,355 7,724
Sweden 10,967.4 19,842.7 60,929.1 23,245.5 11,900.1 11,734.1 1,285.3 -1,852.2 13,691.5

2
excess of 134,000 people (IDA Ireland, 2007). Arguably, this figure is under-estimated due to the exclusion of non-grant aided or assisted MNCs (McDonnell et al., 2007).
Acknowledging that Ireland’s success in attracting new FDI was likely to recede in the face of more intense international competition for FDI (especially from Asia and the new EU accession states) and increased operating costs, the industrial promotions agencies pursued two notable changes in strategy (cf. Gunnigle et al., 2003):
1. Shifting the emphasis away from attracting new greenfield start-ups towards the retention of existing MNC facilities through facilitating the Irish subsidiary’s move up their corporation’s ‘value chain’ by securing the production of higher margin products or services and developing greater product development and research capacities in the Irish sites.
2. Placing a greater emphasis on regional balance in the geographic distribution of FDI (essentially encouraging FDI projects to locate outside of Dublin and major industrial centres into more economically disadvantaged regions).
The success of this policy is, of yet, uncertain. However, there have been some positive indications, with a number of high quality jobs announced in both new start-ups and expansions of existing firms in recent years. There have also been some notable closure and retrenchment decisions, particularly and predictably in the high-volume manufacturing sector. The fact that in more recent times the service sector has overtaken manufacturing as the major source of employment is another indicator of the change in the foreign direct investment landscape in Ireland. The service sector now accounts for almost 66 per cent of total employment there (Eurostat, 2004). Of particular importance has been the role of the International Financial Services Centre (IFSC) which, in 2004, accounted for the majority of FDI into Ireland at €4.4 billion, compared to €1.5 billion for non-IFSC FDI (Forfás, 2006).
Somewhat paradoxically considering it represents one of the primary growth engines of the service sector, the retail sector has been under represented in extant research on MNCs in Ireland (see McDonnell et al., 2007). The most recent census data show one in seven people now work in retail and wholesale outlets, making the sector the country’s biggest employer (Kelly, 2007). Of the 1,930,042 employed people, a total of 13.3 per cent work in the retail sector compared with 12.6 per cent in manufacturing and 11.1 per cent in construction (Kelly, 2007). The arrival of retailers from the UK and further a field has played a major role in this growth and it is expected that more new entrants will establish in Ireland (Feeney, 2007). It is now a rare occurrence for a medium sized Irish town not to have a retail park consisting of at least one multinational retail chain, for example, Tesco, Penney’s, and B&Q.
Outward FDI: An even less heralded but especially significant development is the surge in outward FDI and the significance of the ‘Irish MNC’. Remarkably, over recent years, the scale of inward FDI is now more than rivalled by outward FDI by Irish-owned firms. In 2005, FDI outflows stood at $12,931 million, a significant increase from the 1997 level of $1,014 million (UNCTAD, 2006). Ireland now has a larger stock of outward FDI as a percentage of gross domestic product (GDP) than most EU countries, and substantially higher than the EU average (Forfás, 2007). Furthermore, outflows have grown more sharply than inflows in recent times, reflecting the increasing numbers and scale of Irish-owned MNCs (Barry et al., 2003; Everett, 2006). Interestingly cluster analysis of the most recent FDI figures for OECD countries places Ireland in the group of countries with the second largest level of FDI outflows, along with countries such as Japan, Germany, Canada and Sweden (UNCTAD, 2006).

3
Table 1.2 FDI Outflows 1997-2005 ($million)3
1997 1998 1999 2000 2001 2002 2003 2004P 2005EIreland 1,013.7 3,902.1 6,109.1 4,629.6 4,066.1 11,035.2 5,554.7 15,813.1 12,930.6
Germany 41,794.1 88,837.2 108,691.6 56,567.5 39,691.1 18,963.5 6, 179.5 1,884 45,606.1Czech
Republic25.2 127.1 89.8 42.8 165.4 206.5 206.7 1,014.4 855.8
UK 61,620 122,861.2 201,436.7 233,487.7 58,885.2 50,346.5 62,493.3 94,928.5 101,079.8
US 104,803 142,644 224,934 159,212 142,349 154,460 140,579 244,128 9,072Poland 45 316 31 16 -90 230 300 778.0 1,455
Sweden 12,647.5 24,379.4 21,928.6 40,667.3 6,374.9 10,630 21,259.8 11,947.2 26,028.8
Adapted from OECD (2006). p: projected; e: estimate
Table 1.2 reveals some interesting findings, not least the variable nature of outflows. However the most significant aspect is the substantial increase in outward direct investment from Ireland over the past decade. While some volatility of FDI flows exists, the indications are that FDI outflows will continue to increase and indeed “Ireland may be adopting the profile of a more typical developed economy in that it is becoming more important as a source rather than a destination of FDI” (Forfás, 2006: 39).
In summary, foreign direct investment has played a significant role in the turnaround of the Irish economy from the bleak economic and industrial climate in place for much of the twentieth century to the prosperity experienced in more recent times. While foreign-owned MNCs have made a substantial contribution, indigenous owned MNCs have also played a significant role in this success. As such, a study which provides a representative depiction, for the first time, of human resource management practices in MNCs in Ireland, foreign-owned and Irish-owned, is both welcome and timely.
Aims and objectivesThis survey of human resource (HR) practices in multinational companies operating in Ireland provides the first comprehensive portrait of HR policy and practice amongst multinational companies operating in Ireland. More specifically, the study aims:
• To carry out an innovative and comprehensive survey of employment practice in organisational context based on a representative sample of MNCs in Ireland, and thereby provide a template for future surveys of trends in Ireland and for similar surveys in other countries.
• To analyse employment practice across some of the main substantive HR areas in relation to three distinct groups of staff, and to relate variations in practice to organisational structure and strategy.
• To provide an accurate picture of the organisation and management practice in MNCs.
• To contribute to policy debates on the extent to which MNCs are pursuing common agendas and are able to impose these agendas on the countries in which they operate, as well as the debate on whether MNCs are able to identify and diffuse ‘best practice’ across their operations.
The study’s primary objective is to map the HR practices of multinationals and to relate these to such organisational factors as nationality of ownership and sector of operation. The survey focuses on five key HR areas, namely the HR function, pay and performance management, employee representation and consultation, employee communication and involvement, and training, development and organisational learning.
3 Where a negative figure is shown this reflects subsidiaries repaying loans to the parent company.
4
In addressing these five areas, the study is structured around three groups of employees. The first group is ‘managers’, defined for the purpose of this study as, “employees who primarily manage the organisation, or a department, subdivision, function, or component of the organisation and whose main tasks consist of the direction and coordination of the functioning of the organisation. In other words managers are those above the level of first-line supervision”. The second group examined is the ‘largest occupational group’ (LOG) defined as, “the largest non-managerial occupational group among the employees in the ‘headcount’ in Ireland”. The final group, and a major innovation in this study, are the ‘key group’ defined as, “those employees whom you might identify as critical to your firm’s organisational learning and core competence. These might be research staff, product designers, major account handlers, developers of new markets, etc”.
This study forms part of a larger international project involving research teams from Australia, Canada, Mexico, Singapore, Spain and the UK. Our research partners include key figures from a number of highly regarded and prestigious universities internationally.
Research methodologyRecent years have witnessed a marked interest in research on the activities of MNCs in Ireland and whilst there have been many interesting and informative studies (cf. Kelly and Brannick, 1985; Gunnigle et al., 1994; Turner et al., 1997a&b; Geary and Roche, 2001; Collings, 2003; Gunnigle et al., 2005), their representativeness is open to question. In particular these studies tend to neglect some important groups of MNCs, namely the non-grant aided service sector (e.g. retail) and indigenous owned MNCs.
As a result the first key challenge confronting our research team was to identify the MNC population in Ireland, i.e. to source an accurate and comprehensive listing of all MNCs operating in Ireland. Given the importance of FDI in Ireland, as well as the country’s comparatively small size, one might expect that a comprehensive list of MNCs might be easily obtained. However, this was not the case. To this end our initial task was to identify the population which required us firstly to define what we meant by a MNC. Given, that our focus was on researching HR we used an employee size threshold as follows:
1. Foreign-owned: All wholly or majority foreign-owned organisations operating in Ireland, with 500 or more employees worldwide and 100 or more employed in their Irish operations.
2. Irish-owned: All wholly or majority Irish-owned organisations with 500 or more employees worldwide and at least 100 employed abroad.
Having clearly defined an MNC, the next step was to identify a comprehensive and accurate population of MNCs in Ireland. A major reason behind the lack of representativeness is due to the incomplete coverage of databases much used by academics and researchers alike in deriving population listings. This issue is now also being recognised internationally (cf. Collinson and Rugman, 2005; Alfaro and Charlton, 2006; Edwards et al., 2006). Due to this our research team had to develop a listing from a number of diverse sources. This proved to be a particularly tedious and painstaking process, involving combining various listings of MNCs, including those of the main industrial promotions agencies (IDA Ireland, Enterprise Ireland etc.) and of other organisations (e.g. Kompass, Dun & Bradstreet, Irish Times)4. This phase took some nine months to complete and gave us a final listing of 490 foreign-owned MNCs and 72 Irish-owned MNCs - a combined total of 563 MNCs. Table 1.3 illustrates the ownership breakdown of the MNCs in our population. As expected, US-owned MNCs are in the majority: 42 per cent of all MNCs in Ireland are US-owned, followed by the UK at 19 per
4 For a detailed account of how our database was constructed and a more detailed exposition of the methodology employed, see McDonnell et al. (2007).

5
cent, European (excluding the UK and Ireland) at 18 per cent, Irish-owned at 13 per cent, and the ‘rest of the world’ at 8 per cent. It is interesting to note that the numbers of MNCs in services was greater than in manufacturing; 293 of the total population operate in the service sector, 268 in manufacturing, while we had just two MNCs in the primary sector.
Table 1.3 Population of MNCs in Ireland by country of origin
Our listing State agenciesNationality of MNCNo. of MNCs No. of MNCs5
Irish 72 (13%) 27 (8%)United States 239 (42%) 193 (59%)
United Kingdom 108 (19%) 24 (7%)European (excl. Ireland & UK) 100 (18%) 61 (20%)
Rest of the world (ROW) 44 (8%) 21 (6%)Total 563 326
Once the total population had been identified we then stratified by country of ownership, sector and size. From our total population of 563 companies, we selected a sample of 423 companies. Of these, 44 companies were subsequently removed from the population due to a) ceasing operations, b) not meeting the selection criteria or c) double-counting. This left a total of 379 companies. An additional 37 companies were subsequently added from the residual population to compensate for these losses, bringing the total valid sample of companies to 416.
The survey was administered through face-to-face interviews with the most senior HR practitioner. Invariably this tended to be the HR director or senior HR manager. To assist with the fieldwork, we contracted the Economic and Social Research Institute (ESRI). The ESRI is Ireland’s leading independent research body on matters relevant to Ireland’s economic and social development. University of Limerick researchers along with the contracted ESRI team conducted the fieldwork which began in June 2006 and finished in February 2007.
Interviews generally took between 40 to 60 minutes. A total of 262 interviews (216 foreign-owned and 46 Irish-owned) were obtained giving an overall response rate of 63 per cent. This equates to a 61 per cent response for foreign-owned MNCs and 78 per cent amongst Irish-owned MNCs. The survey responses are broadly representative of the total population and for the purposes of this paper have not been re-weighted. Chapter 2 sets down the profile of the respondents in detail.
Structure of the reportThe report begins by profiling the primary characteristics of MNCs in Ireland. This includes detailing their country of origin, industrial sector, employment size, time as a MNC, and place in the value chain. Further we highlight the most important influencing factors regarding whether the Irish operations receive new investments from the parent company as well as revealing how senior HR personnel view the Irish labour force.
Chapter 3 examines the HR function in MNCs in Ireland providing a comprehensive contemporary portrait. The use of human resource information systems and shared services centres, the presence of HR policy formation bodies, the existence of networking between HR managers in different country operations, and the level of monitoring from higher level management are among some of the key areas explored.
5 Note: these figures include ‘double counting’ of firms. Double counting refers to where the same MNC is listed twice or more, often under differing registered or trade names.

6
Following this, chapters 4 to 7 focus on the substantive HR areas that the survey examines. Chapter 4 highlights the principal findings on pay and performance management, chapter 5 deals with employee representation and consultation, chapter 6 examines employee involvement and communication, while chapter 7 presents the findings on training, development and organisational learning.

7
CHAPTER 2
PROFILING MULTINATIONAL COMPANIES IN IRELAND
IntroductionThis chapter provides a context for our subsequent discussion and analysis of the substantive areas of employment practice examined in this report. Specifically it provides detailed information on:
• The core characteristics of multinational companies (MNCs) in Ireland. This includes detail such as the nationality of ownership, size and sector, time as an MNC, and the method of internationalisation.
• The make-up of the workforce in these MNCs. For example, detail is provided on the extent of use of contingent labour such as temporary and part-time employees.
• The position of Irish subsidiaries in the value chain. In recent years a key economic policy goal has been to move MNC subsidiaries up their respective corporation’s value chain.
• Respondents level of satisfaction with various aspects of the Irish labour force, such as the availability and quality of university graduates, and the workforce’s ability to learn new skills.
• The most important factors influencing whether the Irish operations receive new investments or new mandates from their parent company.
Country of originThe country in which an MNC originates is believed to exert a distinctive effect on the way labour is managed in its international subsidiaries (Ferner, 1997). As a result, the country of origin of the multinational represents an important contextual factor. Chapter 1 notes that the US is the largest source of FDI in Ireland, a finding confirmed by our data. In fact 40 per cent of all firms were of US origin, see figure 2.1. This pattern is reflected in the parallel Canadian and UK studies, where US MNCs comprise 50 per cent and 40 per cent of the respondent populations respectively (Bélanger et al., 2006; Edwards et al., 2007). The next largest ownership group is the rest of Europe (continental European countries excluding Ireland and the UK) accounting for 24 per cent of all respondents, followed closely by indigenous firms (18 per cent). As noted in the previous chapter, research on Irish-owned MNCs is under-developed to say the least despite the clearly significant numbers of such organisations. UK-owned firms at 13 per cent were the next largest group, with the numbers in the ‘rest of the world’6 category low at 5 per cent. This is quite unlike the parallel UK study where MNCs from Japan particularly, and certain other Asian countries, have a significant presence. Clearly, Ireland attracts few Japanese or indeed Asian firms. Rather, it appears that Japanese FDI into Europe gravitates towards larger European economies, particularly Germany, France and the UK. This may be related to the premise that Japanese firms favour countries with a large domestic market. Clearly the small scale of Ireland’s domestic market cannot match those of its larger European counterparts (cf. Rios-Morales and Brennan, 2007).
6 It should be noted that the number of MNCs in the ‘rest of the world’ category is quite small at fourteen. Furthermore, this is quite a disparate group in terms of country of ownership, encompassing firms from southern and central Asia, the Americas (excluding the US) and the Antipodes. We therefore advise caution in interpreting subsequent results for this ownership category.

8
Figure 2.1 MNC respondents by country of origin
0%
5%
10%
15%
20%
25%
30%
35%
40%
45%
Irish UK US Europe Rest
We now turn to the question of whether these MNCs are privately owned, publicly traded or have they some degree of state ownership? Not surprisingly the majority (71 per cent) of MNCs in Ireland are publicly quoted companies, while the remaining 29 per cent are privately owned. There are a higher number of privately owned Irish MNCs compared to foreign MNCs (43 per cent versus 26 per cent). Of these companies it is interesting to note that 13 per cent indicated there was also some level of state ownership.
Size The size profiles of respondent MNCs are outlined in tables 2.1 and 2.2. Employment size may exert an influence on the organisation’s approach to how it manages its workforce as well as on the human resource practices deployed (cf. Buckley and Enderwick, 1985).
Table 2.1 Employment in foreign-owned MNCs
Employment worldwide % of firms Employment in Ireland % of firms
500 – 999 6 100 – 499 611,000 - 4,999 17 500 – 999 165,000 - 29,999 35 1,000 – 4,999 21
30,000 - 59,999 16 5000 + 260,000 + 26
Looking at the employment figures of foreign-owned MNCs operating in Ireland it is clear that these firms are significant employers in the global business world. Close to half (42 per cent) of these firms employ 30,000 or more employees worldwide. However whilst they may be large employers worldwide, this is not necessarily replicated in Ireland with just 23 per cent of foreign firms employing in excess of 1,000 in their Irish operations. Indeed only 2 per cent of foreign firms employ greater than 5,000 employees in Ireland.

9
Table 2.2 Employment in Irish-owned MNCs
Employment worldwide % of firms Employment in Ireland % of firms
500-4999 18 100-499 261000-4999 50 500-999 17
5000-29999 30 1000-4999 4830000-59999 0 5000+ 9
60000+ 2
Irish-owned MNCs are clearly very large employers by national standards. Almost two thirds (57 per cent) employ more than 1,000 workers in Ireland, substantially higher than that of foreign-owned MNCs (23 per cent). In terms of worldwide employment, less than a third (32 per cent) employ more than 5,000 people, confirming that there are now a significant number of Irish firms with substantial foreign employment, though clearly not yet near the scale of many of their much larger foreign-owned counterparts.
SectorThe sector or range of sectors in which an MNC operates represents a further important influence on the firm’s approach to workforce management and on the employment practices deployed. Previous Irish research has, for example, pointed to union avoidance approaches being significantly more prevalent in the electronics and software sectors than in pharmaceuticals and healthcare (Gunnigle et al., 2005). The distribution of respondent firms by sector is outlined in figure 2.2. It should be noted we use the category ‘multi-sector’ to capture those firms whose activities in Ireland straddle more than one sector. For example, an MNC engaged in manufacturing may also engage in discrete service operations, such as call centres. Our findings indicate that just twenty-five firms (under 10 per cent of the total) were ‘multi-sector’. Given such small numbers, we advise particular caution when interpreting subsequent results for the ‘multi-sector’ category.
Figure 2.2 MNCs in Ireland by broad industrial sector
0%
10%
20%
30%
40%
50%
60%
70%
Manufacturing Service Multi-sector
Foreign
Irish
All MNCs
Despite the fact the manufacturing has long been a key focus of Ireland’s industrial policy, it now ranks second (39 per cent) to the service sector (51 per cent) in absolute numbers of foreign-owned MNCs.

10
The makeup of the workforceThis section details some of the primary characteristics of the MNC workforce. More specifically, we provide detail on the percentage of male and female employees, as well as the percentage of temporary and part-time staff employed. We also provide detail on the presence of a ‘key group’ of employees, a major innovation in this study.
Recent decades have witnessed a marked increase in the numbers of women in the Irish labour force. However while this may be the case, it is clear that male employees make up an overwhelming majority of the multinational workforce in Ireland. Only 9 per cent of MNCs answered that more than 81 per cent of their workforce is male, however six in ten MNCs stated that between 50 and 80 per cent of their workforce is male.
Figure 2.3 Percentage of male employees in the workforce
5%
26%
35%
25%
9%
0-20% male
21 - 49% male
50 - 60% male
61 - 80% male
81 - 100% male
In more recent times it has also been suggested that organisations are making greater use of contingent labour such as part-time employees and employees on temporary contracts. As shown in figure 2.4, just over one third (36 per cent) of the MNCs indicated that more than 6 per cent of their workforce comprises temporary staff. In addition, one third of MNCs stated that in excess of 6 per cent of their workforce was employed on a part-time basis. These findings question the widespread anecdotal evidence of a significant increase in the utilisation of atypical employment forms in Ireland, at least in the MNC sector.

11
Figure 2.4 Percentage of temporary and part-time employees in the workforce
0%
10%
20%
30%
40%
50%
60%
70%
0 - 5% 6 - 10% 11 - 20% > 21%
% of w orkforce w hich are temporary
% of w orkforce w hich are part-time
Presence of a ‘key group’A major innovation of this study was to examine whether MNCs in Ireland recognised a ‘key group’ of employees. The idea of the key group originates from the resource-based view of the firm (cf. Barney, 1991). This argues that competitive advantage increasingly stems from a firm’s internal resources, particularly employee knowledge/skills. This view underpins recent debates on the importance of knowledge workers and the aspiration of economies to move up the ‘value chain’ through attracting and developing firms that engage in high value-added (and high margin) activities. An important manifestation of the resource-based view is the presence in firms of a specific category or group of employees who are critical to their firm’s competitive strategy by virtue of the particular knowledge and skills they possess.
We defined the key group as “those employees whom you might identify as critical to your firm’s organisational learning and core competence. These might be research staff, product designers, major account handlers, developers of new markets, etc”.
Just over half of the foreign MNCs (53 per cent) indicated they identify a key group of employees. Invariably these groups tended to be small with the majority (68 per cent) employing less than 49 employees. Almost identical figures were found with respect to the Irish-owned MNCs. A total of 52 per cent recognised a group and once again the majority (65 per cent) employ less than 49 employees. Although the presence of a key group appears comparatively widespread, its incidence was much lower than found in the parallel study of MNCs in the UK, where 80 per cent of firms identified a key group (Edwards et al., 2007). In terms of the nature of the key group there was a wide variety of roles selected, ranging from analysts to client executives to chemists to research and development (R&D) staff.
Throughout our survey we investigated the extent to which firms adopted similar or different employment practices for their ‘key group’, as compared to two other categories of employees, namely the largest occupational group (LOG) and ‘managers’. Responses on these issues are addressed in subsequent chapters of this report.
Other key MNC characteristicsNext we individually examine Irish-owned and foreign-owned MNCs in greater detail. Regarding the foreign MNCs we look at how long the present worldwide company has been in Ireland and the method by which they first established. In the case of the indigenous MNCs, we look at factors such as the period and method of internationalisation.

12
Foreign-owned MNCsOur findings indicate that the majority of foreign MNCs in Ireland are of comparatively recent vintage. Figure 2.5 shows that almost two thirds (64 per cent) have established here since 1980, with the largest number establishing operations between 1991 and 2000 (37 per cent)7.
Figure 2.5 Year the worldwide company first established in Ireland
0%
5%
10%
15%
20%
25%
30%
35%
40%
Pre 1960 1961 - 1980 1981 - 1990 1991 - 2000 Post 2001
The primary method by which foreign MNCs established in Ireland was through opening a new facility or ‘greenfield site’. Considering the fact that industrial development was somewhat later in Ireland than other European countries, the acquisition of existing Irish firms was possibly not a viable alternative for many inward investing MNCs. As indicated in figure 2.6, almost two thirds (62 per cent) of foreign-owned MNCs entered Ireland through establishing at a ‘greenfield site’. Of the remainder, most (33 per cent) entered by way of acquisition or a merger, while the residual 5 per cent entered by other means such as joint ventures, or franchise agreements.
Figure 2.6 Method of worldwide company’s first establishment in Ireland
62%
33%
5%
Greenfield
Merger/acquisition
Other
7 This information only shows when the current parent company entered Ireland. Clearly, some MNCs enter Ireland by virtue of a merger or takeover and in such instances, the acquired company will have operated previously in Ireland for several years.
13
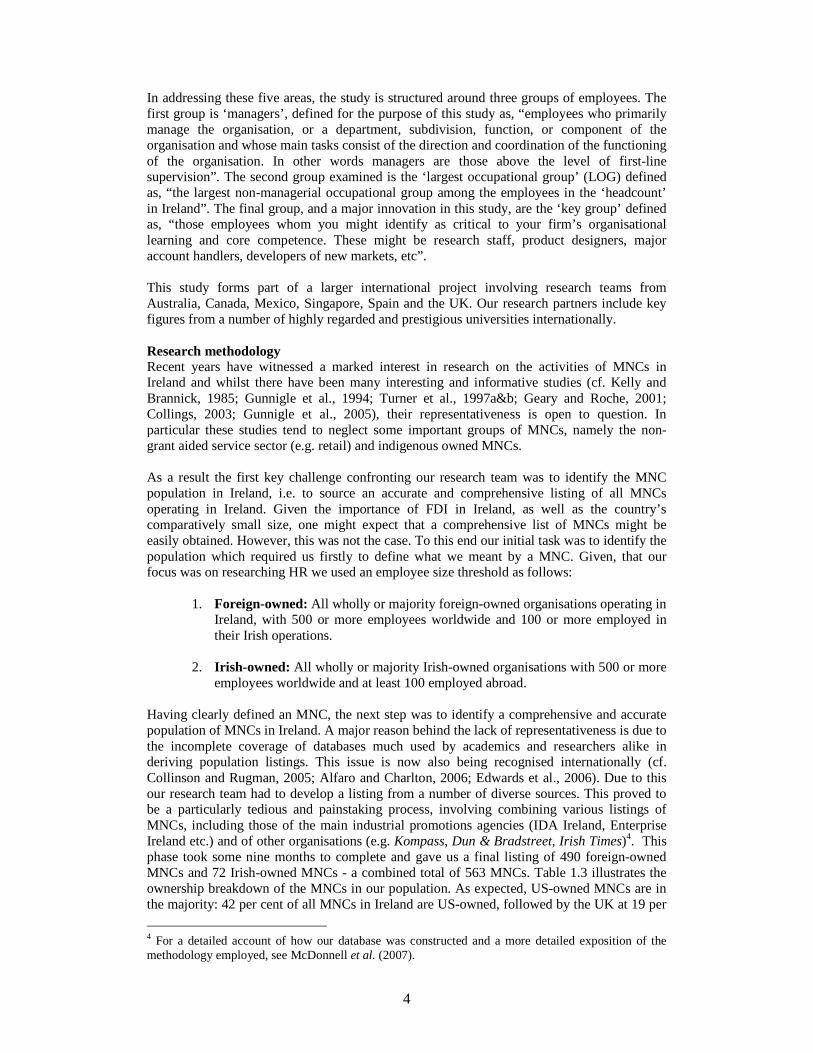
Turning now to the nature of MNC operations in Ireland, we first examined whether MNC operations here focused on a single site or were spread over a number of sites. As figure 2.7 illustrates, the overwhelming majority of MNCs (65 per cent) operate at two or more sites in Ireland, while the remainder (35 per cent) are single site operations.
Figure 2.7 How many sites do MNCs have in Ireland?
0%
5%
10%
15%
20%
25%
30%
35%
40%
45%
50%
1 site only 2 - 5 sites 6 or more sites
Approximately half of our respondent firms have been involved in the establishment of a new site or expansion of an existing site over the past five years. On the other hand, just over a fifth (21 per cent) indicated that they have closed one or more sites during that same period (13 per cent closed one site and 8 per cent closed more than one site). Thus while the popular media view may lead one to believe it is very much a negative picture in relation to foreign MNCs pulling out of Ireland, our results point to a somewhat different conclusion. Although clearly a number of MNCs have withdrawn investment from the country, a greater number have been expanding their operations there. In essence, we are experiencing a high level of ‘job churn’, i.e. concurrent job loss and job creation, especially in the manufacturing sector. This raises a number of important questions in regard to HRM and employment relations, such as the extent to which lower quality jobs are being replaced by higher quality jobs, unionised labour by non-union labour, permanent jobs by less permanent jobs, or vice versa.
Ireland’s position in the value chain?As noted above, a key policy goal of ‘Ireland Inc’ is that MNC operations there move up their respective corporation’s value chain. The value chain refers to the range of value-adding activities involved in bringing a product or service from conception to end use, such as research and development, design, production, marketing, distribution and customer support(cf. Porter, 1985; Sturgeon, 2001). A defining characteristic of modern globalisation is the growing geographical dispersion of value chains, a trend facilitated by advances in technology, improved transportation and greater trade liberalisation. This results in the physical fragmentation of production whereby firms seek to optimally situate different value chain activities in different locations to gain cost or other advantages. This may often embrace some form of outsourcing. The trend of MNCs seeking to organise production through a linked network of operations in different countries requires decisions on where to locate high and low value-added activities and whether these should be undertaken by the firm itself or outsourced. One immediate consequence is the difficulty of establishing the national origin of products since, for example, customer service may be delivered from Ireland for products designed in the US and produced in India (Bélanger et al., 2006). The position of the Irish operations of foreign-owned MNCs in this emerging global network of production poses key questions and challenges. Are Irish operations moving up or down their firm’s value chain?

14
How are the mandates of Irish operations developing? It may not simply be a question ofBallina or Bangalore, but rather what is the scale and quality of a particular firm’s investment in Ballina and Bangalore, and what are the related inter-dependencies.
To help address this issue, we examined the perceived importance of the Irish operations to the global performance of the parent company. The findings are summarised in figure 2.8. Our analysis indicates that the majority of respondents (72 per cent) believe that the Irish operations are either ‘important’ or ‘very important’ to the parent company’s global performance. The remaining 28 per cent indicated that the Irish operations ranged from being ‘not at all important ’to somewhat important’ in terms of their contribution to the performance of the parent company.
Figure 2.8 How important are the Irish operations to the global performance of the parent company?
0%
5%
10%
15%
20%
25%
30%
35%
40%
45%
50%
Not at allimportant
Of littleimportance
Somewhatimportance
Important Very important
Arguably of greater interest and more noteworthy was the question asking respondents whether “this importance has changed over the past five years”. In spite of the rising economic costs and the closures of MNCs in recent years, respondents were quite positive in their answers. Whilst 15 per cent indicated the importance of the Irish operations had slightly or significantly decreased and a further 29 per cent believe there had been no change, over half of our respondents (56 per cent) believed the importance of Ireland to the performance of the parent company had increased over recent years.

15
Figure 2.9 Has this level of importance of the Irish operations to the global performance of the parent company change in the past five years?
0%
5%
10%
15%
20%
25%
30%
35%
Significantlydecreased
Slightlydecreased
Stayed about thesame
Slightly increased Significantlyincreased
Irish-owned MNCsWe now turn to the often forgotten MNCs, namely those that are Irish-owned. As might be expected, the majority (69 per cent) internationalised since 1980 with the remaining 31 percent having internationalised prior to this. Unsurprisingly the early internationalisers tended to be old state-owned companies, the oldest Irish banks and also those operating in the agriculture/food sphere. Of interest is that 84 per cent indicated the Irish company was formed post 1980, suggesting that the great majority of Irish MNCs operated in the domestic market for some time prior to establishing international operations.
A surprising result was the finding that most Irish MNCs internationalised through the establishment of a greenfield site (51 per cent). Considering their comparative lateness in internationalising and the competitive markets they would have been entering, one might have expected a greater proportion to have internationalised by merger or acquisition.
Figure 2.10 Method of internationalisation
0%
10%
20%
30%
40%
50%
60%
Greenfield Merger/acquisition Other
It was also revealing to find that Irish-owned MNCs are quite ‘international’ in that they have operations in a number of different countries. In fact 83 per cent have operations in two or more countries, 37 per cent of which are in more than six nation states. Just under a fifth (17

16
per cent) operate in just one country other than Ireland, most commonly the UK. Such ‘single country MNCs’ represents some of the most recently internationalised Irish firms. In fact all but one internationalised post 1988. These findings suggest that Irish-owned MNCs have now moved beyond just the UK or US as outward FDI locations. Indeed, analysis of merger and acquisition data and firms annual reports indicate that Irish firms are now operating in excess of 25 different countries, and are thus increasingly establishing in more atypical markets.
Figure 2.11 Number of foreign countries where Irish MNCs have operating sites
17%
46%
37%
1 country
2 - 5 countries
6 or more countries
An argument against the increased internationalisation of indigenous firms is the potential loss of employment in the home country due to the transfer and outsourcing of activities to foreign locations. For example, the loss of American jobs to foreign subsidiaries of US firms has been a particular concern highlighted by the current Bush administration in the US. In our study we asked respondents in Irish-owned MNCs if they had established new sites or expanded existing sites in Ireland and also whether any Irish operations have been closed. The findings are quite mixed. Most positively is the finding that 60 per cent have been involved in a significant investment in a new Irish site or expansion of an existing site over the previous five years. However, we also find that just over half (53 per cent) closed one or more sites during the same period.
As in the case of the foreign-owned MNCs above, we examined the perceived importance of the foreign operations to the overall global performance of the parent Irish MNC. The findings are summarised in figure 2.12. These indicate that the great majority of Irish MNCs (86 per cent) believe their foreign operations are either ‘important’ or ‘very important’ to the company’s global performance. In addition, 43 per cent indicate that this importance of their foreign operations had ‘increased significantly’ over the past five years. Given the rapid internationalisation of Irish firms in recent years one might have expected a somewhat higher figure. However, it possibly indicates that whilst domestic firms are looking internationally for growth, the Irish operations remain an important part of their global business.

17
Figure 2.12 How important are the foreign operations to the global performance of the parent company?
0%
10%
20%
30%
40%
50%
60%
70%
Not at allimportant
Of littleimportance
Somewhatimportance
Important Very important
Satisfaction with the Irish labour forceIn addition to financial incentives, particularly low corporation tax, something which is advanced as a critical aspect of Ireland’s attraction to inward investing MNCs, is the availability and quality of labour (cf. Arrow, 1997; Wrynn, 1997; Tansey, 1998). Our study addressed this issue by seeking the opinion of respondents in MNCs, both foreign and Irish-owned, on various aspects of their own workforce, as well as their opinions on the Irish labour force more generally. More specifically we asked respondents to rate the following:
• Availability of university graduates • Quality of university graduates in their employment• Quality of professional school and technical graduates in their employment• Workforce’s ability to learn new skills• Work ethic of the workforce
The findings are summarised in Figure 2.13.
Figure 2.13 Satisfaction with the Irish labour force
0%
20%
40%
60%
80%
100%
Availability ofuniversitygraduates
Quality ofuniversity
graduates inemployment
Quality oftechnical
graduates inemployment
Workforce abilityto learn new skills
Work ethic
Very good
Good
Fair
Poor
Very poor

18
Clearly most respondents were very satisfied with the various aspects examined. However, the most pressing and noticeable concern was in relation to the availability of university graduates. Some 12 per cent stated they thought availability to be ‘very poor’ or ‘poor’ while a further 22 per cent reported it as ‘fair’. This should clearly be of concern to policy makers and MNCs. It places a question mark over the government’s strategy of moving Irish industry ‘up the value chain’, given that successful implementation would require a strong supply of suitably qualified graduates. Shortages of suitable graduates may not only be problematic for firms already established in Ireland but it may be a major negative factor in trying to attract new industry there. In most of the other aspects investigated, respondents were very positive, with an average of more than eight in ten reporting satisfaction levels of either ‘good’ or ‘very good’ in relation to the different measures of their workforce characteristics which we examined.
Influencing factors on new investment decisions for the Irish operationsWe have already noted the evolution of Ireland’s industrial development strategy and its contemporary focus on attracting higher ‘value added’ activities. However, beyond some anecdotal evidence, we have limited knowledge of how the mandates of subsidiaries of foreign MNCs in Ireland are developing. This section explores the opinions of subsidiary level managers on what they see as the most important factors influencing whether the Irish operations receive new investments or new mandates from their parent company. Thus, respondents were asked to rank from 1 to 7 the most important factor, with 1 being the most important factor and 7 the least important factor. Figure 2.14 illustrates the findings. The various colours in the bar chart represent the different factors while the numbers (1 to 7) on the vertical axis represent the ranking of importance of this factor in influencing such decisions. The horizontal axis identifies the percentage of MNCs selecting a particular ranking for each factor.
Figure 2.14 Rankings of importance of factors in influencing decisions on new investments or new mandates for the Irish operations
0% 20% 40% 60% 80% 100%
% of MNCs
7
6
5
4
3
2
1
Ran
kin
g (
1=m
ost
imp
ort
ant;
7=l
east
im
po
rtan
t)
Labour availability
Labour costs
Industrial relations climate
General infrastructure
Overall operating costs
Capacity of operations to innovate
Financial incentives
Perhaps not surprisingly, cost concerns emerge as clearly the most important area of concern among foreign MNCs in Ireland. As is illustrated in figure 2.14, overall operating costs werecited as the most important influencing factor (i.e. a ranking of 1), followed by labour costs. Correspondingly, they were the least likely to receive the lowest ranking (i.e. 7). This is perhaps expected as the corporate sector and employers’ bodies have been vocal for a number of years in relation to the deteriorating cost environment that companies in Ireland operate in. This has also been cited as the primary reason behind the relatively large number of foreign

19
MNCs closing their Irish operations and transferring their business abroad, often to lower cost locations (cf. Gunnigle et al., 2003). Issues such as the industrial relations climate and general infrastructure do not emerge as areas of concern: indeed a mere 7 per cent of respondents gave these two factors a ranking of either 1 or 2 (i.e. the most important and second most important factor).
Of possible concern though, is the finding that the ‘capacity of the Irish operations to innovate in the development of goods, services and processes’ is not ranked very high in terms of its importance in influencing investment decisions. Indeed, after the industrial relations climate and general infrastructure, it is most likely to receive the least important ranking (i.e. 7). As mentioned above, government policy in recent years has shifted to the attraction of value added jobs. However, this finding suggests that MNCs are not placing great importance on the capacity of the Irish operations to innovate. Rather, cost issues and labour availability are more pressing concerns. Thus the focus on attracting more value-added type investments may not itself be sufficient, instead the issues of cost and labour deficits need to be addressed concurrently.
ConclusionOur findings indicate that MNCs in Ireland are a relatively heterogeneous group, originating from the US, UK, Europe, as well as a small number of other countries. In addition there are a large number of indigenous MNCs. Most MNCs tend to be located in the service sector followed by manufacturing. There are also a number of MNCs classified as multi-sector. Firms vary greatly in terms of their Irish and worldwide employment figures. Indigenous MNCs tend to be the largest domestic employers whilst foreign firms have the largest worldwide employment
Just over half of the MNCs recognise a ‘key group’ of employees, which range from analysts, to client executives, to chemists, to research and development staff. Seven in every ten MNCs indicate that male employees make up in excess of half of the workforce. In spite of anecdotal evidence to the contrary the use of ‘atypical’ forms of employment (i.e. part-time and temporary workers) is relatively low.
Foreign-owned MNCs tend to be relatively new to the country with two thirds establishing post 1980, with ‘greenfield’ establishment the predominant form of entry. An overwhelming majority of foreign MNCs have two or more sites in Ireland. Irish-owned MNCs were late to internationalisation with almost seven in ten companies internationalising post 1980. Somewhat surprisingly, just over half internationalised through the establishment of ‘greenfield’ sites rather than through merger/acquisition. They also tend to be quite international in that 83 per cent have operations in more than two countries.
There are positive indications regarding Ireland’s position in the corporate ‘value chain’. Respondents predominantly believe the Irish operations are of great importance to the overall performance of the parent company and that this importance has increased over the past five years.
An overwhelming majority of respondents are extremely satisfied with various measures of the Irish labour force, such as quality of graduates, and the workforce’s ability to learn new skills. One noticeable concern is in relation to the availability of university graduates. Perhaps not surprisingly, cost concerns are clearly the most important area of concern among foreign MNCs. Operating costs and labour costs are the most important influencing factor in whether the Irish operations receive new investment or new mandates from the parent company.

20
CHAPTER 3
THE HR FUNCTION
IntroductionGiven the critical role played by foreign-owned MNCs in Ireland, it is hardly surprising that commentators have noted their influence on management practice. In particular, we find broad consensus that inward FDI has generally acted as a source of innovation, particularly in the diffusion of new HR approaches and in promoting the role of the specialist HR function (cf. Murray, 1984; Gunnigle, 1998; Gunnigle et al., 2003). More specifically, MNCs have been associated with the diffusion of high performance work systems (HPWS) (cf. Mooney, 1989; Flood et al., 2005) and performance management/ performance-related pay systems (cf. Gunnigle, et al., 1998). Comparisons between foreign-owned and indigenous firms point to a significantly greater uptake of ‘sophisticated’ HR practices among foreign-owned companies (cf. Roche and Geary, 1996; Geary and Roche, 2001; Flood et al., 2005).
However, as indicated earlier, important shortcomings characterising much of this research are the small sample sizes used and an over-reliance on data garnered from grant-aided MNCs in the manufacturing sector. Our more extensive and representative database allows us to review the role and structure of the HRM function in MNCs in Ireland, both foreign and indigenous.
Previous research on MNC subsidiaries has distinguished between those that are autonomous, those that are controlled from higher levels and those that are the source of information and resources for other sites (cf. Gupta and Govindarajan, 2000). In the parallel UK study, Edwards et al., (2007: 17) posit three potential scenarios regarding the role of the HR function:
• An autonomous HR function: where the national operations are ‘left to their own devices’, reporting to senior management in the host country but with limited reporting beyond the national level.
• A controlled HR function: where national level HR is tightly controlled and monitored by higher levels of management outside the host country (at regional, divisional or corporate level).
• A limited autonomy HR function: a variant of the ‘controlled HR function’ where host country operations have some influence on the crafting of international HR policies and are not simply implementers of polices developed outside the host country.
In this chapter, we consider evidence on the nature and role of the HR function in MNCs. We address the means through which MNCs seek to coordinate and control HR policy and practice across borders. We particularly focus on the role of the HR function in this regard, including the role of information technology and the use of shared services provision to aid the delivery of HR services at the national and international level.
IT based networks and services A key development in HR service provision over the past two decades has been the increased use of information technology (IT). This is all the more relevant in MNCs, where IT systems may be used to monitor policy implementation and performance, and also to facilitate communications and networking, across borders. It thus provides an insight on the extent to which corporate management has access to HR data on its international operations and can compare performance on HR metrics across sites and countries. We specifically examined the usage of IT based HR information systems (HRIS) and ‘shared services’ provision on an international level.

21
In regard to the diffusion of HRIS, respondents were asked whether the worldwide company had an “HR Information System (such as PeopleSoft or SAP HR) that holds data relating to the firms international workforce”. The responses for both foreign and Irish-owned MNCs are outlined in figure 3.1. Just over half (54 per cent) of all MNCs in Ireland reported the use of HRIS that operates on an international basis. This is a similar figure to that found in the parallel UK study, where some 52 per cent used such a system (Edwards et al., 2007). However, among MNCs in Ireland, a greater proportion of foreign-owned MNCs (56 per cent) than Irish-owned MNCs (44 per cent) reported the use of HRIS on an international basis.
Figure 3.1 Use of HRIS System on an international basis among MNCs in Ireland
0%10%
20%30%
40%50%
60%70%
Yes No
Foreign
Irish
There were some discernable differences in regard to ownership. As indicated in figure 3.2, American firms were the highest users of HRIS (70 per cent), while the ‘rest of the world’ MNCs is the least likely. This again resonates with the UK findings where US MNCs were among the greatest users of HRIS and Japanese MNCs the lowest (Edwards et al., 2007). The impact of sector on the take-up of HRIS is outlined in figure 3.3. Among Irish MNCs, the service sector accounted for the greatest number of firms with HRIS. However, among foreign-owned MNCs multi-sector firms were by far the largest users, followed by those in the service8.
Figure 3.2 Use of HRIS by country of origin
0%10%20%30%40%50%60%70%80%
UK US Irish Europe Rest
Yes
No
8 It should be noted that only a minority of MNCs operated across multiple sectors (18 foreign-owned MNCs and 7 Irish-owned MNCs).

22
Figure 3.3 Use of HRIS by sector
0%
10%20%
30%40%
50%60%
70%80%
90%
Foreign Irish
Manufacturing
Service
Multi-sector
Shared services provision on an international level has clearly increased over recent years. Such provision incorporates an ‘economy of scale’ approach whereby particular HR services are provided from one facility to service company operations, either solely in the country of operation, or across operations in different countries. The provision of shared services across countries provides another important indicator of the extent to which the HR function’s operations are integrated on an international basis (cf. Edwards et al., 2007). In our study, respondents were firstly asked whether their firm made “use of shared services centres” which catered for “a range of operating units or divisions”. Those who used such centres were then asked whether these centres were local (i.e. just serviced Irish operations) or international (i.e. catered for operations in other countries) in character.
The findings on the overall use of shared services centres are outlined in figure 3.4. These indicate that shared services centres are used in four out of every ten (39 per cent) MNCs in Ireland. Interestingly, the deployment of shared services centres was higher among Irish-owned MNCs (47 per cent) than in foreign-owned MNCs (38 per cent). There are several factors that might help account for the significant use of shared services centres among Irish-owned MNCs. Firstly; there may be a ‘size effect’. Irish-owned MNCs tend to be larger employers in Ireland, relative to foreign-owned MNCs and consequently may have a greater need for shared services facilities to cater for their workforce. Secondly, there is also the issue of where these firms are investing. Irish MNCs have operations in a relatively large number of countries, with a significant number operating in developing regions. Shared services centres may therefore aid coordination of activities and aid decision-making across these operations.

23
Figure 3.4 Use of shared services centres
0%
10%
20%
30%
40%
50%
60%
70%
Yes No
Foreign MNCs
Irish MNCs
Focusing on ownership specifically, we find that UK (46 per cent) and US (45 per cent) owned MNCs were the highest users of shared services centres, while those from the rest of Europe (22 per cent) and the rest of the World (29 per cent) were the lowest: see figure 3.5. The parallel study of MNCs in the UK also found American firms to be the most likely to have shared services centres (Edwards et al., 2007). The impact of sector on the deployment of shared services centres is outlined in figure 3.6. These findings indicate that seven in ten (72 per cent) of foreign ‘multi-sector’ MNCs use a shared services centres but less than a sixth (14 per cent) of Irish ‘multi-sector’ MNCs do so.
Figure 3.5 Use of shared services centres by country of origin
0%10%20%30%40%50%60%70%80%90%
UK US Irish Europe Rest
Yes
No
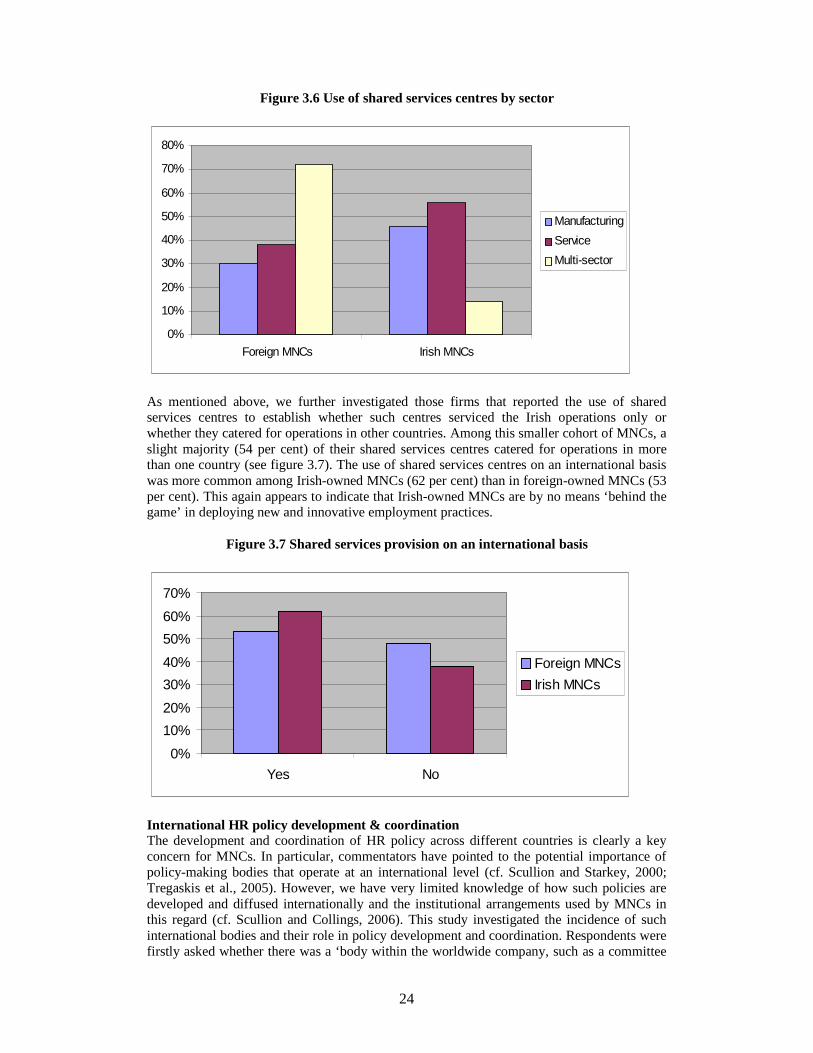
24
Figure 3.6 Use of shared services centres by sector
0%
10%
20%
30%
40%
50%
60%
70%
80%
Foreign MNCs Irish MNCs
Manufacturing
Service
Multi-sector
As mentioned above, we further investigated those firms that reported the use of shared services centres to establish whether such centres serviced the Irish operations only or whether they catered for operations in other countries. Among this smaller cohort of MNCs, a slight majority (54 per cent) of their shared services centres catered for operations in more than one country (see figure 3.7). The use of shared services centres on an international basis was more common among Irish-owned MNCs (62 per cent) than in foreign-owned MNCs (53 per cent). This again appears to indicate that Irish-owned MNCs are by no means ‘behind the game’ in deploying new and innovative employment practices.
Figure 3.7 Shared services provision on an international basis
0%
10%
20%
30%
40%
50%
60%
70%
Yes No
Foreign MNCs
Irish MNCs
International HR policy development & coordinationThe development and coordination of HR policy across different countries is clearly a key concern for MNCs. In particular, commentators have pointed to the potential importance of policy-making bodies that operate at an international level (cf. Scullion and Starkey, 2000; Tregaskis et al., 2005). However, we have very limited knowledge of how such policies are developed and diffused internationally and the institutional arrangements used by MNCs in this regard (cf. Scullion and Collings, 2006). This study investigated the incidence of such international bodies and their role in policy development and coordination. Respondents were firstly asked whether there was a ‘body within the worldwide company, such as a committee

25
of senior managers that develops HR policies that apply across countries’. The findings are summarised in figure 3.8. These indicate that the majority of MNCs (59 per cent) in Ireland have a body whose responsibility it is to develop HR policies on an international basis. This figure is somewhat higher than the equivalent figure of 53 per cent found in the parallel study of MNCs in the UK. Among MNCs in Ireland, there was only a small difference in the incidence of such bodies between foreign-owned (59 per cent) and Irish-owned (55 per cent) MNCs.
Figure 3.8 International HR policy formation
0%
10%
20%
30%
40%
50%
60%
Yes No
Foreign MNCs
Irish MNCs
As indicated in figure 3.9, international HR policy making bodies are most prevalent in US firms, where over seven in ten reported the presence of a body with responsibility to develop HR policies on an international basis. Sector was also found to be influential. Foreign-owned firms engaged in operations spanning multiple sectors in Ireland were more likely to have such a body/committee, with almost eight in ten (78 per cent) of all foreign-owned MNCs having one (see figure 3.10). Among Irish-owned MNCs, those in the manufacturing sector were most likely to have an international HR policy-making body (73 per cent). This may well stem from that fact that those in the manufacturing sector may be older than many of their service sector counterparts, and thus have had more time to build up HR policy development and coordination across their international operations. It may also be that this is a cheaper alternative than international assignments, one of the conventional, if expensive, means of sharing best practice. However, we cannot be definitive on this and the reasons behind differences in international HR policy development merit further investigation. With regard to size, larger firms, both Irish and foreign, were more likely to have such bodies.

26
Figure 3.9 International HR policy formation body by country of origin
0%
10%
20%
30%
40%
50%
60%
70%
80%
UK US Irish Europe Rest
Yes
No
Figure 3.10 International HR policy formation body by sector
0%
10%
20%
30%
40%
50%
60%
70%
80%
90%
Foreign MNCs Irish MNCs
Manufacturing
Service
Multi-sector
Looking specifically at foreign-owned MNCs, the study investigated whether such international bodies contained a representative from the Irish operations. The extent of such national representation is identified by Edwards et al. (2007) as a useful means of distinguishing between a ‘controlled HR function’, whose primary role is to implement policies developed outside of Ireland, from a ‘limited autonomy HR function’ whereby the Irish operations have an input into policy formulation. This was found to be the case in some 52 per cent of foreign MNCs, a little below the figure of 55 per cent found in the parallel study of MNCs in the UK.
Edwards et al., (2007: 19) further note that the extent to which the HR function makes a ‘systematic attempt to bring managers together across sites’ is a useful indicator of inter-country integration in HR policy formulation, as opposed to a more centrally driven corporate control approach. Our study examined that nature and frequency of contact between HR managers in different countries, and the results are outlined in Figure 3.11 and 3.12.
These findings point to a high level of international interaction between HR practitioners in MNCs. Almost eight in every ten (79 per cent) MNCs in Ireland reported holding regular

27
meetings between HR practitioners from operations in different countries. The incidence of such meetings was slightly higher among foreign-owned MNCs (80 per cent) than Irish-owned MNCs (73 per cent). Just under half (49 per cent) claimed to hold such meetings at least once every quarter. This is in line with the parallel study of MNCs in the UK that found 54 per cent had regular meetings at least quarterly. There was also a high utilisation of networking via international conferences, task forces, and virtual means among foreign-owned MNCs in Ireland. However, the incidence of international working using these mechanisms was decidedly lower among Irish-owned MNCs. Just about seven in ten (68 per cent) foreign-owned MNCs and exactly four in ten Irish MNCs reported holding international conferences involving HR practitioners from different countries. In terms of frequency, these conferences were at least annual events in half of all foreign MNCs but in just a quarter of Irish MNCs. This is significantly lower than found in the UK study where nearly seven out of ten (69 per cent) MNCs there reported holding conferences for HR practitioners or more frequently.
Approximately two thirds of foreign-owned MNCs and just over half the Irish-owned MNCs (53 per cent) used international task forces, mostly on an ad hoc basis. This is slightly lower than that found in the UK study where task forces were used by three quarters of MNCs there. Virtual networking was used by three quarters (77 per cent) of foreign-owned MNCs and 63 per cent of Irish MNCs. Overall, the extent of international networking was lower in Irish MNCs than among their foreign-owned counterparts.
American MNCs report the highest incidence of international networking (across all four networking mechanisms on which we collected data). With regard to the impact of sector, our findings indicate that MNCs engaged in multiple sectors report the highest levels of international networking. Again as expected, larger MNCs were most likely to bring HR practitioners together on an international basis.
Figure 3.11 International networking (foreign MNCs only)
0%
10%
20%
30%
40%
50%
60%
Quarterly Annually Other/ad hoc Never
Int Meetings
Int Conferences
Task forces
Virtual networks
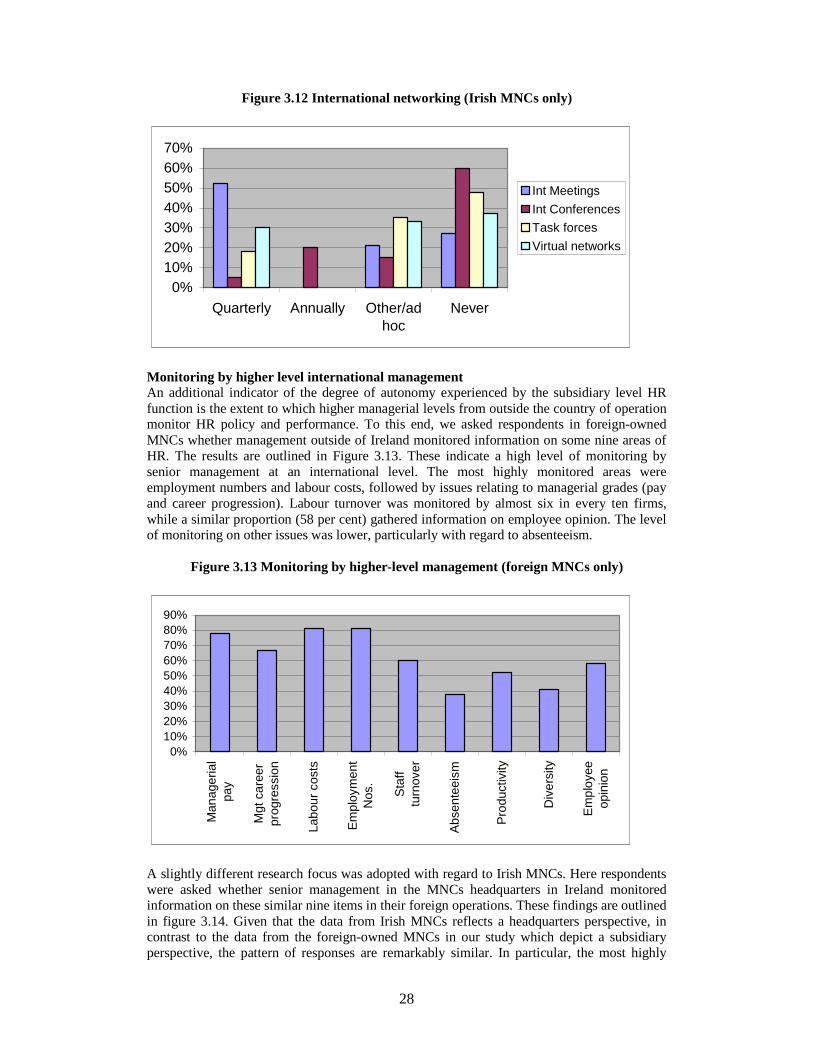
28
Figure 3.12 International networking (Irish MNCs only)
0%10%20%30%40%50%60%70%
Quarterly Annually Other/adhoc
Never
Int Meetings
Int Conferences
Task forces
Virtual networks
Monitoring by higher level international managementAn additional indicator of the degree of autonomy experienced by the subsidiary level HR function is the extent to which higher managerial levels from outside the country of operation monitor HR policy and performance. To this end, we asked respondents in foreign-owned MNCs whether management outside of Ireland monitored information on some nine areas of HR. The results are outlined in Figure 3.13. These indicate a high level of monitoring by senior management at an international level. The most highly monitored areas were employment numbers and labour costs, followed by issues relating to managerial grades (pay and career progression). Labour turnover was monitored by almost six in every ten firms, while a similar proportion (58 per cent) gathered information on employee opinion. The level of monitoring on other issues was lower, particularly with regard to absenteeism.
Figure 3.13 Monitoring by higher-level management (foreign MNCs only)
0%10%20%30%40%50%60%70%80%90%
Man
ager
ial
pay
Mgt
car
eer
prog
ress
ion
Labo
ur c
osts
Em
ploy
men
tN
os.
Sta
fftu
rnov
er
Abs
ente
eism
Pro
duct
ivity
Div
ersi
ty
Em
ploy
eeop
inio
n
A slightly different research focus was adopted with regard to Irish MNCs. Here respondents were asked whether senior management in the MNCs headquarters in Ireland monitored information on these similar nine items in their foreign operations. These findings are outlined in figure 3.14. Given that the data from Irish MNCs reflects a headquarters perspective, in contrast to the data from the foreign-owned MNCs in our study which depict a subsidiary perspective, the pattern of responses are remarkably similar. In particular, the most highly

29
monitored items among both foreign and Irish MNCs are managerial pay, labour costs and employment numbers, while diversity and absenteeism is the subject of much lower levels of monitoring by senior management.
Figure 3.14 Monitoring by higher level management (Irish MNCs only)
0%
20%
40%
60%
80%
100%M
anag
eria
lpa
y
Mgt
car
eer
prog
ress
ion
Labo
ur c
osts
Em
ploy
men
tN
os.
Sta
fftu
rnov
er
Abs
ente
eism
Pro
duct
ivity
Div
ersi
ty
Em
ploy
eeop
inio
n
In attempting to explain these trends, we find that among foreign-owned MNCs in Ireland, American subsidiaries reported the highest level of monitoring by international management outside of Ireland. In regard to sector, firms in both the manufacturing and service sector reported high levels of monitoring. However, the level of monitoring was markedly lower among multi-sector firms. The may be due to the greater diversity of activities of multi-sector MNCs, with the consequence that it is more difficult for international level management to monitor HR performance across diverse establishments and operations. The level of monitoring was higher among larger MNCs.
Overall approach to workforce management Recent decades have witnessed a greater organisational focus on aligning business strategy with HRM policy and practice, with the goal of improving firm performance (cf. Boxall, 1992; Purcell et al., 2003). Indeed the very concept of ‘strategic HRM’ infers the development of a strategic corporate approach to workforce management, whereby firms seek to formulate an overall corporate HR philosophy and strategy that complements their business strategy and enhances the ‘bottom line’ (cf. Boxall, 1992; Purcell, 2004).
Our survey focused on the extent to which MNCs adopted a uniform management approach in their international operations and explored the origins of such approaches, if any (cf. Sparrow et al., 2004; Edwards et al., 2007). Respondents were presented with a series of statements relating to their company’s approach concerning the management of its workforce and asked the extent to which they agreed or disagreed with each using a 1 to 5 scale. The findings are summarised in table 3.1.

30
Table 3. 1 Approach to workforce management (Agree/Strongly agree)9
Agree/Strongly Agree Foreign MNCs
Irish MNCs
Total
Worldwide approach covering all global operations
52% 46% 51%
Regional approach (for Europe) 44% 35% 40%Development of approach left to divisional
level26% 33% 27%
Development of approach left to national level
66% 63% 66%
Mix of traditions 45% 33% 43%Country of origin has overriding influence 52% 61% 54%
The data show that a worldwide approach or philosophy towards human resource management (HRM) is present in just over half (51 per cent) of the firms surveyed. This was somewhat lower than found in the parallel UK study, where some 61 per cent agreed or strongly agreed that there was a worldwide approach. Among MNCs in Ireland, a worldwide approach was more prevalent among foreign-owned than Irish-owned MNCs. A regional approach was also present but less common.
The next two statements addressed the level at which an organisation’s approach to HRM originates. These explore whether the development of a specific HR approach is left to international divisions or to national operating companies. Here the majority of firms, both foreign-owned (66 per cent) and Irish-owned (63 per cent), felt this lay with national leveloperations, a figure significantly higher than that found in the UK study (45 per cent). A significantly lower proportion (27 per cent) of MNCs in Ireland felt HR policy is developed at the international divisions. The equivalent figure in the UK study was 34 per cent. A number of firms reported the presence of strong worldwide and regional philosophies, similar to the parallel study of MNCs in the UK where it was surmised that one possible explanation is that MNCs deploy “a broad worldwide philosophy and a more specific regional one within this” (Edwards et al., 2007: 22).
We further investigated the importance of ‘country of origin’ in shaping the overall approach to workforce management. This is seen as a useful indicator of the extent to which the company’s approach is dominated by home country traditions and norms, or what Perlmutter (1969) calls an ‘ethnocentric’ approach. This is seen to contrast other approaches such as a ‘polycentric’ approach (where host country traditions dominate). The findings indicate that a slight majority (54 per cent) of MNCs report that the traditions in the country of origin have an ‘overriding influence’ on the approach to HR management in their foreign subsidiaries, i.e. are characterised by a high level ethnocentrism. As indicated in Figure 3.15, American MNCs are far more likely to report the presence of a worldwide HR approach covering all their global operations. Clearly, US MNC subsidiaries in Ireland are most likely to report the presence of a global HR approach and that the traditions of the parent company have an overriding impact on this approach. A similar pattern was found in the parallel study of MNCs in the UK. We did not find any significance differences according to sector. However, larger firms were more likely to have a global HR approach and to report that parent country traditions exerted the major influence on this approach.
9 Totals come to more than 100% reflecting fact that the HR approach of MNCs may be influenced from multiple sources/levels

31
Figure 3.15 Presence of worldwide HR approach by country of origin
0%
10%
20%
30%
40%
50%
60%
70%
80%
UK US Europe
ConclusionIn this chapter, we have reviewed evidence on the nature and role of the HR function in MNCs in Ireland. We concentrated, in particular, on the extent and means through which MNCs seek to coordinate and control HR policy and practice at an international level. One key dimension in this regard concerns the deployment of information technology in HR service provision. This role incorporates the potential deployment of IT in the international delivery of HR services and in senior level monitoring of HR performance among subsidiary operations. Our findings suggest that just over half of all MNCs in Ireland make use of a HRIS on an international basis, with foreign-owned MNCs more likely to use such systems than Irish MNCs. Among the cohort of foreign-owned MNCs, American companies reported the highest level of IT in delivering HR services across borders. The findings further indicate that ‘shared services’ usage occurs in four in every ten MNCs in Ireland. Shared services centres were more common in Irish-owned MNCs than among their foreign-owned counterparts. The use of shared services centres on an international basis was also more common among Irish-owned MNCs.
As noted earlier, we have limited knowledge of how HR policies are developed and diffused at international level. Our findings shed some light on this deficit, highlighting that almost six in every ten MNCs in Ireland report the presence of a body with a mandate to develop HR policies on an international basis. International HR policy-making bodies were most prevalent in US firms. We also found a high level of international networking between HR managers. Eight in every ten MNCs in Ireland reported regular meetings between HR practitioners from operations in different countries. We also find a high level of networking via other means, namely international conferences, task forces, and virtual means among foreign-owned MNCs in Ireland. However, the extent of such international HR networking was much lower in Irish-owned MNCs.
An important aspect of international management is the extent of monitoring by senior level management of HR performance and practice in subsidiary operations. Our data points to a high level of monitoring. However, most of the monitoring effort focuses on specific aspects of HRM, namely employment numbers, labour costs and managerial pay and development. American firms reported the highest level of monitoring.
Finally, we explored the extent to which MNCs in Ireland were characterised by a uniform global HR approach or philosophy. We found the presence of a global HR approach in just over half of all MNCs in Ireland. Such an approach was more common in foreign-owned than

32
in Irish-owned MNCs. We also considered the extent to which the country of origin influences the overall HR approach. Here we found that a small majority of MNCs report that parent country traditions have an ‘overriding influence’ on the approach to HR management in foreign subsidiaries. American MNCs were by far the most likely to report the presence of a worldwide HR approach covering all their global operations.
Overall, our findings point to a considerable degree of variety in the HR approaches and practices of MNCs. In particular, we highlight some patterns of MNC behaviour driven by characteristics such as ownership, scale, structure, and areas of business activity.

33
CHAPTER 4
PAY AND PERFORMANCE MANAGEMENT
IntroductionThis chapter explores the policies that MNCs adopt in the area of pay systems and performance management. This is one of the key issues for HRM, and often an indicator of a firm’s wider management style. It may be seen as reflecting the firm’s strategic approach to the management of employees, its approach to individual employees, and the principal messages of its corporate culture. It is also a core element in the management of those managerial and professional categories often regarded as key to international competitive advantage. Here the general pattern of pay and performance practices of MNCs is outlined. The effects of ownership and sector on these practices are also examined. Nationality of ownership has been seen as a major factor influencing the kinds of pay and performance policies that MNCs adopt. American companies, for example, have long been regarded as HR ‘innovators’ in such aspects as individual performance appraisal, performance-related pay, and employee share ownership (Gunnigle et al., 1997; Dunning, 1998). National influences stem from the characteristics of the parent-country business system: the US, for instance, has had a long history of pay innovation. This can be traced to the attempts of firms to deter unionisation by providing innovative terms and conditions to employees, and by linking pay to individual performance (Foulkes, 1980; Jacoby, 1997; Gunnigle et al., 1998; Roche and Turner, 1998). By contrast, in many European countries, such as Germany and the Netherlands, sectoral pay bargaining and company-level employee representation through works councils have traditionally limited the scope for individually-focused forms of pay and appraisal systems. Pay systems typically have a sectoral dimension too. Payment by results and group-based performance-related pay schemes tend to be more widespread in manufacturing, whereas individual performance-related pay is generally more widely diffused in services.
A number of specific areas are examined in this section on pay and performance practices in foreign and Irish MNCs. First, companies’ overall strategy on pay levels: do they aim to pay employees above, below, or at the market average for their sector? Secondly, methods of performance appraisal: whether companies use formal systems for different groups of staff, the way that appraisal is implemented, the uses to which it is put, and so on. Thirdly, the use of various systems of reward such as profit-related pay and share ownership are reported. Finally, it explores the degree of subsidiary freedom in the management of pay and performance policy.
Pay policy in MNCsCompanies were asked to assess where the company aimed to be as a whole on pay levels in relation to comparators in the same sector/industry. Responses were categorised into top quartile, second quartile, above the median/mid-point, and below the median/mid-point, for three specific groups of employees: the largest non-managerial occupational group (LOG), key group and managers. As depicted by figure 4.1 managers and the key group are more likely to be paid above the median than the LOG, which is consistent with the findings of a parallel survey in the UK (Edwards et al., 2007). Indeed 31 per cent of MNCs that recognise a key group aim to be in the top quartile, which would appear to suggest they regard the key group as being critical to the company’s success and are willing to pay superior rates of remuneration for their services. There are also some differences between foreign and Irish-owned MNCs. Firstly, with regard to pay levels of key employees, 59 per cent of foreign-owned MNCs aim to be in the top or 2nd quartile compared with 68 per cent of Irish-owned MNCs. Secondly for managers aiming at the top or second quartile it is 51 per cent in foreign-owned MNCs and 56 per cent in Irish-owned MNCs. Thirdly, 33 per cent of Irish MNCs compared to 41 per cent of foreign-owned MNCs, aim to pay the LOG in the top or 2nd

34
quartile. Overall, few companies aim to have pay levels below the median/midpoint in comparison to others in any of the three groups of employees. Indeed a substantial proportion of companies tend to aim to have pay levels at the midpoint for each group of employees: 60 per cent for the LOG, 40 per cent for the key group and 48 per cent for managers.
Figure 4.1 Pay policy of MNCs
0%
10%
20%
30%
40%
50%
60%
70%
Below median Midpoint 2nd quartile Top quartile
LOG
Key Group
Managers
Figure 4.2 indicates pay levels by country of origin. Again there is a pattern consistent across all MNCs of aiming to pay key employees in the top or 2nd quartile. This is particularly the case for UK MNCs. Indeed, UK firms consistently aim to pay a greater proportion of employees in the three categories in the top or 2nd quartile compared to other MNCs: 53 per cent of the LOG, 72 per cent of the key group and 64 per cent of managers. European-owned MNCs are next, followed by Irish (except for pay levels for the LOG) and lastly US MNCs.
Figure 4.2 Pay policy by country of origin
0%
10%
20%
30%
40%
50%
60%
70%
80%
UK US Europe Rest Irish
LOG 1/2 quartile
Key group 1/2 quartile
Managers 1/2 quartile
A greater proportion of MNCs consistently aim to be in the first or second quartile regarding pay for all three groups of employees in the service sector of the economy compared to MNCs in the manufacturing sector or multi-sector (see figure 4.3). In particular, there is a substantial difference between companies in the service sector and those classified as multi-sector.

35
Figure 4.3 Pay policy by sector
0%
10%
20%
30%
40%
50%
60%
70%
Manufacturing Services Multi-sector
LOG 1/2 quartile
Key group 1/2 quartile
Managers 1/2 quartile
Performance appraisal systemsThe key finding in relation to the use of performance appraisal schemes is that, for each of the groups, the vast majority of companies have formal schemes: 94 per cent of managers and 75 per cent of the LOG in foreign MNCs compared to 87 per cent of managers and 59 per cent of the LOG in Irish-owned companies. Again there is a difference between Irish and foreign-owned MNCs suggesting performance appraisals schemes are still not as prevalent in Irish-owned MNCs, particularly for the LOG. One factor that may account for this is the high level of unionisation in Irish MNCs. Irish MNCs are more likely to have different schemes for different groups, 64 per cent, compared to 40 per cent of foreign MNCs. Conversely, 60 per cent of foreign MNCs report having a single integrated appraisal scheme for all employees compared to 36 per cent of Irish MNCs.
Figure 4.4 Systems of regular performance appraisal
0%
10%
20%
30%
40%
50%
60%
70%
80%
90%
100%
LOG Managers Single schemes Different schemes
Foreign
Irish
There is a significant nationality effect that is consistent across all three sectors. Regular appraisal for the LOG and managers is highest in US MNCs followed by rest of world MNCs, UK MNCs, European MNCs and is lowest in Irish MNCs (see figure 4.5). There is a significant difference in the use of a single integrated system of appraisal: less than 40 per

36
cent of Irish and UK MNCs compared to over 60 per cent of US and European MNCs have such a scheme in place.
Figure 4.5 Systems of performance appraisal by country of origin
0%
10%
20%
30%
40%
50%
60%
70%
80%
90%
100%
UK US Europe Rest Irish
Largest group
Managers
Single schemes
Different schemes
Methods of Performance AppraisalFigure 4.6 reports on the use of two particular methods of appraisal: forced distribution (FD) and peer/360 degree feedback. ‘Forced’ distribution (FD) systems oblige appraisers to place a certain proportion of appraised staff in different performance categories or grades, normally with the aim of avoiding the ‘bunching’ of staff in the higher grades. Such systems have become increasingly prominent as companies have sought to gain competitive advantage by using the outcome of appraisal systems as the basis for decisions on pay, promotion, and redundancy. They are particularly important in business systems, such as the US, where labour markets are characterised by ‘employment at will’, so that companies are easily able to respond to changes in market conditions by adjusting the size of their workforce.
The use of both methods of appraisal is significantly more common in foreign than Irish MNCs. In the foreign-owned 27 per cent apply the method of forced distribution to the LOGand 26 per cent use peer/360 degree feedback for this group. Only 4 per cent of Irish MNCs use FD for the LOG and 20 per cent use peer/360 degree feedback. Similarly, foreign MNCs use both methods for the managerial group to a greater extent than Irish MNCs: 29 per cent use forced distribution FD and 53 per cent peer/360 degree feedback compared to 11 per cent and 37 per cent respectively for Irish MNCs.

37
Figure 4.6 Methods of performance appraisal
0%
10%
20%
30%
40%
50%
60%
Forced dist. Peer/360 degree Forced dist. Peer/360 degree
LOG Managers
Foreign
Irish
This pattern is confirmed in figure 4.7. However, as expected, there is a significant difference between US MNCs and others, with a greater percentage of US MNCs using forced distribution and peer appraisal for both the LOG and managers. This is different to the UK findings where surprisingly no nationality effect on forced distribution or peer appraisals was apparent (Edwards et al., 2007).
Figure 4.7 Methods of performance appraisal by country of origin
0%
10%
20%
30%
40%
50%
60%
70%
UK US Europe Rest Irish
LOG Forced dist.
LOG Peer/360 degree
Managers Forced dist.
Managers Peer/360 degree
However similar to the UK findings, the use of forced distribution for the LOG and managers is more likely in the service sector, but the differences are slight.
Use of financial schemesMNCs, particularly US firms, have traditionally sought to bind their employees into ‘shareholder capitalism’ through the use of employee share ownership schemes. Moreover, the deregulation of financial markets from the 1980s, and the rise of the concept of ‘shareholder value’ have further enhanced the use of employee stock options as a device to

38
link the remuneration of managers (O’Sullivan, 2000). Here the use of three financial schemes, employee share ownership, profit sharing and share options is examined. Results indicate a relatively even spread with approximately one third of MNCs indicating the use of the three incentives for each category of employees (see figure 4.8). There are some notable differences between foreign and Irish-owned MNCs regarding share options which are used to a greater extent by foreign than Irish MNCs, 15 per cent compared to 27 per cent for the LOG, 32 per cent compared to 41 per cent for the key group and 43 per cent compared to 51 per cent for managers.
Figure 4.8 Financial schemes for employees
0%
10%
20%
30%
40%
50%
60%
LOG Key group Managers
Employee share ownership
Profit sharing
Share options
As figure 4.9 depicts, US MNCs are more likely to use the three forms of financial incentivesthan others. This is particularly pronounced in the use of employee share ownership for the three groups of employees. This confirms previous research in Ireland and internationally on the use of such schemes in foreign and domestic firms (see Morley and Gunnigle, 1997;Björkman and Furu, 2000). Conversely, with the exception of share options, both rest of world and European MNCs are less likely to use employee share ownership and profit sharing schemes than US, UK and Irish MNCs.
Figure 4.9 Financial schemes for employees by country of origin
0%
10%
20%
30%
40%
50%
60%
70%
80%
Shareownership
Profitsharing
Shareoptions
Shareownership
Profitsharing
Shareoptions
Shareownership
Profitsharing
Shareoptions
LOG Key group Managers
UK
US
Europe
Rest
Irish

39
MNCs operating in more than one sector use the three financial incentive schemes for all employees to a greater extent than MNCs in manufacturing and services. In particular, the use of profit sharing schemes is significantly more prominent in multi-sector companies, 42 per cent compared to 19 per cent in the manufacturing sector for the LOG and 29 per cent in the service sector. The pattern is similar for the key group and managers. The use of share options although still greater in multi-sector companies, tends to be more evenly spread across the three sectors.
Variable or performance related pay (PRP) is extensively used for all employees, particularly for the key group and managers. US MNCs tend to be more likely to use PRP for the LOGand the key group. However, the differences are not significant. In the UK Edwards et al.,(2007) found nationality to be a factor, with US MNCs more likely to have variable pay for all three groups and more likely to use variable pay for the LOG. There are no substantial differences in the use of PRP across the different sectors in our data.
Figure 4.10 Performance related pay by country of origin
0%
10%
20%
30%
40%
50%
60%
70%
80%
90%
100%
UK US Europe Rest Irish
LOG
Key group
Managers
Discretion over pay and performance policyThe issue of management discretion and autonomy is one of the most prominent and recurring themes in the MNC literature (cf. Gupta and Govindarajan, 2000). We address this issue below in regard to pay and performance, and in each subsequent chapter (on employee representation, employee involvement and communication, and training and learning, respectively). It is therefore appropriate that we summarily explain how this area of analysis is dealt with. As outlined in chapter one, this report investigates two fundamentally different types of MNC, namely foreign-owned and indigenous (Irish)-owned MNCs. It was therefore necessary to construct somewhat different questions for both these MNC categories. Among foreign-owned companies in Ireland, we sought to establish the level of discretion afforded to the local (Irish-based) management team by higher management levels outside of Ireland. However, in Irish-owned MNCs we sought to establish the level of discretion granted to managers in their operations outside of Ireland. Put simply, we sought a subsidiary level perspective among foreign MNCs and a headquarter perspective among Irish MNCs. In all cases though, respondents were asked to indicate levels of discretion afforded/granted on a five-point scale from ‘no discretion’ (which was explained as ‘must implement policy set by a higher level’) to ‘full discretion’ (‘can set own policy’). A sixth option was also provided, namely that the level of discretion varies widely across the different subsidiaries (i.e. ‘no typical situation exists’). For the reasons outlined above, we present the findings from

40
foreign-owned and Irish-owned MNCs separately. This convention is followed in all the subsequent chapters.
This section investigates the level of discretion afforded to local management in foreign-owned MNCs in Ireland and also the level of discretion afforded by management in Irish MNCs to their foreign operations in regard to the determination of pay and performance policy. More specifically we explore discretion over relating pay levels to market comparators, employee share ownership schemes, performance appraisal systems and variable payment schemes.
Foreign-owned MNCsForeign MNCs tend to have considerable discretion in the area of pay (61 per cent have either full or a lot of discretion). In relation to variable pay, 59 per cent report full/a lot of discretion, and in performance appraisal some 56 per cent report full/a lot of discretion for the largest group of employees. Discretion is somewhat polarised between high and low discretion for share ownership schemes, performance appraisals for both groups of employees, and variable pay for managers.
Figure 4.11 Discretion to decide financial rewards (foreign MNCs)
0%
5%
10%
15%
20%
25%
30%
35%
40%
45%
Relating pay tomarket
comparators
Shareownership
Performanceappraisalmanagers
Performanceappraisal LOG
Variable paymanagers
Variable payLOG
There is no discretion
There is a little discretion
There is some discretion
There is quite a lot of discretion
There is full discretion
Figure 4.12 outlines some nationality effects regarding MNCs reporting full/a lot of discretion. UK and European MNCs have considerably more discretion in all areas, with US MNCs having relatively lower levels of discretion. MNCs located in the manufacturing sector report greater discretion in the allocation of rewards to all employees than firms in the service and multi-sector. This is consistent for general pay, variable pay and appraisal systems.

41
Figure 4.12 Discretion rewards by country of origin (foreign MNCs)
0%
10%
20%
30%
40%
50%
60%
70%
80%
Pay tomarket
comparators
Shareownership
Performanceappraisalmanagers
Performanceappraisal
LOG
Variable paymanagers
Variable payLOG
UK
US
Europe
Rest
Irish-owned MNCsAs depicted by figure 4.13 Irish MNCs afford relatively low levels of discretion to their foreign operations. This is particularly pronounced with regard to share ownership where 86 per cent of Irish MNCs afford no discretion to its foreign operations over this issue.
Figure 4.13 Discretion to decide financial rewards (Irish MNCs)
0%
10%
20%
30%
40%
50%
60%
70%
80%
90%
100%
Relating payto market
comparators
Shareownership
Performanceappraisalmanagers
Performanceappraisal LOG
Variable paymanagers
Variable payLOG
There is no discretion
There is a little discretion
There is some discretion
There is quite a lot of discretion
There is full discretion
Comparing the headquarter perspective (Irish-owned MNCs) and the subsidiary perspective (foreign-owned MNCs) regarding discretion there appears to be a consistent pattern. Subsidiaries of foreign-owned MNCs report low levels of discretion over policies to decide financial rewards; whilst senior management in Irish MNCs report that they afford low levels of discretion to their foreign operations over the same issues. This is particularly evident with regard to policies over share ownership schemes. These findings would suggest that policies regarding pay are centralised and thus MNCs are unwillingly to afford large amounts of autonomy to subsidiaries to make decisions over such issues.

42
ConclusionThis chapter looks at aspects of pay and performance management with a number of broad patterns emerging. MNCs tend to have a policy of ensuring that the pay levels of the key group are in the top or 2nd quartile. The vast majority of MNCs aim to have pay levels at or above the median/midpoint for all employees. Regular performance appraisal is common for the majority of employees in MNCs. Employee share ownership, profit sharing and share options are used by approximately one third of MNCs for each category of employees. Foreign MNCs tend to have considerable discretion in the area of pay policy, variable pay and performance appraisal.
Within these patterns there are important variations according to our ‘structural’ factors of nationality and sector. Nationality is associated with differences across a range of policies and above all with the degree of discretion. For example UK firms consistently aim to pay a greater proportion of employees in the top or 2nd quartile compared to other MNCs. Regular appraisal for the LOG and managers is highest in US MNCs followed by UK firms and is lowest in Irish firms. A greater proportion of US MNCs use forced distribution and peer appraisal for both the LOG and managers. US MNCs are more likely to use the three forms of financial incentives than others.
Key differences across sectors include MNCs in the service sector consistently aim to be in the 1st or 2nd pay quartile compared to MNCs in manufacturing or multi-sector. Regular appraisal is significantly more common for the LOG in the service sector. MNCs located in the manufacturing sector report greater discretion in the allocation of rewards to all employees.
In summary, while there are some differences across the three sectors, nationality has a more substantial impact. US MNCs are more likely to use regular performance appraisal and various reward mechanisms than other MNCs. In contrast, UK MNCs are more likely to aim to pay their LOG in the 1st or 2nd quartile. They also report higher levels of discretion in decisions on rewards and appraisal schemes.

43
CHAPTER 5
EMPLOYEE REPRESENTATION AND CONSULTATION
IntroductionThe area of employee representation in MNCs has been the subject of intense debate within Ireland (cf. Kelly and Brannick, 1985; Roche and Geary, 1996; Turner et al., 1997a&b; Geary and Roche, 2001; Turner et al., 2001). Yet despite the extant research on MNCs in Ireland, there is no overall, authoritative picture of the ways in which MNCs manage their employees (Mc Donnell et al., 2007). The literature suggests that MNCs from different countries of origin have distinct preferences with regard to collective employee representation structures. These preferences are said to derive from the existing national models of employee representation which prevail in their country of origin. American MNCs, for example, have displayed a distinct tendency not to engage with trade unions and collective bargaining (De Vos, 1981). Patterns of employee representation also tend to vary between industrial sectors (Roche and Turner, 1994; Gunnigle et al., 1997; Roche, 2001). For example, trade unions are more likely to be found in the manufacturing sector than in the service sector.
The European Union (EU) Directive on Information and Consultation (I&C) was transposed into Irish law in July 2006 and introduced on a phased basis thereafter. It establishes a right to information and consultation as follows: to undertakings with at least 150 employees from September 4, 2006; from March 23, 2007, to undertakings with at least 100 employees and from March 23, 2008, to undertakings with at least 50 employees. There has been some research on the I&C directive and the potential impact it may have on organisations in Ireland (Dundon, 2003; Geary and Roche, 2005; Dundon et al., 2006) but there has been no significant research to date on its actual impact. As a result of the current survey, it is now possible for us to provide a representative picture of how MNCs in Ireland are responding in this area of employment relations.
This chapter is organised into three sections. The first section deals with employee representation covering issues such as trade union recognition, union density, non-union structures and collective bargaining. The second section deals with employee consultation, examining the area of information and consultation and European Works Councils. The third section looks at the issue of MNC discretion and autonomy with regard to employee representation and consultation.
Trade union recognitionRespondents were asked if they recognised trade unions for the purposes of collective employee representation. Trade unions are recognised at one or more sites in 61 per cent of all MNCs operating in Ireland. This figure is much higher than findings in a parallel study in the UK (Edwards, et al., 2007) which found 47 per cent of MNCs recognised a trade union10. Breaking this down further, 29 per cent of MNCs recognised trade unions at all of their sites, 15 per cent at their sole Irish site, and 17 per cent at some or most of their sites. As depicted by figure 5.1, there is a discernible pattern of union recognition varying according to the country of origin of the MNC. MNCs from Ireland (83 per cent), the UK (80 per cent) and the rest of Europe (71 per cent) are much more likely to engage with trade unions whereas US MNCs (41 per cent) and MNCs from the rest of the world (43 per cent) are least likely to engage with trade unions. This is similar to the parallel study of MNCs in the UK which found that US MNCs were the least likely to recognise trade unions (Edwards et al., 2007). Sector also appears to be an explanatory variable with union recognition highest among MNCs in the manufacturing sector (75 per cent) and also MNCs operating in multiple sectors
10 This figure only relates to representation regarding the largest occupational group (LOG). That said, where unions are recognised the vast majority of members tend to be employees from the LOG.

44
(76 per cent), compared with 48 per cent of service sector MNCs recognising a trade union. This is also consistent with findings in the UK study, where union recognition is more than twice as common amongst manufacturing MNCs compared with those in services.
Figure 5.1 Trade union recognition by country of origin
0% 20% 40% 60% 80% 100%
UK
US
Europe
Rest
Irish
Total
No sites
Some sites
Most sites
All sites
The company's single irish site
Irish-owned MNCs were also asked if their foreign operations recognised unions for the purposes of collective employee representation. We find that Irish-owned MNCs are less likely to recognise unions in their foreign operations, compared with their Irish operations, with just over four in ten (41 per cent) Irish MNCs not recognising unions in their foreign operations (see figure 5.2). This low level of recognition amongst its foreign operations is in contrast to the high level of recognition in Ireland as outlined above.
Figure 5.2 Union recognition in foreign operations of Irish MNCs
0%
5%
10%
15%
20%
25%
30%
35%
40%
45%
No sites Some sites Most sites All sites
We also asked Irish MNCs about their policy towards trade union recognition in their foreign operations, see figure 5.3. A large majority (47 per cent) of Irish MNCs report that they expect their foreign operations to follow local practices, 16 per cent report that there is a policy not to recognise trade unions in their foreign operations, a further 16 per cent report there is a policy to recognise trade unions, whilst 21 per cent report there is no policy.

45
Figure 5.3 Irish MNCs foreign policy on trade union recognition
0%
5%
10%
15%
20%
25%
30%
35%
40%
45%
50%
There is no policy General policy not tobargain
Expect localmanagement to follow
local practice
General policy tobargain
Where trade unions are recognised, there appears to be a preference for recognising a single union with 44 per cent of all unionised MNCs recognising one union, compared with 28 per cent recognising two unions and 28 per cent recognising three or more unions. There appears to be a country of origin effect whereby 48 per cent of all foreign-owned MNCs recognise only one union compared with just 28 per cent of Irish MNCs. This is consistent with the literature suggesting foreign-owned companies’ preference for single union deals (Gunnigle, 1993). Fifty six per cent of MNCs operating in multiple sectors recognise one union compared with 44 per cent of service sector MNCs and 41 per cent of manufacturing MNCs.
We also find quite a high level of trade union density11 in MNCs with a majority (53 per cent of all MNCs) reporting that over half of their employees’ are members of a trade union, whilst more than a quarter of MNCs reported that 75 per cent or more of their employees’ are members of a trade union, see figure 5.4. Lower union density figures are reported amongst US MNCs where only 10 per cent of US MNCs have union density above 75 per cent. As anticipated, union density was much higher amongst MNCs in the manufacturing sector, with almost a third (31 per cent) having 75 per cent or more of their employees in trade union membership compared with 23 per cent in service sector MNCs and 22 per cent in multi-sector MNCs.
11 Not all MNCs are reporting for all Irish operations, a minority of MNCs only reported for a part or division only.

46
Figure 5.4 Trade union density
0%
5%
10%
15%
20%
25%
30%
0% 1-10% 11-25% 26-50% 51-75% 76-100%
MNCs that engage with a trade union were asked whether trade union representatives generally adopted a cooperative approach, an adversarial approach or if their approach depended on the issue. Almost half (49 per cent) of the respondents replied that it depends on the issue whilst 46 per cent reported a cooperative approach. Only 5 per cent reported that trade unions adopted an adversarial approach. UK MNCs were more likely to report a cooperative approach (67 per cent) whilst only 32 per cent of Irish MNCs reported a similar approach. Service sector MNCs were marginally more likely to report a cooperative approach (52 per cent), than manufacturing MNCs (43 per cent) and multi-sector MNCs (39 per cent).
Non-union structures of collective employee representationAll MNCs were asked if they had any non-union based structure(s) of collective employee representation, such as works committees or company councils. Just under a third (32 per cent) of MNCs indicated that they had some structure in place, with almost six in ten (59 per cent) MNCs indicating these structures had been established in the previous three years. This contrasts with existing Irish research which had indicated that employee consultative committees were quite rare in Ireland (Geary, 2006). MNCs from the US and also the rest of the world were marginally more likely to have these structures in place, which is in contrast to the UK findings where both these groups were the least likely to have such structures. Service sector MNCs were also marginally more likely to have such structures in place. As expected non-union structures were most common in MNCs which did not engage in union recognition, however, it was interesting that over a quarter of unionised MNCs (26 per cent) had such structures in place.
Combining both union and non-union structures almost a quarter (23 per cent) of all MNCs have neither union nor non-union structures in their organisation, see figure 5.5. 16 per cent have non-union only structures, 16 per cent have a hybrid model which includes both union and non-union structures, whilst 35 per cent of MNCs have union structures only. Similar to the results of the UK study, US MNCs are the least likely to have any form of representative structures. Irish and UK owned MNCs are much more likely to have union forms of collective employee representation. Manufacturing MNCs are much more likely to have union only representative structures in place, whilst MNCs operating in the service sector are the most likely to have non-union structures in place.

47
Figure 5.5 Union and non-union structures of representation by country of origin
0% 20% 40% 60% 80% 100%
UK
US
Europe
Rest
Irish
Total
Neither union or non-union
Non-union only
Hybrid: Both union & non-union
Most/some union only
Union at all/single site
Trade union recognition in new sitesThe issue of trade union recognition or avoidance in new sites established by existing companies has been an area of considerable interest (Hourihan, 1996; Higgins, 2004; Gunnigle et al., 2005). Gunnigle et al., (2005) point towards a recent phenomenon whereby hitherto unionised companies are establishing new sites on a non-union basis, or engaging in so called ‘double-breasting’ (cf. Beaumont and Harris, 1992). We investigated the existence of this phenomenon and asked MNCs that recognised trade unions if they had established any new sites (greenfield sites) in the past five years, and if so, did they recognise trade unions at these new sites. A total of 60 unionised MNCs had established a new site, with 42 per cent recognising trade unions in all of their new sites. This is higher than reported in a parallel survey in the UK where 30 per cent had recognised unions at each new site. A third (33 per cent) recognised unions at some of their new sites whilst a quarter (25 per cent) did not recognise unions at any of their new sites, which is lower than the 42 per cent reported in the UK survey (Edwards et al., 2007). Thus, while 33 per cent recognise unions at some of their new sites, by default this means they also do not recognise unions at some of their other new sites. Therefore seems that almost six in ten MNCs (58 per cent) are engaging in some form of double-breasting. As illustrated in figure 5.6, there is a strong country of origin effect. Irish (67 per cent) and UK MNCs (71 per cent) establishing operations on new sites are much more likely to recognise unions at each of their new sites. In contrast, US MNCs are least likely to recognise unions in their new sites with 57 per cent not recognising unions at any of their new sites. Furthermore MNCs operating in multiple sectors are the least likely to recognise unions in their new sites with 63 per cent reporting no recognition at new sites compared with 27 per cent and 16 per cent of manufacturing and service sector MNCs respectively.

48
Figure 5.6 Union recognition at new sites by country of origin
0% 20% 40% 60% 80% 100%
UK
US
Europe
Rest
Irish
Total
Yes at each new site
Yes at most new sites
Yes at some new sites
No at no new sites
All MNCs were asked if they had acquired any new sites in Ireland over the previous five years. Those MNCs that had acquired new sites were asked whether the acquired sites were unionised or not. A total of 70 MNCs reported that they had acquired sites over the past five years. Over half (52 per cent) of MNCs reported they acquired non-union only sites against 29 per cent acquiring unionised sites and 19 per cent acquiring both unionised and non-unionised sites. A follow up question was asked as to whether or not there had been any changes at the acquired site regarding union recognition. For example, in the case of sites acquired by non-union firms we investigated whether union recognition has been introduced or whether the site remained non-union. Our findings indicate that almost all MNCs (95 per cent) reported no change in the union status of the acquired sites. A small number of MNCs (5 per cent) introduced union recognition in the acquired sites, with no MNC reporting the withdrawal of union recognition. Thus, we find no evidence of union de-recognition among MNCs in Ireland. We also find evidence that non-union MNCs are much more likely to acquire non-union sites, whereas there is a much more mixed pattern concerning unionised MNCs.
In regard to country of origin, we find that US MNCs are more likely to acquire non-union sites, with 72 per cent of their acquired sites being non-union. As depicted by figure 5.7, MNCs operating in the manufacturing sector are only slightly more likely to acquire unionised sites than non-unionised sites. MNCs operating in the service sector and operating in multiple sectors are much more likely to acquire non-unionised sites. Thus the impact of sector appears to be significant in explaining patterns of trade union representation in acquired sites.

49
Figure 5.7 Acquisition of new sites by sector
0%
10%
20%
30%
40%
50%
60%
70%
Manufacturing Services Multi-sector
Acquired both union and non-unionsites
Acquired non-union only sites
Acquired all unionised sites
Collective bargainingMNCs that recognise unions were asked what percentage of their largest occupational group (LOG) were covered by collective bargaining arrangements. Almost seven in ten MNCs (69per cent) reported that over three quarters of their LOG were covered by such arrangements. As illustrated by figure 5.8 the coverage of collective bargaining is higher amongst Irish, UK and European MNCs. Almost eight in ten manufacturing MNCs (79 per cent) have collective bargaining coverage greater than 75 per cent compared with 57 per cent amongst service sector MNCs and 63 per cent of MNCs operating in multiple sectors.
Figure 5.8 Coverage of collective bargaining by country of origin (Union only)
0% 20% 40% 60% 80% 100%
UK
US
Europe
Rest
Irish
Total
0%
1-10%
11-25%
26-50%
51-75%
76-100%
The determination of pay increasesRespondents in unionised MNCs were shown a number of agreements or procedures that are used for the determination of pay increases. They were then asked which of these agreements/procedures were used in their operation(s) for both the management and the LOG. As depicted in figure 5.9, the most popular method of pay determination for managers was that of “individual” whilst for the LOG it was “national level collective bargaining”. However, the use of national level collective bargaining was also quite high for managers. With regard to sector, 92 per cent of manufacturing MNCs reported that they used national

50
level collective bargaining for their LOG, against 67 per cent of service sector MNCs and 61 per cent of multi-sector MNCs.
Figure 5.9 Agreements or procedures used for the determination of pay increases
0%
10%
20%
30%
40%
50%
60%
70%
80%
90%
Managers LOG
National Level Collective Bargaining
Industry Level Collective Bargaining
Company/division
Establishment/site
Individual
Other
Where “national level collective bargaining” is used MNCs were asked about their policy towards the national agreements (see figure 5.10). A high proportion of MNCs reported that they follow closely the terms of the agreement for both managers (76 per cent) and their LOG (81 per cent). Almost a quarter (24 per cent) of MNCs that use “national level collective bargaining” to determine pay increases for managers pay somewhat above the terms of the agreement, compared with 17 per cent for the LOG. Just 2 per cent of MNCs using “national level collective bargaining” for the LOG reported that they paid somewhat below the terms of the agreement. Overall, this suggests that the great majority of MNCs in Ireland adhere to the pay terms of national agreements for their LOG, a theme consistent with Gunnigle et al.,(2005) case based findings which point to a general decrease in the extent to which MNCs significantly exceed the terms of national agreements.
Figure 5.10 The use of national level collective bargaining agreements (Union only)
0%
10%
20%
30%
40%
50%
60%
70%
80%
90%
Follow closely the termsof agreement
Paid somewhat above theterms
Paid somewhat below theterms
Managers
LOG
UK MNCs are more likely to pay somewhat above the terms of the agreements for their managerial staff only. MNCs operating in the services and multi-sectors are also more likely to pay above the norm for its managerial staff only.

51
We also investigated the impact of national level pay (partnership) agreements on non-union MNCs. Six in ten non-union MNCs reported that the national agreements had some influence on pay decisions regarding the LOG and almost half (48 per cent) on pay decisions with regard to managers.
As depicted by figure 5.11, those MNCs that reported national agreements as having an influence are much more likely to pay somewhat above the terms of the agreement, with 59 per cent of all managers being paid above the norm and 55 per cent of LOG likewise. Thus what we find is that non-union MNCs are much more likely to pay above the terms of national agreements than unionised MNCs. This trend is consistent with existing case study research which suggested that non-union MNCs use the national agreements as external benchmarks for pay increases and often pay above the average level of increase contained in the agreements (Collings et al., forthcoming).
Figure 5.11 The use of national level collective bargaining agreements (Non-union only)
0%
10%
20%
30%
40%
50%
60%
70%
Follow closely the termsof agreement
Paid somewhat above theterms
Paid somewhat below theterms
Managers
LOG
UK MNCs are less likely to pay above the norm for their managerial staff (33 per cent) compared with US (65 per cent), European (50 per cent), rest of world (75 per cent) and Irish (71 per cent) and also for their LOG, UK (20 per cent), US (57 per cent), European (50 per cent), rest of world (80 per cent) and Irish (63 per cent).
Employer AssociationsAn overwhelmingly majority (92 per cent) of MNCs are members of an employer association, with IBEC (86 per cent of all MNCs) being the preferred choice of the great majority. However, manufacturing MNCs are much more likely to be a member of IBEC with 94 per cent of MNCs a member compared with 80 per cent of service sector MNCs and 84 per cent of multi-sector. We also find that 96 per cent of unionised MNCs are a member of an employer association versus 85 per cent of non-union MNCs. This would suggest that non-union MNCs are almost as likely to be a member of an employer association (a trade union for employers) as unionised MNCs.
Information and ConsultationRespondents were asked about the management approach to the area of information and consultation. As depicted by figure 5.12, just over a third of MNCs (34 per cent) claimed to provide “information somewhat beyond that required” with a 33 per cent providing information considerably beyond that required and 12 per cent providing information far beyond that required.

52
Figure 5.12 Provision of information and consultation
0%
5%
10%
15%
20%
25%
30%
35%
40%
Minimal inforequired forcompliance
Info slightlybeyond that
required
Infosomewhat
beyond thatrequired
Infoconsiderablybeyond that
required
Info farbeyond that
required
Given the recent transposition of the Information and Consultation Directive in Ireland, respondents were asked if this directive had prompted any changes in arrangements for employee consultation. Forty two per cent of all MNCs reported that indeed the directive had prompted changes in arrangements for employee consultation. Only 19 per cent of Irish MNCs reported changes compared with 30 per cent of UK MNCs, 55 per cent of US MNCs, 43 per cent European MNCs and 57 per cent of rest of world MNCs.
European Works CouncilsAlmost four in ten MNCs (39 per cent) have a European Works Council (EWC) in place, greater than that reported in the parallel survey in the UK which found a EWC present in 28 per cent of cases. As depicted by figure 5.13, European MNCs are more likely to have anEWC (57 per cent) with Irish MNCs the least likely to have a EWC (17 per cent).
Figure 5.13 European Works Councils (EWC) by country of origin
0%
10%
20%
30%
40%
50%
60%
70%
80%
90%
UK US Europe Rest Irish Total
Yes
No
MNCs operating in the service sector were the least likely to have a EWC (28 per cent). Those MNCs that did not have a EWC in place were asked if they anticipated one being

53
established in the future, just 21 per cent indicated that they felt there would be one established.
Those MNCs which reported the presence of a EWC were asked about the nature of the EWC structure. As depicted by figure 5.14, almost seven in ten (69 per cent) provide information somewhat beyond that required or greater, with 27 per cent providing information considerably beyond that required and only 7 per cent providing information far beyond that required. Both Irish and European MNCs are less likely to provide information somewhat beyond that required or greater when compared to UK, US and rest of world MNCs. Service sector MNCs provided slightly less information than MNCs operating in the other two sectors.
Figure 5.14 Provision of information and consultation with European Works Council
0%
5%
10%
15%
20%
25%
30%
35%
40%
Minimal inforequired forcompliance
Info slightlybeyond that
required
Info somewhatbeyond that
required
Info considerablybeyond that
required
Info far beyondthat required
Discretion over employee representation and consultation policyThis section investigates the level of discretion afforded to local management in foreign-owned MNCs and also the level of discretion afforded by management in Irish MNCs to their foreign operations in relation to the determination of employee representation and consultation policy. More specifically we explore discretion over trade union recognition, union involvement in decision-making (where applicable) and employee consultation.
Foreign-owned MNCsHigh levels of discretion over all three measures were reported, as depicted in figure 5.15. Only with regard to trade union recognition do we see some MNCs reporting comparatively lower levels of discretion. US MNCs are likely to have slightly less discretion over the three measures, especially over trade union recognition.

54
Figure 5.15 Discretion of foreign-owned subsidiaries
0%
10%
20%
30%
40%
50%
60%
Trade unionrecognition
Union involvementDecision
EmployeeConsultation
There is no discretion
There is a little discretion
There is some discretion
There is quite a lot of discretion
There is full discretion
There is no typical situation
Irish-owned MNCsIrish-owned MNCs were asked to what extent they afford discretion to their foreign subsidiaries over the same measures. This was asked in order to provide a headquarter perspective. As depicted by figure 5.16, Irish-owned MNCs appear to afford low levels of discretion over the same three policy areas to their foreign subsidiaries, particularly with regard to union recognition.
Figure 5.16 Discretion afforded to foreign subsidiaries of Irish-owned MNCs
0%
5%
10%
15%
20%
25%
30%
35%
Trade unionrecognition
Union involvementDecision
EmployeeConsultation
There is no discretion
There is a little discretion
There is some discretion
There is quite a lot of discretion
There is full discretion
There is no typical situation
What is interesting is the contrast between the headquarter perspective (Irish MNCs) and the local operations perspective (foreign MNCs), as noted in both figures 5.15 and 5.16. On the one hand, the Irish operations of foreign-owned MNCs report high levels of discretion/autonomy whilst senior management in the headquarters for Irish MNCs report that they afford low levels of discretion to their foreign subsidiaries. So how do we reconcile these differences between the two perspectives? Is it the case that subsidiaries are over estimating their autonomy with regard to employment relations? Or perhaps managers at headquarter level are reporting higher levels of control than there actually is? The extant literature suggests that there is a high level of devolvement of HRM to the local level (Rosenzweig and Nohria, 1994), particularly with regard to employee representation (Ferner, 1997). Furthermore Gunnigle et al., (2005) note that decisions regarding trade union recognition at

55
newer sites of US MNCs operating in Ireland were taken or driven by local management, albeit in the knowledge that corporate headquarters would be in favour of the decision.
ConclusionThis chapter has reviewed the findings on employee representation and consultation in both foreign and Irish-owned MNCs operating in Ireland. What we find is that MNCs operating in Ireland are reporting relatively high levels of union engagement, with evidence of country of origin and sectoral effects. For example, we find high levels of trade union recognition amongst Irish, UK and European MNCs but low levels of recognition among US MNCs. Furthermore, manufacturing MNCs have a much higher propensity to recognise unions than MNCs operating in the service sector. Whilst Irish MNCs report high levels of union recognition in Ireland, we identify a very different story abroad with a large number of Irish MNCs reporting non-recognition of unions in their foreign operations. Coupled with high levels of union recognition, we also find union density figures to be quite high. High collective bargaining coverage is also reported with it being highest in Irish, UK and European MNCs. There is also a sectoral effect with it being high amongst manufacturing MNCs. We also provide evidence of innovations with regard to collective employee representation in MNCs in Ireland. Firstly, we see a growth in non-union structures of employee representation, particularly over the past three years. Secondly, we find evidence of ‘double-breasting’, particularly among US MNCs. In terms of pay determination, a significant majority of MNCs use national level collective bargaining for the LOG and individual mechanisms for their managerial staff. Concentrating on the influence of national level agreements on pay in MNCs we find differences between unionised and non-unionised MNCs. Unionised MNCs are much more likely to follow the terms of these national agreements whereas non-unionised MNCs are more likely to report paying above the terms of the agreements.
With regard to information and consultation, MNCs in Ireland report high levels of information and consultation provision, with almost half reporting that the Information and Consultation Directive had initiated changes in employee consultation in their organisation. A significant minority of MNCs also reported having a European Works Council (EWC) in place, again with a discernible country of origin effect.
Looking at management discretion in employment relations, we find an interesting contrast between subsidiary and headquarter perspectives. Among subsidiaries of foreign-owned MNCs in Ireland, respondents reported high levels of discretion/autonomy over employee representation and consultation. In contrast, the headquarter perspective provided by respondent in Irish-owned MNCs suggests that their foreign operations are afforded low levels of discretion/autonomy.
In conclusion, whilst we find relatively high levels of union recognition, union density and collective bargaining coverage, our findings suggest significant innovations in the area of employee representation and consultation.

56
CHAPTER 6
EMPLOYEE INVOLVEMENT AND COMMUNICATION
IntroductionThere has been considerable interest over the last 20 years in systems of employee involvement such as teamwork and methods for directly communicating with employees (Edwards et al., 2002). In an Irish context direct forms of involvement have been favoured by the main Irish employer’s organisation the Irish Business and Employers Organisation (IBEC) and have been cited as examples of the development of partnership at the enterprise level (IBEC, 1999). This partnership, however contrasts with the representative form of workplace partnership promoted by the trade union movement in Ireland. It is direct rather than representative and is often task-based (Roche and Geary, 2002). Previous studies have indicated an increase of direct and task-based forms of employee involvement. On greenfield sites Gunnigle (1995), found a pronounced management focus on more direct communications with individual employees with the purpose of informing employees of “market realities” as perceived by management. Gunnigle further notes that this direct communication was greatest in private sector companies (see Wallace et al., 2004). That this is part of a trend is shown by the Cranfield-University of Limerick (CUL) surveys which trace a major growth in direct communication with employees over the course of the decade (Morley et al., 2001). There is less consensus on the incidence of team working. Geary (1996) suggests that by the mid-1990s team working was not extensive. Geary (1998) notes that the Employee Direct Participation in Organisational Change (EPOC) study reported ‘temporary groups’, particularly project groups or task forces, were found in 36 per cent of firms while ‘permanent groups’ such as quality circles were present in 28 per cent of firms see (for further details see European Foundation for the Improvement of Living and Working Conditions, 1997. In contrast an IBEC (1999) survey reported that team working was the most extensive form of new work organisation and was present in 63 per cent of respondent companies. Part of the difficulty in establishing the extent of team working may relate to the definition of what constitutes team working, as informal problem solving may be classified as teams by respondents (see Cully et al., 1999). In order to limit terminological confusion we asked questions about the existence of both formally designed teams and problem solving groups.
This chapter will focus on a number of elements of employee involvement and communication. Namely it will look at team working, mechanisms of communication employed in MNCs in Ireland, the types of information provided to employees and finally discretion over such policies.
Team workingWhile it has been accepted that there is a growth in direct employee involvement there is uncertainty over the full extent of such schemes in MNCs today and the role they play in transferring relevant practices. In particular, it is suggested that American MNCs place particular emphasis on the use of innovative forms of communication thus leading their diffusion (Elger and Smith, 2005). We therefore assess whether there are country of origin differences in relation to involvement and communication. We begin by looking at problem solving groups and teams and then turn to arrangements for communication and the provision of information.
Problem solving groups were the most common form of direct involvement being present in 74 per cent of firms. The incidence of formally designed teams was lower at 55 per cent (figure 6.1). In the parallel UK survey, some 77 per cent of companies reported having problem solving groups – a figure comparable to the Irish one. However, a much higher proportion (73 per cent) reported having formally designed teams – some 18 percentage points more than in Ireland. Thus, the reported use of teams, by all MNCs operating in

57
Ireland, is substantially less than in the UK. While lower than the UK figure, the reported incidence of team working is greater than that reported by the Employee Direct Participation in Organisational Change (EPOC) study (see European Foundation for the Improvement of Living and Working Condition, 2007). The higher figure in this survey is likely to be due to a higher use of team working in foreign companies. Although one cannot rule out some growth in their usage among non-MNC Irish companies since the EPOC study, the comparatively low use of team working in Irish MNCs noted in figure 6.2 suggests this is not likely to be of great significance. If team working is low among Irish MNCs, it is likely to be even lower among Irish companies generally.
Figure 6.1 Forms of Employee Involvement
0%
10%
20%
30%
40%
50%
60%
70%
80%
Problem solving groups Formally designated teams Other form of involvement
There was a substantial degree of variation in the use of problem solving groups and teams across county of origin. Thus at one end of the scale, 84 per cent of American MNCs had problem solving groups, compared to 57 per cent in the UK study (figure 6.2). Despite impressions to the contrary, formally designed teams were not more likely to be present in US companies. The rest of the world (69 per cent) followed by the UK (57 per cent) and rest of Europe (56 per cent) all reported greater usage than the 55 per cent US figure. Only Irish MNCs (46 per cent) reported a lower usage of teams. There was also a marked variation in the sectoral usage of problem solving groups, with 83 per cent of manufacturing companies having them as against 66 per cent in the service sector. However, there was a slightly greater use of formally designed teams in the service sector (56 per cent) as against manufacturing (51 per cent).

58
Figure 6.2 Presence of formally designed teams/problem solving groups by country of origin
0%
10%
20%
30%
40%
50%
60%
70%
80%
90%
100%
Irish UK US Europe Rest
Problem solving groups
Formally designed teams
In order to test the extent of intra-firm uniformity/diversity in practices, respondents in firms with several sites in Ireland (possessing any form of involvement) were asked which of the following applied (with percentages given for each category of responses in brackets below):
• An identical or similar pattern exists across all or most sites (52 per cent). • All or most sites have involvement systems, but they differ from site to site (34 per
cent).• Some sites have involvement systems while others do not (14 per cent).
These results indicate that just over half of the firms have a common approach to involvement across different sites, with a third having involvement which differs from site to site. Dual systems, where some sites have forms of involvement while others have none, are comparatively uncommon - being found in only 14 per cent of respondent organisations. In summary, while there is evidence of a spread of different forms of involvement within firms, the presence of involvement in some parts of the organisation is associated with the same or different forms of involvement in 86 per cent of cases. This is indicative of a strong degree of transference of systems within organisations.
Mechanisms of communicationFigure 6.3 below contains the responses on the most common forms of communication in descending order of their presence. These vary between mechanisms that are likely to involve the one-way communication of information by management, while others involve a two-way process of communication such as meetings. Questions on communication flow from employees to management, in the form of opinion and attitude surveys, were also asked. Not surprisingly the most common mechanism is meetings between line managers and employees with 98 per cent reporting such activities. The use of newsletters and email to communicate information is the next most common mechanism, followed by the systematic use of the management chain. Attitude or opinion surveys are less common, used by two-thirds of firms, whilst suggestion schemes were present in only 55 per cent of companies.

59
Figure 6.3 Presence of differing forms of communication
0%
20%
40%
60%
80%
100%
Mee
tings
line
mgt
.&
em
ploy
ees
New
slet
ters
/em
ails
Sys
tem
atic
use
of
mgt
. cha
in
Com
pany
Intr
anet
Mee
tings
mgt
. &w
hole
wor
kfor
ce
Atti
tude
/opi
nion
surv
eys
Sug
gest
ion
sche
mes
Oth
er
There was a high level of usage of the first three categories across all countries as shown in table 6.1. Multinationals from the US had a high usage of the following four mechanisms –Intranet, meetings between management and whole workforce, attitude/opinion surveys and suggestion schemes. In comparison Irish MNCs made the least use of all of these four mechanisms. Previous research had suggested that US firms give particular emphasis to open door policies and to attitude surveys, which are sometimes seen as a reflection of sophisticated ‘welfare capitalist’ policies (Jacoby, 1997). Our findings do suggest that American companies make high usage of attitude and opinions surveys. Eighty-three per cent of US companies report having such schemes, by comparison with 71 per cent of UK companies and 59 per cent of rest of Europe. However, the group with the highest usage was the rest of world category with 93 per cent usage. Suggestion schemes were used in 59 per cent of US companies, 49 per cent of UK companies 52 per cent the rest of Europe and 79 per cent for the rest of world. In particular there was a dramatic difference in the use of attitude and opinion surveys between Irish MNCs and all foreign MNC groupings. Only one-third of Irish firms reported using these while the corresponding figure for foreign companies as a whole was 74 per cent.
Differences across sectors were minimal – with the usage of forms of communication being virtually identical in services and manufacturing. The most notable differences were the slightly higher utilisation of meetings between management and the whole workforce in manufacturing (79 per cent) as against services (72 per cent) and a higher usage of a company Intranet in services (83 per cent) as against manufacturing (69 per cent).

60
Table 6.1 Presence of forms of communication by country of origin
Communication mechanisms Irish UK US Europe RestMeetings between line managers & employees
96% 97% 98% 98% 100%
Newsletters/emails 89% 91% 94% 97% 100%Systematic use of management chain 87% 91% 87% 87% 86%Company Intranet 66% 77% 84% 76% 86%Meetings management &whole workforce 62% 77% 90% 63% 79%Attitude/opinion surveys 33% 71% 83% 59% 100%Suggestion schemes 46% 49% 59% 52% 79%
Comparative importance of communication mechanismsThe issue of the relative importance of differing communications mechanisms is of particular importance in assessing the welfare capitalism thesis. If attitude and opinion surveys are regarded as important then this would support the thesis. However, this was not the case. The more traditional mechanism of meetings between line managers and employees was considered the most important mechanism by a majority (52 per cent) of respondents (figure 6.4). This was followed by meetings between senior management and the whole workforce –19 per cent of respondents considering these most important - newsletters and emails and systematic use of management chain were in joint third place with just 8 per cent nominating these categories (figure 6.4). A company Intranet was next - considered the most important by seven per cent of respondents. Only three respondents considered attitude and opinion surveys as the most important and no respondent mentioned suggestion schemes. This contrasts with the UK results where in the parallel survey some nine per cent of firms said that suggestion schemes, attitude surveys and open door were the most important communication mechanism. Even this nine per cent represented a low level. Commenting on these results Edwards et al. (2007: 69-70) conclude “that mechanisms such as attitude surveys and open door schemes, which are sometimes seen as the more ‘sophisticated’ two-way communication mechanisms, receive relatively little emphasis”.
In summary, while the greater use of attitude and opinion surveys by MNCs, particularly US companies, lends some support to the welfare capitalist thesis, the limited importance attached to them suggests a somewhat different picture. While in the UK survey two American firms said that they put particular weight on these mechanisms in our survey no one identified attitude/opinion survey and suggestion schemes as the most important mechanism for communication. The greater breadth of the present survey by comparison with previous studies, which were based on limited numbers, indicates such mechanisms do not have the importance as previously suggested.

61
Figure 6.4 Most important mechanisms for involvement
0%
10%
20%
30%
40%
50%
60%
Mee
tings
line
Mgt
.&
ees
Mee
tings
sen
ior
mgt
. & w
hole
wor
kfor
ce
New
slet
ters
/em
ails
Sys
tem
atic
use
mgt
. cha
in
Com
pany
intra
net
Atti
tude
/opi
nion
surv
eys
Sug
gest
ion
sche
mes
Oth
er
Information communicatedIt is not just the mechanisms of communication that are important but the information communicated. Figure 6.5 contains details of the type of information communicated. In general respondents indicated that a large percentage of companies (73 per cent) provide information on the financial position of the company in Ireland but a somewhat lower percentage provide information on investment (62 per cent) and staffing plans in Ireland (59 per cent).
Figure 6.5 Type of information communicated to employees
0%
10%
20%
30%
40%
50%
60%
70%
80%
Financial position ofcompany in Ireland
Investment plan of thecompany in Ireland
Staffing plan for thecompany in Ireland
The country of origin breakdown indicates that a larger proportion of the American companies provide information on the financial position of the company worldwide and on investment plans in Ireland than the other groupings (figure 6.6). A much smaller proportion of Irish MNCs (36 per cent) provide information on investment plans in Ireland than MNCs from other countries. However, in contrast a greater proportion of Irish MNCs provide information on staffing plans in Ireland. Thus 36 per cent of Irish companies reported providing information on staffing plans in Ireland compared to only 22 per cent of US and

62
Rest of Europe MNCs and this fell to 17 per cent for UK firms and 15 per cent for the “Rest” category.
Figure 6.6 Financial information provided to employees on specified topics by country of origin
0%
10%
20%
30%
40%
50%
60%
70%
80%
90%
Irish UK US Europe Rest
Financial information providedw orld w ide
Investment plans in Ireland
Staffing plans in Ireland
For foreign MNCs operating in Ireland the level of information they provide on worldwide investment plans is significantly less than on Irish investment and this most likely reflects the greater immediacy that Irish information has for Irish employees. However there are variations across countries, with nearly 50 per cent of US MNCs providing information on investment plans worldwide in contrast to some 35 per cent of UK firms and 23 per cent for the rest of world MNCs.
Figure 6.7 Information on investment plans worldwide (foreign MNCs only)
0%
10%
20%
30%
40%
50%
60%
UK US Europe Rest
There was no major difference between manufacturing and services in relation to the provision of information on the financial position of the company in Ireland. However, a

63
much higher proportion of manufacturing companies (79 per cent) provided information on the investment plans of the company in Ireland than did services (51 per cent). This also held true for staffing plans in Ireland where 66 per cent of manufacturing companies provided this information as against 51 per cent of service companies.
Figure 6.8 Provision of information on the company in Ireland
0%
10%
20%
30%
40%
50%
60%
70%
80%
90%
Manufacturing Services Multi-sector
Financial position of company inIreland
Investment plans in Ireland
Staff ing plans of the company inIreland
Discretion over employee involvement and communication policyThis section investigates the level of discretion afforded to local management in foreign-owned MNCs and also the level of discretion afforded by management in Irish MNCs to their foreign operations in relation to the determination of employee involvement and communication policy. More specifically we explore discretion over the involvement of employees in the work process, attitude or opinion surveys and suggestion schemes (where applicable), and the provision of information to employees.
Foreign-owned MNCsThe results of this survey indicates that in the vast majority of instances local branches of MNCs operating in Ireland consider they have either total or wide discretion in the task based aspects of employee involvement in work processes and suggestion schemes. Discretion is also reported to be high in the provision of information to employees – 81 per cent of respondents reporting there was full or quite a lot of discretion and only 4 per cent reporting little or no discretion. This high degree of discretion corresponds to the high levels of discretion perceived to exist over employment relations issues reported in chapter five. The high levels of discretion may reflect the fact that direct forms of communication and involvement are within management control and are largely non-controversial. Thus there are high levels of discretion over meetings, which are likely to deal with task related matters and be relatively standard practice. Greater limitations are placed on discretion where attitude and opinion surveys are involved and this may be due to companies conducting mandatory cross-national surveys within the organisation, although in some instances the conducting of such surveys may be potentially more controversial and require higher level authorisation.

64
Table 6.2 Discretion to local management in Ireland over employee involvement issues - foreign MNCs
Full Discretion
Quite a lot of discretion
Some discretion
Little/no discretion
Employee involvement in work processes
61% 26% 9% 4%
Provision of information to employees
50% 31% 15% 4%
Suggestion schemes12 57% 32% 7% 5%Attitude /opinion surveys13
27% 19% 14% 40%
Irish-owned MNCsOverall, Irish managers reported their overseas operations have somewhat less discretion than that reported by managers of foreign operations in Ireland. Thus, lower discretion is reported in the areas of work process involvement, the provision of information and the use of suggestion schemes. However, the differences are not great and there is a considerable degree of similarity in responses of home and host country managers. The Irish responses confirm a generally high level of discretion afforded overseas operations in the areas of employee involvement in work processes and the use of suggestion schemes. Local organisations are also considered to have lower discretion in the area of attitude and opinion surveys14. Thus the general impression of high levels of discretion reported by managers of foreign MNCs in Ireland is substantially mirrored by the responses of managers of Irish MNCs in relation to their overseas operations. It is however less than that which managers in foreign MNCs perceive they have. As discussed in chapter five this may be due to Irish MNCs affording somewhat lower levels of discretion to their foreign subsidiaries or it may be due to managers in foreign MNCs in Ireland considering their discretion levels are higher than they are or a combination of both effects.
Table 6.3 Discretion Irish MNCs afford its foreign subsidiaries over employee involvement issues
Full Discretion
Quite a lot of discretion
Some discretion
Little/no discretion
Employee involvement in work processes
39% 27% 12% 22%
Provision of information to employees
32.5% 27.5% 17.5% 22.5%
Suggestion schemes15 41% 18% 12% 29%Attitude/opinion surveys16 21% 36% 7% 36%
ConclusionThis chapter summarises the reported incidence of direct communication and involvement mechanisms used by MNCs in Ireland. In general there is a comparatively high usage of such mechanisms. Problem solving groups are present in nearly three-quarters of companies and these were the most common form of direct involvement. By contrast formally designed
12 Only asked of those with such schemes.13 Ibid14 There were 40 respondents to the employee involvement in work processes question and only 17 to the question on suggestion schemes. 15 Only asked of those with such schemes.16 Ibid
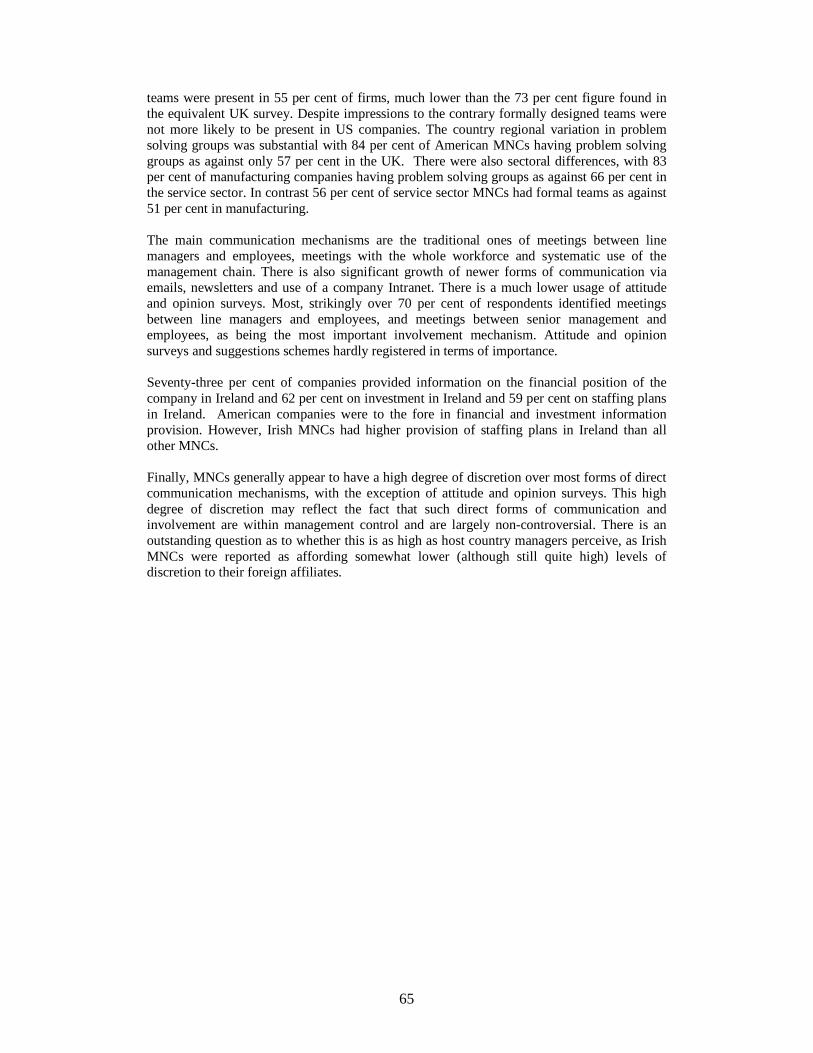
65
teams were present in 55 per cent of firms, much lower than the 73 per cent figure found in the equivalent UK survey. Despite impressions to the contrary formally designed teams were not more likely to be present in US companies. The country regional variation in problem solving groups was substantial with 84 per cent of American MNCs having problem solving groups as against only 57 per cent in the UK. There were also sectoral differences, with 83 per cent of manufacturing companies having problem solving groups as against 66 per cent in the service sector. In contrast 56 per cent of service sector MNCs had formal teams as against 51 per cent in manufacturing.
The main communication mechanisms are the traditional ones of meetings between line managers and employees, meetings with the whole workforce and systematic use of the management chain. There is also significant growth of newer forms of communication via emails, newsletters and use of a company Intranet. There is a much lower usage of attitude and opinion surveys. Most, strikingly over 70 per cent of respondents identified meetingsbetween line managers and employees, and meetings between senior management and employees, as being the most important involvement mechanism. Attitude and opinion surveys and suggestions schemes hardly registered in terms of importance.
Seventy-three per cent of companies provided information on the financial position of the company in Ireland and 62 per cent on investment in Ireland and 59 per cent on staffing plans in Ireland. American companies were to the fore in financial and investment informationprovision. However, Irish MNCs had higher provision of staffing plans in Ireland than all other MNCs.
Finally, MNCs generally appear to have a high degree of discretion over most forms of direct communication mechanisms, with the exception of attitude and opinion surveys. This high degree of discretion may reflect the fact that such direct forms of communication and involvement are within management control and are largely non-controversial. There is an outstanding question as to whether this is as high as host country managers perceive, as Irish MNCs were reported as affording somewhat lower (although still quite high) levels of discretion to their foreign affiliates.

66
CHAPTER 7
TRAINING, DEVELOPMENT AND ORGANISATIONAL LEARNING
IntroductionMany commentators argue that one of the principal means firms can achieve differentiation and sustainable competitive advantage is through the effective management and development of their staff (Lowe et al., 2002, Caligiuri et al., 2005). However training and development is often merely used as an exercise in organisation rhetoric, for example, ‘people are our greatest asset and that is why we invest extensively in them’ (Grugulis, 2007). The structure and content, as well as the impact, of training and development in organisations can vary widely. Arguably an organisation’s human capital takes on greater importance in MNCs due to the increasingly global and competitive business environment in which they operate. Scullion and Collings (2006) suggest that MNCs are increasingly introducing mechanisms aimed at developing their key human talent. This is largely due to shortages of internationally competent managers which is believed to impede the implementation of international business strategies (Scullion and Starkey, 2000).
This chapter explores training and development practices of MNCs in Ireland, focusing specifically on five key areas:
� The financial outlay on the training and development of the workforce. � Whether MNCs have localised or globalised succession planning systems and
management development programmes, if any, in place. � The mechanisms utilised to develop senior managerial talent. � The practices used to facilitate organisational learning and knowledge diffusion
between subsidiaries.� The level of discretion subsidiaries have over crucial training and development policy
areas.
More generally we consider whether MNCs are treating their human capital as a global or local resource as well as illustrating the training and development and organisational learning pattern employed by MNCs in Ireland.
Training and development expenditureRespondents were asked what percentage of the annual pay bill was spent on training and development (T&D) for all employees over the past twelve months. This is used as a measure to indicate the extent to which the firm’s human resources are regarded as an investment central to organisational success. Reliable data on this type of expenditure are not easy to come by in some companies due in no small part to the complex structures of organisations (Heraty and Morley, 2003; Edwards et al., 2007). This proved to be the case in a number of organisations with some respondents unable to even provide a range of training and development expenditure. One should also note that this figure is not ideal as it may fail to accurately capture the ‘real’ training activity in the organisation, as informal learning is excluded. However, this measure is particularly useful in comparing relative levels of investment between organisations. Furthermore, when combined with other training and development indicators, it is useful for providing insights into similarities, or differences, in how MNCs approach training and development overall (Edwards et al., 2007).
The findings show a mixed picture in terms of spending on training and development. Most respondents (57 per cent) categorised their training expenditure in the “greater than 1 per cent but less than 4 per cent” range. This was followed by 23 per cent of MNCs indicating they spent “greater than 4 per cent” of their annual pay bill on training and development in the past

67
year, while a further 20 per cent indicated a spend of “up to 1 per cent”. Although not directly comparable, these findings tend to corroborate recent research on training and development expenditure in organisations in Ireland. The 2003 CIPD National Survey of Benchmarks (Garavan et al., 2003) found average training and development expenditure as a percentage of payroll was 3.85 per cent.
We found relatively minor variations between indigenous and foreign-owned MNCs. For example, foreign-owned MNCs were found to be the highest investors in their workforce with 25 per cent indicating they spent in “excess of 4 per cent”, as compared to 17 per cent of indigenous firms. One possible explanation for this may be the greater percentage of indigenous MNCs operating in more low technology sectors.
Figure 7.1 Average training & development expenditure by country of origin
0%
20%
40%
60%
80%
100%
UK US Irish Europe Rest
> 4%
1 - 4%
0 - 1%
Some interesting findings emerged in relation to the T&D spend of MNCs according to country of origin (see figure 7.1). The biggest spenders, i.e. those with T&D spend of more than 4 per cent, were the US MNCs (27 per cent) followed by the UK and European MNCs (both 23 per cent). However one can conclude that the differences are not very substantial. In the UK study, US-owned MNCs were found to have the fourth highest T&D spend, German, French and British MNCs were the highest T&D investors (Edwards et al., 2007). In this study both French and German MNCs are incorporated in our ‘Europe’ category. Thus our findings are quite consistent with the UK context. Due to the relatively widespread recognition that national variations in training and development exist, finding differences between MNCs of different nationalities is not surprising. For example, German firms are believed to be some of the largest investors (Mabey and Ramirez, 2004), largely due to German vocational system of work and German firms’ focus on product differentiation (Edwards et al., 2007). International research suggests that firms may transfer their training systems across their operations (Solomon, 1995), thus one may expect a nationality effect.
A greater proportion of multi-sector MNCs (43 per cent) reported spending in excess of 4 per cent on T&D activities than either manufacturing MNCs (16 per cent) or service MNCs (25 per cent).

68
Succession planningWe now consider the extent to which MNCs, both foreign and Irish-owned, employ succession planning and whether such a system is global or local in character. By their very nature, MNCs straddle more than one nation; as such the potential talent a firm has stems across more than their home border. For example, there may be talented host country and third country nationals in addition to employees from the home country (see Scullion and Collings, 2006). Consequently, an MNC may deploy a global system to ensure it identifies all potential sources of managerial talent from across its international operations. Alternatively, firms may adopt a solely or predominantly local system whereby the MNC is primarily interested in its home country employees. Local management can implement their own local system; they do not have to implement a common global system (Scullion and Starkey, 2000).
Over 65 per cent of MNCs have a succession planning system in some or all of their Irish operations. This finding is identical to that found in the parallel UK study (Edwards et al., 2007). Succession planning was found to be slightly more common in foreign MNCs (67 per cent) than in Irish-owned MNCs (61 per cent).
Figure 7.2 shows that over one third of MNCs (35 per cent) do not have a formalised system of succession planning in any of their Irish operations. A clear majority (59 per cent) of MNCs revealed their system was global in reach. The remaining 6 per cent indicated that succession planning was solely local. Similarly the UK study found that global succession planning is overwhelmingly the system found to be in place (Edwards et al., 2007).
Figure 7.2 Global or local succession planning
59%
6%
35%
Global succession planning
Local succession planning
No succession planning
Few differences were found according to whether the MNC operates in manufacturing or service sectors. Both are quite similar in terms of whether they have a system of succession planning in their Irish operations and whether these are local or global in scope. The one point of note is that multi-sector MNCs (72 per cent) are much more likely to have a global system compared to service (59 per cent) or manufacturing MNCs (55 per cent).
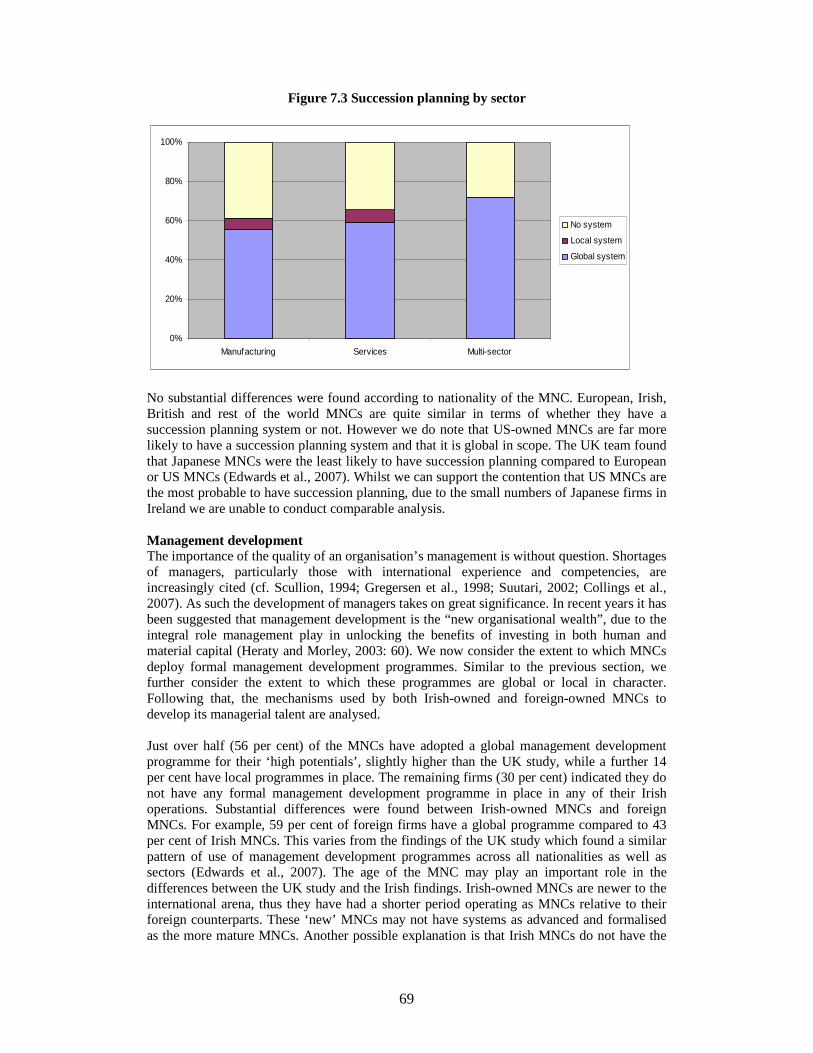
69
Figure 7.3 Succession planning by sector
0%
20%
40%
60%
80%
100%
Manufacturing Services Multi-sector
No system
Local system
Global system
No substantial differences were found according to nationality of the MNC. European, Irish, British and rest of the world MNCs are quite similar in terms of whether they have a succession planning system or not. However we do note that US-owned MNCs are far more likely to have a succession planning system and that it is global in scope. The UK team found that Japanese MNCs were the least likely to have succession planning compared to European or US MNCs (Edwards et al., 2007). Whilst we can support the contention that US MNCs are the most probable to have succession planning, due to the small numbers of Japanese firms in Ireland we are unable to conduct comparable analysis.
Management developmentThe importance of the quality of an organisation’s management is without question. Shortages of managers, particularly those with international experience and competencies, are increasingly cited (cf. Scullion, 1994; Gregersen et al., 1998; Suutari, 2002; Collings et al., 2007). As such the development of managers takes on great significance. In recent years it has been suggested that management development is the “new organisational wealth”, due to the integral role management play in unlocking the benefits of investing in both human and material capital (Heraty and Morley, 2003: 60). We now consider the extent to which MNCs deploy formal management development programmes. Similar to the previous section, we further consider the extent to which these programmes are global or local in character. Following that, the mechanisms used by both Irish-owned and foreign-owned MNCs to develop its managerial talent are analysed.
Just over half (56 per cent) of the MNCs have adopted a global management development programme for their ‘high potentials’, slightly higher than the UK study, while a further 14 per cent have local programmes in place. The remaining firms (30 per cent) indicated they do not have any formal management development programme in place in any of their Irish operations. Substantial differences were found between Irish-owned MNCs and foreign MNCs. For example, 59 per cent of foreign firms have a global programme compared to 43 per cent of Irish MNCs. This varies from the findings of the UK study which found a similar pattern of use of management development programmes across all nationalities as well as sectors (Edwards et al., 2007). The age of the MNC may play an important role in the differences between the UK study and the Irish findings. Irish-owned MNCs are newer to the international arena, thus they have had a shorter period operating as MNCs relative to their foreign counterparts. These ‘new’ MNCs may not have systems as advanced and formalised as the more mature MNCs. Another possible explanation is that Irish MNCs do not have the

70
financial resources that the larger, more mature MNC may have to spend on developmental activities.
Figure 7.4 Presence of a formal management development programme by country of origin
0%
20%
40%
60%
80%
100%
UK US Irish Europe Rest
No programme
Local programme
Global programme
Service sector and multi-sector MNCs are more likely to have a formal management development programme in their Irish operations than manufacturing MNCs. The difference is starker when one compares the use of a global management development programme. Multi-sector (76 per cent) followed by service sector (61 per cent) MNCs most commonly have a global programme compared to 45 per cent of manufacturing MNCs.
Next we detail the substance of these programmes. Respondents were asked to indicate the extent to which their Irish operations utilised a number of mechanisms to develop its senior management potential, namely:
� Long-term international assignments� Short-term international assignments� Formal global management training� Assessment of performance against a set of global management competencies� Qualifications programmes (e.g. MBA)
In terms of the number of development mechanisms firms use, 44 per cent stated they utilise all five of the mechanisms, a further 17 per cent used four, 19 per cent used three, 10 per cent used two, and 6 per cent utilised one. Finally, just 3 per cent of the MNCs which have a formal management development programme reported they did not use any of these mechanisms17. Of interest is the finding that all of the multi-sector MNCs reported using more than four of these mechanisms for management development purposes. Surprisingly manufacturing MNCs use a greater number of the aforementioned mechanisms than service sector MNCs. The most noticeable finding according to country of origin is that US MNCs are substantially more likely to report using all five development mechanisms (57 per cent) followed somewhat surprisingly by indigenous MNCs (40 per cent).
17 Only firms that stated they have a formal management development programme are included.

71
Figure 7.5 Frequency of use of management development mechanisms
0%
20%
40%
60%
80%
100%
Short terminternational
assignments
Long terminternationalassignments
Formal globalmanagement
training
Globalcompetencyperformanceassessment
Qualificationsprogrammes
Used very extensivelyUsed quite extensivelySome useLittle useNot used
The above chart illustrates that assessment of performance against a set of global management competencies is clearly the most extensively used mechanism, with 51 per cent responding they use it “quite” or “very” extensively. This was followed by qualifications programmes (36 per cent), formal global management training at 27 per cent, and short term international assignments at 15 per cent. The least extensive mechanism utilised by MNCs was long term international assignments (12 per cent). This is consistent with recent literature which has predicted that MNCs’ use of long term assignments for development purposes is reducing due to issues including inter alia, cost and falling supply of suitable candidates (see Collings et al., 2007). Differences were noted between foreign-owned and Irish-owned MNCs. Foreign firms were more likely to report extensive use of all the aforementioned mechanisms than Irish MNCs. This may infer that organisations need time to evolve and develop more elaborate management systems, something which many Irish-owned MNCs may have not yet achieved due to being ‘later internationalisers’.
We find some interesting and noticeable variations between MNCs of different nationalities and how extensive these management development methods are used. For example, two thirds of US MNCs make extensive use of global management competencies, a substantially higher figure than the 46 per cent of UK MNCs reporting extensive use of the same measure. The UK study found the use of global competencies to be highest amongst French MNCs followed by US firms, both of which were significantly higher than MNCs of all other nationalities (Edwards et al., 2007).
Multi-sector MNCs are the most likely to report extensive use of all of the mechanisms with the exception of formal qualifications. Interestingly, manufacturing MNCs are significantly more likely to use formal qualifications than service sector or multi-sector MNCs. Manufacturing MNCs are also more likely to extensively use international assignments, both short and long term, than service sector MNCs. A possible explanation for this may be that manufacturing MNCs adopt a more traditional approach to management development as manufacturing MNCs are the least likely to extensively utilise formal global management training or assess performance against a set of global management competencies.
The key groupWe also sought to establish if there was a specific development programme in place for the key group. Of those firms that identified a key group, some 57 per cent reported the presence

72
of a specific development programme for these particular employees. Interestingly these findings are significantly different to the UK study. In the UK study only 38 per cent of MNCs were found to have a specific development programme for the key group. The authors argue that this suggests in the majority of companies the key group are not treated as a specific group for development purposes (Edwards et al., 2007).
The figure was slightly higher in Irish-owned MNCs (62 per cent) compared to foreign firms (56 per cent). This is somewhat surprising considering the picture to date is that Irish MNCs’ management development systems are seemingly less sophisticated, albeit slightly, than foreign MNCs. A possible explanation is the fact that we are talking about the firm’s home operations in the case of the Irish-owned MNCs. For example, indigenous firms may keep the more value added roles (e.g. research and development) in their home country, hence a greater percentage of Irish-owned MNCs were found to have a specialist development programme for their key employees. This corroborates previous studies suggesting “key strategic activities are highly concentrated in the home base” (Edwards and Ferner, 2002: 97). It may also reflect a change amongst Irish MNCs to broaden their activities into more ‘high technology’ areas rather than solely in the more traditional, lower skilled sectors. In terms of sectoral effects, not surprisingly considering our findings to date, multi-sector MNCs (67 per cent) followed by service sector MNCs (60 per cent) and manufacturing MNCs (52 per cent) have a specific development programme for their key group.
Figure 7.6 Presence of a specific development programme for the key group
0%
20%
40%
60%
80%
100%
Foreign Irish All MNCs
Yes
No
Organisational learning and knowledge diffusionOrganisational learning involves the sharing/diffusion of knowledge, beliefs and assumptions among individuals and groups in the organisation (Argyris, 1999). The primary aim behind organisational learning is that there is intentional utilisation of learning approaches at individual, group and systems level so as to transform the organisation continuously (Dixon, 1994). This type of knowledge has the potential to confer competitive advantage due to its uniqueness to the organisation (Edwards et al., 2007). We now consider the practices and structures that MNCs use to aid organisational knowledge and knowledge diffusion across their worldwide operations. Both formal and informal mechanisms are explored since both potentially offer firms the opportunity to create and diffuse tacit organisational knowledge (Gupta and Govindarajan, 2000).

73
Just less than half (49 per cent) of all MNCs reported having a formal policy for organisational learning in some/all of their Irish operations. Not surprisingly foreign-owned MNCs were more likely (54 per cent) to have a formal policy than Irish MNCs (29 per cent). This may be due to foreign MNCs having a longer history of internationalisation than Irish MNCs and are seeking to gain from the potential benefits from diffusing knowledge across its operations. This is supported by the finding that where these policies exist they tend to be global in orientation with this more likely in foreign firms (90 per cent versus 75 per cent for Irish firms).
Following this we asked whether MNCs utilised any of the following mechanisms to promote organisational learning:
• Expatriate assignments • International projects groups or task forces• International formal committees • International informal networks• Secondments to other organisations internationally (e.g. to suppliers, customers,
universities or private R&D companies)
Figure 7.7 Organisational learning mechanisms used
0%
20%
40%
60%
80%
100%
ExpatriateAssignments
InternationalProject Groups
InternationalFormal
Committees
InternationalInformal
Netw orks
Secondmentsto External
Organisations
No
Yes
Figure 7.7 shows that the most common organisational learning mechanism used by MNCs is international informal networks (76 per cent) followed by international project groups (70 per cent). The least utilised mechanism is secondments to external organisations (22 per cent). The most important mechanism used by MNCs for organisational learning purposes was clearly international project groups, 42 per cent indicated this to be the case followed byinternational informal networks at 26 per cent. Secondments to external organisations were the least likely to be regarded as the most important mechanism (1 per cent). Similar findings were also found in the comparative UK study with international informal networks the most common mechanism (84 per cent), the least widespread being secondments, only 26 per cent of MNCs indicated use of this method (Edwards et al., 2007).

74
Figure 7.8 Number of organisational learning mechanisms used
0%
5%
10%
15%
20%
25%
30%
Noorganisational
learningmechanisms
1 organisationallearning
mechanism
2 organisationallearning
mechanisms
3 organisationallearning
mechanisms
4 organisationallearning
mechanisms
5 organisationallearning
mechanisms
In terms of the number of mechanism utilised by MNCs we found that a mere 14 per cent use all five mechanisms with 23 per cent using four of them. The majority (61 per cent) of companies use three or more organisational learning mechanisms. 15 per cent do not use any, almost double the figure found in the UK study (Edwards et al., 2007), whilst a further 7 per cent only make use of one mechanism. Once again US MNCs (74 per cent) are the most likely to utilise at least three of these mechanisms, followed by 61 per cent of European MNCs. Differences between manufacturing and service sector MNCs were miniscule both being less inclined to use 3 or more of the aforementioned mechanisms than multi-sector MNCs.
Diffusing knowledge through expatriatesExpatriate assignments are used for three primary reasons (Edstrom and Galbraith, 1977). Firstly, to fill a position. Secondly, to develop individual employees and organisational development. Thirdly, for knowledge transfer, control and coordination of operations. Our findings support these contentions. A total of 58 per cent of all MNCs testified that expatriates are used for organisational learning purposes, while 73 per cent reported the use of short term international assignments and 63 per cent reported the use of long term international assignments for management development purposes.
Traditionally, parent country expatriates have been the predominant form used by MNCs, however recent years has seen a marked increase in the number of firms making use of third country nationals (TCNs) although empirical research on TCNs in global staffing is very limited (for an exception see Collings et al., 2008). These refer to employees whose national origin is not the same as the parent company or host country. Data were gathered on the presence and profile of expatriates in the Irish operations, as well as the number of expatriates from the Irish operations in foreign subsidiaries. We now report the primary findings.
Firstly, turning to the foreign firms we found that 44 per cent of MNCs have expatriates from corporate headquarters and 30 per cent have third country expatriates in the Irish operations. On the other hand, 56 per cent of foreign MNCs have no parent country nationals (PCNs) with 70 per cent reporting having no third country nationals (TCNs) in their Irish operations. In terms of the numbers of expatriates in each operation it was found that 83 per cent of firms with PCNs had between 1 and 5 of them, the remaining 17 per cent had between 6 and 35 PCNs. A total of 71 per cent of MNCs with TCNs employed between 1 and 5 of such personnel, the remaining 29 per cent had between 6 and 50 in their Irish operations. The

75
median number of parent country expatriates was 2, the corresponding figure for third country expatriates was 3 reinforcing Collings et al.,’s (2008) assertion that the use of TCN expatriates is under estimated in the literature. The comparative UK study found the median number of parent country and third country nationals to be the same (3) indicating that the expatriate population is no longer dominated by parent country nationals (Edwards et al., 2007), a finding that is supported by these data.
A number of national differences were also found, US-owned firms (42 per cent) were the least likely to have PCNs in the Irish operations, the most likely being the rest of the world category (52 per cent), followed by UK-owned (48 per cent), 43 per cent of European MNCs reported having PCNs in Ireland. Considerably different findings were found with respect to TCNs. US-owned MNCs (35 per cent) were the most likely to have TCNs in their Irish sites while the rest of the world category (17 per cent) had the lowest incidence of them.
Figure 7.9 Percentage of MNCs with PCNs & TCNs
0%
10%
20%
30%
40%
50%
60%
UK US Europe Rest
PCNs in Ireland
TCNs in Ireland
Multi-sector firms are the most likely type of multinational to have both PCNs and TCNs in their Irish operations with 61 per cent of multi-sector MNCs having PCNs and 44 per cent having TCNs. This compares to 40 per cent of service firms with PCNs and 28 per cent with TCNs, while 45 per cent of manufacturing MNCs have PCNs and 27 per cent have TCNs.
Foreign MNCs were also asked to indicate the number of expatriates from the Irish operations working on expatriate assignments in the corporate headquarters and in other parts of the worldwide company. Here, 25 per cent of the foreign MNCs reported that there were expatriates from the Irish operations on assignment in the corporate headquarters, while 38 per cent reported there were expatriates from Ireland in other worldwide operations. The numbers of expatriates ranged from 1 to 30 in both cases. A total of 80 per cent of firms with Irish expatriates in the corporate headquarters reported there being 1 to 5, the corresponding figure for Irish expatriates in other worldwide operations was 77 per cent. The median number of expatriates in the corporate headquarters and in other parts of the worldwide company was 2, the UK finding was 2 and 3 respectively (Edwards et al., 2007).
Significant differences were once again found according to the country of origin of the MNC. US-owned MNCs were the most likely to report Irish expatriates in both the parent company headquarters and other parts of the worldwide operations (32 per cent and 50 per cent respectively). There were no rest of the world MNCs with Irish expatriates in the parent company headquarters and only 23 per cent had Irish expatriates in other operations around the world.

76
Turning now to Irish-owned MNCs, we find that 75 per cent currently have PCNs working in their foreign subsidiaries. 60 per cent of these have between 1 and 5 PCNs in their foreign sites, 40 per cent have in excess of six, the median number being 5. On the other hand, only 38 per cent of Irish MNCs indicated they have expatriates from their foreign operations working on long term assignments in Ireland. This is considerably lower than that found in the UK (61 per cent) and may reflect the importance placed on building personal networks and socialising personnel into the corporate ‘know-how’ (Edwards et al., 2007). Due to the lateness by which Irish firms internationalised such items may not yet be as important, thus explaining the differences with the UK. The median number of these expatriates was 3, while 53 per cent of those with foreign expatriates had five or less.
Discretion over training and development policyThis final section explores the level of discretion afforded to local management in foreign-owned MNCs and also the level of discretion afforded by management in Irish MNCs to their foreign operations in relation to three policy areas of training and development. More specifically we explore autonomy over the training and development policy, the policy on succession planning, as well as the policy on organisational learning.
Foreign-owned MNCsAlmost 8 in every ten foreign-owned MNCs (79 per cent) reported having ‘quite a lot’ or ‘full discretion’ over the training and development policy in the Irish operations (see figure 7.10). A mere 3 organisations stated they have no discretion whatsoever over this policy area. Manufacturing MNCs are the most likely to report quite a lot/full discretion (90 per cent) followed by service based MNCs (71 per cent) and finally 67 per cent of the multi-sector MNCs. European MNCs (62 per cent) were most likely to report full discretion over the T&D policy followed by UK-owned MNCs (46 per cent). Not surprisingly US-owned are the least likely to report full discretion.
Figure 7.10 Discretion of foreign subsidiaries over T&D policy
0%
20%
40%
60%
80%
100%
UK US Europe Rest
Full discretion
Quite a lot discretion
Some discretion
Little discretion
No discretion
The results differ in relation to discretion over succession planning (see figure 7.11). Whilst there are substantial numbers of MNCs reporting full discretion over this policy (49 per cent) it is no where near as high as the levels of autonomy reported over the T&D policy. When one considers that an overwhelming majority of succession planning systems are global in scope the high percentage reporting full discretion is quite surprising. However the potential explanation for this may be that the subsidiary was highly involved in the process of drawing up the succession planning policy. A change is also found when examining the discretion levels by sector. In this instance, it is the service based MNCs that are the most likely to report quite a lot/full discretion (57 per cent) followed by manufacturing MNCs (41 per cent)

77
and then the multi-sector firms (39 per cent). Similar findings to those highlighted above are found with respect to country of origin. US-owned MNCs are the least likely to report full discretion (19 per cent) with European MNCs the most likely to have full discretion (40 per cent).
Figure 7.11 Discretion of foreign subsidiaries over succession planning policy
0%
20%
40%
60%
80%
100%
UK US Europe Rest
Full discretion
Quite a lot discretion
Some discretion
Little discretion
No discretion
Now we turn to the level of autonomy afforded over the policy on organisational learning (see figure 7.12). The numbers reporting quite a lot/full discretion (58 per cent) are higher than reported over succession planning but less than found for discretion in relation to the T&D policy. Once more manufacturing MNCs (70 per cent) are most likely to report having higher levels of autonomy over this area than MNCs in the other industrial sectors (services – 52 per cent; multi-sector – 50 per cent). In terms of a nationality effect, it is clear that US-owned firms (16 per cent) are once more the least likely to have full autonomy over this policy area, European MNCs are the most likely (58 per cent).
Figure 7.12 Discretion of foreign subsidiaries over policy on organisational learning
0%
20%
40%
60%
80%
100%
UK US Europe Rest
Full discretion
Quite a lot discretion
Some discretion
Little discretion
No discretion
Irish-owned MNCsA clear majority of Irish-owned MNCs (67 per cent) report that their foreign subsidiaries have quite a lot/full discretion over the training and development policy. There is little variance between discretion levels according to whether a MNC operates in services (68 per cent report quite a lot/full discretion) or manufacturing (70 per cent report quite a lot/full discretion).
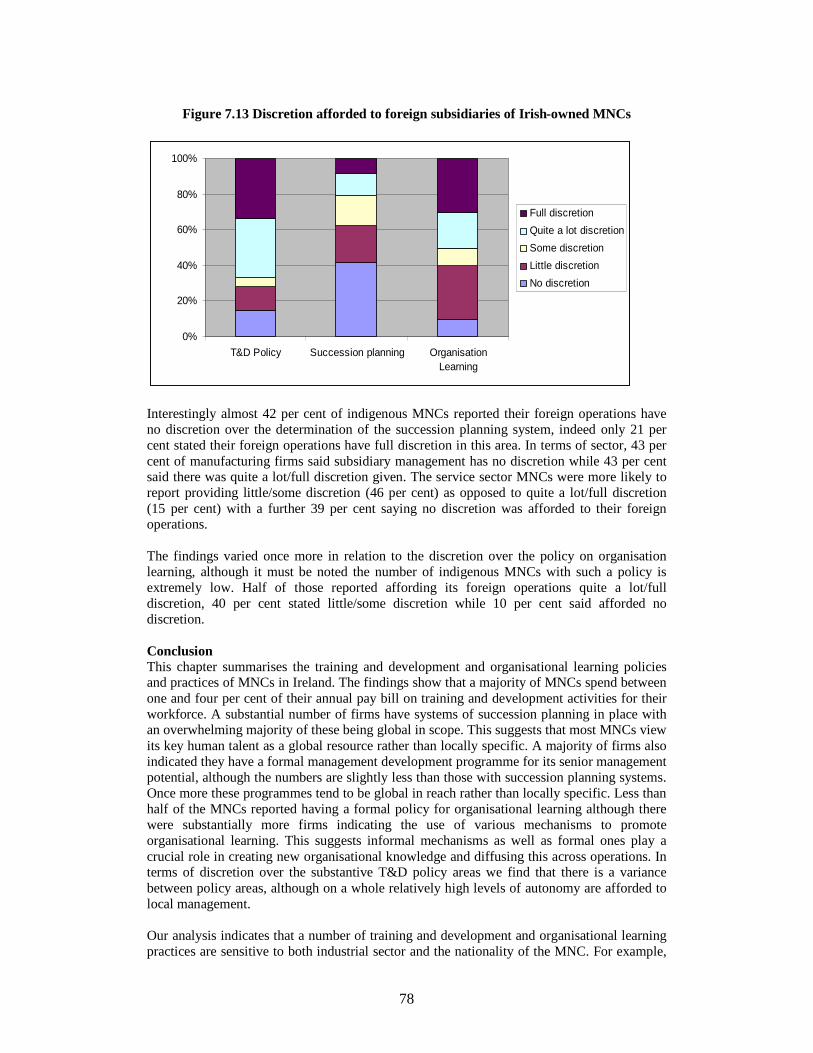
78
Figure 7.13 Discretion afforded to foreign subsidiaries of Irish-owned MNCs
0%
20%
40%
60%
80%
100%
T&D Policy Succession planning OrganisationLearning
Full discretion
Quite a lot discretion
Some discretion
Little discretion
No discretion
Interestingly almost 42 per cent of indigenous MNCs reported their foreign operations haveno discretion over the determination of the succession planning system, indeed only 21 per cent stated their foreign operations have full discretion in this area. In terms of sector, 43 per cent of manufacturing firms said subsidiary management has no discretion while 43 per cent said there was quite a lot/full discretion given. The service sector MNCs were more likely to report providing little/some discretion (46 per cent) as opposed to quite a lot/full discretion (15 per cent) with a further 39 per cent saying no discretion was afforded to their foreignoperations.
The findings varied once more in relation to the discretion over the policy on organisation learning, although it must be noted the number of indigenous MNCs with such a policy is extremely low. Half of those reported affording its foreign operations quite a lot/full discretion, 40 per cent stated little/some discretion while 10 per cent said afforded no discretion.
ConclusionThis chapter summarises the training and development and organisational learning policies and practices of MNCs in Ireland. The findings show that a majority of MNCs spend between one and four per cent of their annual pay bill on training and development activities for their workforce. A substantial number of firms have systems of succession planning in place with an overwhelming majority of these being global in scope. This suggests that most MNCs view its key human talent as a global resource rather than locally specific. A majority of firms also indicated they have a formal management development programme for its senior management potential, although the numbers are slightly less than those with succession planning systems. Once more these programmes tend to be global in reach rather than locally specific. Less than half of the MNCs reported having a formal policy for organisational learning although there were substantially more firms indicating the use of various mechanisms to promote organisational learning. This suggests informal mechanisms as well as formal ones play a crucial role in creating new organisational knowledge and diffusing this across operations. In terms of discretion over the substantive T&D policy areas we find that there is a variance between policy areas, although on a whole relatively high levels of autonomy are afforded to local management.
Our analysis indicates that a number of training and development and organisational learning practices are sensitive to both industrial sector and the nationality of the MNC. For example,

79
US-owned MNCs are the largest spenders on training and development, the most likely to have global succession planning, as well as being the most common MNC group to report using all five of the management development mechanisms we explored. US-owned subsidiaries are also the least likely to report having full autonomy over the different policy areas examined. Apposite to this, indigenous MNCs are least likely to report their training and development expenditure is in excess of 4 per cent of the annual pay bill per annum. They are also more unlikely to have a formal management development programme. In terms of sector, multi-sector MNCs tended to be the most likely to report use of formal succession planning and management development systems as well as incidence of the aforementioned management development and organisation learning mechanisms. Service sector MNCs were generally more likely to have such systems compared to manufacturing MNCs, however this was not always the case.
In conclusion, we suggest that a significant number of MNCs have a number of structures in place to ensure it is able to identify and develop its managerial talent. The widespread use of both global succession planning and global management development systems indicates that MNCs tend to treat its human capital as a global resource.

80
CHAPTER 8
CONCLUSIONS
IntroductionIreland’s dependence on FDI and its success in attracting inward FDI is well established. This study represents the largest and most representative empirical investigation of human resource (HR) management practice in MNCs in Ireland to date. Using a survey administered through face-to-face interviews with senior HR practitioners, the overall response rate was 63 per cent or 262 completed interviews (from a total valid sample of 416 MNCs).
This study sets out to map HR practices of MNCs in Ireland. It further seeks to identify those factors influencing HR practice and workforce management. We investigate five HR areas, namely the HR function, pay and performance management, employee representation and consultation, employee communication and involvement, and training, development and organisational learning. This investigation focuses on three groups of employees, (a) managers, (b) the largest occupational group (LOG) and (c) the key group. This latter category represents a major innovation in studies of this kind, concentrating on employee categories seen as critical to firm performance.
The main findings relating to key areas of HR activity have already been outlined in previous chapters. Here we seek to summarily highlight what we see as the key issues to emerge from our report.
Foreign MNCs in Ireland – a diverse assemblage? In analysing our findings, the initial - possibly most fascinating - task was to try and categorise MNCs in Ireland according to factors such as ownership, sector and size. The first thing that struck us as a research team was the heterogeneous nature of the MNC population in Ireland. This was particularly the case in regard to size and sector. It was interesting to find that the majority of MNCs in Ireland are located in the service sector, although manufacturing remains an important area of MNC activity, whilst there are a relatively small number of ‘multi-sector’ MNCs. MNCs were engaged in a diverse range of service activities such as financial services, transportation and logistics, retail, catering and hospitality. The retail sector now represents one of the primary growth engines of the service sector. One in every seven people is now employed in retail, making it the country’s biggest employer (Kelly, 2007). Yet retail and the service sector more generally, remain a comparatively neglected research terrain (McDonnell et al., 2007). Our study captures this important segment of Irish industry with retail and wholesale firms accounting for 16 per cent of all respondents.
There was also considerable diversity regarding the nationality of MNCs, though the great majority of foreign MNCs originated from three countries or regions, namely the US, continental Europe and the UK. It is evident that Ireland attracts few MNCs from outside of Europe or the US. This is quite unlike the parallel UK study which noted, for example, the significant presence there of MNCs from Japan and other Asian countries.
Over the recent past considerable media attention has focused on the seemingly numerous cases of foreign MNCs reducing employment and/or closing Irish operations. Our study presents a somewhat different image. Approximately half of the respondent firms indicated they had established a new site or expanded an existing site within the previous five years. On the other hand, just over a fifth had closed a site during the same period. This depicts a more optimistic picture than that portrayed by the popular media. It appears that we are experiencing a high level of ‘job churn’ among the MNC population, i.e. concurrent job loss and job creation, particularly in the manufacturing sector. Foreign MNCs remain a key

81
element of the Irish industrial landscape, with almost four in every ten employing in excess of 500 people in their Irish operations.
Irish MNCs – an untold story? Above we note that the foreign MNC population is made up of more than just US manufacturing firms, with large numbers of MNCs of other nationalities as well as service and multi-sector organisations. A particularly important sub-set of MNCs comprises indigenous (Irish-owned) MNCs, which have been somewhat neglected from a research perspective. Our findings indicate that Irish-owned MNCs comprise in excess of 10 per cent of the total MNC population. We earlier noted that the scale of inward FDI is more than rivalled by outward FDI by Irish MNCs and that Ireland’s stock of outward FDI is well above the EU average. As such, the extent and growth of Irish MNCs represents something akin to ‘the missing chapter’ in the story of MNCs in Ireland.
It is hardly surprising, given that industrial development did not accelerate until the turn of the 1960s, to find that Irish MNCs are comparatively late internationalisers, with almost seven in ten having established foreign operations since 1980. Interestingly, they have moved quickly since then, with over eight in ten reporting operations in more than two countries.
Irish-owned MNCs are clearly very large employers by national standards. Almost two thirds (57 per cent) employ more than 1,000 workers in Ireland, substantially higher than that of foreign-owned MNCs (23 per cent). However in worldwide terms, they remain very much small to medium sized organisations, with less than one third employing more than 5,000 people. The sectoral configuration of Irish MNCs is interesting, particularly when compared to foreign MNCs. A greater proportion of Irish firms operate in what are termed more ‘low tech’ sectors, such as ‘traditional manufacturing’ (e.g. food), reflecting in part Ireland’s background as an agricultural country. In contrast, foreign MNCs have a greater presence in ‘high-tech’ manufacturing and internationally traded service sectors.
MNCs and the labour questionOur investigation of the experience of MNCs in Ireland and their perceptions on doing business here reveals a reasonably positive picture. In particular, respondents were broadly optimistic with regard to the position of their Irish operations within their respective corporation’s value chain. The majority believed that the Irish operations were of great importance to the overall performance of the parent company and that this importance had increased over the recent past. However, unease was expressed about the competitive nature of the Irish economy. In particular, operating and labour costs emerged as the area of greatest concern among MNCs operating in Ireland. Amongst the foreign-owned MNCs, these two factors were identified as the most important factor impacting on decisions on whether the Irish operations were likely to attract new investment or new/extended mandates from the parent company. The great majority of respondents reported high levels of satisfaction with various aspects of the Irish labour force, namely the quality of graduate supply and workforce capacity to learn new skills.
As noted earlier, Irish industrial policy is currently geared towards moving MNC operations up the ‘value chain’. This is predicated in large measure on an adequate supply of skilled labour. The finding that just over half of the MNCs recognise a ‘key group’ (e.g. chemists, R&D staff etc.) is reasonably positive as it indicates that a proportion of MNCs here rely on value-added jobs/particular workforce categories. The worrying aspect is that the labour market may not have the ‘talent’ to fill these roles into the future. A significant proportion of respondents reported concern regarding the future availability of graduates.
Explaining divergenceIn their ongoing pursuit of enhanced performance and profitability MNCs face, in the words of Bill Cooke, “…a complex web of choices in configuring and reconfiguring their global

82
operations” (Cooke, 2003: 4). One such choice is whether to employ globally consistent, standardised practices in their foreign operations, or alternatively, to utilise practices which have been adapted to fit the traditions of the host country – whether to go global or local (cf. Gooderham et al., 1999; Gunnigle et al., 2005). The former infers that management practice will progressively converge towards a common HR model as a result of MNCs deploying ‘best practice’ by borrowing or mimicking practices in other firms to achieve added value. Thus practice will converge, even among MNCs in different sectors and of different nationalities. The latter acknowledges the key influence of ‘country of origin’, arguing that practices in MNCs will continue to diverge due to embedded cultural and institutional traits of the home country with the result that MNCs will remain firmly rooted in the business systems from which they originate.
Country of originCountry of origin remains a demonstrably influential factor in explaining divergence in HR practice. The impact of country of origin is a persistent theme in this report and the following briefly summarises our findings18.
US MNCs: US firms are likely to have a HRIS, shared services centre and an international HR policy-making committee. They are the most likely to have performance appraisals for staff and many also deploy innovative techniques such as forced distribution and peer appraisal. This also holds true in regard to payment systems, with US firms more likely to use employee share ownership, profit sharing and share option schemes. As might be expected, performance related pay is more widely used in US firms, though the differences were not as significant as one might perhaps expect. Again in line with expectations, trade union recognition is lowest among US MNCs, whilst the union avoidance practice of ‘double-breasting’ is most prevalent amongst MNCs of US origin. In the area of training and development, US firms tend to be the biggest spenders, the greatest users of management development techniques and the most likely to utilise succession planning systems which operate on a global basis. US MNCs are the most likely to have third country nationals but the least likely to utilise parent country nationals compared to other MNCs. In regard to patterns of local autonomy versus central control across the different HR areas, management respondents in the Irish operations of US MNCs report comparatively low levels of discretion.
UK MNCs: Half of the UK MNCs operate shared services centres and have international HR policy formation bodies. They are far less likely, compared to US and other European MNCs, to have a worldwide approach to workforce management. UK firms consistently aim to pay a greater proportion of employees (managers, LOG and key group) in the top or 2nd quartile. Nine in ten UK firm have performance appraisal for their managers while seven in ten have formal appraisals for their LOG. Use of forced distribution is uncommon as is the use of 360-degree feedback. An overwhelming majority of UK MNCs tend to recognise trade unions for collective bargaining purposes. Formally designed teams and problem-solving groups are commonly found in UK MNCs as are a large number of communication mechanisms with meetings between line managers and employees, newsletters/emails and systematic use of the management chain the most commonly found communication mechanisms. Although the majority of UK MNCs have succession planning and formal management development programmes these tend to be comparatively less than other MNCs. UK MNCs make considerably greater use of parent country expatriates than third country expatriates. This may reflect the short geographical proximity and cultural similarity between the UK and Ireland. UK MNCs tend to have considerable discretion over the various HR policy areas, much more than US firms.
18 We focus on MNCs from the US, the UK, Europe and Ireland. We do not address the rest of world category due to the small numbers involved.
83
European MNCs: European MNCs were categorised together as a convenient unit of analysis. However, one should note that there may be variation between the MNCs of different nationalities incorporated within this grouping. European MNCs emerge as least likely to have shared services centres and also least likely to have an international HR policy formation body, suggesting integration is not a major concern thus far. However, European MNCs pay well - only UK MNCs aim to pay their LOG and managers more. They are comparatively low users of formal appraisals for either their managers or LOG. 360-degree feedback and forced distribution are relatively uncommon. They are more likely to recognise trade unions than US MNCs but less so than Irish and UK-owned MNCs. Almost six in ten European MNCs have a European Works Council, considerably more than any other MNCs. They report high usage of problem solving groups and, similar to other MNCs, tend to use a large number of mechanisms for communication purposes. European MNCs report high levels of discretion over many of the HR areas, none more so than over trade union recognition.
Irish MNCs: Irish MNCs are more likely to have shared services centres compared to foreign firms. These are also more likely to be global in scope. After ‘rest of the world’ MNCs, they are the least likely to report paying their LOG in the first or second quartile relative to market comparators. Usage of performance appraisals for managers and LOG are considerably lower than MNCs of any other nationality. Where formal appraisals are conducted, it is very unlikely to see forced distribution or 360 degree feedback in use. Not surprisingly, they are the most likely to recognise trade unions in Ireland, although four in ten do not recognise trade unions in their foreign operations. In addition, European Works Councils remain very uncommon. Problem solving groups are quite common although formally designed teams are far likelier to be found in MNCs of all other nationalities. The main communication mechanisms utilised are similar to other MNCs, however they are considerably less likely to use attitude or opinion surveys. They are less likely to report their training and development expenditure in the top category (> 4 per cent). Both succession planning and formal management development is common although less so compared to foreign firms. They report that their foreign subsidiaries have relatively low levels of discretion across the substantive HR areas, although one must remember this is a headquarter perspective.
SectorA number of notable differences are found according to the industrial sector. Three distinct sectors are used namely, the service, manufacturing, and multi-sector (i.e. incorporating firms which straddle both manufacturing and services).
Service sector MNCs are more likely to aim to be in the first or second quartile regarding pay for the various staff categories, when compared to manufacturing or multi-sector MNCs. The use of forced distribution for the LOG and managers is also more likely in the service sector, but the differences are slight. Multi-sector firms tend to be the most prominent users of financial incentive schemes (profit sharing, share ownership, share options). Not surprisingly, service sector MNCs are the least likely to recognise trade unions for collective bargaining purposes. Again as expected, trade union density is higher in the manufacturing sector. Interestingly, service sector unionised firms were more likely to report the existence of a cooperative approach between management and the trade unions. Furthermore service and multi-sector MNCs tend to acquire non-union companies more than unionised firms, when compared to MNCs in manufacturing. In terms of pay determination, manufacturing firms are more likely to use national level pay bargaining for the LOG than service or multi-sector firms.
A marked variation was found in relation to employee involvement, with manufacturing MNCs more likely to use problem solving groups when compared to service or multi-sector firms. However formally designed teams are more commonly found in service sector MNCs. Usage of the various forms of communication are virtually identical across the three sectors. In relation to training and development spend, multi-sector firms are the most likely to report

84
spending in excess of 4 per cent of their annual pay bill on such activities, followed by service sector firms. Multi-sector firms are also more likely to operate global succession planning and have a global management development programme. In addition multi-sector firms are more likely to report the existence of a ‘key group’, followed by service firms.
Manufacturing MNCs report greater discretion over pay and performance management than service or multi-sector firms. Little or no difference is found in relation to autonomy over employee representation and consultation. Manufacturing firms are also most likely to have quite ‘a lot’ or ‘full’ autonomy over the training and development, and organisational learning policies. However, service sector firms are more likely to report high discretion levels with regard to succession planning.
In conclusion, this report presents the main initial findings from Ireland’s first representative survey of HR practices in MNCs. As a result, we are able to provide an unparalleled snapshot of what is happening in HR in these firms. This should allow managers benchmark their particular practices vis-à-vis the more general pattern of HR practice in the multinational sector in Ireland.

85
References
Alfaro, L. & Charlton, A. (2006) International Financial Integration and Entrepreneurship, accessed [online], 1 July 2006 from: http://www.people.hbs.edu/lalfaro/CapitalFlowsEntrepreneurship.pdf.
Argyris, C. (1999) On Organizational Learning. Oxford, Blackwell.
Arrow, K. (1997) “Economic Growth Policy for a small Country” in A. W. Gray (Ed), International Perspectives on the Irish Economy, Dublin, Indecon.
Barney, J. (1991) “Firm resources and sustained competitive advantage”, Journal of Management, 17, 1, 99-120.
Barry, F. (2002) FDI and the Host Economy: A Case Study of Ireland, unpublished paper presented at Department of Management, National University of Ireland, Galway, November 8th.
Barry, F., Gorg, H., and McDowell, A. (2003) “Outward FDI and the Investment Development Path of a Late-industrializing Economy: Evidence from Ireland”, Regional Studies, 37, 4, 341-49.
Beaumont, P. and Harris, R.I.D. (1992) “Double-breasted Recognition Arrangements in Britain”, International Journal of Human Resource Management, 3, 2, 267-83.
Bélanger, J., Harvey, P.-A., Jalette, P., Levesque, C. and Murray, G. (2006) Employment Practices in Multinational Companies in Canada: Building Organizational Capabilities & Institutions for Innovation. University of Montreal, HEC Montreal, University of Laval, Montreal & Laval: The Inter-University Research Centre on Globalization and Work (CRIMT).
Björkman, I. and Furu, P. (2000) “Determinants of variable pay for general managers of foreign-owned subsidiaries in Finland”, International Journal of Human Resource Management, 11, 4, 698-713.
Boxall, P. (1992) “Strategic human resource management: beginnings of a new theoretical sophistication”, Human Resource Management Journal, 2, 3, 60-79.
Buckley, P. & Enderwick, P. (1985) The Industrial Relations Practices of Foreign-Owned Firms in Britain. London, Macmillan.
Buckley, P. J. and Ruane, F. (2006) “Foreign Direct Investment in Ireland: Policy Implications for Emerging Economies”, The World Economy, 29, 11, 1611-28.
Caligiuri, P. M., Lazarova, M. and Tarique, I. (2005) “Training, learning and development in multinational organizations”, in Scullion, H., and Linehan, M. (Eds.) International Human Resource Management: A critical text. Hampshire, Palgrave Macmillan.
Collings, D. G. (2003) “HRD and labour market practices in a US multinational subsidiary: the impact of global and local influences”, Journal of European Industrial Training, 27, 2-4, 188-200.
Collings, D.G, Morley, M.J. and Gunnigle, P. (2008) “Composing the Top Management Team in the International Subsidiary: Qualitative Evidence on International Staffing in US MNCs in the Republic of Ireland”, Journal of World Business, 43, 1, in press.

86
Collings, D.G., Gunnigle, P. and Morley, M.J. (forthcoming) “Boston or Berlin? American MNCs and the Shifting Contours of Industrial Relations in Ireland”, International Journal of Human Resource Management, forthcoming.
Collings, D.G., Scullion, H. and Morley, M.J. (2007) “Changing Patterns of Global Staffing in the Multinational Enterprise: Challenges to the Conventional Expatriate Assignment and Emerging Alternatives”, Journal of World Business, 42, 2, 198-213.
Collinson, S. and Rugman, A. (2005) Studying the wrong firms: Selection biases in management research, unpublished paper. University of Warwick.
Cooke, W. (2003) “Global Hyman Resource Strategies: A Framework and Overview” in Cooke, W.N. (Ed) Multinational Companies and Global Human Resource Strategies, Wesport, Quorum Books.
Cully, M., Woodland, S., O’Reilly, A. and Dix, G. (1999) Britain at work as depicted by the 1998 Workplace Employee Relations Survey, London, Routledge.
De Vos, T. (1981) US Multinationals and Worker Participation in Management: The American Experience in the European Community, London, Adwych Press.
Dixon, N. M. (1994) Organizational Learning Cycle: How We Can Learn Collectively. London, McGraw-Hill.
Dundon, T. (2003). “The State of Employee Information & Consultation in Ireland”. Labour Relations Commission Review, 1, 2, 15-20.
Dundon, T., Curran, D., Maloney, M. and Ryan, P. (2006) “Conceptualising the dynamics of employee voice: evidence from the Republic of Ireland”, Industrial Relations Journal, 37, 5, 492-512.
Dunning, J.H.(1998) American Investment in British Manufacturing Industry. (2nd ed.), Abingdon (U.K), Routledge.
Edstrom, A. and Galbraith, J. (1977) “Alternative policies for international transfers of managers”, Management International Review, 17, 2, 11-22.
Edwards, P., Edwards, T., Ferner, A., Marginson, P. and Tregaskis, O. (2007) Employment Practices of MNCs in Organisational Context: A Large-Scale Survey, Advance Feedback Report to Participating Companies, De Montfort, Kings College London and Warwick Business School.
Edwards, P., Geary, J. and Sisson, K. (2002) “New Forms of Work Organization in the Workplace”, in Murray, G., Belanger, J., Giles, A. and Lapointe, P.A. (Eds) Work and Employment Relations in the High-performance Workplace. London, Continuum.
Edwards, T. and Ferner, A. (2002) “The renewed 'American Challenge': a review of employment practice in US multinationals”, Industrial Relations Journal, 33, 2, 94-111.
Edwards, T., Tregaskis, O., Edwards, P., Ferner, A. and Marginson, P. (2006) “Charting the Contours of Multinationals in Britain, unpublished paper. De Montfort, Kings College London and Warwick Business School.
Elger, T. and Smith, C. (2005) Assembling Work. Oxford, Oxford University Press.

87
European Foundation for the Improvement of Living and Working Conditions (1997) New forms of work organisation: Can Europe realise its potential? Dublin, European Foundation for the Improvement of Living and Working Conditions.
Eurostat (2004) Eurostat Yearbook: the Statistical Guide to Europe. Luxembourg, Office for the Official Publications of the European Community.
Everett, M. (2006) “Foreign Direct Investment: An Analysis of its Significance”, The Central Bank & Financial Services Authority of Ireland Quarterly Bulletin, 4, 93-112.
Feeney, E. (2007) “Retail sector set to stay strong”, Sunday Business Post, 9 September 2007.
Ferner, A. (1997) “Country of Origin Effects and HRM in Multinational Companies”, Human Resource Management, 7, 1, 19-37.
Flood, P.C., Guthrie, J.P., Liu, W. and MacCurtain, S. (2005), High Performance Work Systems in Ireland: the Economic Case. Dublin, National Centre for Partnership and Performance.
Forfás (2006) International Trade & Investment Report 2005. Dublin, Forfás.
Forfás (2007) Enterprise Statistics - at a glance, 2006. Dublin, Forfás.
Foulkes, F. K. (1980) Personnel Policies in Large Non-union Companies. Englewood Cliffs (New Jersey), Prentice Hall.
Garavan, T. N., Collins, E. and Brady, S. (2003) Results of the 2003 National Survey of Benchmarks. Dublin, CIPD.
Geary, J. (1996) “Working at restructuring work in Europe: The case of team-working”, Journal of Irish Business and Administrative Research, 17, 44-57.
Geary, J. (1998) “New Work Structures and the Diffusion of Team Working Arrangements in Ireland”, Paper presented at the 6th Annual John Lovett Memorial Lecture, University of Limerick, April.
Geary, J. (2006). “Employee Voice in Ireland”, Labour Relations Commission Review, 6, 1, 19-22.
Geary, J. and Roche, W. (2001). “Multinationals and human resource practices in Ireland: a rejection of the 'new conformance thesis”. International Journal of Human Resource Management, 12, 1, 109-27.
Geary, J. F. and Roche, W. K. (2001) “Multinationals and human resource management: a rejection of the 'new conformance thesis'”, International Journal of Human Resource Management, 12, 1, 109-27.
Geary, J.F. and Roche, W. K. (2005). “Anticipating the Likely Implications of the EU Employee Information and Consultation Directive in Ireland”, in Storey, J. (Ed) Adding Value Through Information and Consultation. Basingstoke, Palgrave Macmillan.
Gooderham, P. N., Nordhaug, O. and Ringdal, K. (1999) “Institutional and rational determinants of organizational practices: Human resource management in European firms”, Administrative Science Quarterly, 44, 3, 507-31.

88
Gregersen, H. B., Morrison, A. J. and Black, S. J. (1998) “Developing leaders for the Global frontier”, Sloan Management Review, 40, 1, 21-32.
Grugulis, I. (2007) Skills, Training and Human Resource Development: A Critical Text. Hampshire, Palgrave Macmillan.
Gunnigle, P. (1993). “Exploring Patterns of Industrial Relations Management in Greenfield sites: Evidence from the Republic of Ireland”, Mimeo, University of Limerick.
Gunnigle, P. (1995) “Management Styles in Employee Relations in Greenfield Sites: Challenging a Collectivist Tradition”, Unpublished PhD Thesis, Cranfield: Cranfield School of Management.
Gunnigle, P. (1998). “Human Resource Management and the Personnel Function” in Roche, W.K., Monks, K. and Walsh, J. (Eds.), Human Resource Management Strategies: Policy and Practice in Ireland. Dublin, Oak Tree Press.
Gunnigle, P. and McGuire, D. (2001) “Why Ireland? A Qualitative Review of the Factors influencing the Location of US Multinationals in Ireland with particular reference to the impact of labour issues”, Economic and Social Review, 32, 1, 43-67.
Gunnigle, P., Collings, D. G. and Morley, M. J. (2005) “Exploring the dynamics of industrial relations in US multinationals: evidence from the Republic of Ireland”, Industrial Relations Journal, 36, 3, 241-56.
Gunnigle, P., Collings, D. G., Morley, M., McAvinue, C., O'Callaghan, A. and Shore, D. (2003) “US Multinationals and Human Resource Management in Ireland, Towards a Qualitative Research Agenda”, Irish Journal of Management, 24, 2, 7-25.
Gunnigle, P., Flood, P., Morley, M. J. and Turner, T. (1994) Continuity and change in Irish employee relations. Dublin, Oak Tree Press.
Gunnigle, P., Morley, M. J., Clifford, N., Turner, T., Heraty, N. and Crowley, M. (1997) Human resource management in Irish organisations: practice in perspective. Dublin, Oak Tree Press.
Gunnigle, P., Turner, T. and D’Art, D. (1998) “Counterpoising collectivism: Performance-related pay and industrial relations in Greenfield sites”, British Journal of Industrial Relations, 36, 4, 565-79.
Gupta, A. K. and Govindarajan, V. (2000) “Knowledge Flows within Multinational Corporations”, Strategic Management Journal, 21, 4, 473-96.
Heraty, N. and Morley, M. J. (2003) “Management development in Ireland: the new organizational wealth?” Journal of Management Development, 22, 1, 60-82.
Higgins, C. (2004) “Unions Being Pushed Out Of Multinational Sector”, Industrial Relations News, 9, 26 February, 22-26.
Hourihan, F. (1996) “Non-union Policies on the Increase Among New Overseas Firms”, Industrial Relations News, 4, 25 January, 17-23.
Industrial Development Authority (IDA) Ireland (2007) Ireland: Vital Statistics. Dublin, IDA Ireland.

89
Irish Business and Employers Confederation (1999) Partnership at Enterprise Level: Survey Results, Dublin, IBEC Partnership Unit.
Jacoby, S. M. (1997) Modern Manors. Princeton, Princeton University Press.
Kelly, A. and Brannick, T. (1985) “Industrial Relations Practices in Multinational Companies in Ireland”, Journal of Irish Business and Administrative Research, 7, 98-111.
Kelly, P. (2007) “A huge one in seven works in retail sector”, Irish Examiner, 7 September 2007.
Lowe, K. B., Milliman, J., De Cieri, H. and Dowling, P. J. (2002) “International compensation practices: a ten-country comparative analysis”, Human Resource Management,41, 1, 45-66.
Mabey, C. and Ramirez, M. (2004) Developing Managers: A European Perspective. London, Chartered Management Institute.
McDonnell, A., Lavelle, J., Gunnigle, P. and Collings, D. G. (2007) “Management Research on Multinational Corporations: A Methodological Critique”, Economic and Social Review,38, 2, 235-58.
Mooney, P.M. (1989). “From Industrial Relations to Employee Relations in Ireland”, Unpublished PhD Thesis, Trinity College, Dublin.
Morley, M. and Gunnigle, P. (1997) “Compensation and Benefits” in Gunnigle, P., Morley, M., Clifford, N. and Turner, T. (Eds) Human Resource Management in Irish Organisations: Practice in Perspective. Dublin, Oak Tree Press.
Morley, M., Gunnigle, P. and Turner, T. (2001) “The Cranfield Network on Human Resource Management (CranetE) Survey: Executive Report Ireland 1999/2000”, Limerick: Employment Relations Research Unit, College of Business, University of Limerick.
Murray, S. (1984). Employee Relations in Irish Private Sector Manufacturing Industry. Dublin, Industrial Development Authority.
O’Sullivan, M. (2000) Contests for Corporate Control: Corporate Governance and Economic Performance in the United States and Germany. Oxford, Oxford University Press.
OECD (2006) Trends and Recent Developments in FDI. Paris, OECD.
Perlmutter, H.V. (1969) “The tortuous evolution of the multinational corporation”, Columbia Journal of World Business, 4, 1, 9-18.
Porter, M. (1985) Competitive Advantage, New York, Free Press.
Purcell, J. (2004), “The HRM-Performance Link: Why, How and When does People Management Impact on Organisational Performance?”, Paper presented at the 12th Annual John Lovett Memorial Lecture, University of Limerick, March.
Purcell, J., Kinnie, N., Hutchinson, S., Rayton, B. and Swart, J. (2003) Understanding the People and Performance Link: Unlocking the Black Box, London, Chartered Institute of Personnel and Development.

90
Rios-Morales, R. and Brennan, L (2007) “Ireland’s Foreign Direct Investment Competitive Advantage and Japanese Outward Direct Investment”, Asia Pacific Business Review, 13, 2, 201-31.
Roche, W. (2001). “Accounting for the trend in trade union recognition in Ireland”, Industrial Relations Journal, 32, 1, 37-54.
Roche, W. and Turner, T. (1994) “Testing Alternative Models of Human Resource Policy Effects on Trade Union Recognition in the Republic of Ireland”, International Journal of Human Resource Management, 5, 3, 721-53.
Roche, W. and Turner, T. (1998) “Human Resource Management and Industrial Relations: Substitution, Dualism and Partnership”, in Roche, W., Monks, K. and Walsh, J. (Eds.) Human Resource Strategies: Policy and Practice in Ireland. Dublin, Oak Tree Press.
Roche, W.K. and Geary, J. (1996) “Multinational Companies in Ireland: Adapting to or diverging from National Industrial Relations practices and traditions”, Irish Business and Administrative Review, 17, 14-31.
Roche, W.K. and Geary, J. (2002) “Collaborative production and the Irish boom: work organisation, partnership and direct involvement in the Irish workplace”, in D’Art, D. and Turner, T. (Eds) Irish Employment Relation in the New Economy, Dublin, Blackhall Publishing.
Rosenzweig, P.M. and Nohria, N. (1994) “Influences on Human Resource Management Practices in Multinational Corporations”, Journal of International Business Studies, 25, 2, 229-42.
Scullion, H. (1994) “Staffing Policies and Strategic Control in British Multinationals”, International Studies of Management and Organization, 24, 3, 86-104.
Scullion, H. and Collings, D. G. (2006) Global Staffing, Abingdon (U.K), Routledge.
Scullion, H. and Starkey, K. (2000) “In search of the changing role of the corporate human resource function in the international firm”, International Journal of Human Resource Management, 11, 6, 1061-81.
Solomon, C. (1995) “Learning to manage host-country nationals”, Personnel Journal, 74, 3, 60-66.
Sparrow, P., Brewster, C. and Harris, H. (2004) Globalising Human Resource Management. London, Routledge.
Sturgeon, T. (2001) “How do we define value chains and production networks”, Globalization Working Paper 00-010, Industrial Performance Center, Massachusetts Institute of Technology.
Suutari, V. (2002) “Global leader development: an emerging research agenda', Career Development International, 7, 4, 218-33.
Tansey, P. (1998) Ireland at Work: Economic growth and the Labour Market 1987 – 1997. Dublin, Oak Tree Press.
91
Tregaskis, O., Glover, L. and Ferner, A. (2005) International HR Networks in Multinational Companies, Chartered Institute of Personnel and Development Research Report, London, Chartered Institute of Personnel and Development.
Turner, T., D'Art, D. and Gunnigle, P. (1997a) “Pluralism in retreat: A comparison of Irish and multinational manufacturing companies”, International Journal of Human Resource Management, 8, 6, 825-40.
Turner, T., D'Art, D. and Gunnigle, P. (1997b) “US Multinationals: changing the framework of Irish industrial relations?” Industrial Relations Journal, 28, 2, 92-102.
Turner, T., D'Art, D. and Gunnigle, P. (2001) “Multinationals and human resource practices in Ireland: a rejection of the 'new conformance thesis': a reply”, International Journal of Human Resource Management, 12, 1, 128-33.
United Nations Conference on Trade and Development [UNCTAD] (2004) World Investment Report 2004. Decision on Investment, Technology and Enterprise Development. New York and Geneva, United Nations.
United Nations Conference on Trade and Development [UNCTAD] (2006) World Investment Report 2006. FDI from Developing and Transition Economies: Implications for Development. New York and Geneva, United Nations.
Wallace, J., Gunnigle, P. and Mc Mahon, G. (2004) Industrial Relations in Ireland: Third edition, Dublin, Gill and Macmillan.
Wrynn, J. (1997) “Foreign Direct Investment to a peripheral country: The case for Ireland” in Fynes B. and Ennis, S. (Eds.) Competing from the periphery. Dublin, Oak Tree Press.