Entrntry Strategies of Multinational Companies Into the Capital Market of Bangladesh

0
GROWTH STRATEGIES OF MULTINATIONAL COMPANIES
Jewelry Retail Industry
Valérie Haapalainen Nan Skog
Bachelor’s Thesis February 2011
Degree Programme in International Business Business and Services Management

0 Author(s) HAAPALAINEN, Valérie SKOG, Nan
Type of publicationBachelor´s Thesis
Date 07022011
Pages 107
Language English
Confidential ( ) Until
Permission for web publication ( x )
Title GROWTH STRATEGIES OF MULTINATIONAL COMPANIES Industry: Jewelry Retail Industry Degree Programme Degree Programme in International Business Tutor(s) AKPINAR, Murat Assigned by Abstract This thesis investigates business and growth strategies of 4 multinational companies within the jewelry retail industry. The main objective is to identify whether a company’s performance is determined by its growth strategy or not. The 4 formulated tasks for the research are (1) to understand what kind of business models and strategies global jewelry retailers pursue, (2) what growth strategies global jewelry retailers pursue and (3) if there is a link between a company’s growth strategy and its profitability. Finally (4) the findings are reviewed on their transferability to other industries. Each task represents a research question to be answered. To fulfill the tasks and reach the objective, the case companies’ strategic business models and growth strategies are investigated in the first part of the thesis. For the investigation and analysis Porter’s competitive analysis and generic strategies as well as the concepts of diversification and internationalization are applied and the first findings generated. In the second part the generated findings are related to each company’s revenue growth, operating profit margin and return on assets for the chosen time period 2005‐2009 to assess each company’s profitability and derive the findings to achieve the main objective. The findings regarding the business models and growth strategies pursued are that all of them are based on Porter’s generic strategies as well as internationalization and diversification but there is no specific preference given to any of the strategic elements. The main finding of the thesis is that growth strategies do to not have a significant positive or negative impact on the overall profitability. In the context of strategic management they can support in a positive or negative way the strategic decisions, but to assess a company’s profitability a broader range of indicators has to be considered, as for example the business model and strategy as well as the market. This perception and approach is found to be valid for other industries and businesses. Keywords Multiple Case Study, Cross Case Analysis, Retailing Industry, Diamond Jewelry, Retail Jewelry, Generic Strategies, Growth Strategies, Internationalization, Diversification, Competitive Analysis, Profitability, Strategic Management , M.E.Porter, I. Ansoff Miscellaneous

1 TABLE OF CONTENT
1 INTRODUCTION 4
1.1 INTRODUCTION TO JEWELRY RETAIL INDUSTRY 5 1.2 RESEARCH QUESTIONS 6 1.3 METHODOLOGY 6
2 THEORETICAL BACKGROUND 7
2.1 STRATEGIC MANAGEMENT 7 2.1.1 PORTER’S GENERIC STRATEGIES 14 2.1.2 GENERIC STRATEGIES AND COMPETITIVE ANALYSIS 19 2.1.3 THE VALUE CHAIN CONCEPT 21 2.1.4 COMPLEMENTARY STRATEGIC MANAGEMENT TOOLS 23 2.2 GROWTH STRATEGIES 24 2.2.1 DIVERSIFICATION 24 2.2.2 INTERNATIONALIZATION 26 2.2.3 DIVERSIFICATION VS. INTERNATIONALIZATION 30 2.3 TOOLS USED FOR ANALYSIS 31
3 MULTIPLE CASE STUDY 32
3.1 JEWELRY RETAIL INDUSTRY 32 3.2 JEWELRY RETAIL INDUSTRY VALUE CHAIN 33 3.3 CASE COMPANIES 37 3.3.1 TIFFANY & CO. 37 3.3.2 ZALE CORPORATION 44 3.3.3 BLUE NILE INC. 47 3.3.4 SIGNET JEWELERS LIMITED 53 3.4 CROSS-CASE ANALYSIS 58 3.4.1 SUMMARY ON CASE COMPANIES STRATEGIES 58 3.4.1.1 Tiffany & Co. 58 3.4.1.2 Zale Corporation 61 3.4.1.3 Blue Nile 62 3.4.1.4 Signet Jewelers 65 3.4.2 COMPANIES’ KEY FINANCIAL RATIOS 67 3.4.3 LEVEL OF DIVERSIFICATION 70 3.4.4 LEVEL OF INTERNATIONALIZATION 73 3.4.5 ANALYSIS AND FINDINGS 77
4 DISCUSSION 85
5 CONCLUSIONS 90
REFERENCES 93

2 BOOKS & PUBLICATIONS 93 ELECTRONIC SOURCES 94
APPENDICES 101
APPENDIX 1. COMPANIES’ KEY FINANCIALS 101 APPENDIX 2. COMPANIES’ AVERAGE KEY FINANCIAL RATIOS 102 APPENDIX 3. COMPANIES STRATEGIC BUSINESS AREAS 103 APPENDIX 4. COMPANIES’ DIVERSIFICATION 2005-2009 (MAIN SBA’S) 104 APPENDIX 5. COMPANIES’ FOREIGN SALES PERCENTAGE 105

3
FIGURES
FIGURE 1. The Five Forces of the Competitive Analysis and their interrelation 12 FIGURE 2. The Strategic Positioning Model 15 FIGURE 3. Porter's Five Generic Strategies according to David 17 FIGURE 4. Generic Strategies and Industry Forces 20 FIGURE 5. Porter's Value Chain 21 FIGURE 6. Ansoff Matrix 25 FIGURE 7. Jewelry Retail Industry Value Chain 34 FIGURE 8. Tiffany & Co.’s Foreign Sales Percentage 2005-2009 74 FIGURE 9. Zale Corporation’s Foreign Sales Percentage 2005-2009 75 FIGURE 10. Blue Nile’s Foreign Sales Percentage 2005-2009 76 FIGURE 11. Tiffany & Co.’s Foreign Sales Percentage 2005-2009 77 FIGURE 12. Profitability: Average RG vs. Number of SBA's 79 FIGURE 13. Profitability: Average OPM vs. Number of SBA's 80 FIGURE 14. Profitability: Average ROA vs. Number of SBA's 81 FIGURE 15. Profitability: Average RG vs. Level of Internationalization 2005-2009 83 FIGURE 16. Profitability: Average OPM vs. Level of Internationalization 2005-2009 83 FIGURE 17. Profitability: Average ROA vs. Level of Internationalization 2005-2009 84
TABLES
TABLE 1. Key Financial Ratios of Tiffany & Co. 67 TABLE 2. Key Financial Ratios of Zale Corporation 68 TABLE 3. Key Financial Ratios of Blue Nile 68 TABLE 4. Key Financial Ratios Signet Jewelers Ltd. 69 TABLE 5. Case companies’ product category: Item 70 TABLE 6. Case companies’ product category: Related Services 71 TABLE 7. Case companies’ product category: Unrelated Services 71 TABLE 8. List of SBA's per case company 72 TABLE 9. List of related SBA's per case company 72 TABLE 10. Case companies’ number of SBA's 2005-2009 73

4 1 INTRODUCTION
The authors are interested in investigating business and growth strategies in order to
understand, if a certain set of strategies provides the best possible starting point for a
business of their own. One of the authors has a personal proximity to gemstones with
origin in the Republic of the Union of Myanmar, which provides the connection and
interest in the jewelry retail industry.
The main goals for this research are in the first step to investigate if there is a
connection between a company’s growth strategy and its profitability and in the second
step to assess if the findings can be generalized and transferred to other industries.
To achieve the above described goals, the paper starts in Chapter 2 with the theoretical
background of this research. An introduction is given to Strategic Management and its
framework to define, plan and implement a company’s strategic as well as assess its
performance. With the information on Strategic Management Michael Porter’s models
on competitive strategy and competitive advantage are introduced and discussed further.
Both models have been introduced in the 1980’s and are still amongst the most popular
ones used to decide on a company’s strategy in today’s economic environment. The
theoretical background is completed with the introduction and discussion of the growth
strategies diversification and internationalization according to Ansoff and others. The
discussed information in Chapter 2 provides the theoretical background to understand
and assess a company’s competitive, growth and internationalization strategy.
The first part of chapter 3 gives an introduction to the jewelry retail industry and the
case companies. The second part of chapter 3 states the multiple case study outcomes
and relates it to the theoretical background. The findings of Chapter 3 will then be
analyzed, discussed and finalized in Chapter 4. The discussion and analysis in Chapter 3
and 4 provides the findings and answers to the research questions.
Various sources of information that were found related and important are used in this
thesis report. The secondary data collection for this thesis was obtained through the
Internet from different sources, such as market analysis, press articles, journals and
reports, and printed information, such as books.

5 The information gathered, discussed and analyzed throughout the process will be
summarized once more in Chapter 5.
1.1 Introduction to Jewelry Retail Industry
Jewelry has been part of human civilization for a long time. And today, jewelry is used
as symbols for celebrations such as engagements, wedding, and anniversaries. It is also
used as symbols for communication and symbols for identity and individualism. The
jewelry retail industry has changed and exhibited growth over the past decade due to
increasing income and demand from the emerging economies across the world. The
USA remains as the largest consumer for jewelry, followed by China, India, the Middle
East and Japan. The UK and Italy are the largest consumers in Europe. China and India
are expected to become as the largest consumption markets for both traditional and
branded jewelry.
The global jewelry and watches market had a total revenue of $ 181,454.8 million in
2009. This represents a compound annual growth rate (CAGR) of 3.7 % for the period
2005-2009. The market is expected to reach a value of $229,421.5 million by the end of
2014. In 2009, global jewelry sales had total revenues of $ 149,463.3 million which is
equivalent to 82.4 % of the market’s overall value. (Datamonitor 2010)
The jewelry retail industry is highly competitive and fragmented. The top jewelry retail
businesses only hold less than 50 % of the market. This is rather encouraging for small
jewelry retailers. Jewelry sales are partly dependent on consumer income. Therefore,
small jewelers can effectively compete with larger jewelry chains as price is not the
main factor determining sales. A company’s profitability is dependent on good
merchandising and effective marketing. Jewelry is not only sold by specialized jewelry
retailers, but also by department stores, online, and mass merchants.
More information about jewelry retail industry will be discussed in Chapter 3.1.
6 1.2 Research Questions
As stated earlier the aim for this paper is to analyze global jewelry retailing business
and growth strategies to be able to draw conclusions on whether the business model and
strategic decisions have an impact on the company’s profitability. Furthermore the
findings will be analyzed regarding their validity for other industries and markets.
The research questions to lead through the process are the following:
1. What kind of business models and strategies do global jewelry retailers pursue?
2. What growth strategies do global jewelry retailers pursue?
3. Is there a link between a company’s strategy and its performance?
4. If there is a link are the findings transferrable to other industries or markets?
1.3 Methodology
The data collection is done performing a holistic multiple case study on four case
companies. The strategy is to provide answers to the research questions 1 and 2 under
1.2. The remaining research questions 3 and 4 will be discussed and answered during
the analysis and discussion of the findings.
The method of a multiple case study has been chosen based on the research goal to
identify shared strategic point of views and common strategic decisions amongst the
companies. The main motive is to identify and establish whether the findings out of the
first case occur also in the other cases and if the findings can be generalized for the
market and industry. Therefore secondary data like annual reports, press releases, and
reports on the case companies is explored and analyzed. Furthermore the findings are
meant to be analyzed for their validity for other industries and markets. According to
Saunders et al (2007, p. 140), Yin (2003) argues that multiple case studies are preferable
over single case studies to generalize from findings. The case companies are analyzed
as comprehensive entities and therefore according to Yin (2003) treated as holistic case
studies.
The case companies all operate in the category ‘Diamond and Diamond jewelry
retailing’ within the global jewelry retailing business and therefore contribute to a

7
homogenous sample. (Saunders et al., 2007, p.232) Based on the homogenous sample
the research will be able to investigate the category more in-depth. The chosen case
companies are all globally operating jewelry retailers and are all retailing diamond
jewelry, the main product this research is focusing on. They have established
themselves amongst the leading companies in the market and are listed as top
competitors. (MarketLine, Top Competitors, 2010)
2 THEORETICAL BACKGROUND
As described in the industry and market introduction in Chapter 3.1, the jewelry
retailing business is currently undergoing the change from a highly fragmented market
to a more consolidated market. Companies operating within this market face the
challenge of keeping their business operations profitable and probably face the need to
readjust their business model, their operations and strategies to maintain their
competitive advantage over their competition. The following chapter introduces the
relevant theories such as the concept of strategic management, Porter’s theoretical
concepts, and growth strategies applied in the company analysis as well as during the
discussion of the findings.
2.1 Strategic Management
In today’s competitive business environments companies map out their plans how to
sustain their business operations, their competitive advantage and increase their
profitability using the concept of strategic management. The benefits of strategic
management have already been pointed out in the 1960’s when Alfred Chandler stated
that ‘structure follows strategy’, meaning that a long-term perspective and formulated
strategy provides a company structure, focus, alignment and direction. Carpenter and
Sanders (2007) describe strategic management as ‘…process by which a firm
incorporates the tools and frameworks for developing and implementing a
strategy.’(p.7) Since Alfred Chandler’s statement a broad range of tools for application
has been developed and range from SWOT 1 Analysis, Balanced Scorecards, Gap
1 SWOT: Strengths Weaknesses Opportunities and Threats, see chapter 2.1.5
8 Analysis, and Portfolio Theory including the BCG Analysis Strategy to the Blue Ocean
Strategy. All tools can be applied throughout the strategic management process and
companies choose the most suitable tools according to their individual requirements.
However all companies use strategic management and its tools to anticipate the business
conditions of tomorrow and develop a strategy how to capitalize upon them. In other
words the purpose of strategic management is to exploit and create new and different
opportunities for tomorrow. (David 2009, p.36)
A strategic management process is compiled out of the sequences strategy formulation,
strategy implementation and strategy evaluation. The formulation of a strategy includes
the formulation of a company’s vision and mission statement to define the purpose and
values of the company. For example Blue Nile Inc. mission statement in its annual
report 2009 is ‘… to build the premier specialty retailer of jewelry by offering
consumers high quality products at compelling values through an empowering shopping
experience.’ This is the allover goal for the company’s operations and all actions taken
are aiming to reach this allover goal. With the vision and mission statement in place
companies formulate more specific goals and objectives. Most companies line out there
goals and objectives in their annual reports reflecting on the past business year and
formulating the goals and objectives for the upcoming one. Signet Jewelers for example
formulated in their annual report 2009/2010 for the upcoming business year the
objective to maximize sales by gaining profitable market share in existing stores by
focusing on enhancing competitive strengths rather than opening additional locations.
To achieve the set goals and objectives a company will assess their internal strengths
and weaknesses as well as the external opportunities and threats, most likely performing
a SWOT analysis and a competitive analysis to assess whether the set goals and
objectives are feasible and achievable. With the framework set the company is now able
to formulate its strategies. These strategies map out the plan, tasks and actions how to
achieve the set goals. These strategies include decisions regarding the entry of a new
market or new industry, the strategic positioning, the competitive advantage,
differentiation and internationalization and the actions to pursue them. Strategic
management tools like the SWOT analysis, the competitive analysis and generic
strategies are common to support the decisions. Annual reports include information
referring to the SWOT analysis in e.g. strengths and weaknesses, to the competitive
analysis in e.g. the sections overview, mid-term outlook, business, risk factors or brand
reviews and the generic strategies in e.g. their strategy review.

9
As Chandler stated, structure follows strategy and the company is now ready to
implement its strategy throughout all levels of its organization and operations. During
this process sequins the strategies are broken down into daily activities, monthly tasks
and quarterly objectives to achieve step by step the overall goals and objectives of the
strategy. The implementation is considered to be the most difficult part, since the
success is depending on the ability to communicate the added value and benefits
resulting from the strategy and a company’s employees to embrace and work in line
with it.
To evaluate the success and feasibility of a strategy in place there have to be assessment
tools and criteria. Companies will analyze market share growth, store efficiency,
purchase volume, financial ratios like ROCE, ROA, OPM or similar. The criteria
depend on the company’s goals and objectives.
In the beginning has been mentioned that strategic management is a continuous process
and constantly evolving with the businesses and its business environment. A
comprehensive summary of strategic management is formulated by Lamb (1984):
Strategic management is an ongoing process that evaluates and controls the business
and the industries in which the company is involved; assesses its competitors and sets
goals and strategies to meet all existing and potential competitors; and then reassesses
each strategy annually or quarterly to determine how it has been implemented and
whether it has succeeded or needs replacement by a new strategy to meet changed
circumstances, new technology, new competitors, a new economic environment, a new
social, financial or political environment.
One of the tools pointed out in the strategy development process is a competitive
analysis according to Porter’s Five Forces Model. Applying this model a company can
assess whether it is profitable to enter a new industry or market and what business
conditions have to be expected. The following chapter introduces Porter’s Five Forces
Model more in depth and the model will be referred to in the analysis of the industry
and market.

10 To enter a market and develop a strategy a company is naturally interested to understand
what kind of competition and market conditions there are and if it is an attractive step.
As response to this demand Porter developed his competitive analysis in using the
framework of five forces shaping industries, markets and competition. Industry
attractiveness in this model is considered as the overall profitability of the industry. The
five forces impact collectively the profitability through their effects on price, costs and
investment requirements. The more impact they have the less attractive the industry gets
and vice versa. The five forces shaping an industry are the threat of new entrants, the
threat of substitute products or services, the bargaining power of suppliers, the
bargaining power of buyers and the intensity of competitive rivalry.
The threat of new entrants describes how easy and quickly new companies can enter the
market or market segment and increase the competition and rivalry amongst the
companies operating there. Well-known entry barriers in a global business environment
are patents, government policies, tariffs and quotas to protect domestic markets against
new foreign entrants. Other entry barriers are e.g. the necessity to gain economy of scale
quickly accompanied by a large investment in production facilities and equipment. In a
market that is dominated by the existing companies and not growing, new entrants will
find the market not attractive enough to enter. This is also applicable to products and
markets which require sophisticated technology and specialized know-how. Another
entry barrier is the tendency of customer concentration leading often to a strong brand
and product loyalty amongst them and prevents a successful new entrance. New entrants
also fail in the long run to break into a market with a desired product or service if their
distribution network cannot serve the demand. New technologies and new business
models like e-commerce can also emerge to a new entrant thread. E-business models
like the online retailers Amazon or Blue Nile increased the competition for the brick-
and-mortar stores selling a similar product range. Established companies react to new
entrants with e.g. lowering their product prices, adding product features, enhancing
product quality, extending warranties or financing offers (David 2009, p.120).
The threat of substitute products or services describes products in other industries that
can perform the same function. (Boddy 2008, p.96) Substitute products influence a
product's price elasticity, since the demand becomes more elastic due to the availability
of alternative substitute products. The switching cost declines and puts a ceiling on the
product pricing (David, 2009, p.121), leading to a more intense rivalry amongst the
11 companies. The success of a substitute product can be measured by its gained market
share and growth. The current growing e-book and e-reader business provides a
substitute product and service to paper books and audio books. With the technology
becoming affordable consumers have the option to switch easily. Another current
development is laser eye surgery, which becomes more popular and affordable as
substitute to glasses and contact lenses. For the here discussed diamond jewelry industry
the invention of the synthetic diamond in the 1950’s and the cubic zirconia in the 1970’s
are powerful substitute products.
The bargaining power of suppliers describes the power in the relationship between the
company and its suppliers. Suppliers are powerful when there are only a few suppliers,
the supplied product or material is distinctive and the cost of switching is high. In the
case of the diamond supply business raw diamond suppliers like de Beers’ diamond
trading group, accumulating up to 40% of the worldwide raw diamond supply, are
powerful suppliers. To secure, sustain and control the supply companies establish close
relationships with their suppliers and pursue a backward integration strategy or sign
long-term supply contracts.
The bargaining power of buyers describes the power in the relationship between the
company and its buyer or customers. Buyers or customers are powerful when they are
concentrated and small in number or when they are many and large in size and there a
substitute products available. In latter case the number of potential buyers is large and
their switching cost low due to available substitute products. Therefore companies
compete over price, quality, warranty, accessories and innovation to create customer
loyalty and the buyer’s power for negotiation is big. White goods, like washing
machines and refrigerators for example are such commodities. If buyers are
concentrated and have substitute options again the company is forced to compete over
quality, features, service and price to sustain the few business options available in the
market. Defense forces or governmental calls for quotation are an example of
concentrated powerful buyers. The development of the internet and virtual communities
sharing information on manufacturers, products, services and their features as well as
buyers experiences furthermore enhance buyer’s bargaining power.
All the four forces discussed above contribute to the already existing intensity of rivalry
among existing competitors in the market or its segment. Rivalry is strong and lowering

12 the markets attractiveness when e.g. there is no dominating company within the market,
the market growth is low, the production costs high and a substitute products available.
These markets are highly fragmented and competitive markets. Companies are under
pressure to sustain their competitive advantage and market share. In these markets
companies peruse a vertical integration strategy and enhance their distribution strategy
to have their product easily available for the customer. An example is the here discussed
fragmented jewelry retailing industry as well as Blue Nile’s online sales and distribution
strategy. Furthermore the economic crises initiated a market consolidation development
of the highly fragmented market. Rivalry is also increased through the globalization of
the markets and the virtual business environment in the internet. Globalization and the
internet allow new foreign entries to enter the market and put additional pressure on the
products, their prices and their features.
Porter’s five forces are interrelated and developments in one force have an impact on
the remaining forces. Figure 1 below illustrates the interrelation and summarizes the
elements discussed before.
FIGURE 1. The Five Forces of the Competitive Analysis and their interrelation
Source: ‘The Five Competitive Forces That Shape Strategy’ by M.E.Porter, Harvard Business Review
Porter’s Five Forces Model has been discussed as well as challenged over time by other
individuals or theories, which led to the extension of the model by a 6th force. The 6th

13 force relates to the power groups or entities not mentioned in the 5 Forces Model, but
impacting the competition. The 6th force is different from industry to industry and from
market to market, but the most frequently mentioned are complementors and the
government. According to Hill et al (2008, p.54), Andrew Grove, a former CEO of
Intel, argued that the model does not take into consideration the power of
complementors. A complemetor is a ‘…product or service which tend to increase sales
in another industry.’ (Carpenter et al. 2007, p.104) Complementary products are e.g.
Intel microprocessors in e.g. HP laptops. The faster and more reliable the
complementary product, the Intel microprocessor, the more value add is created for the
customer and the more the customer is probably willing to pay for the HP laptop with
the ‘Intel inside’ mark. Successful strategic alliances like these can enhance product
attractiveness, create additional demand and increase profit for both parties. (Hill et al,
2008, p.54) The government is seen as a force being able to impact not only the
competition directly but also indirectly by impacting on all five forces. Environmental
regulations e.g. can be considered as a governmental 6th force. (Rugman and Verbeke
2005, p.380) Furthermore groups and entities like the public, the shareholders and the
employees are have the power to influence the competition and referred to as 6th force.
(Papers for you.2002-2010)
A profound and comprehensively conducted competitive analysis identifies key aspects
of each competitive force impacting the company, evaluates how strong and important
each aspect is to the company and supports the decision whether the collective strength
of the aspects is worth staying in entering or even leaving the industry. (David 2009,
p.106) The above mentioned possibility of an existing 6th force needs also to be
evaluated and analyzed.
Completing the competitive analysis the company has done necessary theoretical
ground work to establish its strategy on and needs to define now the detailed industry
approach. In their focus is now how to gain substantial competitive advantage over its
competition and sustain profitability. To position the company the most profitable
within an industry and market the company uses the strategic positioning model based
on Porter’s generic strategies. The next chapter introduces to the model and will be
referred to in the company analysis section.

14 2.1.1 Porter’s Generic Strategies
Porter introduced this model in 1980 with the publication of his book ‘Competitive
Strategy’. The purpose of the strategic positioning model and its generic strategies is to
establish, sustain and grow a company’s competitive advantage over its competition.
Together with the competitive analysis model, the market positioning and competitive
advantage model and the value chain model Porter provides a comprehensive strategic
approach for a company to sustain and maximize its profitability.
The concept of competitive advantage was introduced by Porter in 1985 and describes
competitive advantage as an attribute that ‘…grows fundamentally from the value a firm
is able to create ... Value is what buyers are willing to pay, and superior value stems
from offering lower prices than competitors for equivalent benefits or providing unique
benefits that more than offset higher prices.’(Porter, 1985, p.3)
Competitive advantage describes therefore the situation when a company is able to
deliver the same benefits as its competitors but at a lower cost or to deliver benefits that
exceed those of competing products (QuickMBA 1999-2010) as well as the company’s
ability to create value in a way that its competitors cannot (Carpenter and Saunders,
2007, p.19). In his work, Porter (Competitive Advantage, 1985) argues that from a
strategic perspective, a company’s strengths to create this value are either in the
category cost advantage or differentiation. Both strengths can be applied strategically in
a broad or narrow scope, creating three generic strategies: cost leadership,
differentiation and focus. These strategies are independent from a company, market or
industry and therefore generic. Using the generic strategies a company can prepare the
framework for its strategy implementation on the level of its strategic business units.
The Strategic Positioning Model (Carpenter and Saunders, 2007, p.127) visualizes the
merging of the categories and scope into the following two-by-two matrix shown in
Figure 2:

15
Low-Cost Differentiation
Stra
tegi
cT
arge
tBroad
e.g. Industry wide
Narrow e.g. Particular segment only
Strategic Advantage
Low-Cost Leadership Differentiation
Focused Low‐Cost
Leadership
Focused Differentiation
FIGURE 2. The Strategic Positioning Model
Source: Carpenter and Sanders (2007), p.127
The cost leadership strategy uses the lower production unit price as strategic key
element to gain bigger market share or higher profits as the competition and probably
driving some competitors out of the market. (Carpenter and Sanders 2007, p.128) The
cost leadership strategy’s key competitive advantage is the lower price in comparison or
the lowest price in the entire market and therefore appealing to cost-conscious or price-
sensitive industries and consumers. In reference to the competitive analysis in these
markets the buyers have significant power to bargain prices, it is easy for them to switch
between manufacturers and the products are very alike. The products serve basic needs
and consumers all use them in a similar way, like e.g. a tooth brush and the market size
is large. To achieve and sustain the cost leadership companies pursue strategies to cut
down costs to a minimum through e.g. spreading fixed cost over a large product volume
to benefit from the economies of scale. Furthermore production costs are cut down
producing more and more standardized products and the outsourcing of e.g. overhead
activities. In addition to the companies peruse a maximum integration of their value
chain to sustain low costs. Companies pursuing cost leadership have to be a step ahead
of their competition to sustain the profitable cost gap and not only predict changes in
customer behavior or substitute products, but also the impact of technology
breakthroughs and value chain developments to their business and keep pricing
aggressive but not cutting down their own profit. Examples for a cost leadership
strategy are food discounter Lidl or clothing retailer H&M.
16
Pricing is not the strategic key element for a company pursuing the differentiation
strategy. Their aim is to gain market share and higher profits though a unique attribute
or feature related to their product and/or company. Carpenter and Sanders (2007) argue
that ‘…if its [the company’s] customers are willing to pay for this uniqueness, the firm
has a competitive advantage based on differentiation.’(p.128) Differentiated products
can be either sold at industry average prices and will grow the company’s market share
or can be sold at higher prices to increase the revenue. Both scenarios are possible due
to the products unique attribute, that differentiates it from its competition and customers
are willing to pay for. The consumers within this large market are less price sensitive,
more value add orientated and a successful differentiation strategy builds customer
loyalty with customers reluctant to switch products. The markets for differentiation
strategies are markets with lower buyer power, since the differentiation makes it hard to
switch to alternatives and their customer loyalty creates barriers for substitute products.
It can also be a market in which product features change at a rapid pace due to
technological change. Differentiation can be achieved at any stage and activity of the
value chain from various product features, rapid product upgrade, product compatibility,
comprehensive customer service, less maintenance, higher durability, ease of use,
engineering design, marketing, packaging, perceived value, status and image etc. .
However the key to a successful competitive advantage based on differentiation is a)
that the product exceeds the customer’s expectations and delivers extra value to justify
the higher price and b) that the attribute is hard, expensive and resource consuming to
copy (David 2009 ,p.195). To sustain the differentiation advantage the product’s unique
attribute has to be very hard, very complex or very expensive to duplicate or the pace of
change in attributes has to be too fast for competition to get ahead. Attributes like
mandatory certified product standardization protect from the development of quick
manufactured competitive products or a superior brand, where perceived value may be
more important than the actual value to the customer.
Good examples for a successful differentiation strategy based on a strong brand are
Apples I-Pod, I-Phone and I-Pad. Reference The car manufacturer Renault had a
temporary competitive advantage on differentiation when the Renault Laguna was the
first car to achieve 5 stars in the NCAP crash test in 2001. The advantage lasted as long
no other car in the market reached the same result. A successful differentiation strategy

17 is based on the closeness of the product and company to its customers and feasibility
studies to determine the desired attributes.
The strategy of focus can be combined with the cost leadership or differentiation
strategy and applies both strategies core ideas to a narrow market segment. Focused cost
leadership describes the ability of a company to offer a product to a niche group of
customers or niche market at the lowest price in the market. For example Ryan Air is
focusing on extremely cost sensitive commercial travelers by offering flights at the
lowest prices in the niche market. Focused differentiation describes unique products
offered to a niche market and target group. In this case the products get extremely rare,
unique, custom-made or specialized, that their position is in a high end niche market.
Luxury products or technically very sophisticated products are positioned under the use
of this strategy, e.g. luxury cars like Maserati or Austin Martin.
The four strategies, cost leadership, differentiation, focused cost leadership and focused
differentiation, are commonly used in today’s strategic management and have been
adapted to the changes since their introduction in the 1980’s. According to David (2009,
p.193), e.g. it is possible to differentiate the generic strategies not only into four but into
five detailed types of strategic positions. David takes the two-to-two matrix discussed
above and diversifies the strategies cost leadership and focus into two sub strategies
using the focal points low cost and best value. The two-to-three matrix shown below in
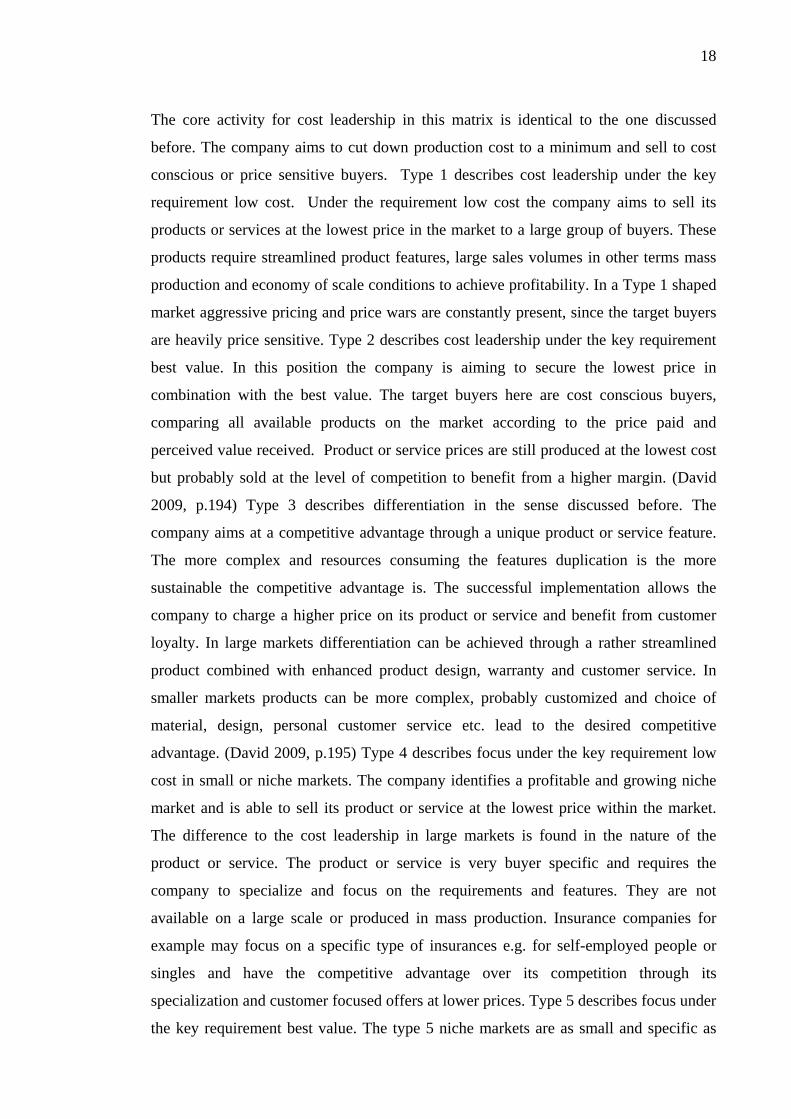
Figure 3 describes 5 types of generic positioning strategies.
FIGURE 3. Porter's Five Generic Strategies according to David
Cost Leadership Differentiation Focus
Large
SmallSIZ
E O
F M
AR
KE
T
GENERIC STRATEGIES
Type 1Type 2
Type 3 -------
Type 4Type 5
------- Type 3
Source: David (2009), p.193
18
The core activity for cost leadership in this matrix is identical to the one discussed
before. The company aims to cut down production cost to a minimum and sell to cost
conscious or price sensitive buyers. Type 1 describes cost leadership under the key
requirement low cost. Under the requirement low cost the company aims to sell its
products or services at the lowest price in the market to a large group of buyers. These
products require streamlined product features, large sales volumes in other terms mass
production and economy of scale conditions to achieve profitability. In a Type 1 shaped
market aggressive pricing and price wars are constantly present, since the target buyers
are heavily price sensitive. Type 2 describes cost leadership under the key requirement
best value. In this position the company is aiming to secure the lowest price in
combination with the best value. The target buyers here are cost conscious buyers,
comparing all available products on the market according to the price paid and
perceived value received. Product or service prices are still produced at the lowest cost
but probably sold at the level of competition to benefit from a higher margin. (David
2009, p.194) Type 3 describes differentiation in the sense discussed before. The
company aims at a competitive advantage through a unique product or service feature.
The more complex and resources consuming the features duplication is the more
sustainable the competitive advantage is. The successful implementation allows the
company to charge a higher price on its product or service and benefit from customer
loyalty. In large markets differentiation can be achieved through a rather streamlined
product combined with enhanced product design, warranty and customer service. In
smaller markets products can be more complex, probably customized and choice of
material, design, personal customer service etc. lead to the desired competitive
advantage. (David 2009, p.195) Type 4 describes focus under the key requirement low
cost in small or niche markets. The company identifies a profitable and growing niche
market and is able to sell its product or service at the lowest price within the market.
The difference to the cost leadership in large markets is found in the nature of the
product or service. The product or service is very buyer specific and requires the
company to specialize and focus on the requirements and features. They are not
available on a large scale or produced in mass production. Insurance companies for
example may focus on a specific type of insurances e.g. for self-employed people or
singles and have the competitive advantage over its competition through its
specialization and customer focused offers at lower prices. Type 5 describes focus under
the key requirement best value. The type 5 niche markets are as small and specific as

19 the ones discussed before, but best value indicates that price is no longer a decision
maker in this strategic concept. (David 2099, p.196) The value and perceived value of
the product or service bought are deal makers for the buyers. Buyers have very specific
and individual requirements to be met and are willing to pay the higher or high price
charged. Products and services are in many sophisticated and unique and probably the
purchase will only be done once like e.g. engagement rings.
David’s diversification of the generic strategies into 5 does not discuss focus strategies
within a large market or cost leadership strategies within small markets. Cost leadership
in the setting of lowest mass production cost and large economy of scale are not
achievable in a small niche market with more specific requirements. Vice versa
differentiated products cannot be sold in a large market demanding streamlined
commodities at a low price level.
Both publisher also discuss integrated positions, which Carpenter and Sanders describe
as ’Strategic positions in which elements of one position support strong standing in
another’. (Carpenter and Sanders. 2007. p.130) They argue an either cost leadership or
differentiation position is no longer profitable for many companies since requirements
from the buyer side are getting more complex. Buyers are no longer purchasing based
on the lowest price available on the market but on a combination of price, design,
quality and convenience. To combine the strategies successfully Porter argues to apply
the strategies to different independent business units or product lines to avoid to get
stuck in the middle and give away its competitive advantage. IKEA is a successful
example of a low-cost leader, who differentiates with a high level of quality in its
different product lines. Toyota has been a low-cost leader with high level quality
differentiation until recent events damaged their achievement significantly.
2.1.2 Generic Strategies and Competitive Analysis
Both models, the competitive analysis and the generic strategies can be merged into a
matrix like the one below in Figure 4 illustrating the possible options, advantages and
consequences for each strategic position a company might choose in general terms and
is used in this chapter to briefly summarize the above discussed aspects.

20
Cost Leadership Differentiation Focus
Rivalry
IND
UST
Y F
OR
CE
GENERIC STRATEGIES
EntryBarriers
BuyerPower
Supplier Power
Threat ofSubstitutes
Better insulated from powerful
suppliers.
Better able to pass on supplier price increases to customers.
Suppliers have power because of low volumes,
but a differentiation-focused firm is better able to
pass on supplier price increases.
Can use low price to defend
against substitutes.
Better able to compete on
price.
Brand loyalty to keep customers
from rivals.
Rivals cannot meet
differentiation-focused
customer needs.
Ability to offer lower price to
powerful buyers.
Large buyers have less power
to negotiate because of few
close alternatives.
Large buyers have less power
to negotiate because of few
alternatives.
Customer's become
attached to differentiating
attributes, reducing threat of substitutes.
Specialized products & core
competency protect against
substitutes.
Ability to cut price in
retaliation deters potential
entrants.
Customer loyalty can discourage potential entrants.
Focusing develops core competencies that can act as an entry barrier.
FIGURE 4. Generic Strategies and Industry Forces
Source: Quick MBA (1999-2010)

21 Since their introduction in the 1980’s Porter’s strategic models have been challenged
and complemented by other points of view on strategic management and the most
popular ones are introduced in the section 2.1.5 below.
2.1.3 The Value Chain Concept
The concept of Value Chain was first developed by Porter in 1985. Porter’s value chain
model (Figure 5) clams to identify the sequence of key generic activities that business
perform in order to generate value for customers. According to Hollensen (2007), the
value chain displays and categorizes the firm’s activities providing value for the
customers and profit for the company. At each stage of the value chain, there is an
opportunity for a firm to compete with their competitors in order to gain competitive
advantage by performing activities more efficiently (lower cost), or performing
activities in a unique way that creates greater buyer value and commands a premium
price (differentiation) (Porter, M, 1990).
FIGURE 5. Porter's Value Chain
Source: Porter, M. (1990), p.41
A cost advantage can be created either by reducing the cost of individual value chain
activities, by reconfiguring the value chain (structural changes such as a new production

22 process, new distribution channels, or a different sales approach), or by controlling the
cost drivers better than the competitors do. Successful cost leaders are often low-cost
product developers, low-cost marketers, and low-cost service providers (Porter, 1990).
A differentiation advantage can be achieved either by changing individual value chain
activities to increase uniqueness in the final product or by reconfiguring the value chain
such as forward or backward integration.
A value chain is an interdependent system or network of activities. One value chain
activity often affects the cost or performance of other ones (Porter, M, 1990).
“Linkages” may exist between activities, which often create trade-offs in performing
different activities that must be optimized. For example, a more costly product design
and more expensive components can reduce after-sale service costs. In order to achieve
competitive advantage, a firm must resolve such trade-off in accordance with its
strategy.
Linkages also require coordination between activities. Coordinated activities reduce
transaction costs, allow better information for control purposes, substitute less costly
operations in one activity for more costly one elsewhere, and reduce the combined time
required to perform them, thus, increasingly important to competitive advantage.
(Porter, M, 1990) For a firm to be succeeded in value chain management, Walters, D &
Lancaster, G (2000) stated that it requires an identification of customer value criteria
and an understanding of the key success factors. These are necessary for creating both
competitive advantage and resultant success.
Porter’s Competitive Analysis, Generic Strategies and Value Chain concept represent
important strategic tools to analyze the meso- and microenvironment a business or
company is operating in and since their introduction in the 1980’s the models have not
been replaced, but integrated into the strategic management process and used in
combination with a wide range of complementary concepts and tools. Some of the
already mentioned concepts and tools will be introduced briefly in the next chapter to
provide a more comprehensive overview.

23 2.1.4 Complementary Strategic Management Tools
Returning briefly to the strategic process discussed in Chapter 2.1 the process was
described as the process of strategy formulation, strategy implementation and strategy
evaluation or a bit more detailed according to Grundy (Grundy 2003, p.9) as the
sequences of External Analysis, Competitive Positioning, Strategic Options,
Implementation and Learning and Control. Prior to the Competitive Analysis a
company is assessing the business environment performing a PESTEL and SWOT
analysis. PESTEL is the abbreviation of the dimensions Political, Economic,
Sociocultural, Technological, Environmental as well as Legal and the analysis
concentrates on the macro environment conditions a company has to deal
with.(Carpenter et al. 2007, pp.91) With the macroenvironment analyzed the company
will use Porter’s Five Forces to analyze the industry structure and complement both
with a SWOT analysis. SWOT is the abbreviation of the dimensions Strengths,
Weaknesses, Opportunities and Threats. The SWOT analysis merges the findings of the
PESTEL and Five Forces into external opportunities and threats to relate them against
the assessed internal strengths and weaknesses. (Boddy 2008, p.190). The strategic
process is then continued using the value chain analysis and the generic strategies
proceeding to the microenvironment and finally implementing the strategy.
W. Chan Kim and Renée Mauborgne argue that strategic processes according to
Porter’s model aim at outperforming the competition within the boundaries of an
existing market to sustain the greater market share and compete for the fewer profits
available. These markets are so called Red Oceans. (Kim and Mauborgne, 2004). Blue
Oceans on the other hand are unknown markets, created in two ways. Either a company
creates a new type of business and product, like eBay did offering auctions online as b-
to-c and c-to-c business opportunity or a company manages to create a Blue Ocean by
pushing and breaking open the given boundaries of a Red Ocean, like Blue Nile has
done taking diamond retailing completely online.
Burke et al. (2010) argue in their research that ‘…businesses may want to consider a
blend of the two approaches. For instance, by slowing down profit erosion with an
effective competitive strategy for an existing market, they can increase the funds
available for blue-ocean investments and thus their chances of finding an untapped
market with plenty of consumers.’ (p.28)

24 2.2 Growth Strategies
Firm growth is related to economic expansion due to processes taking place within the
firm (Penrose, E.T, 1959). The more firms grow the more resources they can access,
thus firm growth is considered as a path dependent process (Akpinar, 2009). The
resource-based view considers a firm’s own set of resources and capabilities as the
driver of growth and states that a firm predicts the growth strategies based on its
resources and competencies (Otto & Low 1998).
A firm’s strategy is at its best continuously reviewed to be able to act, react and adapt to
the movements in a company’s business environment and sustain its competitive
advantage. When a firm seeks to grow, it is also a strategic question whether to
diversify or internationalize to sustain its business operations. The following chapters
introduce both concepts.
2.2.1 Diversification
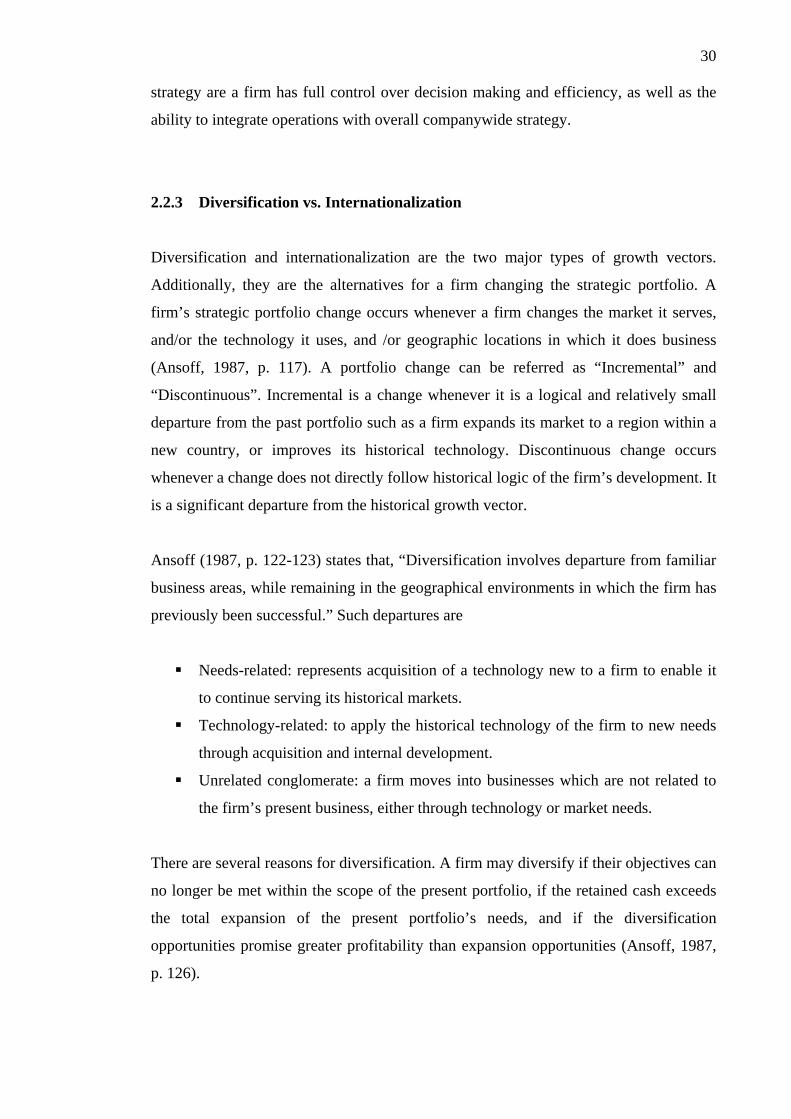
Ignor Ansoff created a matrix (Figure 6) that identified directions for strategic
development (Ansoff, 1988). The matrix presents four different strategies that focused
on the firm’s present and potential products and markets by considering whether the
strategy direction is in new/existing markets with new/existing products (Ansoff 1999-
2010). Diversification is created as one of four broad strategic opens in the model. Apart
from diversification, the others are:
1. Market penetration: the firm seeks growth by increasing the market share of the
present product-markets. This is the least risky strategy for expansion.
2. Market development: the firm aims to increase profit by selling its existing
products to new market segments.
3. Product development: the firm develops new products to its existing customers.
This strategy may be appropriate if the firm’s strengths are related to its specific
customers.

25
Existing Products New Products
Existing Markets Market Penetration Product Development
New Markets Market Development Diversification
FIGURE 6. Ansoff Matrix
Source: ©Ansoff Matrix 1999-2010
The remaining strategic option is diversification, a form of growth strategy. The main
purpose of diversification is to allow the firm to grow by diversifying into new
businesses by developing new products for new markets (Graham Walton, 2007;
Ansoff, 1999-2010). Diversification is considered as the most risky since it requires
both product and market development and they may be outside the firm’s core
competencies.
A firm may diversify if current product lines do not much growth potential, or if current
operations are not profitable. There are two basic diversification strategies,
concentric/related and conglomerate/unrelated (Hunger and Wheelen, 2009, 2003,
2001). Related diversification occurs when a firm enters into strategic business area
(SBAs) by adding products or services, which are related to the existing core SBA. The
goal of related diversification is to achieve strategic fit, which allows a firm to achieve
synergy. Synergy is the ability of two or more businesses will generate more profits
together than they could separately. Hunger and Wheelen (2009) has stated that, this
strategy may be appropriate if a firm has a strong competitive position but current
industry attractiveness is low. Related diversification can be classified by the direction
of diversification, vertical integration (backward and forward) and horizontal
integration.
Backward integration refers to the firm diversifies closer to the sources of raw
materials in the stages of production. It allows a firm to control over the quality
of the supplies being purchased (Thomas, 2010).

26
Forward integration occurs when a firm moves closer to the consumer in terms
of production stages. It allows a firm more control over how its products are sold
and serviced (Thomas, 2010).
Horizontal integration occurs when a firm moves into businesses that are related
to its existing activities (Lynch, 2003; Macmillan et al, 2000).
Unrelated diversification occurs when a firm enters into new SBAs which are not
related to the existing core SBA, either through technology or market needs (Ansoff,
1987, p 123). Synergy may result through the application of management expertise or
financial resources, but the main objective is to acquire valuable assets that will increase
profitability (Thomas, 2010; Walton, 2007). It is crucial to note that if unrelated
diversified businesses seem to grow faster, the track record of diversification remains
poor as in many cases especially if management team lacks experience or skill in the
new line of business (Porter, 1987). A firm may unable to accurately evaluate the
industry’s potential, and problems will eventually occur even the new business is
initially successful.
Additionally, diversification may be accomplished by internal or external.
Internal diversification occurs when a firm enters into a new business, which is
related to its core SBA by developing the new line of business itself. This
frequently involves expanding a firm’s product or market base. A firm may find
new users for its current product, market new products in existing market, or
expand its geographic base to include new customers within its home country or
in international markets (Thomas, 2010).
External diversification occurs when a firm enters into a new business by
purchasing another company or business unit, which commonly in the forms of
mergers and acquisitions (Thomas, 2010).
2.2.2 Internationalization
Internationalization occurs when a firm expands its business activities such as R&D,
production, selling into international markets (Hollensen, 2007). Firms that operate in

27 global industries must complete on worldwide basis if they are to succeed. This is
because their strategic positions in specific markets are affected strongly by their overall
global positions (Kotler et al., 2005). The fundamental reasons for firms to go
international can be seen in proactive and reactive motives. Proactive motive represent
stimuli to attempt strategy changes, which based on the firm’s interesting in exploiting
unique competences and/or market possibilities. Such strategy changes (Hollensen,
2007; Deresky, 2005, p. 223-225) are:
to fulfill a firm’s growth and profit ambitions,
the desire, drive and enthusiasm of management towards internationalization,
a firm produce products or services that are unique or technologically advance in
a specialized field,
foreign market opportunities or market information which distinguish a firm
from its competitors,
resource access and cost savings enhance a firm to control over raw
materials/other resources and lower transportation,
economic of scale, and
tax benefits which may also play a major motivating role. It may allow a firm to
sell its products at a lower cost in foreign markets or to accumulate a higher
profit.
Reactive motives indicate that the firm reacts to pressures or threats in its home market
or in foreign market and adjusts passively to them. Such pressures or threats are
(Hollensen, 2007; Deresky, 2005, p. 223-225):
global competitive pressures, one of the most common reason that prompt a firm
to internationalize,
domestic market is small and saturated,
restrictive trade barriers, which a firm often switch from exporting to overseas
manufacturing,
overproduction/ excess capacity,
unsolicited foreign orders,
extend sales of seasonal products, and
proximity to international customers/ psychological distances.

28 Once a firm had decided to internationalize, it may focus on different ways to enter a
foreign market often varying by targeted country. Management needs to consider their
entry strategies as each strategy involves more commitment and risk, but also more
control and potential profits (Kotler et al., 2005; Deresky, 2005). The followings
examine the various entry and ownership strategies available to firms, including
exporting, licensing, franchising, contract manufacturing, turnkey operations,
management contracts, joint ventures, and wholly-owned subsidiaries set by the firm.
Exporting: is the simplest way and is a relatively low risk way to begin international
expansion (Kotler et al., 2005; Deresky, 2005). Exporting needs little investment, easy
to access to the market and exit from the market. Disadvantages include buy-local
policies and currency fluctuations. Small firms seldom go beyond exporting stage due to
its lack of capital resources and marketing clout. Therefore, exporting is the primary
entry strategy used by small business to compete on an international level. But large
firms use this avenue for many of their products.
Licensing: is a simplest way for a manufacturer to enter international market (Kotler et
al., 2005). According to Deresky (2005, p.238), “licensing is suitable for the mature
phase of a product’s life cycle, when competition is intense, margins decline, and
production is relatively standardized.” The advantages of licensing are to avoid the
tariffs and quotas usually imposed on exports, and no asset ownership risk. The most
common disadvantage is the licensor’s lack of control over the licensee’s activities and
performance.
Franchising: the franchisor licenses its trademark, products and services, and operating
principles to the franchisee for an initial fee and ongoing royalties (Deresky, 2005).
Franchising involves relatively little risk and little investment in capital or human
resources, and is fast access to international market. Hence, franchising can be an ideal
strategy for small businesses.
Contract Manufacturing: the firm contracts with manufacturers in the foreign country
to produce its product or provide its service (Kotler et al., al 2005). This entry strategy
is a common means of using cheaper oversea labor, quick entry into a country with a
low capital investment, and none of the problems of local ownership. A firm may have a
later opportunity either to form a partnership with or buy out the local manufacturer.

29 Disadvantages include lack of control over the manufacturing process and loss of
potential profits on manufacturing (Kotler et al., 2005; Deresky, 2005).
Turnkey Operations: a firm designs and constructs a facility abroad, trains local
personnel, and turns the key over to local management for a fee (Deresky, 2005). The
firm’s success depends on the availability of local supplies and labor, reliable
infrastructure, and an acceptable means of repatriating profits.
Management Contracts: a firm supplies management know-how to a foreign firm that
supplies the capital (Kotler et al., 2005). In another word, a firm exports management
services rather than products. But the foreign firm has no rights to make decisions
regarding ownership, financing, or strategic and policy changes. This is a relatively low
risk entry strategy, but it is likely to be short term, and it prevents the firm from setting
up its own operations for a period of time.
International Joint Ventures: is a much higher level of investment and risk. It
involves an agreement by two or more firms to produce product or service together
(Deresky, 2005). This strategy facilitates a firm’s rapid entry into new markets by
means of an already established partner who has local contracts and familiarity with
local operations. International joint ventures are a common strategy for corporate
growth around the world. A firm also can overcome trade barriers and achieve
significant economies of scale for development of a strong competitive position, secure
access to additional raw materials, acquire managerial and technological skills, and
spread the risk associated with operating in a foreign environment. The drawback of this
strategy is the disagreement over investment, marketing or other policies between
partners.
Wholly-Owned Subsidiaries: a multinational company wishes total control of its
operations may acquire an existing firm in the host country or start its own product or
service business from scratch in countries, where a wholly-owned subsidiary is
permitted (Deresky, 2005). Acquisition allows a firm’s rapid entry into market with
established products and distribution networks. However, it involves the greater level of
risk and larger capital investments compared with other entry strategies. The highest
level of risk is the strategy of establishing a new wholly-owned foreign manufacturing,
or service company or subsidiary in the host country. The advantages of this entry
30 strategy are a firm has full control over decision making and efficiency, as well as the
ability to integrate operations with overall companywide strategy.
2.2.3 Diversification vs. Internationalization
Diversification and internationalization are the two major types of growth vectors.
Additionally, they are the alternatives for a firm changing the strategic portfolio. A
firm’s strategic portfolio change occurs whenever a firm changes the market it serves,
and/or the technology it uses, and /or geographic locations in which it does business
(Ansoff, 1987, p. 117). A portfolio change can be referred as “Incremental” and
“Discontinuous”. Incremental is a change whenever it is a logical and relatively small
departure from the past portfolio such as a firm expands its market to a region within a
new country, or improves its historical technology. Discontinuous change occurs
whenever a change does not directly follow historical logic of the firm’s development. It
is a significant departure from the historical growth vector.
Ansoff (1987, p. 122-123) states that, “Diversification involves departure from familiar
business areas, while remaining in the geographical environments in which the firm has
previously been successful.” Such departures are
Needs-related: represents acquisition of a technology new to a firm to enable it
to continue serving its historical markets.
Technology-related: to apply the historical technology of the firm to new needs
through acquisition and internal development.
Unrelated conglomerate: a firm moves into businesses which are not related to
the firm’s present business, either through technology or market needs.
There are several reasons for diversification. A firm may diversify if their objectives can
no longer be met within the scope of the present portfolio, if the retained cash exceeds
the total expansion of the present portfolio’s needs, and if the diversification
opportunities promise greater profitability than expansion opportunities (Ansoff, 1987,
p. 126).

31 Internationalization is the highest synergy move in which a firm offers its traditional
products or services abroad (Ansoff, 1987, p.125). With a firm’s competitive advantage,
it may broad geographic scope by delivering superior products (Geringer et al., 1989;
Akpinar, 2009). Additionally, a firm can exploit economies of scale and network
externalities. Selling one’s product in a foreign country can be a very discontinuous
strategic move because of the economic-political-cultural differences (Ansoff, 1987).
The customers are not the same. Their tastes, preferences, buying habits and spending
budgets are likely to be very different from the domestic customers. Therefore, a firm
must keep in mind that internationalization is at least a two-step discontinuity from its
present business.
Diversification and internationalization are alternative routes for expanding a firm’s
portfolio in terms of growth. Internationalization involves much more drastic departures
from the firm’s experience and competence than similar international diversification
alternatives (Ansoff, 1987, p. 126). As a result, internationalization is much more
difficult, risky and costly than diversification. Ansoff (1987, p. 126) suggests that the
firm should give preference to diversification over internationalization except the firm’s
objectives cannot be met through diversification.
2.3 Tools used for analysis
The prior discussed models are all part of strategic processes and find application in all
different kind of industries. However, for the cross-case-analysis in Chapter 3.4 the
paper is concentrating on Porter’s Generic Strategies as well as the growth strategies,
internationalization and diversification. Applying these three main models to the case
companies, a common base for comparison will be achieved and prepare the ground for
the analysis of the findings.
Whenever necessary other models will be briefly referred to, to create a comprehensive
point of view.

32 3 MULTIPLE CASE STUDY
3.1 Jewelry Retail Industry
The jewelry retail market includes gold, silver and other precious jewelry such as
diamonds, platinum, precious stones (rubies, sapphires, and emeralds), pearls, semi-
precious stones (opal, topaz, amethyst, quartz etc.), and watches. Costume jewelry is
excluded.
As mentioned earlier in chapter 1.1, the global jewelry retail market reached 3.7 % of
compound annual growth rate (CAGR) with total revenue of $181,454.8 million in
2009. The USA accounts for 34.8 % of market value, the European and Asia-Pacific
account for 20.3 % and 44.9 % respectively. Growth is expected to accelerate over the
next 5 years to moderate growth (Datamonitor, 2010). The US market is expected to
reach to value of $61,306.6 million (CAGR 1.6 %), the European market $38,117.4
million (CAGR 0.7 %), and Asia-Pacific market $121,842.1million (CAGR 8.4 %) by
the end of 2014.
The characteristic of jewelry retail market is a trend towards consolidation with large
international players accumulating more and more market share. Market players in this
industry include a variety of retailers ranging from small specialty retailers to large
international retailers. The large retailers benefit from economies of scale and have the
ability to compete on price more intensely. However, small retailers also can be
successful by specializing in particular product ranges.
The jewelry retailers include some large department stores, supermarkets, hypermarkets
and smaller specialty stores. There are a lot of potential buyers/ customers in the jewelry
retail market as well as retailers. Therefore, brand loyalty is important in this market.
The brand identity is a major factor in determining the price of a product. Most buyers
are willing to pay more for brand name jewelry. The retailers also can differentiate their
product by offering products made of varying metals and stones, working with well-
known designers or launching exclusive branded merchandise. Jewelries may be
produced in-house or purchased finished ones from manufacturers. Retailers/ companies
may purchase gemstones and precious metals used in making jewelry from several
33 sources. Purchases are often from suppliers, which retailers have long-standing
relationships and contracts with, especially with diamond suppliers as diamonds tend to
be increasingly scare and more difficult to acquire (Datamonitor, 2010). The world’s
biggest diamond supplier is De Beers. De Beers is still one of the leading suppliers in
the industry, even though the company does not have as big market share as it used to
be (Diamond Trading Company, 2009).
When companies want to enter into jewelry retail industry, they may start by
establishing a brand new company or by diversifying an existing company into jewelry.
New companies are possible to start with a small scale specializing in a particular sector
of the market or purchase finished jewelries from manufacturers. They may need to
invest in marketing in order to develop a brand image as brand loyalty is important in
this industry. However, it is considered hard to enter into this industry as online
diamond retailer, even though the Internet has changed how the business is operated. A
company needs to have trustable suppliers and distributors. (Datamonitor 2010;
Isaksaetre et al., 2009)
It was pointed out in Chapter 1.1 that the jewelry retail industry is highly competitive
and fragmented. There are many companies, including small and large, exist in the
industry, but there is no real market leader. This leads to increasing the overall
competition within industry. The characteristic of retail markets are varied dependent on
country. But generally the trend is towards consolidation despite a huge number of
small retailers. Large and international retailers accumulate more and more market
share, e.g. Wal-Mart. Large retailers usually benefit from economies of scale as they
have the ability to negotiate better deals with suppliers and compete on price. For the
retailers in the industry to stay in business, they need to be innovative, look for a new
ways to attract new customers and keep old ones coming back. Additionally, customer
service, product differentiation and value creating are also important factors. The value
chain of jewelry retail industry will be discussed in next chapter.
3.2 Jewelry Retail Industry Value Chain
Figure 7 below is the value chain diagram for jewelry retail industry. This diagram is
based on research materials on the industry.

34
Organizational structure, control systems, company culture, etc.
Training-processing (cutting/polishing)
Training on human development & business ethics, common service facility
Training of workers Recruitment, sales training
Training for customer services
Info system: inventory, supplier
Accounting system,
Components preparation,
Quality Control,
Waste management
Info development, shipment monitoring, invoices, orders documentation
Market/product research, buyers’ data development
Repair/ assessment of damaged product
Transportation service,
Computer
Transportation Service
Computer
Computer, Transportation service
Courier service, Computer, Transportation/ hotel service
Info system to assess complaint / product inspection
Receiving of raw jewelry,
Storing of raw jewelry,
Inventory of raw jewelry,
Cutting & polishing of raw jewelry,
Returned jewelry from customers
Processing & finishing of semi-processed components,
Jewelry design,
Jewelry production,
Jewelry branding,
Taking jewelry back in for modification or repair
Inspections of finished jewelry,
Order processing,
Export/delivery documentation,
Delivery to domestic & foreign buyers,
Scheduling of shipment to foreign buyers
Advertising,
Promotional activities,
Pricing,
Assisting consumers in purchasing
Acceptance of returned items (damaged during transit or required repair).
Firm infrastructure
Human Resource Management
Technology Development
Procurement
Inbound Logistics Operations Outbound Logistics Marketing & Sales
After-sale Services
MARGIN
MARGIN
Financial services
Insurance services
Customer support
FIGURE 7. Jewelry Retail Industry Value Chain
Source: Adapted from Porter’s Value Chain

35 Inbound and Outbound Logistics
Inbound logistics activities includes receiving raw jewelries/materials from suppliers,
storing these raw jewelries, and cutting and polishing some or all of these raw jewelries
before these materials are developed into finished jewelries within company. Inbound
logistics also includes jewelries sent for exchange or return from the customer.
Outbound logistics includes activities concerning inspection of finished jewelries before
sending to customers, order processing, documentation handling, and scheduling/
delivering of shipment to foreign customer/ the company’s final customer.
Not all companies handle their inbound and outbound logistics, for example, the Blue
Nile Inc. Most of the inbound and outbound logistics operations are outsourced to
independent companies which are specialized in logistics. Depending on the total value
of the shipments, different logistics providers, such as UPS, DHL, and FedEx, will be
used.
Operations
Operations activities are related to the production of the jewelries. The production starts
with design concept as different customers are looking for different products. In order to
differentiate the products from the competitors, the jewelry retailers create their own
designs through customization or markets. For the uniqueness/differentiation purpose,
the company then brands the new design jewelry. For example, Tiffany legacy- patented
cushion-cut diamond ring.
Many companies are investing or expanding their business by not only selling jewelry,
but also taking jewelry back in for modification or repair. By doing so, they can provide
excellent service and create long-term relationships with customers.
Marketing and Sales
Marketing and sales activities are important for all jewelry retailers. Advertising tools
such as websites, catalogs, and TV commercials are often used mediums to attract
customers. Direct mail and e-mail are mostly used for existing customers. Companies
create value to customers by assisting them in all aspects of a purchase. They create
informational guidance; provide call centers and online guide. Customers who do not
know about type of jewelries or products will find it helpful and educating.

36 After-sale Services
Companies offer many services to customers after purchasing such as acceptance of
returned items which damaged during transit or required repair. There is a proper
service provided whether it is a cheap ring or an expensive necklace. For example,
Tiffany’s and Blue Nile provide information on how to maintain the value of the
jewelry from how to clean it to how to store it which can be found online. Most
companies offer financial service to customers when it comes to purchasing an
expensive jewelry. This service allows customer to make the purchase of an expensive
item without having the money in full. There is also insurance service provided for the
jewelry being purchased which extremely expensive. If the insured item is broken or
stolen, the customer can have it replaced. And finally, companies also offer phone lines
support and online support that customers can question about their jewelry.
Firm Infrastructure
The firm infrastructure is the organizational structure, control systems and company
culture (Netmba.com). In order to stay in business, a lot of corporate or strategic
planning and measuring have to be done continually. Otherwise the company will not
last very long unless this part is in place. Therefore, this can be viewed as the “back
bone” of a company.
Human Resource Management
This activity involves with recruiting, hiring, training, developing, and compensating
employee (Netmba.com) as employees are an expensive and vital resources for the
company. Companies are investing substantial amounts of money to provide training or
development training for managers and employees. If the operations, such as cutting
and polishing, are doing in house, training need to be provided. Additionally, sales
training and training for customer services are provided so that the employees can create
long-term customer relationships and provide excellent customer service skills.
Technology Development
This activity includes technologies to support value-creating activities (Netmba.com)
such as managing information processing, research and development of new practices
that could add knowledge to a firm. Innovative new knowledge helps companies to
reduce costs and sustain competitive advantage by improving a firm’s product or
increasing efficiency and effectiveness of the production and operating process within a

37 firm. Technology development can improve the information flow of inventory between
company and supplier, quality control, waste management, shipping monitoring,
invoices and order documentation, market or product research, buyers’ data
development, repair or assessment of damaged products, and improve existing products
and develop new or new techniques for creating new products.
Procurement
Procurement involves the activities in purchasing inputs such as materials/ raw jewelries
needed to produce the final products, component for production, and fixed assets such
as production and office equipment, and building. In the jewelry retail industry, a
company may either assemble the items produced by other manufacturers, or design and
produce the product itself. Some companies operate a combination of these options.
Companies are also dependent on computer, other office equipment, transportation
service, and buildings needed for the daily operations of its business.
3.3 Case Companies
As stated earlier in Chapter 1.3 the sample of four case companies relates to the sub
category of ‘Diamond and Diamond jewelry retailing’ within the global jewelry retail
business.
The company's business models are divers from brick-and-mortar retailing to e-business
and a mixture of both. Similarly the company’s historical background with a case
companies having its beginnings in the 1830’s and another in the 1999’s. The following
chapters will introduce to the four case companies in detail.
3.3.1 Tiffany & Co.
Tiffany & Co. was founded in 1837 as “Tiffany and Young”. The company was
originally opened a store at 259 Broadway in New York City, and was known for
selling “stationery and fancy goods” including costume jewelry. Tiffany’s store was
unique for its time. The company offered fixed prices on items by insisting on cash
payment rather than extending credit or accepting barter. When their business faced a

38 challenge of narrow streets teeming with horses and carriages and hurly-burly of city
life, the founders discovered a newly emerging “American style” that led to Tiffany
design which first started in silver hollowware and flatware, and later in jewelry. This
move can be regarded as unrelated diversification.
In 1841 Tiffany and Young took on another partner, J.L. Ellis, and then became known
as “Tiffany, Young & Ellis”. Ellis was brought to the company because of the funds.
With strong experience in the European jewelry market, Ellis became the company’s
chief oversea operator after the Continent trip. In 1844, the company was importing
quality jewelry from Europe adding to its already well-respected reputation. In the same
year, the company discontinued its costume jewelry line. This move was driven by the
customer demand for the imported gems, and the company’s reputation for offering
expensive quality pieces.
1840s were the years of growth pursuing the strategy of diversification into new
business. The company added silverware, timepieces, perfumes, and other luxury
offerings to its product range. The company began selling its real jewelry in 1845 and
also published its first mail-order catalog (the Tiffany Blue Book) in the USA. This
move was intended to reach any American who received the catalog could order from
Tiffany.
Young was able to go to Paris as a buyer with Ellis’ capital. When the French monarchy
was overthrown in 1848, he purchased some of the crown jewels. He teamed up with
P.T. Barnum to their mutual profit. Internationalization started when Tiffany opened a
store in Paris in 1850. Tiffany also diversified a new line of business within the core
SBA. The company began manufacturing gold jewelry assisted by the California gold
strike, and hired John C. Moore, a silversmith, to craft silverware exclusive to Tiffany’s.
When partners, Young and Ellis retired in 1853, Charles Lewis Tiffany took control of
the business and changes the name of the company to Tiffany & Co. (Tiffany).
During Civil War (early 1860s), Tiffany manufactured patriotic items including flags,
medals, surgical implements, and swords, and allowed its store to serve as a depot for
military supplies. This move was to support the Union forces during the war, and to

39 satisfy customer demand. This move can be regarded as unrelated diversification. After
the war ended in 1868, the company was incorporated, and opened a store in London.
In 1878, Tiffany purchased 287.42 carats of yellow diamond from South Africa. It was
cut to 128.54 carats and named it as the Tiffany diamond, which became an exemplar of
Tiffany craftsmanship. This Tiffany diamond still held by the New York store and has
been valued by the company at 22 million USD. The reason of purchasing this diamond
was to continue to enhance the company’s reputation of quality and excellence.
In 1886, Tiffany introduced the engagement ring, namely the Tiffany® Setting. This is
one of the Tiffany’s innovative designs. The diamond is lift above the band with six
platinum prongs, allows the ring maximizing its brilliance. The Tiffany Setting is truly
unique and elegant with high price. This is pursuing differentiation strategy of Porter’s
Generic Business Strategies due to its uniqueness and premium price. The Tiffany
Setting has played a part in the world’s greatest love stories and continues to be as one
of the most popular engagement styles till nowadays.
After the stock market crash in 1929, the rich cut back on luxury goods. Tiffany’s sales
fell 45 percent in 1930, dropped another 37 percent in 1931, and yet another 45 percent
in 1932 when the excise tax for jewelry increase 10 percent. After that the company lost
1 million USD a year throughout the decade. In order to stay in business, the London
store was closed in 1940.
In 1956, Walter Hoving became chairman and chief executive officer of Tiffany. He
discontinued merchandises which considered to be gaudy or vulgar and not worthy of
Tiffany’s attention. They were rings for men, leather goods, antiques, silver plate, brass,
and pewter. The company hired Jean Schlumberger to design its finest and most
expensive jewelry in order to create a new standard of quality for Tiffany’s products.
Jean Schlumberger was hired because Tiffany could not ignore the changes taking place
in the field of metal arts as it was the era of the artist-jeweler (designer-craftsman).
Tiffany diversified its product by adding high-quality but lower-priced goods such as
silver key rings for 3.5 $. This move was to increase sales and customer base. Tiffany’s
net profit rose every year, from $173,612 in 1955 to $1.7 million in 1966.

40 Tiffany’s business growth continued in the 1970s pursuing internationalization strategy
and the strategy of diversification. In 1972, Tiffany established its operation in Japan
with the opening of a Tiffany boutique in the Mitsukoshi department store. This move
was driven by a valuable Japanese market. In 1974, Elsa Peretti design in silver and
gold was introduced. Her design brought a totally different look to Tiffany jewelry, and
was affordable for a much larger segment of the population.
Tiffany was sold to cosmetics seller Avon products Inc., in 1979. Avon opened Tiffany
stores in Dallas and Kansas City, expanded its direct mail orders, introduced Tiffany
credit cards, and streamline and computerize its back-office operations. But the
company’s ratio of operating profits to revenue fell from 17.6 percent to 6.5 percent
between 1979 and 1983. This resulted from the company mainly tried to compete with
department stores in selling low-margin watches, china, and glassware. The customers
had also complained about declining quality and service due to the Fifth Avenue store
had stocked so many inexpensive items. Avon later sold Tiffany to an investor group
led by Tiffany’s and backed by Bahrain-based Investcorp in 1984.
Under Tiffany & Co. new management, the company cut costs by closing the Newark
plant and its Kansas City store, cutting staff, and embarking on program to wholesales
its jewelry and silverware and the line of leather products. Tiffany was listed on the
New York Stock Exchange in 1987 raising about $103million by selling 4.5 million
shares of common stock. Tiffany diversified into new business in the same year by
introducing a fragrance that sold at $220 an ounce, wool and silk scarves, and neckties.
The company’s product line of handbags, evening purses, wallets, and briefcases also
expanded. Internationalization also continued. A London store was reopened in 1986
which then laid a solid foundation for the expanding of European market. After that
Tiffany opened stores in Munich and Zurich in 1987 and 1988 respectively. Tiffany’s
reputation of emphasis on luxury has restored when the company displayed in five of its
stores a collection of 22 individual pieces of jewelry made in its own workshop and
valued more than $10 million.
Tiffany acquired Howard H. Sweet & Son, Inc., a manufacturer of gold and silver
jewelry and chains in 1989, and McTeigue & Co., a manufacturer of gold jewelry in
1990. Diamond cutting and polishing were being purchased from a number of sources.

41 In 1991, Tiffany established a watch assembly, engineering, and testing operation in
Lussy-sur-Morges, Switzerland.
In 1992, after the 1990-91 recession in the US, Tiffany had launched ambitious
marketing campaigns by sending out “How to Buy a Diamond” and “Pearl Authority”
brochures. This move was to convince buyers of Tiffany’s quality and make it seem
attainable. Tiffany continued to maintain its high-style image through books on Tiffany
objects and in-store table displays. Additionally, Tiffany avoided calling itself a luxury-
goods firm but “a design-led business offering quality products at competitive prices”.
During the same year in 1992, Tiffany suffered a setback when sales to Mitsukoshi fell
35 percent. Sales decline was affected by the Japanese consumers had cut back on
spending due to recession. In 1993, Tiffany took direct responsibility for sales,
merchandising, and marketing at Mitsukoshi’s 29 Tiffany boutiques by buying out of its
Japanese partner and run them on its own. This continuing internationalization was
driven by growing in demands in Japan even the country’s economy slowed. Tiffany’s
net sales rose during fiscal year 1994, which international retail accounted for 41
percent. This figure was up from 32 percent two years earlier.
Tiffany’s catalog was seen as powerful sales and image tools for its stores as well as a
source of profit. In 1994, it reached 15 million. Tiffany’s direct marketing effort also
included business-to-business sales, which included a business gift catalog each year.
Business customers purchased for gift giving, employee service and achievement
recognition awards, customer incentives, and other purposes.
Internationalization continued in mid-1995. Tiffany opened many boutiques
(franchising stores) in Japanese stores, and one in Taiwan. Other parties operated four
Tiffany boutiques in South Korea, and one each in Philippines, Abu Dhabi, Taiwan,
Hong Kong, Hawaii, and Guam. More than half of Tiffany’s operating earnings coming
from Japan. Tiffany’s London store was the only profitable in its European retail outlets.
In Europe, Tiffany faced high competition from established local rivals such as Bulgari
and Cartier.
Tiffany grew during the late 1990s mainly pursuing diversification strategy.
Diversification would protect it against recessions and increase profits. Tiffany offered
fine diamond jewelry to boost profits. The company increased its store count, hoped to

42 cash in on middle-income shoppers, offered and promoted lower-priced merchandise
such as boxes of sterling-silver key rings, pendants and charm bracelets, many priced
under $100. In 1999, Tiffany introduced “Tiffany’s Lucida diamond ring”. Lucida cuts
are fancy shaped diamonds, and this cut is patented exclusively by Tiffany & Co.
Lucida diamond ring was originally meant for wedding rings. After numerous requests
of customers, Tiffany then introduced Lucida engagement rings. In the same year,
Tiffany expanded its service provision with the launch of e-commerce website
Tiffany.com.
Tiffany established the wholly owned subsidiary, namely Laurelton Diamonds (a rough
diamond trading and manufacturing firm) in 2002. This move was mainly to create a
way to secure additional supplies of diamonds and cost efficiency, pursuing backward
integration diversification. The company could control its global supply chain, and
ensure the integrity and high quality of its diamonds from mine to finger.
In 2003, Tiffany diversified into new business by introducing “Tiffany Legacy
collection” featuring diamond engagement rings and wedding rings. This move was
driven by the changing consumer attitudes towards luxury consumption and luxury
brands. These customer attitudes are aligned with the basic attributes of the Tiffany &
Co. brand- timeless style, lasting value, enduring trust and emotional resonance. During
the same year, the company established a new retail subsidiary, namely Iridesse
focusing on pearls.
Internationalization and diversification continued in 2004. Tiffany opened ten stores and
boutiques – four in the USA, three in Japan, one in Taipei, one in Shanghai, and one in
London. The company also launched several jewelry lines including Atlas, Voile, and
Rose. This move was in response to the company suffered from brand erosion and
weakness in silver jewelry. In the same year, Tiffany invested in a joint venture with
“Rand Precision Cut Diamonds” for a cutting and polishing in Johannesburg, South
Africa. This move was triggered by the company began eyeing Africa as a place to base
manufacturing, as the issues surrounding diamond beneficiation become more important.
Tiffany launched its e-commerce website in Canada and Japan in 2005 in order to sell
online to customers, and an information-only website (www.tiffany.cn) in China in
2006. This is also a diversification move to provide comprehensive and convenient

43 access to information relating to the company, and to satisfy the existing and potential
customers by providing them important information related to Tiffany’s products. This
reflects the company’s highest level of quality and customer service.
In the same year 2006, Tiffany entered into the eyewear market by signing a ten year
eyewear license agreement with Luxottica Group (the global leader in eyewear) for the
design, manufacturing and worldwide distribution of ophthalmic and sun collection
under the TIFFANY & CO. brand name. This move was driven by the management
with believes in Tiffany’s luxury brand that will generate exciting designs, high style
and luxury accessory for customers.
Between January and July 2007, Tiffany expanded its business by opening new stores at
various locations such as Las Vegas, Singapore, Korea, Japan, Mexico City, New Jersey,
Belgium, Macau, Hong Kong and Kuala Lumpur. In December 2007, Tiffany and The
Swatch Group entered into a strategic alliance to further the development, production
and worldwide distribution of Tiffany & Co. brand watches.
In March 2008, Tiffany opened a store in Chengdu, China. A store is located in
Manison Mode, a luxury retail center, the city’s most fashionable shopping area. This
move was to introduce the residents and visitors to make shopping at Tiffany with a
unique experience. Chengdu is a growing center of business, culture and tourism. The
city’s high level of sophistication and the prominent location in the elegant Maison
Mode provides the ideal environment for Tiffany & Co. store.
In 2009, Tiffany diversified into new business by launching a new jewelry line called
“Tiffany Key Collection”. Tiffany Key Collection is inspired by real keys from the
Tiffany & Co. Archives, and influenced by important Tiffany key-shaped jewelry and
artifacts, including brooches, charms and gift to royalty and heads-of-state. During in
the same year, Tiffany opened 14 new stores, including five in the Americas, six in
Asia-Pacific and three in Europe. At the end of the year, Tiffany & Co. operated 220
stores spanning 22 countries.
In response to customer demand, Tiffany diversified into a new business by introducing
an iPhone and iPod Touch application that lets shoppers browse engagement rings and
size in June 2010. The application is known as the “Engagement Ring Finder”.

44 Consumers can use the app’s “ring sizer” to check their ring size. The app’s also allows
the consumers to view diamonds of different carat sizes.
E-commerce has proven to be very successful and an efficient complement to Tiffany’s
stores in the U.S, the UK, Canada, Japan and Australia. Tiffany responded to this result
by planning to expand its e-commerce reach to continental Europe during in the year
2010. Tiffany will also diversify its online product inventory with a new line of bags
and related accessories.
The company has further opportunities to win new customers as the world of luxury has
changed in important ways. Today consumers are less interested in things that are
transient or disposable, of poor quality or simply represent the latest fad. They are more
recognizing the concept of luxury and lasting value, and increasingly focused on those
brands that represent authentic luxury, that possess a recognizable legacy of
craftsmanship and quality, brands that are sustainable. This is a growing sensibility
among consumers to selectively focus on a few good things that will stand the test of
time.
3.3.2 Zale Corporation
In March, 1924, Morris and William Zale founded Zale Corporation (Zale), known as
“Zale Jewelers”, with the establishment of the first store in Wichita Falls, Texas. In
addition to jewelry, inventory included small appliances, cameras and cookware. Zale
had a vision to provide customers with quality merchandise at the lowest possible price.
This can be regarded as cost leadership strategy of Porter’s generic strategies; having
the lowest prices in the target market segment.
In 1925, Zale diversified into new business by offering credit “a penny down and a
dollar week” with payments typically spread out over 12 months even to its low-income
customers. This move was to make its jewelry and other merchandise affordable to the
average working American. With the success of the credit policy, coupled with friendly
service, and dedicated employees led to great success and expansion. By 1942, Zale
operated 12 stores in Oklahoma and Texas.

45 During the World War II, Zale’s expansion of new locations and production of
consumer goods were limited. The company responded to the situation by maintaining
its current price on jewelry, limiting expenses and looking for growth opportunities.
With the acquisition of the Corrigan’s of Houston in 1944, Zale entered into fine
jewelry market segment. The acquired business was eventually leading to the launch of
the Bailey Banks and Biddle brand targeted higher-income customers. This move can be
regarded as diversification through synergy.
As the company grew to 19 stores in 1946, Zale opened a central design, display and
printing operation in Dallas. This move was aimed to serve its business needs i.e. to
support its operations. Between 1947 and 1957 were the years of growth, Zale opened
more than 50 stores due to boom in consumer spending during postwar period. The
company opened the first store in a shopping center, which was a major shift from
operating only in downtown locations. Zale went public in the same year in 1957.
For Zale, the 1960s were the years of growth pursuing the diversification strategy into
new business. The company produced shoes, sporting goods, drugs, furniture, and
catalog pursuing diversification into new SBAs. This move was responded to the
development of the first synthetic diamond technology, at that time viewed as a
potential replacement for real diamonds in the retail jewelry trade. The company was
changed from “Zale Jewelers” to “Zale Corporation” to reflect the diversity of the
business. However, half of the company’s revenue continued to come from its jewelry
operations, with one highlight from the 1969 purchases of the Light of Peace diamond.
At the beginning of the 1980s, Zale started selling-off its non-jewelry retail businesses.
Despite raising revenues, these businesses produced little of the company’s profits. By
that time, the synthetic diamond scare had passed, and the consumers had demanded on
purchasing real diamonds. In 1986, Zale was sold to Peoples Jewelers of Canada and
Swarovski International of Austria. In 1989, the company acquired Gordon Jewelers
Corporation, a 469-store chain. At the end of 1980, the company had come back to its
core jewelry business.
Zale and Gordon’s chain had grown to 2,000 stores in the beginning of 1990s. However,
in 1992, Zale Corporation filed for Chapter 11 bankruptcy due to its loss during the
international recessions of the 1990s and debt. But Zale emerged from bankruptcy in

46 1993 as a financially stronger company after restructuring its debt. The new
management team restructured the company by creating separate and independent
divisions of the Zale and Gordon’s stores. Gordon’s was positioned as more of a
regional player with its product line tailored for the local market. It targeted customers
slightly more affluent than Zale’s middle-class customers. This can be regarded as focus
(differentiation) strategy of Porter’s generic strategies. Zale also focused on promotions
to the various gift-giving and high-traffic holiday periods that occur throughout the year,
rather than depending on heavily on the November-December shopping season as it had
been company tradition. The company entered the direct selling business in 1996. It
produced first sales catalog, and then followed up with the launch of zale.com as its
Internet shopping site. By 1998, Zale revenues increased to $ 1.43 billion, a 43 percent
increase over 1994.
In 1998, Zale launched Zales Outlet, which was established as an extension of the Zale
brand and capitalizes on Zales’ national advertising and brand recognition. This can be
regarded as diversification within the core SBA. Ten Zales Outlet stores were soon
opened throughout the country to pursue sales growth through the growing outlet mall
channel. Zales Outlet is well known for its unique selection at a competitive price, and it
targets the higher-income and female customer pursuing focus (differentiation) strategy.
Zale acquired People Jewellers of Canada (People went into bankruptcy and lost control
of Zale in 1993) in 1999 and Piercing Pagoda, a gold kiosk operator, in 2000. Piercing
Pagoda outlets are mostly mall kiosk operating base. It primarily targets younger
customers or teens and offers low-priced gold jewelry and a selection of silver and
diamond jewelry pursuing focus (low cost) strategy of Porter’s generic strategies. At the
same year 2000, Zale partnered with WeddingChannel.com, online planning resource
and bridal registry. This move enabled Zale to reach over 700,000 annual bridal
customers, strengthen the brand name, and increase sales channels within the significant
bridal market in the USA and Canada.
Zale diversified into a new business by launching private label credit cards for its
customers in July 2000. This move was to help customers buying jewelry easier and to
help facilitate the sale of merchandise to customers who wish to finance their purchases
rather than use cash or other payment sources. The private label credit card is accepted
at all Zales, Zales Outlet and Gordon’s stores nationwide as well as Zales.com.
47 In 2005, Zale entered into a multi-platform marketing partnership with The Knot, a
leading life stage media and services company. The partnership was aimed to promote
Zale’s brand to over a million of brides and grooms, who turn to “The Knot” for their
wedding planning trends and needs. Zale Corporation becomes one of the national
retailers to reach the largest audiences of brides and grooms on the Web through
sponsored content programs on The Knot TV.
Zale expanded its e-commerce business with the launch of www.gordonsjewelers.com
in 2007. This move was to better focus on its core business and increase returns on
capital. At the same year, Zale divested its Bailey Banks & Biddle brand due to the fact
that Bailey didn’t fit the rest of the company’s portfolio. The company could allocate
those resources toward brands that had higher returns on capital.
In February 2008, Zale launched a program to permanently reduce inventory levels.
This was not caused by declining in market demands, but to improve merchandise
presentation and inventory efficiency. The company’s goal was to achieve a $ 100
million reduction in inventory.
In February 2009, Zale announced the second phase of its cost reduction plan for
additional inventory and cost reductions. In the same year, the company diversified a
new line of business within its core SBA by launching “The Prestige Diamond
Collection”, exclusively at Zales.com. It offers an enormous online selection for grooms
to handpick and create a custom engagement ring and wedding band, and provides more
than 30,000 diamonds and 2000 unique settings and carat sizes ranging from 0.33 to
five carat (istockanalyst.com). The company targets grooms and bride-to-be customers
and differentiates its brand by offering custom engagement rings to ensure perfection,
pursuing focus (differentiation) strategy.
3.3.3 Blue Nile Inc.
Blue Nile is a Seattle based online retailer of certified high quality diamonds and fine
jewelry. The company is a publicly traded company listed on the NASDAQ.

48 Blue Nile has its beginnings as RockShop.com in 1999 and underwent a series of
renaming and acquisitions during this year evolving into Blue Nile Inc. . RockShop.com
acquired assets of a Seattle jeweler, Williams & Son. Inc., including a small website and
was renamed Internet Diamonds Inc.. Later on that year Internet Diamond was acquired
by Mark Vadon and renamed into Blue Nile Inc. . The story goes that the business idea
for Blue Nile Inc. is based on Mark Vadon’s own frustrating search for an engagement
ring, including his discouraging traditional shopping experience and his positive
purchase and customer service experience with Internet Diamond Inc. at that time.
Relating to his experience Blue Nile’s vision and mission is to ‘… build the premier
specialty retailer of jewelry by offering consumers high quality products at compelling
values through an empowering shopping experience.’ (Blue Nile Company Fact Sheet
2009, p.1)
Blue Nile started to build its brand, customer base and market presence transforming the
existing Internet Diamond website into the Blue Nile portal www.bluenile.com and the
company went public in 2004. Also in 2004 the company internationalized launching
the website www.bluenile.co.uk to serve the United Kingdom and the greater European
markets. In 2005 the website www.bluenile.ca was launched to further internationalize
and serve the Canadian market. In 2007 two wholly-owned subsidiaries were
established; Blue Nile Worldwide and Blue Nile Jewellery Ltd. Until today Blue Nile
Worldwide is serving the customers through the UK website and Blue Nile Jewellery is
a customer service and order fulfillment center based in Dublin, Ireland. The two
existing websites were diversified and updated with a broader product and service range
and the option to purchase in local currency. During 2008 the company increased the
shipping from 12 to 35 countries in Europe and Asia-Pacific. In 2009 the main
website www.bluenile.com serves the US and 14 additional
countries. www.bluenile.co.uk serves the EU territory and www.bluenile.ca serves the
Canadian territory. Altogether they serve and ship to 40 countries. The websites
underwent a redesign in the beginning of 2009 and the company is now supporting
financial transactions in 24 currencies in addition to the US dollar. For 2010 the
company stated to focus on gaining market share.
Back in 1999, shortly before the dot.com bubble, the Blue Nile management has chosen
to sell superior loose diamonds and diamond jewelry directly to its customers applying
the e-commerce business model. The e-commerce business model allows the company

49 to create an efficient cost structure through the elimination of traditional intermediates
and fixed costs, maintain low inventories and develop lean supply solutions through
exclusive supply relationships. Blue Nile’s inventory for example is mainly a virtual
inventory meaning that the products showcased on the webpage are in the suppliers’
inventory and carried at no cost until the product is purchased. This kind of virtual
inventory is maintained and secured through multi-year agreements with diamond
suppliers including the exclusive offer of certain diamonds through the Blue Nile
websites. This allows the company to position its brand Blue Nile and its products in the
premium segment but price the products lower than the completion. Besides
maintaining a capital-efficient business model and developing exclusive supply
relationships, Blue Nile’s differentiation strategy is the focus on the customer. From the
very beginning customer satisfaction through high level customer service, service
transparency, customer involvement and continuous interaction was a core strategy and
activity for the company. The company’s competitive advantage is built on product
quality, product variety, product customization, product personalization, customer
empowerment through education and assistance, customer service in combination with
lower product prices and purchase convenience. Blue Nile’s customer service personal
does not work on a provision bases and provides the customer a pressure free individual
service. The customers can contact them and visit the website as often as they want to
decide and complete their purchase.
The Blue Nile founders and management saw the potential in the innovative business
model, and looking back this decision gave Blue Nile an innovated edge and an early
entry advantage over traditional brick-and-mortar companies. To maintain and broaden
the competitive advantage Blue Nile’s CEO Diane Irvin emphasizes once more that
‘Our [Blue Nile’s] focus is empowering the customer with information’ (Krippendorf)
and not to sell diamonds over the internet.
Blue Nile was set up 1999 as an online retailer shortly before the so called dot.com
bubble busted in 2000 and the e-commerce market collapsed. Back then Blue Nile was
still a privately owned company and reacted to the unfavorable market development
with downsizing and reducing expenditures. (Cook, 2002)
Going public in 2004 the company set itself three goals as its fundamental cornerstones
for its business. The first goal is to provide an unmatched shopping experience for the

50 customers. The second goal is to enhance, grow and foster an environment of excellence
amongst the employees and suppliers. The third goal is to create long-term value for the
stakeholders.
Furthermore the company formulated a range of beliefs as guidelines for the
management of Blue Nile’s operations. The beliefs are the obsession about the
customer, the focus to be the best diamond retailer in the world, to value supplier
relationships, to balance growth with profitability and cash flow generation, to respect,
appreciate and invest in the company’s employees, to maintain a lean cost-conscious
culture and to communicate open and honest.
The set of strategies to sustain growth, profitability are outlined in there order of
importance in the annual reports and adapted to undergone business development and
economic environment. The yearly reports of 2004/ 2005 stated for the upcoming
business years 2005/ 2006 the strategies ‘Increasing brand awareness’, ‘Focusing on
customer experience’, ‘Increasing supply chain efficiency’, ’Improving operational
efficiencies’, ‘Expansion of product offerings’ and ‘Expansion into international
markets’. During these business years Blue Nile was established as superior brand and
the websites in the UK and Canada have been launched. For the business year 2007 the
enhanced strategy out of the set became ‘Expansion into international markets’ and the
wholly-owned subsidiaries were established as well as the existing websites updated
and broadened. For the business year 2008 the company underlined the strategy
‘Focusing on customer experience’. Facing the global economic down slope in 2008
Blue Nile managed to grow of its international business and increase the countries
shipped to from 12 to 35. As a consequence of the global economic situation Blue Nile
adjusted its strategies for the business year 2009. In its focus were and are still
‘Innovate and enhance Blue Nile customer experience’, ‘Expand international markets’,
‘Optimize profitability and cash flow’ and ‘Enhance product assortment’. In line with
the strategies the websites received a comprehensive facelift aiming at sophisticated
branding, superior product presentation, comprehensive customer empowerment and
exceptional value proposition. Additionally payment is accepted in 24 currencies in
addition to the US Dollar. For the business year 2010 the company is focusing on
growing the market share through ‘Innovate the customer experience’, ‘Growth
Profitability’ and ‘Pursue international business growth’. During September 2010 Blue
Nile introduced a shopping application available on the App Store to compare and shop

51 for Blue Nile product using Apple products. (Globe Newswire, 2010). In January 2011
the annual report 2010 will be published and reflect on the achievements.
All the above mentioned strategic components serve to achieve the company’s main
objective to ‘… maximize our revenue and profitability and increase market share both
domestically and internationally by offering exceptional value to our customers through
a high quality customer experience that leverages supply chain efficiencies and efficient
cost structure.‘ (Blue Nile Annual Report 2009, p.4)
According to the Company Fact Sheet Blue Nile made its first quarterly operating profit
in the 4th quarter of 2001. In May 2004 the company went public and filed an increase
in net sales of 31,3% compared to 2003. The growth continued in 2005 with an increase
of 20 %, in 2006 with an increase of 23,8% and 2007 with an increase of 26,9% in net
sales compared to the year before. In 2008 with the down slowing of the US and the
global economy net sales decreased by 7,5% and a slow increase by 2,3% in 2009. For
the 2nd quarter 2010 the company announced a growth of 9.7% in net sales. Foreign
sales, purchases made through one of the three websites and delivered outside the US,
achieved in 2009 1,9% of the overall achieved 2,3%. 2008 foreign sales comprised
9,4% and 2007 it comprised 5,3% of total sales.
Blue Niles product portfolio consists of high quality diamonds and fine jewelry, with a
particular focus on engagement diamonds. In 2009 69% of the revenue was achieved by
the sales of engagement jewelry. (Blue Nile Company Fact Sheet 2009, p.1)
The product groups and services are Build Your Own Diamond Jewelry, Proprietary
Diamond Search, Blue Nile Signature Diamonds, Fancy Colored Diamonds, Fine
Jewelry and Diamond and Jewelry Consultants.
The company’s core product and service is customized superior diamond jewelry,
including engagement jewelry, and is incorporated in the ‘Build Your Own Diamond
Jewelry’ service. The customer first applies the criteria shape, carat, color, price, cut and
clarity to search the matching diamond out of the over 55 000 diamond inventory. In the
next step the customer chooses based on the criteria shape, price, metal and styles the
setting for the diamond. Both steps are supplement with a broad set of education and
information on each criteria. Furthermore the pages shows customer reviews on

52 diamonds and products, recently purchased diamonds and products as well as delivery
and shipping. Throughout the whole process previews of the diamond, the setting and
the final product are shown from real pictures taken out of different angles to
animations of e.g. ring on a finger. In the last step the customer finalizes the customized
product and is again supported with a broad range of information and interactive tools
regarding e.g. ring size. During all these steps individual customer service is available
via free phone service, email or a live chat.
The ‘Proprietary Diamond Search’ allows the customer to search the over 55 000
diamonds for the ideal loose diamond applying the same set of criteria as in ‘Build Your
Own Diamond Jewelry’. Information, education and customer service is available to the
same extend as mentioned earlier.
The ‘Blue Nile Signature Diamonds’ product group consist of exclusive hand selected
and cut diamonds. The company states that the diamonds in this group are out of the top
1% of all diamonds in the world and cut to the company’s high level standards.
Information, education and customer service is available to the same extend as
mentioned earlier.
The ‘Fancy Colored Diamonds’ product group consist of rare colored diamonds. Out of
10,000 diamonds one diamond has a this unique esthetic property and is referred to as a
fancy color diamond. These diamonds are extremely rare and high value. Information,
education and customer service is available to the same extend as mentioned earlier.
The ‘Diamond and Jewelry Consultants’ service provides a broad range of background
information and education material on diamonds, pearls, gemstones, materials and
products. Furthermore it educates the customer throughout the whole purchasing
process with relevant information.
The ‘Fine Jewelry’ product group consists of jewelry of a chosen range of products, like
rings, earrings, necklaces, bracelets, watches and accessories within a certain price
range. As in the other product groups the customer can customize the search according
to the type of material, gemstone and pearl used for the piece but the piece itself is a
readymade piece of jewelry.

53 In addition to the products and services mentioned above Blue Nile offers financing and
insurance services, secure shipping services for save payment and delivery processes,
product insurance documentation and maintains an affiliation program.
3.3.4 Signet Jewelers Limited
Signet Jewelers Ltd. is retail jewelry specialists with its corporate headquarter in
Hamilton, Bermuda and its operational headquarters based in London, UK. The
company is a publicly traded company and listed on the London Stock Exchange as
well as the New York Stock Exchange.
The Signet group Plc. started as a family business in 1949, when Leslie Ratner opened a
jewelry store in Surrey, England. Over the next decades the company not grew
organically with new branches, but also launched a manufacturing branch named
Jadales to manufacture its own brand of watches. By the end of the 1970’s the company
operated more than 150 stores within the UK and decided to enter foreign markets. As a
result of this decision the company internationalized and entered the Dutch market in
1975. Furthermore the company pursued its goal to grow into a national chain and
acquired the Terry’s Jewelers Ltd. in 1984. In 1985 Gerald Ratner took over the
business from his father. Gerald Ratner’s goal was to grow the Ratners group into the
world’s largest jewelry specialist. The following period was characterized by an
aggressive growth through acquisitions and the inline diversification of the product mix.
The two flagship chains Ratner’s and H.Samuel were created and the acquisition of
Ernest Jones Jewelers Plc. in 1987 opened up the middle and high-end segment in the
UK. 1988 the company Time Jersey Ltd. was acquired as well as the Zales Jewelry Ltd.,
Salisbury and another 73 stores from the Next and Watches of Switzerland to strengthen
the geographical and product portfolio mix. By the end of 1988 Ratner’s UK portfolio
had grown to 650 stores. Simultaneously to the growth in the domestic market Ratner’s
acquired in 1987 the Ohio-based Sterling Inc., which back then was the 4th largest
specialty jeweler in the US with a portfolio of local brands and provided the basis for
the company’s internationalization. Soon after the acquisition of Sterling Inc., the Ohio-
based Osterman’s Inc. was acquired in 1988 and merged with Sterling Inc. to strengthen
the geographical mix. In 1989 acquired Weisfield Inc. and a year later Kay Jewelers,
one of the largest retailer chains in the US back then. By the end of 1990 Ratner’s US

54 portfolio had grown to 1000 stores. In 1992 Gerald Ratner had to resign from all his
roles with the company after causing serious damage to the company by disparaging the
products quality and design in public. To diminish the occurred damage and sustain the
business operations the company’s name was changed into Signet group and
comprehensive restructuring actions were taken during 1993. The brand and product
portfolio was scaled down, streamlined and grouped into a manageable amount of
product groups for the UK and US market. There were no further internationalization
actions in terms of entering new geographical markets and the level of diversification in
the product mix was shrunk significantly. For the UK market H.Samuel and Ernest
Jones were formed and for the US market Jared, the Galleria of Jewelry, Kay Jewelers
and Regional brands. Also the retail portfolio was cut down significantly, especially in
the UK. It took almost 6 years to re-establish the Signet Group and 1999 the company
returned to profitability. In 2000 Marks & Morgan Jewelers Inc., the 9th largest
specialty retailer back then was acquired to strengthen the geographical mix and was
partly merged with the Kay retail brand. In 2008 the company’s name Signet Group Plc.
was changed into Signet Jewelers Ltd and the corporate headquarter was moved to
Hamilton, Bermuda with the operational headquarter remaining in London, UK. The
decade until 2010 has been used to strengthen product group brands, strengthen the
geographical presence and become the leader in each product brand segment.
The Signet Groups mission is to build long term value through customer focus. (Signet
Jewelers, Annual Report 2009/2010). The mission is supported through a set of
operating principles like excellence in customer service, high quality merchandise
selection, excellence in execution, test before invest and continuous improvement.
For the years 2002 until 2009 the group’s strategy was lined out to maintain a strong
balance sheet, to continue the achievement of sector leading performance standards on
both sides of the Atlantic, to maximize store productivity in the US and the UK and to
grow new store space in the US. For 2010 the strategy was lined out to enhance position
as strongest middle market specialty retail jeweler, to reduce business risk and to focus
on profit & cash flow maximization to maintain a strong balance sheet. Furthermore the
annual report 2010 states that as reaction to the development in the global economic
environment to pursue a lower risk strategy and ...’to aim to maximize sales by gaining
profitable market share in existing stores by focusing on enhancing competitive

55 strengths rather than opening additional locations.’ (Signet Jewelers, Annual Report
2009/2010)
The group strategy is further adapted to the two divisions in the UK and US, with an
individual set of competitive strengths.
The strategy for the UK division is to ’to increase average transaction value by focusing
on merchandise where the division’s competitive advantages are greatest, particularly
diamond jewelry, differentiated ranges and watches, thereby improving store
productivity and achieving operational leverage.’ (Signet Jewelers, Annual Report
2009/2010) As part of the long term strategy for the UK division the company
concentrates on major shopping centers to increase profitability and anticipates a further
small reduction in store space. Furthermore there will be continuous improvement
actions in the key areas customer service, merchandising, marketing as well as real
estate.
The mentioned key areas sum up to the competitive advantage of the UK division. Store
Operations and Human Resources are seen as the ability of the continuously trained
employees to assist with excellent customer service the customer through the jewelry
purchase. The commission based compensation aims at recruiting and retaining high
quality employees. Merchandising describes the offered selection and offered greater
value, focusing on the company’s leading supply chain capability, an exclusive product
range to differentiate and 24h re-supply capability. Marketing describes integrated
traditional retailing and e-commerce concepts as well as extensive customer relationship
marketing. Real estate describes primary locations with traffic flows and high visibility,
with store design enhancing the product quality and making the concept attractive to
landlords.
While the UK division’s strategy focuses on increasing store productivity, the US
division’s strategic focus is on growing space to achieve brand and market leverage. For
the KAY Jewelers a long-term potential for growth of over 400 stores is stated I the
annual report 2009/2010 and the Jared stores have stated long-term potential for over
300 stores. Furthermore there will be continuous improvement actions in the key areas
store operations and human resources, merchandising, marketing, real estate as well as
customer finance. (Signet Jewelers, Annual Report 2009/2010)

56 The sum and interaction of stated key areas achieve Signet competitive advantage for
the US division. Similar to the UK division Store Operations and Human Resources are
also seen as the ability of the continuously trained employees to assist with excellent
customer service the customer through the jewelry purchase. Merchandising is
described as the demand-driven customized product mix for each store, the focus on
leading supply chain capability and 24h re-supply capability. Marketing is based on the
largest marketing budget within the segment, empowering the leverage of the leading
brands in targeted middle market. Real Estate describes the high-quality store base with
well-designed stores, high product and brand visibility and customer traffic flow. It also
describes the result of being an attractive tenant. Customer finance describes the
competitive advantage to proceed purchase operations until the very end out of one
hand.
The Signet group states the combination of Store operations and Human Resources,
Merchandising, Marketing, Real Estate and Customer Finance as competitive strengths
for the US division. As for the UK division Store operations and Human Resources are
seen as the ability of the continuously trained employees to assist with excellent
customer service the customer through the jewelry purchase. Merchandising is the
combination of the supply chain capability, individual product selection for each store
and 24h re-supply capability. Marketing describes broad advertisement leverage,
national television campaigns and extensive customer relationship marketing. Real
estate describes the well tested store design as well as locations and attractiveness to
landlords. Customer finance describes the facilitation of customer transactions through
financing options.
The Signet Group has a set of exclusive brands for the UK and the US market, all
widely diversified and combined to a specific product mix to target different market
segments.
The middle segment of the UK market is served with the brand H.Samuel. According to
the brand review 2010 H.Samuel is the largest specialty retail jewelry chain in the UK
with an approximate 6% market share and accounted in 2010 for 12% of Signet’s sales.
The product portfolio consists of gold, silver and diamond jewelry, watches as well as
gifts and collectables from known brands. Since 2005 H.Samuel operates an online
store under www.hsamuel.co.uk and 347 stores by January 2010.

57 The upper middle segment of the UK market is served through the brand Ernest Jones.
According to the brand review Ernest Jones is the second largest specialty retail jewelry
brand in the UK with an appropriate 5% share of the market. Ernest Jones accounted in
2010 for 10% of Signet’s sales. The product portfolio consists of diamond and gold
jewelry and prestige watches from well-known brands. Since 2006 Ernest Jones
operates an online store under www.ernestjones.co.uk and 205 stores by January 2010.
E-commerce, although growing, accounts in both cases for only a small amount of the
division sales.
The US division serves the market with the brands Kay Jewelers, Jared The Galleria of
Jewelry and Regional brands. Kay Jewelers and regional brands target the middle
market of the US market. The brand review indicates the brand as the largest specialty
retail jewelry brand in the US based on sales. In 2010 Kay Jewelers accounted for 46%
of Signet’s sales. The brand operates the website www.kay.com and 923 stores by
January 2010. The 260 regional brand stores accounted for 10% of Signet’s sales.
The US product portfolio for the middle market consist of the following registered
trademarks, selling jewelry, watches, accessories, gifts and collectables in an individual
product mix: Kay Jewelers, Jared The Galleria Of Jewelry, JB Robinson Jewelers,
Marks & Morgan Jewelers, Belden Jewelers, Weisfield Jewelers, Osterman Jewelers,
Shaw’s Jewelers, Rogers Jewelers, LeRoy’s Jewelers, Goodman Jewelers, Friedlander’s
Jewelers, Every kiss begins with Kay, Peerless Diamond, Hearts Desire, Perfect Partner,
Open Hearts by Jane Seymour and Love’s Embrace.
The brand Jared the Galleria of Jewelry targets the upper middle market and is stated to
be the leading US specialty retail jeweler by revenue in 2010. The brand accounted in
2010 for 22% of Signet’s sales. The product portfolio consists of loose diamonds,
colored gemstones, jewelry as well as customized jewelry as well as watches and
accessories. The brand operates the website www.jared.com and 178 stores. The e-
commerce share of sales is growing but represents only a small amount of the sales for
both brands.
For both divisions a range of differentiated merchandise is exclusively developed and
continuously adapted to changes in user behavior and to update the merchandise mix.
The Leo Diamond range consist of certified diamonds enhancing diamond brightness

58 and exclusively sold through the Signet group stores. The Peerless diamond range
consists of certified diamonds emphasizing the ideal cut and return of light exclusively
sold through Jared stores. The Le Vian prestigious fashion jewelry brand exclusively
sold through Signet regional stores. The exclusive collection Open Hearts is a
cooperation with celebrity Jane Seymour. For 2010 the collection Love’s Embrace is
launched.
In terms of revenue growth Signet has been experienced a period of slow growth for the
years 2005 and 2006 with +4,6% and +5,0% respectively. The year 2007 was
characterized through a major growth in revenue of +12,8%. The economic downturn
also impacted on Signets operations and they achieved a growth of 3% in 2008 before
the sales growth declined to -8,8% in 2009.
3.4 Cross-Case Analysis
The main focus of this paper is to identify a possible link between a company’s strategy
and its profitability. The cross-case analysis is used to investigate each case company’s
business positioning strategy applying the generic strategies in combination with
Porter’s competitive analysis model and each company’s growth strategy applying the
concepts of diversification and internationalization. Each company’s financial key ratios
will be used as profitability indicators and set into context with their level of
diversification and internationalization. The produced graphs will visualize a possible
link between the company’s strategy and its profitability and provide the base for
discussion.
3.4.1 Summary on case companies strategies
3.4.1.1 Tiffany & Co.
Tiffany & Co (Tiffany or “the company”) is a holding company that operates through
its subsidiaries. The company engages in product design, manufacturing and retailing of
a range of jewelry items. Its products include a selection of jewelry, timepieces, sterling

59 silverware, china, crystal, stationery, fragrances and accessories. The company conducts
its operations across four geographical segments; Americas, Asia-Pacific, Europe and
others.
Tiffany has its own manufacturing facilities which produce approximately 60% of the
merchandise sold by Tiffany and the rest (almost all non-jewelry items) are purchased
from third parties. The majority of precious metals, gold and silver, used in their
workshops are purchased from a single mine in the USA that meets the high standard of
social and environmental responsibility. In order to avoid “conflict diamonds”, Tiffany
established Laurelton Diamonds, a wholly owned subsidiary. Laurelton Diamonds
procures rough diamonds and manage the world wide supply chain that sources, cuts,
polishes, and supplies finished stones to Tiffany. This allows better margins by
eliminating the middle-man, and ensures that Tiffany access to scare and high end
diamonds supplies. Additionally, Tiffany purchases diamonds only in those countries
that are full participants of “the Kimberly Process Certification Scheme (KPCS)”. This
is to ensure that diamonds are conflict-free.
After the diamonds, gems and precious metals have gone through mining, cutting, and
polishing, they are set into finished jewelries that are designed by Tiffany’s designers
who are the best jewelry designers in the world. Once the jewelries are finished and
ready to be sold, they are sent to Tiffany’s central distribution center, namely the
Parsippany distribution center. Tiffany uses various logistics companies those provide a
smooth safe from their warehouses and manufacturing facilities to their retail shops.
Tiffany mainly uses Brinks Inc. to handle the majority of the jewelry shipments to the
retail store. Brinks Inc also handles high-value international shipments. For less
valuable and small orders, Tiffany uses UPS for domestic deliveries and DHL
Worldwide Express for international shipments. Tiffany conducts its business through
three distribution channels:
1. US retail: consists of retail sales transacted in Tiffany & Co. stores in the U.S,
and non-internet, catalog, business-to-business and wholesale operations within
the U.S.
2. International retail: includes stores and department store boutiques outside the
US as well as business-to-business, Internet and wholesale sales of TIFFANY &
Co. products outside the U.S.

60
3. Direct marketing: includes Internet operation and catalogs.
Tiffany differentiates their products by providing unique or superior value to customers
through product features, quality, and after-sale service and support. Customers value
the differentiated products more than they value low costs and they are willing to pay
higher price based on the products characteristics, the delivery system, the quality of
service, and/or the distribution channels (Akan et al, 2006). On top of that, Tiffany’s
brand is well-known for its high-quality jewelry, excellent customer service, an elegant
store and upscale store locations, distinctive and high-quality packaging materials (the
Tiffany & Co. blue box), and sophisticated style and romance (Tiffany’s annual report
2009-2010). Tiffany enjoys strong brand value in a fragmented global jewelry retail
industry. This strong brand value enables Tiffany in gaining market share in a highly
competitive market which supports and enhances their differentiation strategy. Tiffany
maintains the strength of its brand by staffing with friendly and knowledgeable
employees. Their retail stores are quiet and well decorated, and are in the best high
street and luxury mall locations.
The jewelry retail industry is highly fragmented and is dominated by unbranded
retailers. Therefore, quality, reputation, customer perception, professional sales advice
and the shopping experience play the most important factors which drive customers’
decision when buying jewelry. Tiffany has been doing well in identifying the needs of
its customers and providing the products they desire. Its innovation and creativity with
new products’ designs and styles keep customer’s interest. This supports a way to
implement its differentiation strategy. (Isaksaetre et al, 2009; Akan et al, 2006)
Tiffany had started its business as a stationery store and eventually expanded to fine
jewelry. Tiffany has been around for more than century. It started with small and grew,
and adapted to market as it changed. The company increases the profitability and grows
through diversification (greater sales volume obtained from new products and new
markets) and internationalization. The non-core SBAs (such as rings for men, leather
goods, silver plate, brass and antiques) that were not in line with company’s vision were
divested from its business portfolio in 1956. Tiffany’s core SBA is jewelry, and other
related SBAs include loose gemstones (diamond and colored gemstones), accessories
(belts, money clips, tableware, leather goods and scarves, etc.), and fragrances. Among

61 its new product lines, the “Tiffany Keys Collection” was the most successful product
introduction, and it expects to become a perennial favorite among customers.
Another growth strategy Tiffany pursuing is internationalization. One of Tiffany’s key
strategies is to selectively expand its global distribution (Tiffany annual report, 2009-
2010). The company expands its distribution by adding stores in both new and existing
markets. Tiffany conducts its business across four geographical segments; Americas,
Asia-Pacific, Europe and others. The USA is the largest market for Tiffany in Americas,
Japan is the largest market in Asia-Pacific, and the UK is the largest in Europe.
3.4.1.2 Zale Corporation
Zale Corporation (Zale or "the company") is a specialty retailer of fine jewelry and
watches in North America. The company primarily operates in the US, Canada and
Puerto Rico. As of July 2010, Zale operated 1,218 specialty jewelry stores and 672
kiosks located mainly in shopping malls in the US, Canada, and Puerto Rico and online
at www.zales.com, www.zalesoutlet.com and www.gordonsjewelers.com.
Zale purchases the majority of its merchandise in finished form from a network of
established suppliers and manufacturers located primarily in the USA, India, Southeast
Asia and Italy. All of Zale’s purchasing is done through buying offices at its
headquarters (Store Support Center). As of July 2010, the company’s total inventory
had approximately four percent of raw materials and 14 percent of finished goods.
(Zale’s annual report, 2010, p. 6)
Zale is operated under three different business segments: Fine Jewelry, Kiosk Jewelry
and All Other. Fine Jewelry comprises of five brands: Zales Jewelers, Zales Outlet,
Peoples Jewelers, Gordon’s Jewelers, and Mappins Jewelers. Each brand specializes in
fine jewelry, watches and diamonds. These companies pursue focus (differentiation)
strategy by focusing on value-oriented consumer and targeting higher income/ middle-
class customers with unique selection at a competitive price. Their products are
available both in stores and online.

62 The Kiosk Jewelry operates under the brand names Piercing Pagoda, Plumb Gold, and
Silver and Gold Connection (collectively, “Piercing Pagoda) specialize in gold and
silver products, including entry level of diamond merchandise. The Kiosk Jewelry
segment pursue focus (low cost) strategy by offering low-priced merchandise and
targeting mainly young and fashion forward customers. These kiosks are strategically
located in high traffic areas in the mall where they are visible and accessible for
customers.
The “All Other” segment provides insurance and reinsurance facilities, which are
marketed primarily to its private label credit card customers through Zale Indemnity
Company, Zale Life Insurance Company, and Jewel Re-Insurance Ltd.
Zale was first established with a vision to provide its customers with quality
merchandise at the lowest possible price. In 1944, Zale entered into fine jewelry market
segment by diversification through acquisition. The company divested its non-jewelry
businesses during 1980s as they produced little profit. In 2007, Zale divested another
brand (Bailey Banks & Biddle) which was not fit the company’s portfolio. Fine jewelry
remained Zale’s core SBA, and other related SBAs include product financing and
product insurance.
Zale’s internationalization is limited. The company’s property, plant and equipment
locations are limited to North America. The company has expanded its business online
in order to reach more customers. However, it has mostly expanded in North America.
Therefore, Zale’s growth is limited as it focusing mainly on regions in North America.
3.4.1.3 Blue Nile
The company is operating an e-business model, displaying and distributing the products
through distinctive websites, maintaining a virtual inventory, sourcing diamonds
directly and signing exclusive online distribution agreements. The company’s revenue is
generated through one SBA only, i.e. online retailing jewelry. The US market is the
company’s largest by revenue, but the growth is bigger in all other countries served.
63 Blue Nile powerful market position and competitive advantage is based on its achieved
value positioning, empowered customer confidence, efficient virtual inventory and
international presence. The e-business model allows the company to offer the same high
quality diamonds at a lower price than its competition and customers benefit directly
from this value proposition. Blue Nile increased customer confidence with several
initiatives and measurements to overcome the barrier of purchasing diamonds online.
The key factors here are user friendliness, easiness of use, transparency, online
education, personal customer service, fast delivery and money-back guarantee. Another
benefit of the e-business model is the opportunity to avoid the costly maintenance of
inventory. The company maintains interactive outsourcing and sources its products
directly from diamond cutters, thereby cutting out several layers from the traditional
supply chain and reducing cost once more. In combination with exclusive distribution
ships Blue Nile can secure the availability of the products for its customers. The
expansion of an e-business is relatively easy to established economies like in Europe or
emerging economies like in Asia or India, since all the potential customers need is
access to the internet and a credit card system. Blue Nile is growing faster outside the
domestic market and serves the demand through international websites, easy
accessibility, payment facilitation and foreign currency acceptance. The growing
accessibility of the internet and the acceptance of e-commerce will open new business
opportunities for Blue Nile. In combination with the enlargement of its product range
with non-engagement and non-diamond jewelry Blue Nile aims at gaining market share
within the consolidated jewelry retailing market.
The risk for an e-business model like this is the degree of confidence in the approach
purchasing diamonds and diamond jewelry unseen online. The more reluctant the
potential customers get the greater the impact on Blue Nile’s business. This is one of the
major concerns for Blue Nile and the company addresses the risk by customer
empowerment, education and its ‘recently bought’ as well as ‘customer testimonials’’
features. Another development impacting Blue Nile’s business profitability is the
increase in wholesale prices of diamonds and the impact on the company’s margins.
Blue Nile has positioned itself within a specialized, relatively small and fragmented
business segment, the diamond and diamond jewelry retailing industry, and focuses
with its core product on a specific customer group with a demand for a unique product,
engagement jewelry. Relating to the competitive analysis and generic strategies in

64 figure 4 Blue Nile might be able to forward the increase in raw material prices to a
certain degree to the end customer or cut on their margins to sustain the product price
advantage over its competition to smooth out the increase. Blue Nile’s generic strategy
can be defined as a type 5 strategy according to figure 3. Within the small sized market
of diamonds and diamond jewelry Blue Nile achieved a dominant position through
focusing on a specific customer and product group, the engagement jewelry. Since the
product is purchased based on its value, perceived value and unique purpose Blue Nile
benefits from its cost leadership position. The ability to offer the same product at a
lower price than the competition and simultaneously benefiting from higher margins
than the competition gives Blue Nile a sharp competitive edge.
Blue Nile’s competitive advantage is built upon its lower product prices achieved
through a cost-efficient business model combined with achieved higher margins and a
diverse range of products and services enhancing as well as empowering and
encouraging the customer to purchase online.
Blue Nile’s core product is still engagement jewelry but over the years the company has
broadened its product range into the SBA’s loose diamonds and gemstones, fine jewelry
and accessories. Around the SBA’s the company developed an extensive range of
supplement services like the Jewelry Consultants, Customer Education, Customer
Testimonials, interactive online tools as well as databases. The company also diversified
into related profitable SBA’s like product financing, product insurance and product
maintenance. Blue Nile strategically diversified close around its core SBA’s and is
focusing on any available supplement service to enhance the added value and benefits
of the product for the customer. All actions taken are in line with the strategy to build a
center of excellence and expertise around the core SBA’s to achieve a superior purchase
experience for the customer.
Blue Nile is seeking for customers worldwide and its internationalization is closely
connected to the availability of the internet, access to it and the availability of related
financial services like credit card payment or online systems like e.g. Pay Pal. To enter
and penetrate a market the economy needs to have the technology, the purchasing power
and the consumer habit to use the internet on a regular basis for purchases of any kind.
With these requirements in place internationalization can be achieved in a rather cost-
efficient way, since no facilities have to be rented and only a small amount of additional
65 staff has to be hired, if at all. Blue Nile started its business operations in the US and
went from there in 2004 to Western Europe and in 2005 to Canada, representing
economies with the required level of technology, spending power and consumer habits.
Before the economic slowdown the Asian-Pacific region was encountered and the
numbers of countries served though the three existing websites increased to 40. Blue
Nile is following the acceptance of e-commerce in its internationalization, since e-
commerce and its acceptance are the basis for its business operations.
3.4.1.4 Signet Jewelers
Signet Jewelers Limited is a specialty retail jeweler and generates its revenue from the
SBA’s jewelry retailing, watches and aligned products and services. The company
operates through 1913 stores in the two geographic segments the US and the UK. The
US segment is the company’s largest market by revenue with a moderate increase as for
the UK segment experienced a moderate decrease in revenue.
The UK segment includes Ireland and the Channel Islands. The segments within the US
markets are served US wide through Kay Jewelers in-mall and off-mall locations and
regionally through a range of brands, mainly mall-based. The third brand Jared The
Galleria of Jewelry serves US wide through its superstore concept. Kay Jewelers and
the regional brands cater to the lower and middle market segment whereas Jared The
Galleria of Jewelry caters to the upper end of the middle market segment. The segments
within the UK market are served through the brands H.Samuel, Ernest Jones and Leslie
Davids. H.Samuel stores cater to the core middle market, Ernest Jones stores cater to the
upper middle market and Leslie Davis stores cater to the upper end of the middle
market.
Signet’s strong position within the jewelry retailing market is based on its strong market
presence, divers brand as well as store formats to serve a broad range of customers
within the middle segment of the jewelry retailing market and its contract
manufacturing strategy. To achieve and sustain its advantage on cost and quality Signet
supplies the contract manufacturing partners with polished loose diamonds. This
strategy allows the company to gain an in-depth understanding of the manufacturing
66 cost, allows them to achieve better prices for the finished commodities and reducing the
cost of merchandise. As outcome of this the company can offer a more attractive value
to its customers and increase margins and market share in the long run. The
restructuring and relocation of its operations in 2008 supports the actions above and
brings them closer to the main market, the US.
However Signet’s declining sales can be an indicator for e.g. an outdated marketing and
merchandise mix, not appealing to the middle segment or corresponding to the current
economic development. In the middle segment the company is not only competing
against other companies like Blue Nile Inc. or Zale Corp., but also against other
activities like vacation or other leisure activities as well as e.g. electronics. The annual
reports also show an increase in the company’s debt level, which might force them to
use a significant amount of the cash flow from its operations to pay the debts off.
Signet has positioned itself within the middle segment of the jewelry retailing industry,
a high competitive and fragmented segment, and focuses through its different brands on
several sub-segments within the middle segment. According to Figure 2 Signet’s
generic strategy can be classified as ‘Focused Cost Leadership’. Within its segment
Signet is aiming to secure the lowest product prices in combination with the best value
for the customer. Furthermore Signet is targeting different customer groups with
different product mix and store concepts to leverage its presence within the middle
market segment.
Signets competitive advantage is based on its competitive prices achieved through
contract manufacturing, its well established brands and its customer proximity.
Signet has diversified its merchandise into the SBA’s loose gemstones, jewelry and
accessories and focuses within in each store brand on an individual product mix. In-
store-services like customer education and service support the SBA’s. In addition to the
SBA’s the company has diversified into the related SBA of Jewelry repair services.
Signet has diversified close around its core SBA’s, investing and enhancing in its
brands and the actions are in line with the strategy to rather focus on its competitive
advantage than on opening additional locations.

67 Signet grew heavily and fast through a series of acquisitions and invested heavily
capital over decades to achieve its current market presence. The acquired businesses
were chosen on their geographical location and market leverage as well as their
established brand to sustain Signets leadership position within the middle segment. The
growth strategy consumed a vast amount of capital leading also to today’s debt level.
3.4.2 Companies’ Key Financial Ratios
Tiffany & Co.
Ratio 2005 2006 2007 2008 2009 Revenue growth 8.5 % 10.5 % 14.7 % (2.7 %) (4.9 %) Operating profit margin 11.7 % 11.5 % 12.6 % 8.2 % 9.8 %
Return on Assets 9.3 % 9.4 % 10.8 % 7.1 % 7.6 % TABLE 1. Key Financial Ratios of Tiffany & Co.
Source: Company’s annual report 2009-2010
Tiffany’s worldwide sales revenue increased approximately 9%, 11% and 15% in 2005,
2006 and 2007 respectively. The company worldwide sales decreased 3% in 2008 and 5
% in 2009. Sales decreased were affected by the global economic downturn that began
in the latter half of 2008.
Tiffany was able to control its costs and expenses associated with business operations
efficiently between 2005 and 2007, which indicated by the operating profit margin of
11.7% in 2005 and 12.6 % in 2007. In 2008, the operating margin was 8.2 %, which
was affected by sales revenue during fourth quarter (the starting of economic
downturn). Even though sales revenue decreased 5% in 2009 compare to 3% in 2008,
the company generated higher operating margin. It resulted from the company’s cost-
saving initiatives that included significant reductions in staffing and marketing spending
(annual report 2009-2010).
Tiffany’s return on assets ratio was 7.6% in 2009 compared to 7.1% in 2008. This
indicates that the company generated better net revenue from its invested capital.
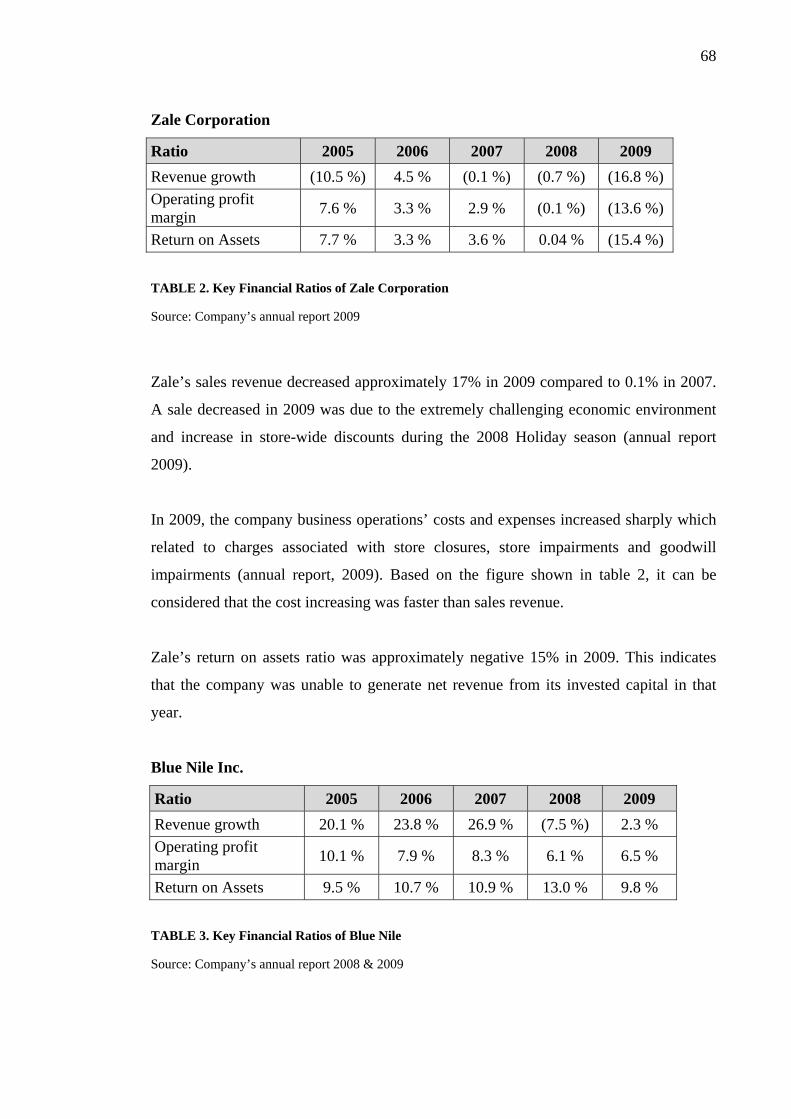
68
Zale Corporation
Ratio 2005 2006 2007 2008 2009 Revenue growth (10.5 %) 4.5 % (0.1 %) (0.7 %) (16.8 %) Operating profit margin 7.6 % 3.3 % 2.9 % (0.1 %) (13.6 %)
Return on Assets 7.7 % 3.3 % 3.6 % 0.04 % (15.4 %) TABLE 2. Key Financial Ratios of Zale Corporation
Source: Company’s annual report 2009
Zale’s sales revenue decreased approximately 17% in 2009 compared to 0.1% in 2007.
A sale decreased in 2009 was due to the extremely challenging economic environment
and increase in store-wide discounts during the 2008 Holiday season (annual report
2009).
In 2009, the company business operations’ costs and expenses increased sharply which
related to charges associated with store closures, store impairments and goodwill
impairments (annual report, 2009). Based on the figure shown in table 2, it can be
considered that the cost increasing was faster than sales revenue.
Zale’s return on assets ratio was approximately negative 15% in 2009. This indicates
that the company was unable to generate net revenue from its invested capital in that
year.
Blue Nile Inc.
Ratio 2005 2006 2007 2008 2009 Revenue growth 20.1 % 23.8 % 26.9 % (7.5 %) 2.3 % Operating profit margin 10.1 % 7.9 % 8.3 % 6.1 % 6.5 %
Return on Assets 9.5 % 10.7 % 10.9 % 13.0 % 9.8 % TABLE 3. Key Financial Ratios of Blue Nile
Source: Company’s annual report 2008 & 2009

69 Blue Nile’s sales revenue decreased approximately 8% in 2008 after it had increased
27% in 2007 compared to 20% in 2005. Sales in 2008 was affected by the weakened
global economic and financial market conditions that created uncertainty for consumers,
and macroeconomic downturn had a significant impact on consumer spending, most
notably on purchases of expensive items, including jewelry (annual report, 2008).
Additionally, it was impacted by rising prices for diamonds.
The company operating profit margin was 6.5% in 2009 compared 6.1% in 2008. It
primarily resulted from increasing sales through websites, improving in operating
margins and the efficient management of operating costs (annual report, 2009).
Additionally, as an online retailer, the company does not incur most of the operating
costs associated with physical retail stores, including occupancy costs and related
overhead.
Compare to other companies, Blue Nile was performed well in using the assets to
generate income in especially in 2008, which represented 13%. The company excelled
at making large profit with little investment.
Signet Jewelers Limited
Ratio 2005 2006 2007 2008 2009 Revenue growth 4.6 % 5.0 % 12.8 % 3.0 % (8.8 %) Operating profit margin 12.3 % 11.2 % 10.9 % 9.2 % (9.8 %)
Return on Assets 8.9 % 8.3 % 7.2 % 6.1 % (13.3 %) TABLE 4. Key Financial Ratios Signet Jewelers Ltd.
Source: Company’s annual report 2005, 2009 & 2010
In 2005 to 2007, Signet’s sales revenue increased approximately 5 % and 13%
respectively. Sales increased 3% in 2008 and decreased approximately 9% in 2009. A
sale decreased was resulted from economic downturn which started in the latter of 2008.
Jewelry purchases are dependent on general economic conditions (Annual report, 2009).
Therefore, economic crisis many unfavorably impact the sales and earnings.
During 2005-2009, the company generated the lowest operating profit margin in 2009.
The reason was due to increase in expenses associated with new stores and a higher cost

70 of gold (Annual report, 2009). It also can be considered that the business operation costs
were increasing faster than sales revenue.
Signet’s performance on using assets to generate net income was weakening during
2005-2008, indicated by the figure of 8.9% to 6.1%. In addition to that, the company
was unable to generate net revenue from its invested capital in 2009, which return on
assets ratio was approximately negative 13%.
3.4.3 Level of diversification
As discussed in chapter 2.2.1 diversification describes the company’s decision to grow
through either related or unrelated diversification into new SBA’s2. To decide on the
case companies’ level of diversification each company’s development of main SBA’s
and related SBA’s will be investigated. Unrelated SBA’s will not be taken into account
for the analysis.
To define each company’s SBA’s the product categories are listed in the Tables 5-7.
Blue Nile Signet Zale Tiffany • Items:
Diamonds
Colored Gemstones
Diamond jewelry
Pearl jewelry
Platinum jewelry
Sterling jewelry
Engagement rings
Wedding rings
Anniversary rings
Ear rings
Necklaces
Pendants
Bracelets
Watches/accessories
• Items:
Jewelry items
Diamonds
Colored gemstones
Gold
Watches
Gifts
• Items:
Jewelry
Bridal jewelry
Watches
• Items:
Diamonds
Jewelry
Watches
Cuff links
Money clips/card
holders
Eyewear
Fragrances
Key rings
Scarves
Small leather goods
Sterling accessories
Writing instruments
Gifts
Tableware
TABLE 5. Case companies’ product category: Item
Source: Adapted from companies’ annual reports 2005 - 2009. 2 see chapter 2.2.1 Diversification

71
Blue Nile Signet Zale Tiffany • Related Services:
Jewelry repair
Product Financing
Product Insurance
• Related Services:
Jewelry repair
• Related Services:
Product Financing
Product Insurance
• Related Services:
Not indicated
TABLE 6. Case companies’ product category: Related Services
Source: Adapted from companies’ annual reports 2005 - 2009.
Blue Nile Signet Zale Tiffany • Unrelated Services:
Not indicated
• Unrelated Services:
Not indicated
• Unrelated Services:
Insurance facilities
Private label credit
card (until June 2010)
• Unrelated Services:
Not indicated
TABLE 7. Case companies’ product category: Unrelated Services
Source: Adapted from companies’ annual reports 2005 - 2009.
To define the main SBA’s, products with similar attributes and similar use are grouped
together, e.g. jewelry, rings, pendants and ear rings, regardless their material and gem
stones are grouped together under jewelry. Furthermore loose diamonds and colored
gemstones are grouped together as loose gemstones, since they are loose and neither
into any material nor are they ready for wearing. Then there are accessories like
watches, cuff links, belts, money clips, tableware, leather goods and scarves, writing
instruments and eyewear. The decorative character of these products is merged with a
function e.g. monitoring time, keeping trousers up or shades your eyes. Fragrances are
kept as a SBA of its own.
The four identified main SBA’s’ Jewelry’, ‘Loose Gemstones’, ‘Accessories’ and
‘Fragrances’ and their distribution are shown in Table 6 below.

72
Blue Nile Signet Zale Tiffany • Main SBA’s
Loose gemstones
Jewelry
Accessories
• Main SBA’s
Loose gemstones
Jewelry
Accessories
• Main SBA’s
Jewelry
Accessories
• Main SBA’s
Loose gemstones
Jewelry
Accessories
Fragrances
TABLE 8. List of SBA's per case company
Source: Adapted from companies’ annual reports 2005 - 2009.
To define the companies’ number of related SBA’s the related services are grouped into
‘Product Financing’, ‘Product Insurance’ and ‘Maintenance’, including product
reparation, maintenance and cleaning. In this case related SBA’s are not part of the main
SBA’s but they support their functions and contribute to their profitability. Table 7
below lists each company’s related SBA’s.
Blue Nile Signet Zale Tiffany • Related SBA’s
Prod. Financing
Prod. Insurance
Maintenance
• Related SBA’s
Maintenance
• Related SBA’s
Prod. Financing
Prod. Insurance
• Related SBA’s
Not indicated
TABLE 9. List of related SBA's per case company
Source: Adapted from companies’ annual reports 2005 - 2009.
The findings of Table 7 suggest that, according to Tiffany’s annual reports, the
company has not diversified into any related SBA. Without any reliable source of
information to disproof the suggestion, the sum of main and related SBA’s will be
considered. The findings and statements on the profitability of Tiffany’s unrelated
SBA’s will be distorted through their non-existence and considering the sum of SBA’s
the effect shall be minimized.

73 With the number of main SBA’s and related SBA’s defined the case companies’ level
of diversification can be investigated documenting their increase or decrease during the
time period 2005 – 2009. The development of the SBA’s, here the sum of main SBA’s
and related SBA’s, according to the case companies’ annual reports is shown in table 8
below. The detailed development is documented in the Appendix.
Number of SBA's 2005 2006 2007 2008 2009 Tiffany 4 4 4 4 4 Zale 4 4 4 4 4 Blue Nile 6 6 6 6 6 Signet 4 4 4 4 4 TABLE 10. Case companies’ number of SBA's 2005-2009
Source: Adapted from companies’ annual reports 2005 - 2009.
According to the annual reports there have been changes in the product mix as well as
changes to brand and product lines within the SBA’s ‘Loose gemstones’, ‘Jewelry’,
‘Accessories’ and ‘Fragrances’, but there has been no diversification into an additional
main SBA to the ones listed above. Similar in the case of the related SBA’s ‘Product
Financing’, ‘Product Insurance’ and ‘Maintenance’.
Based on the findings displayed in Table 8 the major portion of the investigate case
companies, Tiffany, Signet and Zale, have diversified into 4 SBA’s, whereas Blue Nile
has diversified into 6 SBA’s. This suggests that Blue Nile is currently the most
diversified company out of the four investigated case companies. The remaining three
companies are equally diversified.
3.4.4 Level of Internationalization
As discussed in chapter 2.2.2, the reasons firms go international are to grow and
increase their profitability. Firms may export and/ or invest in foreign country in
looking to increase profits and grow beyond their own borders (Rugman, 2003, p.4).
Therefore, increasing profitability and searching for new markets (Arkpinar, 2009, p. 5)
are major motives behind internationalization.
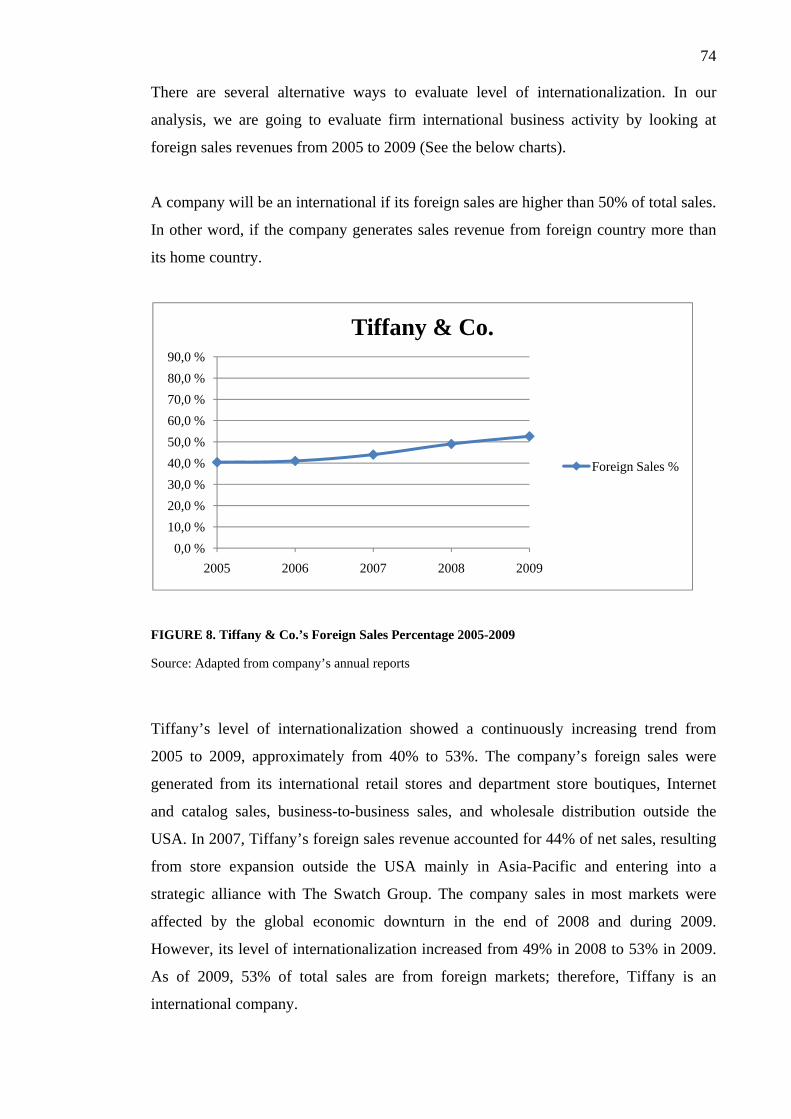
74 There are several alternative ways to evaluate level of internationalization. In our
analysis, we are going to evaluate firm international business activity by looking at
foreign sales revenues from 2005 to 2009 (See the below charts).
A company will be an international if its foreign sales are higher than 50% of total sales.
In other word, if the company generates sales revenue from foreign country more than
its home country.
0,0 %10,0 %20,0 %30,0 %40,0 %50,0 %60,0 %70,0 %80,0 %90,0 %
2005 2006 2007 2008 2009
Tiffany & Co.
Foreign Sales %
FIGURE 8. Tiffany & Co.’s Foreign Sales Percentage 2005-2009
Source: Adapted from company’s annual reports
Tiffany’s level of internationalization showed a continuously increasing trend from
2005 to 2009, approximately from 40% to 53%. The company’s foreign sales were
generated from its international retail stores and department store boutiques, Internet
and catalog sales, business-to-business sales, and wholesale distribution outside the
USA. In 2007, Tiffany’s foreign sales revenue accounted for 44% of net sales, resulting
from store expansion outside the USA mainly in Asia-Pacific and entering into a
strategic alliance with The Swatch Group. The company sales in most markets were
affected by the global economic downturn in the end of 2008 and during 2009.
However, its level of internationalization increased from 49% in 2008 to 53% in 2009.
As of 2009, 53% of total sales are from foreign markets; therefore, Tiffany is an
international company.

75
0,0 %10,0 %20,0 %30,0 %40,0 %50,0 %60,0 %70,0 %80,0 %90,0 %
2005 2006 2007 2008 2009
Zale Corporation
Foreign Sales %
FIGURE 9. Zale Corporation’s Foreign Sales Percentage 2005-2009
Source: Adapted from company’s annual reports
Zale’s level of internationalization showed a continuously increasing trend from 2005 to
2008, approximately from 10% to 15%. But it decreased approximately 1 % in 2009.
The company generated international sales revenue through its fine jewelry segment and
kiosk jewelry segment (until 2007) outside the USA mainly in Canada. During 2008,
the company opened additional stores in Canada. The company’s level of
internationalization rose from 13% in 2007 to 15% in 2008. Zale Corporation is a
domestic company as its foreign sales is less than 50 % of total sales.

76
0,0 %10,0 %20,0 %30,0 %40,0 %50,0 %60,0 %70,0 %80,0 %90,0 %
2005 2006 2007 2008 2009
Blue Nile Inc.
Foreign Sales %
FIGURE 10. Blue Nile’s Foreign Sales Percentage 2005-2009
Source: Adapted from company’s annual reports
Blue Nile’s level of internationalization showed a continuously increasing trend from
2% in 2005 to 11% in 2009. Blue Nile generated international sales revenue from
serving consumers in over 40 countries through its trademark e-commerce website
www.bluenile.com (including bluenile.co.uk and bluenile.ca) and insurance operation.
Despite global economic downturn, Blue Nile’s level of internationalization rose from
9% in 2008 to 11% in 2009. It was resulted from the company expanded its customers’
ability to shop and transact in 22 additional foreign currencies. Additionally, the
company also monitored international sales performance on a non-GAAP basis which
eliminates the positive or negative effects that result from translating foreign sales into
US dollars (annual report, 2009). As in 2009, the company’s foreign sales accounted for
11% of total sales; therefore, it is a domestic company.

77
0,0 %10,0 %20,0 %30,0 %40,0 %50,0 %60,0 %70,0 %80,0 %90,0 %
2005 2006 2007 2008 2009
Signet Jewelers Ltd.
Foreign Sales %
FIGURE 11. Tiffany & Co.’s Foreign Sales Percentage 2005-2009
Source: Adapted from company’s annual reports
Signet Jewelers’ level of internationalization showed a continuously increasing trend
from 69% in 2005 to 75% in 2007 and decreasing to 74 in 2008 and again increasing to
76% in 2009. The company generated its international sales revenue from the retailing
of jewelry, watches, other products and services in the US division (Datamonitor,
2009). In 2006, the company expanded and enhanced its online presence at kay.com.
Signet’s internationalization level rose from 69% in 2005 to 73% in 2006. However,
further international growth slowed between 2007 and 2009. As Signet foreign sales
accounted for 76% of total sales in 2009, the company is an international company.
The above findings will be used in 3.4.5 to assess the companies’ profitability versus
their level of internationalization.
3.4.5 Analysis and Findings
As stated earlier the objective of this research is to investigate whether there is a
connection between a company’s business model and its profitability. So far the case
companies business models have been reviewed against the theoretical background and
the emerged main strategies have been described. For the analysis and assessment the
defined level of diversification, indicated through the amount of SBA’s, as well as the

78 level of internationalization, indicated through the percentage of foreign sales, is related
to two financial key ratios, the Operating Profit Margin (OPM) and the Return on
Assets (ROA) and additionally to the Revenue Growth (RG), since companies diversify
and internationalize to grow their revenues and profitability. In the case of the level of
diversification it has been stated earlier that sum of main and related SBA’s will be used
to assess profitability.
The OPM is calculated by dividing the operating profit figure by the net sales figure for
a certain period, normally the company’s fiscal year. The result is given as percentage
and indicates a company’s profitability before taxes and interest paid. The OPM is used
to picture a company’s profitability over longer time periods, to describe its
development and also to compare against e.g. market average or competition. It also
enables e.g. the company’s board to evaluate the management’s strategies and activities
controlling cost. An overtime increasing OPM is interpreted as a consequence of
strategically reasonable and profitable decisions and actions taken and desirable for any
business operation.
In relation to the number of SBA’s the OPM indicates how profitable they are and if
there is a significant difference between the number of SBA’s and growth in
profitability.
The ROA is calculated by dividing the net income figure by the total assets figure for a
certain period, normally the company’s fiscal year. The result is given as percentage and
gives information about how efficient a company utilizes its assets, in this case its
equity as well as debts, to generate profit. The ROA is used to compare a company’s
profitability over longer time periods and picture its development. It is also used for the
comparison of similar companies and their profitability.
The ROA indicates the ability of the management to achieve profit on a made
investment and the higher the ROA the higher is the achieved profit on a compared
small investment.
The investigated time period 2005 – 2009 was heavily impacted by the economic crisis
and therefore the average OPM as well as ROA percentage and average RG are used in
the analysis below to provide a more general basis for the conclusions and

79 generalization of the findings. The number of SBA’s has not changed over the years
2005-2009 and the number used is based on the year 2009. The detailed values and
calculations are displayed in the appendix.
In the first step of the assessment of each company’s profitability the in Table 8 defined
number of SBA’s is related to the average RG, the average OPM and the average ROA
percentage.
‐6,0
‐4,0
‐2,0
0,0
2,0
4,0
6,0
8,0
10,0
12,0
14,0
0 2 4 6Ave
rage
RG
200
5 -2
009
/ %
Number of SBA's
RG vs. Number of SBA's
Tiffany
Zale
Blue Nile
Signet
FIGURE 12. Profitability: Average RG vs. Number of SBA's
Figure 8 suggests heavily a correlation between the level of diversification and the RG.
Blue Nile with its 6 SBAs is strongly outperforming the other companies with a RG of
13,1% and a difference of 7,9% to Tiffany, scoring second with a RG of 5,2%.
However, taking the other companies into account the suggestion gets diluted. Tiffany’s
extreme counterpart is Zale with a RG of – 4, 7% at the same level of diversification.
Figure 8 does not provide any evidence of a strong correlation between the level of
diversification and the achieved RG, since the differences amongst the companies with
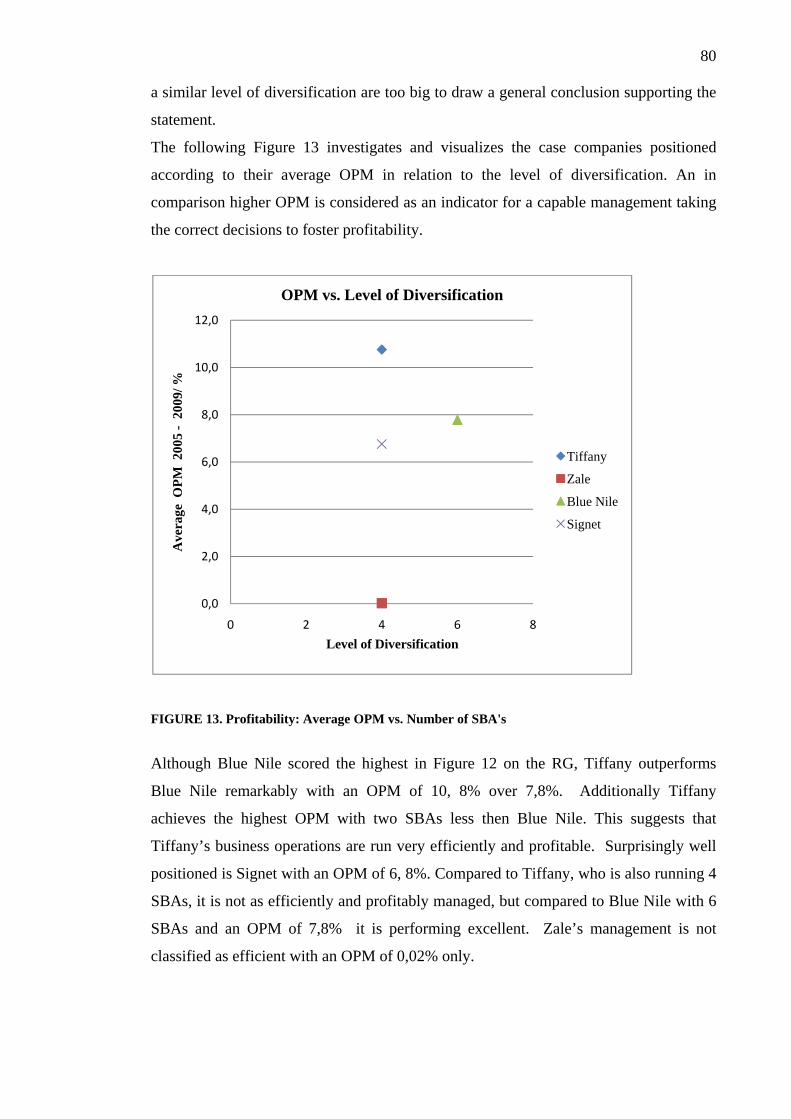
80 a similar level of diversification are too big to draw a general conclusion supporting the
statement.
The following Figure 13 investigates and visualizes the case companies positioned
according to their average OPM in relation to the level of diversification. An in
comparison higher OPM is considered as an indicator for a capable management taking
the correct decisions to foster profitability.
0,0
2,0
4,0
6,0
8,0
10,0
12,0
0 2 4 6 8
Ave
rage
OPM
200
5 -
2009
/ %
Level of Diversification
OPM vs. Level of Diversification
Tiffany
Zale
Blue Nile
Signet
FIGURE 13. Profitability: Average OPM vs. Number of SBA's
Although Blue Nile scored the highest in Figure 12 on the RG, Tiffany outperforms
Blue Nile remarkably with an OPM of 10, 8% over 7,8%. Additionally Tiffany
achieves the highest OPM with two SBAs less then Blue Nile. This suggests that
Tiffany’s business operations are run very efficiently and profitable. Surprisingly well
positioned is Signet with an OPM of 6, 8%. Compared to Tiffany, who is also running 4
SBAs, it is not as efficiently and profitably managed, but compared to Blue Nile with 6
SBAs and an OPM of 7,8% it is performing excellent. Zale’s management is not
classified as efficient with an OPM of 0,02% only.
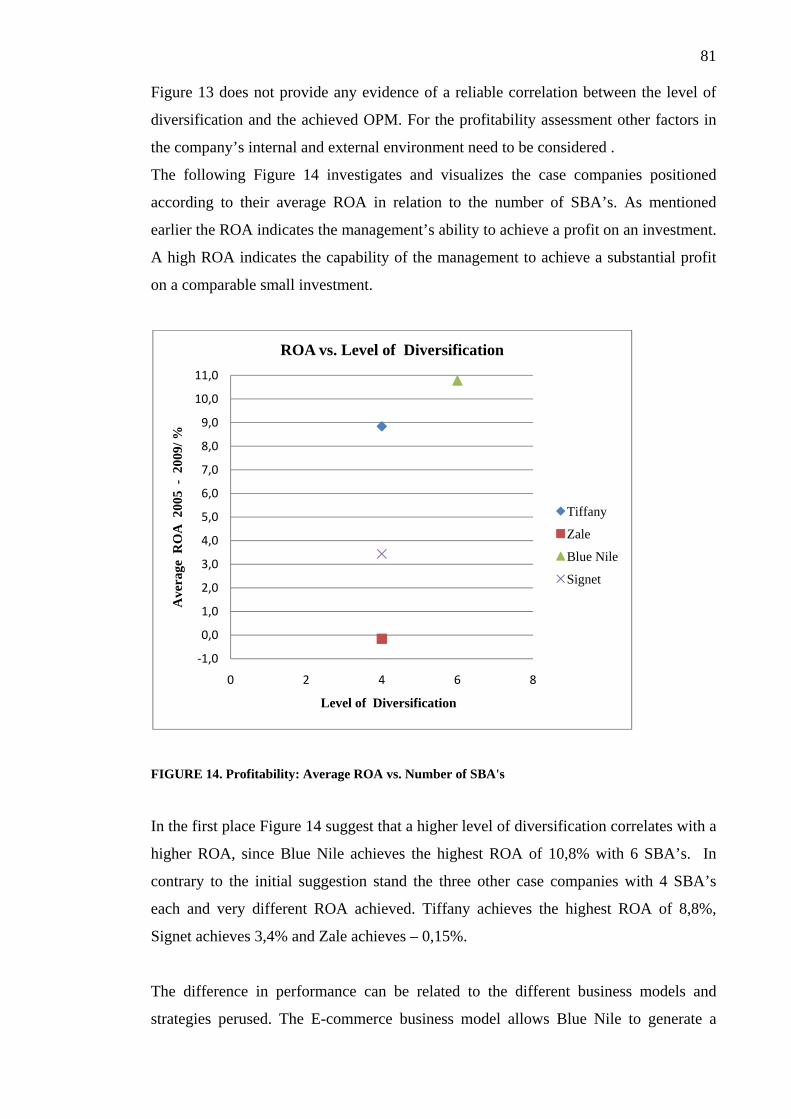
81 Figure 13 does not provide any evidence of a reliable correlation between the level of
diversification and the achieved OPM. For the profitability assessment other factors in
the company’s internal and external environment need to be considered .
The following Figure 14 investigates and visualizes the case companies positioned
according to their average ROA in relation to the number of SBA’s. As mentioned
earlier the ROA indicates the management’s ability to achieve a profit on an investment.
A high ROA indicates the capability of the management to achieve a substantial profit
on a comparable small investment.
‐1,0
0,0
1,0
2,0
3,0
4,0
5,0
6,0
7,0
8,0
9,0
10,0
11,0
0 2 4 6 8
Ave
rage
RO
A 2
005
-20
09/ %
Level of Diversification
ROA vs. Level of Diversification
Tiffany
Zale
Blue Nile
Signet
FIGURE 14. Profitability: Average ROA vs. Number of SBA's
In the first place Figure 14 suggest that a higher level of diversification correlates with a
higher ROA, since Blue Nile achieves the highest ROA of 10,8% with 6 SBA’s. In
contrary to the initial suggestion stand the three other case companies with 4 SBA’s
each and very different ROA achieved. Tiffany achieves the highest ROA of 8,8%,
Signet achieves 3,4% and Zale achieves – 0,15%.
The difference in performance can be related to the different business models and
strategies perused. The E-commerce business model allows Blue Nile to generate a
82 higher ROA, since its investments - like computer equipment, software, website, leasing
household and improvements as well as furniture and fixtures - are significantly smaller
and its generated profit significantly higher due to its leaner business structure with e.g.
a virtual inventory and less staff. In this context Blue Nile can be seen as the deviation
from the norm distorting the findings, but impressively illustrating the benefits of a pure
E-commerce model in this retail industry.
As for the remaining three companies, Tiffany, Signet and Zale, they share the same
level of diversification with significantly different ROA results. Investigating the
business models and strategies it can be supposed that Tiffany strives on an extremely
strong brand and a very solid market position, enabling them to generate significant
profits on their investments. One of Signet’s main strategy is to invest in store space to
foster growth, but its ROA only shows a moderate achievement. Zale is displaying a
decrease in many of the areas investigated and surely the company’s limitation in
investment and growth show in its negative ROA.
Based on the difference in performance of the three case companies with 4 SBA’s the
conclusion is drawn that there is no evidence for a direct correlation between the level
of diversification and a company’s profitability. In addition to the level of
diversification a company’s business model, strategies, brand value and position
contribute to its performance as well as profitability have to be taken into account for
assessment.
In the second step the in 3.4.4 defined Level of Internationalization is related to the
average RG, the average OPM and the average ROA percentage.

83
-6,0-4,0-2,00,02,04,06,08,0
10,012,014,016,0
0,0 % 10,0 % 20,0 % 30,0 % 40,0 % 50,0 % 60,0 % 70,0 % 80,0 %
Ave
rage
RG
200
5 -2
009
/ %
Average Level of Internationalization
RG vs. Level of Internationalization
Tiffany
Zale
Blue Nile
Signet
FIGURE 15. Profitability: Average RG vs. Level of Internationalization 2005-2009
As discussed earlier in chapter 3.4.4, firms internationalize in order to increase
company’s profit and grow. However, based on our findings (see Figure 15), the most
international company, Signet Jewelers (average internationalization level of 73%),
could generate average sales revenue growth approximately at 3% compare to Blue Nile
which is the least international company (average internationalization level of 6%) at
13%.
0,0
2,0
4,0
6,0
8,0
10,0
12,0
0,0 % 10,0 % 20,0 % 30,0 % 40,0 % 50,0 % 60,0 % 70,0 % 80,0 %
Ave
rage
OPM
200
5 -
2009
/ %
Average Level of Internationalization
OPM vs. Level of Internationalization
Tiffany
Zale
Blue Nile
Signet
FIGURE 16. Profitability: Average OPM vs. Level of Internationalization 2005-2009

84
As mentioned above, operating profit margin indicates a company’s profitability before
taxes and to evaluate the management cost and expense controlling. From our findings
(Figure 16), Tiffany, the second international company (average internationalization
level of 45%) performs the best in controlling costs and expenses associated with
business operations. Its average operating profit margin is 11%. The highest
internationalization does not contribute the best profitability in term of cost and expense
controlling. As shown in the above figure, Signet’s average operating profit margin
stand at 7% compare to Blue Nile at 8%.
-2,0
0,0
2,0
4,0
6,0
8,0
10,0
12,0
0,0 % 10,0 % 20,0 % 30,0 % 40,0 % 50,0 % 60,0 % 70,0 % 80,0 %
Ave
rage
RO
A 2
005
-20
09/ %
Average Level of Internationalization
ROA vs. Level of Internationalization
Tiffany
Zale
Blue Nile
Signet
FIGURE 17. Profitability: Average ROA vs. Level of Internationalization 2005-2009
As discussed earlier in this chapter, “Return on Asset” indicates how efficient a
company utilizes its assets to generate profit, and indicates management‘s ability to
achieve large profit with little investment. In our findings, shown in above figure, the
highest internationalization level does not correlate to the ability to generate large profit
from little investment. It can be seen that Blue Nile, the lowest internationalization
level, generates larger profit with little investment compare to Signet. Blue Nile’s
average return on assets stands at 11% compare to Signet’s at 3%.
85 4 DISCUSSION
Business Strategies/Generic Strategies and Jewelry Retail Industry
The global Jewelry Retail Industry is highly fragmented and competitive. Companies
compete with a large number of independent international and local jewelry retailers, as
well as encounter significant competition in all product lines. Companies gain a
competitive advantage over their competitors by successfully implementing business
strategies that are geared towards reducing cost and/or differentiate their products and
services. Therefore, the company may pursue cost leadership, differentiation, focus
strategy or a combination.
In a competitively fragmented global jewelry retail industry, Tiffany & Co. enjoys its
strong brand value (the most important company’s asset). Tiffany differentiates its
products by providing unique or superior products through its brand, which is well-
known for its reputation of high-quality products, excellent customer service and
distinctive value-priced merchandise and does not engage in price promotional
advertising. Tiffany successfully implements a differentiation strategy by being
innovative and creative. With its innovation and creativity, Tiffany introduces many
new products’ designs and styles that keep customer’s interest. For example, Tiffany
Setting, engagement ring, is one of the Tiffany’s innovative designs, and is well-known
for its unique and elegant.
Zale Corporation offers fine jewelry through five brands that focus on the value oriented
customer. Zale brands are relevant by offering quality product at great prices. Zale
targets varied customers (higher income & middle-class) and offer lower opening price
points in each product categories and brands it offers, pursuing focus (differentiation)
strategy. Additionally, Zale also pursues focus (low cost) strategy by offering low-
priced merchandise and targeting younger customers through Kiosk Jewelry segment.
As an increasing number of customers prefer products and choices at lower price points,
Zale is well positioned itself to cater to this customer base. Zale increases its customer
base without diluting the brand image by offering a variety of brands that target varied
customers.
Blue Nile’s brand is well respected by consumers in term of offering a broad selection
of high quality jewelry at very competitive prices. In a highly competitive jewelry retail
86 market, Blue Nile achieves a dominant position through focusing on its core product
that is engagement jewelry and on a specific customer group who demand for a unique
engagement product, pursuing focus (differentiation) strategy. Blue Nile also pursues
cost leadership strategy with the ability to offer the same product at a lower price than
its competitors. Its lower product prices are achieved through a cost-efficient business
model; an efficient online cost structure and a unique supply solution that eliminates
traditional layers of diamond wholesalers and brokers.
Signet has a strong position within the jewelry retail market results from its strong
market presence and divers brand. Its US division targets an under-served sector at the
upper end of the middle market, and its UK division targets the upper middle and end of
markets. The company achieves advantages on cost and quality through its contract
manufacturing strategy; supply polished loose diamonds to the contract manufacturing
partners. The company can be described as pursuing focus (low cost) and cost
leadership strategy as it targets a specific group of customers for each business
segments and aim at securing the lowest product.
Growth Strategies and Jewelry Retail Industry
Diversification and internationalization are the two major types of growth vectors, and
are alternative routes for expanding a company’s portfolio in terms of growth. Growth
also improves the effectiveness of the company. Larger companies have a number of
advantages over smaller companies such as economies of scale resulting from
marketing or production synergies. The company may pursue one or both types of
growth strategies or the company may prefer diversification over internationalization
except the firm’s objectives cannot be met through diversification. The reason is
because internationalization is much more difficult, risky and costly than
diversification. As for jewelry retail industry which is competitively fragmented and
moving toward consolidation, companies cannot rely only on a single product and
domestic market in order to stay in business and grow. For example, Zale’s growth is
limited compare to other three companies in our case studies. This is because Zale’s
market is mainly domestic- the United State.
Companies pursue diversification strategy is in responding to needs of markets or
consumers. As Tiffany & Co., it has adapted its business to market as it changed.
Tiffany’s core SBA (strategic business area) is jewelry, and it diversifies new product

87 lines within the core SBA such as timepieces, sterling silver goods (other than jewelry),
china, crystal, stationery, fragrances and personal accessories. Some companies such as
Zale, Blue Nile, and Signet specialize in one or two areas in which Tiffany active.
Zale’s and Blue Nile’s core SBA are jewelry, but they also diversifies into new SBAs;
product financing and product insurance which Tiffany is not active. Blue Nile
additionally diversifies into new SBAs such as product maintenance. Signet’s core
SBAs is jewelry and its new SBAs include associated services; Jewelry repair services.
Companies pursue internationalization in order to grow, increase their profitability and
search for new markets as well as response to needs of business. Tiffany has selectively
expanded its global distribution in order to grow and increase profit. In response to
needs of business, Tiffany established the Laurelton Diamonds, a rough diamond
trading and manufacturing company, in Belgium, Vietnam, Canada, Botswana and
South Africa to control the worldwide supply chain that cuts, polishes and supplies
finished to Tiffany. This is to secure supplies of diamonds and costs as well as to ensure
the integrity and high quality of its diamonds. As for Zale, it has expanded its business
by establishing distribution operation in North America mainly in Canada. Blue Nile is
different from other companies as its internationalization is connected to the availability
and accessibility of the Internet, accounting and logistic service in target country.
Currently, Blue Nile serves customers in over 40 countries in Americas, Western
Europe, and Asia-Pacific. For Signet Jewelers, the company mainly focuses on two
geographic segments- the US division and the UK division. Signet’s degree of
internationalization is higher than other companies. More than 70% of its total revenue
is generated from international market (the US division). Therefore, internationalization
is important for Signet to grow and increase profitability.
Companies’ Strategies and their Performance
This research aimed to investigate the link between a company’s strategy and its
performance. The strategies that companies pursue in this investigation are Porter’s
generic strategy and growth strategies: diversification and internationalization. Based on
this finding, there is a positive impact on generic strategies and companies performance.
But growth strategies that companies pursued do not have positive or negative impact
on companies’ performance. However, further studies are required.

88 The findings show that Blue Nile pursues “focus (differentiation”) and “cost leadership”
strategies tend to generate the best revenue growth and return on assets in average for a
period of time (2005-2009). In other words, Blue Nile generates better revenue growth
than other companies and excels at making a large profit from little investment. Tiffany,
who pursues mainly “differentiation strategy”, performs better than all other companies
in controlling costs and expenses associated with business operations, and Blue Nile is
next to Tiffany. Zale Corporation pursues mainly “focus strategy” tend to have
limitation on revenue growth, and under-performance on controlling cost and expense
and generating better profit from investment.
The level of diversification (within the Core SBA and new SBA) does not have positive
or negative impact on companies’ performance. Blue Nile has the highest number of
SBAs (Strategic Business Area) at 6 compare to other three companies who has 4 each.
Blue Nile has the best performance by measuring the revenue growth and return on
asset, but Tiffany generated the highest in operating profit margin. It can be considered
that the more diversify the company tend to have better performance in generating
profit, but not in controlling costs and expenses.
The findings also show that the level of internationalization does not have positive or
negative impact on companies’ performance. Blue Nile who has the lowest level of
internationalization performs better than Signet Jeweler (the highest level of
internationalization) in term of revenue growth and return on assets. Tiffany who is the
second highest level of internationalization performs the best in generating the operating
profit margin. Therefore, the highest internationalization does not prove that the
company will have the best performance in generating revenue growth, controlling
costs, and generating larger profit from little capital investment.
This study provides better understandings on the strategies that companies pursue and
their performance which should be useful for managers of multinationals. The study
provides evidence that company should differentiate its products with competitive price,
which in line with pursuing differentiation focus and cost leadership strategy. The
company should not rely only on a single product which is risky, and in order to grow
the company should internationalize.

89 If we are to enter into this industry, we will start with online retail business. Since,
information technology has facilitated every step of the online retail business, and
customer satisfaction has been the key factor of this success. In nowadays modern
society, a customer who is technological know-how needs high levels of quality, more
variety, and excellent service, lower cost and higher speed. In order to succeed in online
business, a company needs to adopt modern business structures and implement
strategies that help to meet basic customer needs. Such strategies are differentiation,
cost leadership and diversification. Additionally, a company needs to have trustable
suppliers, effective and efficient logistic and reliable accounting system. As an online
retailer, a company can allow the customer to choose products while using the idea of
virtual stores help the company to save costs and at the same time to deliver quality
products and services to customers.
90 5 CONCLUSIONS
This research investigates growth strategies of multinational companies to identify
whether there is a link between the companies performance and its pursued strategies.
The authors are interested in understanding, analyzing and defining the possible
connection and drawing conclusions on the most promising business and growth
strategies for a possible business of their own. The Jewelry Retail Industry is chosen
due to a personal proximity of one of the authors, but the findings are investigated on
their transferability to other industries and potential to be generalized.
As case companies four major competitors within the global jewelry retail industry have
been chosen: Blue Nile Inc., Signet Jewelers Ltd., Tiffany & Co. and Zale Corporation.
The research questions to answer the main research question of ‘Is there a connection
between a company’s perused growth strategy and its profitability?’ are the following:
1. What kind of business models and strategies do global jewelry retailers pursue?
2. What growth strategies do global jewelry retailers pursue?
3. Is there a link between a company’s strategy and its performance?
4. If there is a link are the findings transferrable to other industries or markets?
Before addressing the research questions in detail one by one, a theoretical background
is compiled to provide the necessary information for the case companies business and
growth strategies analysis and assessment. For the analysis and assessment of the case
companies’ business models and strategies, the authors review the concepts of strategic
management, Porter’s competitive analysis, including the Five Forces Model, the
Generic Strategies as well as the Value Chain and the Competitive Advantage. Other
concepts like e.g. the Blue Ocean are introduced only briefly to give a more
comprehensive context on the subject strategic management. For the analysis and
assessment of the case companies’ growth strategies, Ansoff’s concept of diversification
and also the concept of internationalization are reviewed.
Subsequent to the theoretical background the case companies are introduced and an
overview is given of their historical development, their business operations, product mix
and chosen financial figures.

91
With the case companies introduced, the first research question is addressed by relating
the case companies’ business models and strategies to the theory provided. The findings
are summarized for each case company.
Similar to the procedure before the case companies’ growth strategies are related to the
discussed theory and the findings summarized for each company to answer the second
research question.
The first findings are used to assess the profitability of the case companies and answer
the third question. The relationship between the case companies’ growth strategies and
their performance is evaluated by calculating the level of diversification and
internationalization for each company and compared with three key financial ratios:
revenue growth, operating profit margin, and return on assets. These ratios support the
determination of the profitability and performance of company from different angles.
Based on the findings some of the case companies pursue one of Porter’s generic
strategies and some pursue a combination of one or two. The companies diversify
(within the main SBA and into new SBAs) in response to the market and to adapt to
market change. The companies enter into international market to grow and increase
profit as well as to satisfy the needs of its business. The company, who pursues a
differentiation strategy and combines it with a cost leadership strategy, tends to have a
better performance and seems to be more profitable.
The research does not provide a concise answer to the main research question ‘Is there a
connection between a company’s perused growth strategy and its profitability?’ It
provides evidence that a higher level of diversification and internationalization does not
translate directly into a higher profitability. It also provides evidence that perused
growth strategies contribute to a company’s profitability as a strategic management
element in conjunction with other elements, like e.g. the business model.
Nevertheless, within a highly competitive market like the jewelry retail industry,
companies cannot rely only on a single product in order to sustain and grow business. It
is mandatory for the companies to diversify and internationalize as element of their
strategic business development.

92
For businesses not operating within the jewelry retail industry the research provides a
better understanding of the case companies’ implemented business and growth
strategies, their theoretical background and their performance, which is considered to be
useful and beneficial for their own business conducting. The main transferrable findings
are that a business cannot sustain its operations without growth through diversification
and internationalization, but growth strategies only do not assure profitability. They
have to be seen as one strategic element within the process.
Throughout the condition of the research the authors found the e-commerce business
model very appealing for a business of their own. Compared to the traditional brick-
and-mortar an e-commerce business appears to be easier to set up and operate with a
smaller budget. Regarding the products sold over the internet the authors believe that
online retailing and shopping overcame the obstacles of an alien, unreliable and
untrustworthy way of doing business and shopping and as the case companies show also
for high end and high value products. The authors will continue to investigate the e-
commerce business models and evaluate the possibilities for their own businesses.

93 REFERENCES Books & Publications Akan, O.; Allen, R. S.; Helms, M. M. & Spralls III, S. A. 2006. Critical tactics for implementing Porter’s generic strategies. Journal of Business Strategy 27:1, 43-53. Ansoff, H.I. 1987. Corporate Strategy. London: Penguin. First Published in 1965. Akpinar, M. 2008. Lecture note: Corporate Strategy, Strategic Management Course. Autumn Semester. JAMK University of Applied Sciences, School of Business and Services. Akpinar, M. 2009. Internationalization vs. Diversification: A Study on the Drivers of Growth Strategies. Journal of Global Business Issues 3:2, 1-6. Boddy, D. 2008. Management: An introduction. UK: Pearson Education Ltd. Carpenter, M.A. & Sanders, W.G. 2007. Strategic Management. A dynamic perspective. USA: Pearson Education Ltd. Chandler, A. 1962. Strategy and Structure. Chapters in the history of industrial enterprise. USA: Doubleday. Costume Jewelry, State of the Sector Report. 2003. Pearl 2 Project. Philippines. Deresky, H. 2005. International Management: Managing across borders and cultures. 5th edition. USA: Prentice Hall Published. David, F.R. 2009. Strategic Management. Concepts and cases. USA: Pearson Education Ltd. Geringer, J; Beamish, P; & Costa R. 1989. The Relationship of Diversification Strategy and Internationalization with MNE Performance. Strategic Management Journal. 101-104. Grundy, T. 2003. Gurus on Business Strategy. London: Thorogood Publishing. Hollensen, S. 2007. Global Marketing: A Decision-Oriented Approach. 4th edition. USA: Prentic Hall Published. Hunger, D. J. & Wheelen, T. L. 2009. Essentials of Strategic Management. 4th edition. USA: Pearson Education Inc. Hisrich, R. D. 2009. International Entrepreneurship: Starting, Developing, and Managing a Global Venture. USA: Sage Publications, Inc. Isaksaetre Lars et al. 2009. Report Paper: Blue Nile. Pacific Lutheran University. Kotler, P.; Wong, V.; Saunders, J. & Armstrong, G. 2005. Principles of Marketing. 4th European Edition. UK: Pearson Education Limited.

94 Lamb, R. 1984. Competitive Strategic Management. USA: Pearson Education Ltd. Lynch, R. 2003. Corporate Strategy. 3rd edition. England, UK. Macmillan, H. & Tampoe, M. 2000. Strategic Management. Oxford University Press. Otto, A. & Low, S. K. 1998. Resource-based theory and international growth strategies: an exploratory study. International Business Review 7:2, 163-184. Porter, M.E. 1985. Competitive advantage: creating and sustaining superior performance: with a new introduction. New York: The Free Press Porter, M.E. 1980. Competitive strategy: techniques for analyzing industries and competitors: with a new introduction. New York: The Free Press Pride, W.M.; Hughes, R.J. & Kapoor, J.R. 2008. Business. South-Western: Cengage Learning. Rugman, A.M. & Brain, C. 2003. Multinational enterprises are regional, not global. Multinational Business Review 11:1, 3-12. Saukkonen, J. 2009. Lecture note: Alternative Strategies for Globalization. International Management Course. Spring Semester. JAMK University of Applied Sciences. School of Business and Services. Saukkonen, J. 2008. Lecture Notes: Strategic Management. Autumn Semester. JAMK University of Applied Sciences. School of Business and Services. Saunders, M.; Philip, L. & Thornhill, A. 2007. Research Methods for Business Students. 4th Edition. UK: Pearson Education Limited. Walton, G. 2007. Theory, research, and practice in library management 3: diversification. Loughborough University 28: 6/7, 428-436. Walters, D & Lancaster, G. 2000. “Implementing value strategy through the value chain”, Management Decision 38:3, 160-178.
Electronic Sources About us. 1999-2010. Article on Blue Nile, Inc. website. Accessed on 13 November 2010. The website of Blue Nile. Http://www.bluenile.com/about-blue-nile. Ansoff, H.I. 1999-2010. Ansoff Matrix. Accessed on 16 November 2010. Http://www.quickmba.com/strategy/matrix/ansoff/ . Ansoff Analysis. Accessed on 23 November 2010. The website of University Essays. Http://university-essays.tripod.com/ansoff_analysis.html .

95 Annual Result Year ended. 2006. Article on Signet Jewelers Ltd. website. Accessed on 14 January 2011. The website of Signet Jewelers Ltd. Http://www.signetjewelers.com/sj/pages/financial/news-filings/press-releases?ref=120. Annual Report. 2006. Article on Tiffany & Co. website. Accessed on 14 January 2011. The website of Tiffany & Co. Http://www.shareholder.com/visitors/dynamicdoc/document.cfm?CompanyID=TIF&DocumentID=1597&PIN=&Page=1&Zoom=1x&Section=37624#37624. Annual Report 2006/2007. 2007. Article on Signet website. Accessed on 14 November 2010. The website of Signet Group plc. Http://www.hemscott.com/ir/sig/ar_2007/ar.jsp. Annual Report. 2007. Article on Tiffany & Co. website. Accessed on 14 January 2011. The website of Tiffany & Co. Http://www.shareholder.com/visitors/DynamicDoc/document.cfm?DocumentID=2216&CompanyID=TIF. Annual Report. 2007/2008. Article on Signet Jewelers Ltd. website. Accessed on 14 November 2010. The website of Signet Jewelers Ltd. Http://ar2008.signetgroupplc.com/home. Annual Report. 2008. Article on Zale Corporation website. Accessed on 26 November 2010. The website of Zale Corporation. Http://media.corporate-ir.net/media_files/irol/64/64546/ZaleAnnualReport2008.pdf. Annual Report. 2008. Article on Tiffany & Co. website. Accessed on 3 November 2010. The website of Tiffany & Co. Http://www.shareholder.com/visitors/dynamicdoc/document.cfm?documentid=2545&companyid=TIF&page=1&pin=&language=EN&resizethree=yes&scale=100&zid=. Annual Report. 2009. Article on Blue Nile, Inc. website. Accessed on 14 November 2010. The website of Blue Nile. Http://investor.bluenile.com/annuals.cfm. Annual Report. 2009-2010. Article on Tiffany & Co. website. Accessed on 3 November 2010. The website of Tiffany & Co. Http://investor.tiffany.com/releases.cfm. Annual Report. 2009/2010. Article on Signet Jewelers Ltd. website. Accessed on 14 November 2010. The website of Signet Jewelers Ltd. Http://www.signetjewelers.com/sj/uploads/dlibrary/documents/Form10K2010.pdf Annual Report. 2010. Article on Zale Corporation website. Accessed on 1 December 2010. The website of Zale Corporation. Http://phx.corporate-ir.net/External.File?item=UGFyZW50SUQ9NjgyNDR8Q2hpbGRJRD0tMXxUeXBlPTM=&t=1. Brohan, M. 2010. Tiffany has major e-commerce expansions plans for Europe. Internet Retailer 24 March 2010. Accessed on 3 November 2010. Http://www.internetretailer.com/2010/03/24/tiffany-has-major-e-commerce-expansion-plans-for-europe.
96 Bongiorno, L. 1996. How Tiffany’s took the tarnish off. Business Week 26 August 1996. Accessed on 1 November 2010. Http://www.businessweek.com/archives/1996/b3490117.arc.htm. Blue Nile Inc.: Key Ratios. 2010. Article on Blue Nile, Inc. website. Accessed on 14 November 2010. The website of Blue Nile. Http://investor.bluenile.com/financials-keyRatios.cfm. Blue Nile Ltd. Company Profile. 2010. Data monitor 2 September 2010. Accessed on 29 December 2010. Http://www.jamk.fi/english/library, Nelli Portal, Market Line. Blue Nile Launches Diamond Shopping App on the App Store. 2010. Article on Blue Nile website. Accessed on 14 November 2010. The website of Globe Newswire Inc. Http://www.globenewswire.com/newsroom/news.html?d=202356. Competitive Advantage. 1999-2010. Article on Quick MBA website. Accessed on 29 November 2010. The website of Quick MBA. Http://www.quickmba.com/strategy/competitive-advantage/. CS First Boston Cuts Tiffany & Co. Estimates. 2004. Article on Bloomberg Business Week. Accessed on 6 November 2010. The website of Business Week. Http://www.businessweek.com/investor/content/nov2004/pi20041111_8729_pi006.htm. Company Profile. 1999-2010. Article on Blue Nile Inc. website. Accessed on 13 November 2010. The website of Blue Nile. Http://investor.bluenile.com/index.cfm. Cook, J. 2002. Venture Capital: A few gems rise out of the dot-com slag heap. Seattle Post 31 May 2002. Accessed on 13 November 2010. Http://www.seattlepi.com/venture/72692_vc31.shtml. Competitive Pricing Advantage Derived From Virtual Inventory For Blue Nile (NILE); Pricing Adjustments Occurring Dynamically. 2010. Article on the Wall Street Transcript. Accessed on 14 November 2010. The website of Yahoo. Http://finance.yahoo.com/news/Competitive-Pricing-Advantage-twst-2879388721.html?x=0. Donahue, P. J. 2010. Tiffany’s Laurelton Subsidiary Expands. Diamonds.Net 5 January 2010. Accessed on 6 November 2010. Http://www.diamonds.net/news/NewsItem.aspx?ArticleID=30962. Dorbian, I. 2010. Tiffany & Co. aids ring-shopping with iPhone app. Direct Marketing News 17 June 2010. Accessed on 10 November 2010. Http://www.dmnews.com/tiffany-co-aids-ring-shopping-with-iphone-app/article/172706/. Eddins, C. 2010. Classic Jewelry_ Tiffany Key Pendant Necklace. Suite101.com 29 September 2010. Accessed on 4 November 2010. Http://www.suite101.com/content/classic-jewelry--tiffany-key-pendant-necklace-a289279.

97 Global Gem & Jewelry Market: Emerging Markets Driving Growth. 2009. Article on Koncept Analytics website. Accessed on 21 December 2010. Http://www.researchandmarkets.com/reportinfo.asp?report_id=998740&t=d&cat_id=. Group History. 2010. Article on Signet Jewelers Ltd. website. Accessed on 14 November 2010. The website of Signet Jewelers Ltd. Http://www.signetjewelers.com/sj/pages/aboutus/history. Hill, C.W.L. & Gareth, R.J. 2008. Strategic Management Theory: An Integrated Approach. 9th Edition. Mason: South Western Cengange Learning. Accessed on 2 November 2010. Http://books.google.fi/. History of Signet Group PLC. 2010. Article on Reference for Business website. Accessed on 14 November 2010. The website of Advameg, Inc. Http://www.referenceforbusiness.com/history2/13/Signet-Group-PLC.html. Ilagan, F. 2009. Surveying the Landscape: An Overview of the Jewelry Retail Industry. Article Base 25 August 2009. Accessed on 19 December 2010. Http://www.articlesbase.com/entrepreneurship-articles/surveying-the-landscape-an-overview-of-the-jewelry-retail-industry-1160914.html. Jewelry Retail. 2010. Article on First Research website. Accessed on 20 December 2010. Http://www.researchandmarkets.com/research/e5aa61/jewelry_retail. James Allen & Blue Nile. 2010. Article on Truth about Diamonds. 2010. Accessed on 13 November 2010. The website of Truth About Diamond. Http://www.truthaboutdiamonds.com/truth-about/james-allen-blue-nile/. Kowalski, M. J. 2010. CEO’s Annual Letter. Tiffany & Co. 23 March 2010. Accessed on 2 November 2010. Http://files.shareholder.com/downloads/TIF/1049367539x0x364277/d896f46a-fa1e-48e5-8f84-23532c143c81/Shareholder_letter.pdf. Krippendorff, K. 2010. Blue Nile sparkles. Fast Company 30 August 2010. Accessed on 14 November 2010. The website of Mansueto Ventures LLC. Http://www.fastcompany.com/1685867/blue-nile-sparkles. Krippendorf, K. 2010. Selling information, not diamonds. Fast Company 1 September 2010. Accessed on 14 November 2010. The website of Mansueto Ventures LLC. Http://www.fastcompany.com/1686315/selling-information-not-diamonds. Lucida Engagement Rings. 2010. Article on Engagement Ring Style website. Accessed on 6 November 2010. The website of Engagement Ring Style. Http://engagementringstyle.com/lucida-engagement-rings.php. Luxottica Group and Tiffany & Co. Sign Landmark 10-year Eyewear License Agreement. 2006. Article on Tiffany & Co. website. Accessed on 3 November 2010. The website of Tiffany & Co. Http://investor.tiffany.com/releasedetail.cfm?ReleaseID=220881.

98 Mamer, K. 2002. Red Hot Blue Nile. Luxury Magazine Spring 2002. Accessed on 13 November 2010. Http://www.bluenile.com/pressreleases/luxury_sp02.jsp. Porter, M.E. 2008. The Five Competitive Forces That Shape Strategy. Harvard Business Review January 2008. Accessed on 29 November 2010. Http://hbr.org/2008/01/the-five-competitive-forces-that-shape-strategy/ar/1. Porter's Five Forces. 1999-2010. Article on Quick MBA website. Accessed on 29 November 2010. The website of Quick MBA. Http://www.quickmba.com/strategy/porter.shtml. Porter's Generic Strategies. 1999-2010. Article on Quick MBA website. Accessed on 29 November 2010. The website of Quick MBA. Http://www.quickmba.com/strategy/generic.shtml. Quarterly Reports. 2010. Article on Blue Nile Inc. website. Accessed on 14 November 2010. The website of Blue Nile. Http://investor.bluenile.com/results.cfm. Rugman, A. Verbeke, A. 2005. Analysis of multinational strategic management: the selected papers of Alan M.Rugman and Alain Verbeke. Northampton: Edward Elgar Publishing, Inc. Accessed on November 29, 2010. Www.books.google.fi. Schon, M. 2006. Bejewelled by Tiffany 1837 – 1987. Yale University Press 1 September 2006. Accessed on 2 November 2010. Http://www.modernsilver.com/tiffany.htm. Stansell, C. M. 2010. Tiffany & Co. Company History. Accessed on 3 November 2010. Http://www.answers.com/topic/tiffany-co. Shareholder Information. 2010. Article on Tiffany & Co. Website. Accessed on 24 October 2010. The website of Tiffany & Co. Http://investor.tiffany.com/overview.cfm. Shuster, G. W. & Bates, R. 2007. Zale Sells Bailey Banks & Biddle to Finlay. JCK the Industry Authority 1 November 2007. Accessed on 2 December 2010. Http://www.jckonline.com/article/286858-Zale_Sells_Bailey_Banks_Biddle_to_Finlay.php. Salamine, D. E. 2010. Zale Corporation Company History. Accessed on 10 November 2010. Http://www.answers.com/topic/zale-corporation. Signet Jewelers Limited. 2010. Article on Hoover’s Company Profile website. Accessed on 14 November 2010. The website of Answers.com. Http://www.answers.com/topic/signet-group-plc-adr?cat=biz-fin. Signet Jewelers Company Profile. 2009. Data monitor 1 September 2009. Accessed on 16 October 2010. Http://www.jamk.fi/english/library, Nelli Portal, Market Line. Signet Jewelers Press releases. 2004-2010. Article on Signet Jewelers Ltd. Accessed on 14 November 2010. The website of Signet Jewelers Ltd. Http://www.signetjewelers.com/sj/pages/media-centre/news-filings-media/press-releases-media.

99 Strategy and objectives. 2010. Article on Signet Jewelers Ltd. website. Accessed on 14 November 2010. The website of Signet Jewelers Ltd. Http://www.signetjewelers.com/sj/pages/operations/group-strategy. The Value Chain. 2002-2010. Article on Net MBA Business Knowledge Center. The website of Net MBA. Accessed on 29 November 2010. Http://www.netmba.com/strategy/value-chain/. The Swatch Group Ltd. and Tiffany & Co. Announce Strategic Alliance. 2007. Article on Tiffany & Co. website. Accessed on 3 November 2010. The website of Tiffany & C0. Http://investor.tiffany.com/releasedetail.cfm?ReleaseID=279373. Tiffany & Co. Company Profile. 2010. Data monitor 27 May 2010. Accessed on 6 November 2010. Http://www.jamk.fi/english/library, Nelli Portal, Market Line. Tiffany & Co. History. 2010. Article on Tiffany & Co. website. Accessed on 24 October 2010. The website of Tiffany & Co. Www.tiffany.com. Tiffany & Co. Jewelry History. 2010. Article on Tiffany Guide Website. Accessed on 2 November 2010. The website of Tiffany Guide. Http://www.tiffanyguide.com/Knowledge/tiffany-co-jewelry-history.htm. Tiffany & Co. Launches New Website in China. 2006. Article on Tiffany & Co. website. Accessed on 10 November 2010. The website of Tiffany & Co. Http://investor.tiffany.com/releasedetail.cfm?ReleaseID=194319. Tiffany & Co. 2010. Article on NovelGuide.com. Accessed on 2 November 2010. The website of Novel Guide. Http://www.novelguide.com/a/discover/cps_03/cps_03_00469.htm. Tiffany & Co. Opens a Store in Chengdu, China. 2008. Article on Tiffany & Co. website. Accessed on 9 November 2010. The website of Tiffany & Co. Http://investor.tiffany.com/releasedetail.cfm?ReleaseID=299920. Tiffany Designs the Ultimate Key to Fashion. 2009. Article on Tiffany & Co. website. Accessed on 10 November 2010. Http://press.tiffany.com/News/NewsItem.aspx?ID=3. The Zale Corporation Story. 2010. Article on Zale Corporation Website. Accessed on 12 November 2010. Http://www.zalecorp.com/history.aspx. The Prestige Diamond Collection at Zales.com Help Grooms Find “The One”. 2009. Article on Business Wire website. Accessed on 14 November 2010. The website of iSstock Analyst. Http://www.istockanalyst.com/article/viewiStockNews/articleid/3401163. Thomas, J. 2010. Diversification Strategy. Accessed on 10 November 2010. Http://www.enotes.com/management-encyclopedia/diversification-strategy. What is Porter's 5 Forces analysis? 2002-2010. Article on Papers for you website. Accessed on 29 November 2010. The website of Papers for you. http://www.coursework4you.co.uk/essays-and-dissertations/porter-5-forces.php.

100 Zale Corporation Company Information. 2008. Article on the New York Times website. Accessed on 12 November 2010. The website of the New York Times. Http://topics.nytimes.com/top/news/business/companies/zale-corporation/index.html. Zales Outlet. 2010. Article on Zale Corporation Website. Accessed on 14 November 2010. The website of Zale Corporation. Http://www.zalecorp.com/ZalesOutlet.aspx. Zales Credit Card.2010. Zales the Diamond Store website. Accessed on November 14 2010. The website of Zale Corporation. Http://www.zales.com/card/index.jsp. Zale Corporation Company Profile. 2010. Data monitor 23 April 2010. Accessed on 16 November 2010. Http://www.jamk.fi/english/library, Nelli Portal, Market Line. Zale Corporation Partners with WeddingChannel.com To Offer Wedding Planning Services and Bridal. 2000. Article on Business Wire website. Accessed on 12 November 2010. The website of All Business. Http://www.allbusiness.com/manufacturing/miscellaneous-mfg-jewelry-silverware/6373392-1.html. Zale Company Information. 2009. Article on Zale Corporation website. Accessed on 12 November 2010. The website of Zale Corporation. Http://phx.corporate-ir.net/phoenix.zhtml?c=64546&p=irol-homeprofile. Zale Corporation Engages in a Multiplatform Marketing Partnership with The Knot, Inc. 2005. Article on Business Wire website. Accessed on 16 November 2010. The website of All Business. Http://www.allbusiness.com/marketing-advertising/marketing-techniques/5055561-1.html. Zale Corporation Reports EPS Loss of $0.42 for the Third Quarter of Fiscal 2008. 2008. Article on Business Wire website. Accessed on 14 November 2010. The website of Find Articles. Http://findarticles.com/p/articles/mi_m0EIN/is_2008_May_22/ai_n25450357/.

101 APPENDICES Appendix 1. Companies’ Key Financials
Tiffany Key Financials ($)
in thousands 2005 2006 2007 2008 2009 Sales revenues 2 309 245 2 552 414 2 927 751 2 848 859 2 709 704EBIT 270 593 294 615 369 999 232 155 265 676Net profit 261 396 272 897 323 478 220 022 264 823Total assets 2 817 344 2 904 552 3 000 904 3 102 283 3 488 360
Source: Annual report 2009-2010
Zale Corporation Key Financials ($)
in thousands 2005 2006 2007 2008 2009 Sales revenues 2 062 196 2 153 955 2 152 785 2 138 041 1 779 744EBIT 155 707 70 840 63 155 -1 692 -242 518Net profit 106 225 48 054 57 486 631 -189 503Total assets 1 371 878 1 449 639 1 600 144 1 415 260 1 230 972
Source: Annual report 2009
Blue Nile Key Financials ($)
in thousands 2005 2006 2007 2008 2009 Sales revenues 203 169 251 587 319 264 295 329 302 134EBIT 20 553 19 980 26 587 17 856 19 678Net profit 13 153 13 064 17 459 11 630 12 800Total assets 138 005 122 106 160 586 89 665 130 415
Source: Annual report 2008 & 2009
Signet Jewelers Key Financials ($)
$ millions 2005 2006 2007 2008 2009 Sales revenues 3 004,8 3 154,1 3 559,2 3 665,3 3 344,3EBIT 379,5 354,3 387,3 336,2 -326,5Net profit 255,8 238,0 252,7 219,8 -393,7Total assets 2 873,5 2 863,1 3 508,2 3 599,4 2 953,9
Source: Annual report 2008 & 2009

102 Appendix 2. Companies’ Average Key Financial Ratios
Calculation of average value Revenue Growth
Revenue Growth 2005 2006 2007 2008 2009 Avarage RG 2005-2009Tiffany 8,5 10,5 14,7 -2,7 -4,9 5,22Zale -10,5 4,5 -0,1 -0,7 -16,8 -4,72Blue Nile 20,1 23,8 26,9 -7,5 2,3 13,12Signet 4,6 5,0 12,8 3,0 -8,8 3,32
Source: Adapted from company's annual reports
Calculation of average value Operating Profit Margin
Operating Profit Margin 2005 2006 2007 2008 2009 Avarage OPM 2005-2009Tiffany 11,7 11,5 12,6 8,2 9,8 10,76Zale 7,6 3,3 2,9 -0,1 -13,6 0,02Blue Nile 10,1 7,9 8,3 6,1 6,5 7,78Signet 12,3 11,2 10,9 9,2 -9,8 6,76
Source: Adapted from company's annual reports
Calculation of average value Return On Assets
Return On Assets 2005 2006 2007 2008 2009 Avarage ROA 2005 -2009Tiffany 9,3 9,4 10,8 7,1 7,6 8,84Zale 7,7 3,3 3,6 0,0 -15,4 -0,15Blue Nile 9,5 10,7 10,9 13,0 9,8 10,78Signet 8,9 8,3 7,2 6,1 -13,3 3,44
Source: Adapted from company's annual reports

103 Appendix 3. Companies Strategic Business Areas
Companies’ Diversification (Main and related SBA’s) 2005-2009
Number of SBA's 2005 2006 2007 2008 2009
Tiffany 4 4 4 4 4 Zale 4 4 4 4 4 Blue Nile 6 6 6 6 6 Signet 4 4 4 4 4
Source: Adapted from companies' annual reports

104
Appendix 4. Companies’ Diversification 2005-2009 (Main SBA’s)
Main SBA's Loose gemstones Jewellry Accesoires Fragrances Total 2009
Tiffany 1 1 1 1 4Zale 0 1 1 0 2
Blue Nile 1 1 1 0 3
Signet 1 1 1 0 3
Main SBA's Loose gemstones Jewellry Accesoires Fragrances Total 2008
Tiffany 1 1 1 1 4Zale 0 1 1 0 2
Blue Nile 1 1 1 0 3
Signet 1 1 1 0 3
Main SBA's Loose gemstones Jewellry Accesoires Fragrances Total 2007
Tiffany 1 1 1 1 4Zale 0 1 1 0 2
Blue Nile 1 1 1 0 3
Signet 1 1 1 0 3
Main SBA's Loose gemstones Jewellry Accesoires Fragrances Total 2006
Tiffany 1 1 1 1 4Zale 0 1 1 0 2
Blue Nile 1 1 1 0 3
Signet 1 1 1 0 3
Main SBA's Loose gemstones Jewellry Accesoires Fragrances Total 2005Tiffany 1 1 1 1 4Zale 0 1 1 0 2Blue Nile 1 1 1 0 3Signet 1 1 1 0 3
Source: Adapted from companies' annual reports

105 Appendix 5. Companies’ Foreign Sales Percentage
Tiffany & Co.
$ (in thousands)
Sales Revenue 2005 2006 2007 2008 2009 Domestic 1 378 166 1 510 833 1 645 712 1 458 598 1 283 869 Foreign 934 626 1 049 901 1 293 059 1 401 399 1 425 835 Total 2 312 792 2 560 734 2 938 771 2 859 997 2 709 704 Foreign Sales % 40,4 % 41,0 % 44,0 % 49,0 % 52,6 %
Source: Adapted from company's annual reports 2007, 2008, 2009-10
Zale Corporation
$ (in thousands)
Sales Revenue 2005 2006 2007 2008 2009 Domestic 1 857 296 1 916 655 1 877 985 1 816 141 1 523 044 Foreign 204 900 237 300 274 800 321 900 256 700 Total 2 062 196 2 153 955 2 152 785 2 138 041 1 779 744 Foreign Sales % 9,9 % 11,0 % 12,8 % 15,1 % 14,4 %
Source: Adapted from company's annual reports 2009
Blue Nile Inc.
$ (in thousands)
Sales Revenue 2005 2006 2007 2008 2009 Domestic 199 869 243 270 302 230 267 670 268 898 Foreign 3 300 8 317 17 034 27 659 33 236 Total 203 169 251 587 319 264 295 329 302 134 Foreign Sales % 1,6 % 3,3 % 5,3 % 9,4 % 11,0 %
Source: Adapted from company's annual reports 2005, 2008, 2009
Signet Jewelers Ltd.
$ (in thousands)
Sales Revenue 2005 2006 2007 2008 2009 Domestic 964 630 845 300 907 100 959 600 808 200 Foreign 2 104 820 2 308 800 2 652 100 2 705 700 2 536 100 Total 3 069 450 3 154 100 3 559 200 3 665 300 3 344 300 Foreign Sales % 68,6 % 73,2 % 74,5 % 73,8 % 75,8 %
Source: Adapted from company's annual reports 2007, 2008, 2009, 2010