Human resource Challenges for Public...
51
HUMAN RESOURCE CHALLENGES FOR PUBLIC LIBRARIES Survey Results Rachel K. Fischer BADM 598: Capstone Experience Master of Science in Management Minot State University December 5, 2016 Advisor: Dr. Gary J. Ross
Transcript of Human resource Challenges for Public...
HUMAN RESOURCE CHALLENGES FOR PUBLIC LIBRARIES
Survey Results
Rachel K. Fischer
BADM 598: Capstone Experience Master of Science in Management Minot State University December 5, 2016 Advisor: Dr. Gary J. Ross

R. K. Fischer
2
Human Resource Challenges for Public Libraries
ABSTRACT: This essay presents the results of a survey about human resource
management in public libraries. The survey was conducted in October, 2016, via the
Internet. The participants included librarians, employed by public libraries in the United
States, with management experience related to at least one function of human resource
management. The majority of the participants responded that human resource
management was challenging to some degree. While the majority were able to solve their
human resource management problems successfully, the majority of the respondents
believed that the human resource curriculum for library science programs was inadequate.

R. K. Fischer
3
Human Resource Challenges for Public Libraries
Introduction
In 2015, this researcher published the results of a survey on rural and small town
library management challenges in Public Library Quarterly that she conducted for the
Management Principals and Practice course for the Master of Science in Management
degree at Minot State University. Of the total number of responses to this survey, 59% of
the librarians reported that staffing was their greatest challenge. Although only 25%
reported that funding was the greatest challenge, 68% of the respondents said that their
library was underfunded (Fischer, 2015). Given these results, further research into the
subject of human resource management in public libraries and the correlation with
funding, population size, and other independent variables appeared to be warranted.
This researcher conducted a second survey to investigate the results of the previous
survey further as a project for the Capstone Experience course at Minot State University to
complete the Master of Science in Management degree. The scope of this research included
librarians who worked in libraries throughout the United States, with service populations
of all sizes. Due to the time-period allotted for the study and the lack of funding, the
researcher recruited participants to participate via e-mail discussion groups and online
message boards. Librarians were not contacted personally to ask them to participate in the
survey. The survey questions were located on a website maintained by
https://www.surveygizmo.com. All participants remained anonymous. No personal
information was collected from the survey participants in order to reduce the risk of
answering the questions dishonestly.

R. K. Fischer
4
The goal of this research was to study all functions of human resource management.
This included the subjects of recruiting, hiring, training, development, performance
appraisal, compensation and benefits, and employee law. The research examined if certain
functions of human resource management were more challenging than others, and if there
was a correlation among the answers and the independent variables, including service
population size, budget size, and salary amounts.
The research included qualitative research to further the understanding of human
resource problems that needed to be solved by allowing librarians to write about their
personal experiences and how successful their solutions were. Given the overall problem
with funding, this researcher hypothesized that some functions of human resource
management would be more challenging for librarians throughout the United States than
others. However, human resource functions related to staffing and recruiting would be the
most challenging for libraries with funding problems and areas of low population.
Literature Review
A review of literature on human resource management in public libraries published
in the last ten years, found that research related to this topic within public libraries was
minimal. Existing reports mostly cover issues related to staffing and budgetary constraints.
Given the connection between the budget and human resource management one can
understand that there could be a correlation between budget cuts and human resource
challenges.
While human resource management can be difficult for any library that has had to
deal with budget cuts, the libraries in smaller towns have had the most difficult time. Many
small and rural towns have experienced a declining population, which has caused a loss of

R. K. Fischer
5
tax revenue (Holt, 2009; Lee, 2009). A loss of tax revenue can mean budget cuts for the
libraries, and budget cuts can lead to lower salaries, hiring freezes, and cutting hours.
Lower salaries can make it difficult to recruit librarians with a Master degree in Library
Science (Walters & Byers, 2007). A 2007 survey by Flatley and Wyman of libraries in towns
with a population of 2500 or less found that only 14% of the respondents had a Master
Degree in Library Science. Because the pay is so low, rural libraries had to rely heavily on
volunteers for support (Flatley & Wyman, 2009). A 2009 survey by Lee found higher
numbers of librarians with a Master Degree in Library Science in the small towns of
Southwest Kansas. According to this survey, 61% of the libraries in this region did not
employ a professional librarian (Lee, 2009). So that would mean that about 39% of these
libraries employed a professional librarian, such as someone with a master degree in
library science.
The survey results published by Fischer (2015), included a library service
population of up to 50,000. Only 40.79% of the libraries surveyed did not employ librarians
with a Master degree in Library Science. Even though this survey included larger
populations, and a wider cross section of the country, 69.44% found it difficult to hire the
right staff for the position. Likewise, 61% responded that the library lacked the necessary
number of staff at the time of the survey. Some stated that managing the library was
difficult, because one librarian had too many responsibilities. Given that the majority of
these librarians lacked the necessary funds to hire the proper number of staff for their
libraries, 59.21% of the respondents found staffing to be the greatest managerial challenge
(Fischer, 2015). Despite these librarians’ challenges, this survey demonstrated that there

R. K. Fischer
6
had been some improvements in staffing conditions when examining a more diverse
sample, and that the respondents demonstrated a desire to succeed.
Library Journal’s annual budget survey of prior years has provided a glimpse into
certain human resource trends as the economy’s fluctuations affected public libraries.
Kelley discussed the 2011 annual budget survey in Library Journal. Budget and staff cuts
were high that year. For example, 72% of the respondents reported budget cuts and 43% of
the respondents reported staff cuts. While many of the respondents were optimistic that
the future would improve, librarians working in towns with a population less than 50,000
were more pessimistic of the future. The majority of the staff cuts were handled as hiring
freezes, with a response rate of 73%. Other techniques included early retirement, laying off
part-time staff, self-checkouts, recruiting volunteers, outsourcing the management and
cross-training (Kelley, 2011). The article also touched on the power of library districts for
stronger financial support, and how increased political advocacy for libraries can help to
protect the library from budget and staff cuts.
Peet (2015) reported on the 2015 annual budget survey in Library Journal, which
suggested librarians’ optimism of an improved future. While 73% of the librarians reported
an increased operating budget, 81% reported an increased salary and personnel budgets.
Although more than half of the respondents experienced no change in staff, the libraries
from cities of the largest population sizes increased staff, while cities of smaller population
sizes continued to report a decrease in staff size. Even though there appears to be a
correlation with population size and the ability to increase staff, many urban libraries
continued to report cuts in funding for staff, outreach, and hours.

R. K. Fischer
7
Peet’s (2016) report on the 2016 annual budget survey in Library Journal suggested
that the economic conditions for many of America’s public libraries had improved for a
subsequent year. Libraries reported moderate budget gains, which affected the salary and
personnel budgets. This meant that many libraries increased salary and personnel.
However, the results of the survey suggested a relationship between the size of the library
and gains in budget. The smallest libraries reported the smallest gains, and some continued
to struggle to meet the needs of their community.
The Public Library Association Recruitment of Public Librarians Committee (2006)
published the results of a survey on the subjects of recruiting, retention, and retirement.
The results of this survey found several human resource challenges. New graduates had to
make certain compromises when accepting a job. According to the survey, 35% accepted a
lower salary than desired, others responded that they had relocated, accepted part-time
jobs, or accepted a job without health benefits. While 43% of the respondents stated that
the libraries hired more part-time employees than full-time, 28% reported that the
libraries hired staff without a master degree in library science. A small number of the
respondents found it difficult to hire high-quality staff, especially children’s librarians and
foreign language speakers. Since this survey took place before the financial crisis of 2008,
36% expected staffing levels to increase, while 49% expected staffing levels to remain the
same. The biggest disappointments among these respondents included low wages and
compensation, poor supervisors, and bureaucracy. The article recommended several ways
to improve recruiting including, paid internships, scholarships for minorities, and job
shadowing to promote the career. The problems related to human resource functions can
be attributed to budgetary issues.

R. K. Fischer
8
Learning from other libraries’ successes and failures is the key to overcoming
challenges when managing libraries during difficult economic times. Riggs and Timmins
(2015) recently published the results of a staffing exchange experiment that began in 2008
at the Johnson County Library System in Kansas. Due to a hiring freeze and reduction in
circulation staff, the librarians needed to devise a way to efficiently staff the circulation
desks of multiple sites while stretching the budget further. The librarians experimented
with cross-training the circulation staff at multiple branches. In doing so, the staff was able
to help other locations on short notice. They were also able to redeploy staff to locations
based on circulation statistics. The librarians thought that this experiment improved the
library system’s efficiency while saving money.
The research included in the literature review suggested a relationship between
budgetary issues and human resource management challenges. The most studied human
resource challenges were related to staffing. More research is needed to understand how to
overcome human resource challenges so that libraries can manage staff in an efficient
manner.
Methodology
The survey for this study on human resource challenges for public libraries was
designed for management-level librarians who have had prior experience with human
resource management in a public library. The results of this researcher’s previous survey
on small and rural public libraries influenced the decisions regarding the questions to
include in the present survey. In order to improve the quality of the survey, this researcher
conducted a pilot study by asking several librarians who completed the previous survey for
feedback. The final survey was created as an online survey using the SurveyGizmo website.

R. K. Fischer
9
This survey did not collect personal information. All respondents remained
anonymous in order to reduce the risk associated with answering sensitive questions
honestly. The survey consisted of multiple-choice, Likert rating scales, and qualitative
questions. The questions collected demographic information related to the respondent’s
job and human resource-related role, as well as library statistics. The questions about
human resource management focused on rating how challenging human resource functions
have been for the library. The qualitative section consisted of questions about solutions
that the librarians have tried in order to overcome challenges. Then the respondents were
asked to rate how successful these solutions were. The text of the entire survey is in
Appendix A.
In order to recruit librarians with management experience in public libraries to
respond to the survey, this researcher posted a message to existing e-mail discussion
groups and online message boards. She also emailed national and state library associations
to ask if someone would be willing to send the e-mails to their discussion groups without
the researcher being a current member. This researcher sent the message to the following
discussion groups: the LLAMA Middle Managers Discussion List and the LLAMA Library
Administration Discussion List of the Library Leadership and Management Association
(LLAMA) of the American Library Association, and the American Library Association
LinkedIn Message Board. The following library associations confirmed that they posted a
message about the survey to their email discussion lists or newsletters: The Public Library
Association, the Illinois Library Association, the Missouri Library Association, the North
Carolina Library Association, the Texas Library Association, the Virginia Library

R. K. Fischer
10
Association, and the West Virginia Library Association. The following text was used to
recruit librarians to participate in the survey:
Subject Line: Recruiting Librarians for a Survey on Human Resource Management of Public Libraries in the United States Body of the Message: You are invited to participate in a study about human resource managerial challenges for public libraries being conducted by Rachel K. Fischer, MLIS, for completing the requirement of a capstone course for the degree of MS in Management at Minot State University. The results of my prior survey on managerial challenges for small town and rural public libraries have already been published in Public Library Quarterly (http://dx.doi.org/10.1080/01616846.2015.1106899). Participants responding to this survey should be librarians who are currently employed by a public library, and have knowledge of human resource practices at their places of employment. Human resource functions include but are not limited to recruiting and hiring staff, training and development, designing performance appraisal systems, compensation and benefits, and human resource law. The purpose of this research is to identify the aspects of human resource functions that are the most challenging for public libraries and how librarians have overcome these challenges. This study hopes to shed light on how to improve the management of public libraries. The survey will take about 15 minutes to complete. All respondents will remain anonymous. Thank you for your participation. The survey is located at: http://www.surveygizmo.com/s3/2850917/Human-Resources-Challenges-for-Public-Libraries. Thanks, Rachel K. Fischer, MLIS
The survey remained open for responses for fifteen days during the month of
October, 2016. Survey responses that included an insufficient number of answers were
removed from the results. Insufficient surveys consisted of the records of surveys in which
a respondent declared that he or she would participate by answering the first question, but
did not answer any other questions. Many partial surveys were still included in the results.
The surveygizmo.com website tabulated the quantity of the answers and calculated
percentages automatically. However, this researcher reorganized and cleaned the data in
Excel to make the answers more precise.
In order to analyze a correlation between multiple variables, multiple regression
analysis was conducted using Excel. This included the comparison of independent
variables, such as budget, salary, and service population to dependent variables concerning

R. K. Fischer
11
human resource management situations and challenges. In order to create regression
equations from this survey data, Likert scale responses, yes/no answers, and numerical
ranges had to be converted to a single whole number which corresponded to the possibility
of a positive correlation. For example, this researcher informally hypothesized that lower
service populations and lower budgets correlated with human resource management
challenges. So the answer for “most challenging” was given the low number of one to match
the lower values of the independent variables. The tables reporting the results included
multiple r (correlation coefficient), r square (coefficient of determination), standard error
(standard deviation of the sample), and the p-value. The correlation coefficient depicts the
strength of the association between the independent and dependent variables. The
coefficient of determination depicts how well the data fits along the slope of the line of the
regression equation. The standard error is a measurement of the variation of the data. The
p-value is the probability of the results occurring when the independent variables have no
effect on the dependent variables due to a random sampling error. A .05 significance level
has been chosen for the p-value. If a p-value proves to be larger than 0.05, the sample size
may need to be expanded to find a correlation between the independent and dependent
variables. No formal hypotheses were made. Therefore, this is an exploratory study.
This researcher analyzed the qualitative questions by assigning a code to the
respondents’ answers which corresponded to a theme. In situations when an individual
responded with more than one idea, multiple codes were assigned to the answer. This
researcher analyzed the list of codes for the frequency of each answer and the percentage
of the answers in relation to the entire list of answers. These answers provided insight into
human resource-related situations that may be on the respondents’ mind. Qualitative

R. K. Fischer
12
questions provided many more details than would be possible with multiple-choice
answers. By allowing librarians to write about their opinions, this researcher gained
information that provided new insight into situations with which librarians struggled. This
information could lead to further research on these subjects.
Results: Demographics
The survey remained open for a total of 15 days. A total of 140 librarians responded
to the survey. Eighty-seven individuals completed the majority of the questions in the
survey. Fifty-three additional individuals answered enough of the survey to be included in
the final statistical analysis of specific questions, but did not answer all of the questions. All
of the respondents except for one, were current employees of a public library. One retired
librarian responded to the survey whose response was significant enough to be included.
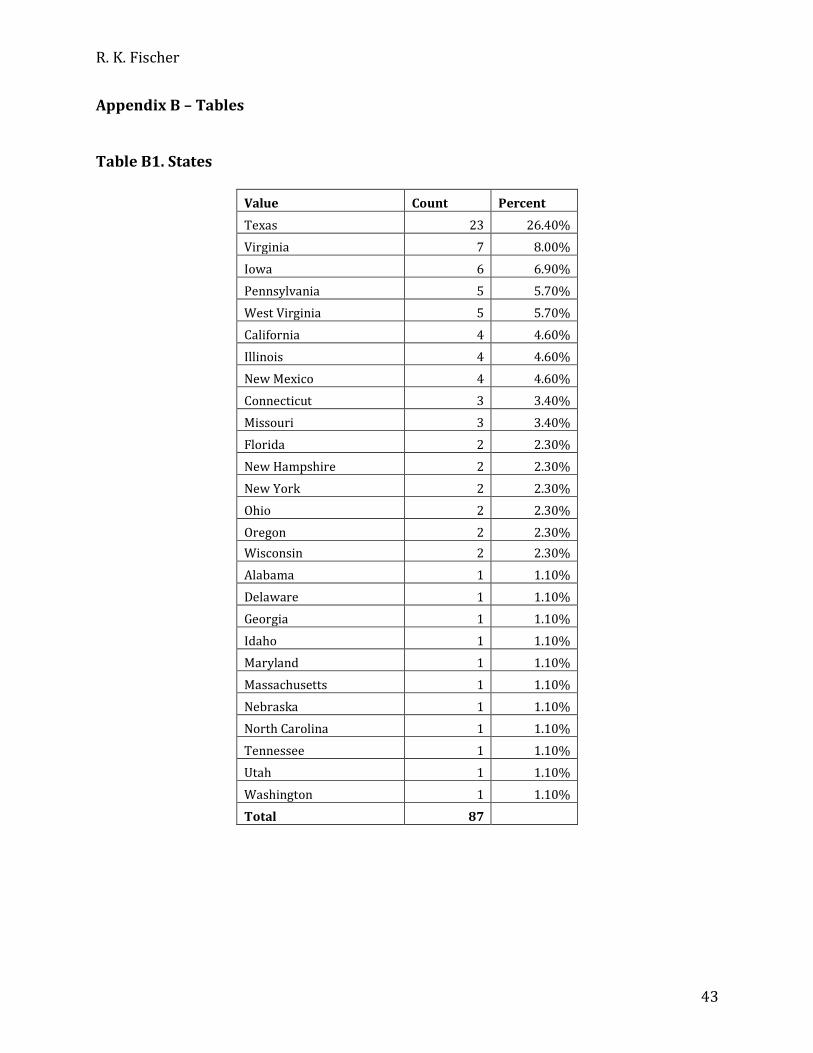
The eighty-seven individuals who provided a response about their locations came from a
total of 27 different states in the United States, which included all regions of the country. As
seen in Appendix B, Table A1, States, the largest percentage from a single state came from
Texas, at 26.4%, with Virginia coming in second at 8%. The location was not a required
question due to the importance of anonymity.
Of the eighty-eight individuals who responded to the question on educational level,
86.4% had already completed a Master degree in Library Science (MLS, MLIS, or MIS).
However, 2.3% were currently pursuing a degree, and 11.4% had not completed or started
the degree yet. Of the 140 individuals who responded to a question about their job titles,
46.4% of the respondents were library directors. While only 10.7% of the respondents
were assistant library directors, 16.4% of the respondents were branch managers or had a

R. K. Fischer
13
similar library manager titles. As shown in Table 1, Job Title of the Participants, all but 7.1%
of the respondents had a supervisory or managerial job title.
Table 1. Job Title of the Participants
Job Title Count Percent
Library Director 65 46.4%
Assistant Library Director 15 10.7%
Branch Manager or Library Manager 23 16.4%
Department Manager 16 11.4%
Assistant Library Manager 3 2.1%
Department or Library Supervisor 8 5.7%
Librarian 10 7.1%
Total 140
Of the 140 who responded to the survey, 95.6% responded that their job
responsibilities included training and development activities. Likewise, 90.4% responded
that their job responsibilities included recruiting and hiring activities. Less commonly,
42.6% responded that their job responsibilities included compensation and benefits
decisions, and 55.1% responded that their job responsibilities included decision making
related to human resource related strategic plans and policies. These functions are
commonly performed by human resource departments for the town. This question allowed
the respondents to select more than one answer.
Eighty-eight individuals responded to a question about the size of the library’s
service population. As shown in Table 2, Service Populations of the Respondent’s Public
Libraries, 46.5% of the libraries had a service population of under 50,000, while 53.4% had
a service population above 50,000. More than a quarter of the libraries had a service
population above 100,000. Of the eighty-eight who responded to this question, 46.6% of
the library systems operated only one location, while 53.4% operated more than one

R. K. Fischer
14
branch. The librarians who worked for a library system with more than one branch
responded with numbers of branches that ranged between two and thirty-three, with an
average of eight branches.
Table 2. Service Populations of the Respondent’s Public Libraries
Service Population Count Percent
Under 2,500 3 3.4%
2,500 - 4,999 4 4.5%
5,000 - 9,999 5 5.7%
10,000 - 19,999 9 10.2%
20,000 - 29,999 12 13.6%
30,000 - 39,999 5 5.0%
40,000 - 49,999 3 3.4%
50,000 - 99,999 19 21.6%
100,000-499,999 20 22.0%
500,000 - 999,999 4 4.5%
1 million or more 4 4.5%
Total 88
After comparing the results of the question about the number of branches to the size
of a service population, one can see that a matching percentage exists at the point when a
service population is large enough for more than one branch. As a population needs to be a
certain size before a library has multiple branches, it will have a need for a specific amount
of funding. Eighty-four librarians answered the question about their library’s budget. As
shown in Table 3, Budget of the Respondent’s Public Libraries, the $1 million mark matched
the split of the percentages in a similar manner as the service population and branches.
While 47.6% of the libraries had a total budget of under $1 million dollars, 52.4% had a
budget above $1 million dollars. However, the largest percentage of these public libraries

R. K. Fischer
15
had a budget of more than $2 million dollars, at 36.9%. The second largest percentage was
actually the $250,000-$499,999 range, at 20.2%.
Table 3. Budget of the Respondent’s Public Libraries
Total Budget Count Percent
$0-24,999 3 3.6%
$25,000-49,999 1 1.2%
$50,000-74,999 5 6%
$75,000-99,999 1 1.2%
$100,000-249,999 6 7.1%
$250,000-499,999 17 20.2%
$500,000-999,999 7 8.3%
$1 million – 2 million 13 15.5%
More than $2 million 31 36.9%
Total 84
Additionally, the librarians were questioned about the number of their full and part-
time staff. Eighty-four of the respondents answered these questions. The librarians
responded that the libraries had a range of 1 to 500 full-time staff, with an average of 50
full-time staff and a median of 12 full-time staff. The libraries had a range of 0 to 350 part-
time staff, with an average of 34.6 part-time staff and a median of 14 part-time staff. Of
these total number staff, the number of managerial level staff ranged from 1 to 75, with an
average of 8.4 managerial level staff and a mean of 5 managerial level staff. Of the total
number of staff, those with a master degree in library science ranged from 0 to 200, with an
average of 14.7 staff with a master degree in library science and a median of 5 staff with a
master degree in library science.
The survey included questions that asked about the starting hourly salary of
paraprofessionals, or library support staff, the starting salary of librarians, and the median
salary of librarians. Some errors in responses had to be removed, and yearly salaries had to

R. K. Fischer
16
be corrected for the matching hourly amount. The data from 76 responses was tabulated
for the statistics of the paraprofessional salary. This ranged from $7.50 to $22.00, with an
average of $12.02 and a median of $10.98. The data from 72 responses was tabulated for
the statistics of the librarian salary. This ranged from $8.17 to $35, with an average of
$19.75 and a median of $20.13. Only 62 responses were tabulated for the statistics of the
median librarian salary. These answers ranged from $8.17 to $50, with an average of
$22.74 and a median of $23.50. The large range in salary can be attributed to the cost of
living difference and budget for these cities.
Ninety individuals responded to a question about whether or not the library had a
dedicated human resource staff member, separate from the municipality’s human resource
department. Only 30% had a dedicated human resource staff member who worked for the
library, while 70% did not. As seen in Table 4, Primary Human Resource Decision Maker, the
survey included a question about the primary decision maker of human resource policy.
The largest percentage, 41.1%, responded that the primary decision maker was the town’s
human resource manager. Only 23.3% of the respondents answered that it was the library
director, and 18.9% responded that it was the board of trustees.
Table 4. Primary Human Resource Decision Maker
Human Resource Policy Decision Maker Count Percent
Library Director 21 23.30%
Board of Trustees 17 18.90%
Human Resource Manager of the Town 37 41.10%
Human Resource Manager that is just for the library 2 2.20%
Other Town Employees 10 11.10%
Not Sure 3 3.30%
Total 90

R. K. Fischer
17
In analyzing the data from the questions on size, branches and budget, one can see
that the diversity of the sample was representative of all population and budget sizes in the
country. However, this sample was not an exact match for the statistics of the entire United
States. While 46.5% of the survey participants were employed by libraries with a service
population of under 50,000, 88% of all libraries in the United State are in towns with a
population of 50,000 or less (Pearlmutter & Nelson, 2011). This means that the results for
this present survey were skewed towards a larger population rate than if librarians from
all public libraries the United States responded. This was evident in the responses about
budgets, given that 36.9% of the libraries had a budget of more than $2 million. Despite the
difference in the sample compared to the whole population, the sample has proven to be
suitable enough to draw important conclusions. For example, the fact that 70% of the
respondents work for librarians in towns that do not hire a human resource employee
whose sole purpose it is for the library may be a strong indicator that human resource
management will be challenging libraries like these.
Results: Administrative Issues
A section of this survey contained questions about administrative situations that the
librarians had encountered. The purpose of these questions was to analyze current trends
related to increasing or decreasing the budget amount and number of staff. This provided a
picture of how the economy had affected the libraries that employ the participants. The
data was analyzed according to the regression analysis method for a correlation between
variables. The independent variables included: population size, budget amount, and
professional librarian salary. The dependent variables included: change in the amount of
the budget, change in the number of staff, and if the number of staff was adequate. The

R. K. Fischer
18
purpose of the regression analysis was to measure how well the independent variables
predict the occurrence of these administrative issues. A qualitative question was included
so that the participants could respond about their experiences with an inadequate number
of staff. This provided insight into the causes of inadequate staff and how librarians have
coped with the problem.
The librarians were questioned about whether their budgets had increased or
decreased in the last five years. Eighty-eight individuals responded to the question. The
largest percentage, 43.2%, responded that the budget had increased. While 28.4%
responded that the budget had stayed the same, 25% had experienced a decrease in the
budget, and 3.4% were unsure of the answer. It is a favorable sign that so many librarians
responded that the budget increased or stayed the same. This correlates with the results of
Library Journal’s annual budget survey that reported that a higher number of libraries had
increased budgets during the last two years (Peet, 2015; Peet, 2016).
A multiple linear regression was calculated to predict if a budget would have
increased or decreased based on the budget size, service population size, and professional
librarian salary. The results of the multiple regression analysis for the dependent variable
of a change in budget are in Appendix B, Table B2, Results of the Regression Analysis for a
Change in Budget. Because the lower 95% of the values for all independent variables
straddled zero, none of the variables can be relied on to create a regression equation. From
the ANOVA analysis this equation can be extrapolated: F(3, 65) = 1.041, p = 0.38, with an r
square of 0.046. A coefficient of determination as small as 0.046 means that the data does
not fit well along the slope of a regression line. According to the correlation coefficient, only
21.4% of the variation in the independent variables can predict whether a budget will
R. K. Fischer
19
increase or decrease. All of the p-values for the independent variables are above 0.05,
which means that any relationship that could be discovered is most likely by chance.
Because Library Journal’s annual budget survey has previously found a correlation between
a change in the budget and population size, it can be concluded that the sample size for this
survey is too small to find a correlation among the variables.
The participants were asked whether or not the library had to reduce staff in the
last 10 years. Ninety individuals responded to the question. While 54.4% responded no,
36.7% responded yes. However, 8.9% did not know the answer. The number of libraries
that did not reduce staff may correlate to Library Journal’s annual budget survey’s recent
findings, which stated that even though the libraries’ budgets had increased, the staff size
of many libraries had stayed the same or increased (Peet, 2015).
A multiple linear regression was calculated to predict if a staff reduction occurred
based on the budget size, service population size, and professional librarian salary. The
results of the multiple regression analysis are in Appendix B, Table B3, Results of the
Regression Analysis for a Staff Reduction. Because the lower 95% of the values for all
independent variables straddle zero, none of the variables can be relied on to create a
regression equation. From the ANOVA analysis this equation can be extrapolated: F(3, 64)
= 1.69, p = 0.178, with an r square of 0.073. A coefficient of determination as small as 0.073
means that the data does not fit well along the slope of a regression line. According to the
correlation coefficient, only 27.1% of the variation in the independent variables can predict
if a staff reduction occurred. All p-values for the independent variables are above 0.05,
except for population size. The p-value for population size was 0.04. This means that the
relationship between population size and a staff reduction is less likely to occur by chance.

R. K. Fischer
20
Because Library Journal’s annual budget survey has previously found a correlation among
similar variables, it can be concluded that the sample size for this survey is too small to find
a correlation among the variables.
The librarians were asked for their opinions about how they coped with these staff
reductions. Thirty-seven of them responded. The answers were coded for themes. In
situations when an individual responded with more than one idea, multiple codes were
assigned to the answer. A total of forty-seven ideas were coded. The responses included
many types of comments, including how the situations made them feel personally,
problems that staff reduction caused, and how the librarians compensated for the
situations. Allowing the respondents to write their opinions, instead of selecting from a
multiple-choice list produced a much more varied list of answers than expected.
One participant stated, “We eliminated Sunday hours at branch locations so only the
main library downtown was open. We cut page staff. We looked at services we could
eliminate. We looked for efficiency in procedures so that we would work smarter with
fewer people.” This one response sums up many of the answers that the librarians
provided. The entire list of codes is in Table 7, How the Respondents Coped with Staff
Reduction. While each of these topics deserves to be addressed in more depth, the top four
answers include the reductions of services or resources available, at 19.15%, increased
responsibilities for the staff, at 14.89%, the reduction of hours, at 12.77%, and instituting a
hiring freeze, at 8.51%.
Increased responsibilities for the staff has been clearly stressful for many libraries.
One librarian stated, “We cope by ‘gathering the wagons’ and being supportive of each
other as we take on additional responsibilities and tasks.” Being supportive of the staff is

R. K. Fischer
21
very important in times of stress in order to improve employee moral and continue to
assist customers in an efficient manner. One librarian stated that the increased
responsibilities caused problems with both customer service and employee morale. To
cope with these issues, some libraries stated that they implemented automatic check-out
systems, hired more part-time staff, utilized more volunteers, cross-trained staff to be able
to handle more than one position, and provided professional development training to
improve technology skills.
Table 7. How the Respondents Coped with Staff Reduction
Coping with Staff Reduction Code Count Percentage
Reduced services or resources available 9 19.15%
Increased responsibilities 7 14.89%
Reduced hours 6 12.77%
Hiring freeze 4 8.51%
Improved/reduced processes 3 6.38%
Adjusted performance expectations 2 4.26%
Hire more part-time employees 2 4.26%
Implemented self-check-out system or other automation 2 4.26%
Improved staffing 2 4.26%
Improved training and development 2 4.26%
Controlled by union contract 1 2.13%
Cross-training 1 2.13%
Hire student workers 1 2.13%
Layoffs 1 2.13%
Outsourced cleaning service 1 2.13%
Retention problem 1 2.13%
Staff works extra hours 1 2.13%
Use volunteers 1 2.13%
Total 47

R. K. Fischer
22
Ninety individuals responded to a question about whether or not the library was
adequately staffed. The majority of the librarians responded no, at 60%. While 38.9%
responded yes, 1.1% responded that they did not know. When asked why the libraries
were not adequately staffed, the majority of the librarians, 62.26%, responded that it was
due to a lack of funding. One librarian stated, “The library's per capita funding level is quite
low, so we have little money for staff, resources, or capital investments--and we need all
three. We passed a tax increase in June 2016, but even with that there is not enough money
to hire even one more staff member.” While this librarian was lucky enough to pass a tax
increase, many librarians responded that they experienced a lack of support from the
municipal government for increasing the budget. Not having a suitable budget has made
staffing very difficult. One librarian stated, “Budget reductions and re-allocations of library
staff members from one branch to another has left some of the branches scrambling to staff
service desks and provide services.” As shown in Table 8, Reasons for an Inadequate
Number of Staff, many other reasons were reported. While many comments can be
attributed to a lack of funding, such as a hiring freeze and layoffs, several librarians said
that aspects of the position did not attract the right individuals, such as a low salary and
geographic location. Other interesting responses included a lack of substitutes for
absences, staff retention, and a lack of skilled applicants.

R. K. Fischer
23
Table 8. Reasons for an Inadequate Number of Staff
Reasons for inadequate amount of staff Code Count Percent
Lack of funds 33 62.26%
Low salary 3 5.66%
Hiring freeze 2 3.77%
Lack of skills of staff/applicants 2 3.77%
Lack of substitutes 2 3.77%
Lack of support 2 3.77%
Staff retention problems 2 3.77%
Staffing management problem 2 3.77%
City government regulations 1 1.89%
Geographic location 1 1.89%
Over staffed 1 1.89%
Recruitment problems 1 1.89%
Staff reduction 1 1.89%
Total 53
A multiple linear regression was calculated to predict if a library had an adequate
amount of staff based on the budget size, service population size, and professional librarian
salary. The results of the multiple regression analysis are in Appendix B, Table B4, Results of
the Regression Analysis for an Adequate Number of Staff. Because the lower 95% of the
values for all independent variables straddle zero, none of the variables can be relied on to
create a regression equation. From the ANOVA analysis this equation can be extrapolated:
F(3, 67) = 1.12, p = 0.35, with an r square of 0.048. A coefficient of determination as small
as 0.048 means that the data does not fit well along the slope of a regression line. According
to the correlation coefficient, only 21.9% of the variation in the independent variables can
predict whether a library had an adequate amount of staff or not. All of the p-values for the
independent variables are above 0.05, which means that any relationship that could be
R. K. Fischer
24
discovered is most likely by chance. The sample size for this survey is too small to find a
correlation among the variables.
Results: Human Resource Management Challenges
In order to analyze human resource management challenges in depth, the librarians
were asked to rate the different human resource aspects on a Likert scale. These aspects of
human resource management included, recruitment, hiring staff, retaining staff, training
and development, performance appraisal design, strategic planning related to human
resource management, benefits plans, compensation, job analysis and job design, and
employee rights/human resource law. The number of responses varied by each aspect. The
ratings of the Likert scale consisted of: serious challenge, moderate challenge, minor
challenge, not a challenge, unsure, and decline to answer. Appendix B, Table B5, Human
Resource Management Challenges contains the entire results of these questions.
In order to calculate percentages more accurately, the answers for “unsure” and
“decline to answer” have been removed. When analyzing this data, the majority of the
respondents clearly found all aspects of human resource management challenging to some
degree. Nearly one-third of the respondents answered that several of the aspects were not
challenging. These included: retaining staff (31%), benefits plans (29.9%), and employee
rights/human resource law (32.8%). While nearly a third of the respondents found
retaining staff to be not challenging, two thirds of the librarians found it challenging to
some degree. Only 18.8% felt that it was a serious challenge. However, 21.7% believed that
it was a moderate challenge, and 28.2% believed that it was only a minor challenge.
Retaining staff may not be very challenging due to the number of people that would want to
be a librarian for a long-term career or feel attached to a location. Given that benefits plans

R. K. Fischer
25
and human resource law are typically handled by a town’s human resource department, it
would make sense that more librarians found these aspects not challenging. Only 14% said
that benefits plans were a serious challenge. While 27% believed that it was a moderate
challenge, and 29% believed that it was a minor challenge. Only 16% believed that
employee rights and human resource law was a serious challenge. However, 22.95%
believed that it was a moderate challenge, and 27.87% believe that it is a minor challenge.
The smallest percentage of respondents who felt that an aspect was not challenging
answered recruitment (9.56%) and strategic planning for human resource management
(10.66%). This would mean that these two aspects were the most challenging overall to
these librarians. While one quarter of the respondents found recruitment a serious
challenge and 21% found it a minor challenge, the largest percentage found it moderately
challenging at 43.38%. While only 10.66% believed that strategic planning was not a
challenge, more than one third believed that it was moderately challenging. However, 27%
believed that it was a serious challenge and 25% believed it was a minor challenge.
Similar to recruitment, a large percentage answered that hiring staff was only
moderately challenging at 50.36%. Only 12.41% found it a serious challenge, while 20.44%
found it to be a minor challenge. However, only 16.79% said that hiring staff was not a
challenge. Only 15.9% of the respondents said that training and development was not a
challenge. The largest percentage reported that it was only a moderate challenge at
39.86%. However, 15.94% believed that training and development was a serious challenge
and 28.26% believed that it was only a minor challenge. One third of the librarians
responded that performance appraisal design was moderately challenging. However,
26.77% believed that it was a serious challenge. While 22.05% believed that it was a minor

R. K. Fischer
26
challenge, 17.32% believed that it was not a challenge at all. While compensation is similar
to benefits plans, more librarians found it challenging. While 26.72% believed that it was a
serious challenge, 31.03% believed that it was a moderate challenge. However, 23.28%
believed that it was a minor challenge, and only 18.79% believed that it was not a
challenge. Job analysis and job design proved to be more challenging than expected. Only
20.31% believed that it was not a challenge. However, 16.41% believed that it was a
serious challenge. While 35.16% felt that it was a moderate challenge, 28.13% believed
that it was a minor challenge.
Because a significant regression correlation could not be discovered using multiple
regression analysis for any of the previous variables, the results of the regression analysis
for recruitment was the only dependent variable that was reported as an example for this
section of the report. A multiple linear regression was calculated to predict how
challenging recruitment was based on the budget size, service population size, and
professional librarian salary. The results of the multiple regression analysis are in Appendix
B, Table B6, Results of the Regression Analysis for Recruitment. Because the lower 95% of the
values for all independent variables straddle zero, none of the variables can be relied on to
create a regression equation. From the ANOVA analysis this equation can be extrapolated:
F(3, 67) = 1.685, p = 0.179, with an r square of 0.07. A coefficient of determination as small
as 0.07 means that the data does not fit well along the slope of a regression line. According
to the correlation coefficient, only 26.5% of the variation in the independent variables can
predict whether a librarian thought that recruitment was challenging to some degree. All of
the p-values for the independent variables are above 0.05, which means that any

R. K. Fischer
27
relationship that could be discovered is most likely by chance. The sample size for this
survey is too small to find a correlation among the variables.
Similar to the results of the human resource challenges rating, the majority of these
librarians believed that their previous course work in library science did not adequately
educate them about human resource management. While 67.1% responded that their
coursework did not adequately educate them on the subject, 14.8% believed that their
coursework was adequate. Only 13.6% had not had prior coursework, and 4.5% were
unsure if the coursework was adequate or not. Some of the participants left comments
about their feelings on the subject in a section for additional comments. One librarian
stated,
“There has to be more done on the national/state level to get librarians the education they need to manage human resources more effectively and efficiently. This is the one area I feel that we have not adequately addressed, not just in MLS programs but in general in professional development opportunities. It is not glamorous; but a wrong or poor decision can have huge lasting negative effects on an organization and on the career of a librarian.”
The lasting effects of human resource management is important to note given how the
many functions of this field tie the employees’ needs for safety and security to their place of
employment. Improving the human resource curriculum within MLS programs could help
to improve how effectively and efficiently libraries are managed. The American Library
Association could help to educate librarians on the subject by increasing the number of
human resource management webinars that focus on specific topics within the field. These
webinars would be more effective if they focused on real life problems and how to solve
them.
One librarian illustrated the importance of meeting employee needs as part of
human resource management by stating,
R. K. Fischer
28
“More MLS programs need to have nuts and bolts HR management courses, in my opinion. My coursework amounted to ‘Millennials learn differently and you must accommodate them.’ There was no discussion about aging employees, racial discrimination suits, what to do when an employee is hired for a physical job and a year later produces a doctor's note saying they can no longer work that job or that schedule, etc. All of this can be determined by seeking legal counsel, but that's expensive and time-consuming. Management of staff is easily 75% of my job, and should get greater weight in graduate coursework.”
Currently, the human resource management curriculum at this researcher’s alma mater
consists of three chapters within the book on library management. This is clearly not
enough for the participants of this survey. From the results and these two quotations, one
can see that it is time for the human resource management curriculum to be improved.
Library science programs should devote a whole course to human resource management.
For those that do not elect to take the course, the library management course should be
enhanced to place a stronger focus on the importance on human resource management.
This should include an emphasis on real-life challenges that librarians are currently facing,
and how to solve these problems, such as how to manage staff efficiently on a decreased
budget, how to cope with a need for staff reduction, and professional development.
Given the similarity of the numerical results, one could hypothesize that this is the
variable that correlates with the feelings that human resource management is challenging.
However, comparing this question as a three-point answer to a four-point Likert scale
could not generate accurate results. These results were not presented in a table due to the
inaccurate results that it generated. However, when comparing the answers in a Pivot
Table, there was no clear correlation among variables.
Results: Solving Human Resource Management Problems
Asking librarians to respond to answers in a qualitative manner can be a useful
tactic when a researcher is unsure of all of the options that should be included in multiple-
choice questions. This survey included three questions that asked the librarians to reflect

R. K. Fischer
29
on three solutions that they had devised to solve human resource related problems. Eighty
individuals responded by providing at least one solution. The librarians recorded a total of
187 ideas. This researcher coded each answer for themes and found 42 unique ideas. These
ideas represent issues that librarians were actively working on improving or had worked
on improving in the past.
The most common response was to improve professional development. This had
twenty-four responses. One librarian responded, “To make up for the lack of training
opportunities and funding for conferences, the library takes advantage of free webinars
whenever possible. The Director attends a conference every other year to conserve
funding.” When it can be difficult to hire staff with the required amount of experience and
knowledge, webinars and tutorials can be found on the Internet for many subjects from
technology training to human resource management. One librarian recommended, training
the human resource department on human resource management related to the library’s
needs. By training the municipal staff on issues related to library management, the library
may be able to gain an important advocate. Reviewing customer service skills, policies, and
procedures on a yearly basis with all staff, can be helpful to improve the quality of the
library. Another librarian recommended, “training supervisors to handle some HR issues
including documentation of performance issues, performing effective employee appraisals,
and assisting managers in the development of effective interview questions.” Although the
manager may be responsible for human resource functions, training supervisors to be able
to handle these tasks can help to provide the supervisors with the necessary experience for
a promotion while cross-training them to assist with the management of the library.
R. K. Fischer
30
A total of twenty-three individuals responded that they had worked to improve
compensation and/or benefits. Several librarians recommended a salary survey of the
region. This helped them to make the case for increasing the salary by showing how low
their library’s salaries were compared to other municipalities. Some of the respondents
have been successful with switching to a paid time off system that accumulates additional
paid time off each pay period instead of vacation and sick time. This can be helpful because
vacation time is not always provided to new employees. Some participants responded that
they had improved compensation and benefits by improving the job classification, or
worked with bargaining units. One librarian stated, “We've had to cap some salaries in the
Library Assistant level to be able to hire Librarians at a better/higher wage.” While library
assistants would like higher wages too, a higher salary for librarians can make it easier to
recruit the librarians with a master degree in library science.
As seen in Appendix B, Table B7. Solutions for Human Resource Problems, there are
far too many responses to report in this paper. In addition to improving professional
development and compensation and benefits, several other top answers included,
improved the recruitment process, utilized the town’s human resource department for
assistance, improved new hire training, and improved the performance appraisal process.
Some successful recommendations for improving recruitment included working with
college campuses to recruit college students and new graduates. Advertising only on
library association websites helped some participants to recruit only the most qualified
candidates. While some participants were successful with improving the performance
appraisal by redesigning it to include a self-appraisal process that allowed for two-way
feedback, many librarians found that adding incentives for good performance was an

R. K. Fischer
31
unsuccessful tactic. It can be difficult to implement a bonus system in non-production
environments.
The next set of questions asked the librarians to rate the degree of success of each of
the solutions that they wrote about on a scale of unsuccessful to very successful. As shown
in Table 10. The Success of the Solutions, 185 of the ideas were rated. Even though the
majority of these librarians reported that human resource management was a challenge,
the majority of these librarians thought that the solutions to problems that they devised
were successful to some degree. The largest percentage reported that their solutions were
somewhat successful, at 42.7%. However, 30.8% felt that the solutions were very
successful. Only 5.4% felt that the solution was somewhat unsuccessful, and 13% felt that
the solutions were completely unsuccessful. The remaining 8.1% responded that it was
neither successful nor unsuccessful. Although human resource management challenged the
majority of these survey participants, the degree of success shows that the librarians were
still able to solve problems related to human resource management with the resources that
they had available.
Table 10. The Success of the Solutions
Degree of Success Count Percent
Very Successful 57 30.8%
Somewhat Successful 79 42.7%
Neutral 15 8.1%
Somewhat unsuccessful 10 5.4%
Unsuccessful 24 13.0%
Total 185

R. K. Fischer
32
Discussion
After reviewing prior research on human resource management, one could
hypothesize that there would be a correlation between the independent variables, such as
size of service population, and size of budget; and the dependent variables, such as whether
a budget increased or decreased, whether or not staff was reduced, whether or not a
library is adequately staffed, or how a librarian thinks about how challenging the different
aspects of human resource management seem. Despite such a diverse sample, from various
service population sizes and budget amounts, regression analysis demonstrated a lack of
correlation between the independent and dependent variables. While the results of the
questions related to changes in budget and staff sizes showed similar improvements or a
stabilization in the economy as Library Journal’s annual budget survey, the lack of
correlation and high p-values may mean that the sample size was too small.
Given that the majority of the participants believed that all aspects of human
resource management were challenging to some degree and that their human resource
curriculum was inadequate, the lack of correlation among variables appears to mean that
human resource management was challenging for librarians regardless of the size of the
library’s service population or budget. While the high p-value may mean that the sample is
too small to discover correlations among variables, increasing the sample may prove that
there could be a correlation among variables.
Although all of the respondents did not respond to the entire survey, the sample size
for each question was suitable for analyzing the impact of how challenging human resource
management was for the participants. Even though the survey remained open for 15 days
due to the deadlines for the course, the results appeared to be consistent with prior

R. K. Fischer
33
research. However, analyzing the results according to regression analysis did not result in a
clear correlation among variables. While this may mean that human resource management
is challenging for the majority of all libraries in this country, the high p-values for most
equations most likely means that the sample size was too small. Increasing the sample size
to the extent of Library Journal’s surveys may be necessary for properly analyzing the
correlation among variables.
Due to the fact that the majority of the respondents found some aspect of human
resource management challenging to some degree, further research into each of these
aspects is warranted. It is important to understand the source of each specific challenge
and how librarians have overcome these challenges so librarians may improve their
abilities to manage libraries. The qualitative questions generated many more answers than
this researcher could address during this study, but each issue deserves further research.
Because the librarians reported that human resource management was not adequately
included in their library science courses, this researcher recommends that library science
professors should improve library management curriculum to address human resource
management in a more in depth manner than the current curriculum allows. By including
discussions of the situations that challenge librarians on the job in coursework, future
librarians will be able to solve their own problems more efficiently.
Conclusion
Given that human resource management is tied to an employee’s sense of security
and self-fulfillment, solving problems related to this subject should be made a priority for
librarians and library science professors in the United States. Although many of these
librarians had the resources to solve the problems that they encountered, the majority of

R. K. Fischer
34
them thought that human resource management was not adequately taught in library
science programs. Given that the majority of the librarians answered that human resource
management was challenging to some degree, improving the library science curriculum
and professional development opportunities related to human resource management is an
important step towards improving public library management in the United States. Further
research, networking, and curriculum development can help librarians work together to
solve problems and improve everyone’s ability to manage libraries in the future.

R. K. Fischer
35
References
Fischer, R. K. (2015). Rural and Small Town Library Management Challenges. Public Library
Quarterly, 34(4), 354-371.
Flatley, R., & Wyman, A. (2009). Changes in Rural Libraries and Librarianship: A
Comparative Survey. Public Library Quarterly, 28(1), 24–39.
Holt, G. E. (2009). A Viable Future for Small and Rural Libraries. Public Library Quarterly,
28(4), 287–294.
Kelley, M. (2011). Bottoming out: Severe cuts today put big question marks on the future.
Library Journal, 136(3), 28-31.
Lee, M. (2009). Wild West Libraries: A Study of Southwest Kansas Public Libraries. Public
Library Quarterly, 28(2), 176–191.
Pearlmutter, J., & Nelson, P. (2011). Small Public Library Management. Chicago, IL:
ALA Editions.
Peet, L. (2015). Paying for People. Library Journal, 140(2), 30.
Peet, L. (2016). Gaining Ground Unevenly. Library Journal, 141(2), 28-30.
Riggs, K. R., & Timmins, J. T. (2015). The Johnson County Library Staffing-Exchange
Experiment. Public Libraries, 54(3), 9-10.
Walters, H., & Byers, J. (2007). Current Statistics in Rural Librarianship. Rural Libraries,
27(1), 25–29.

R. K. Fischer
36
What Are They Thinking? Results of a Survey on the Profession. (2006). Public Libraries,
45(1), 53-57.
R. K. Fischer
37
Appendix A – Survey Questions
CONSENT FORM
Human Resource Challenges for Public Libraries Invitation to participate: You are invited to participate in a study about human resource challenges for public libraries being conducted by Rachel K. Fischer, MLIS, for completing the requirement of a capstone course for the degree of MS in Management at Minot State University. Basis for Subject Selection: Participants responding to this survey should be librarians currently employed by a public library who have knowledge of human resource practices at their places of employment. Overall Purpose of Study: The purpose of this research is to identify the aspects of human resource functions that are the most challenging for public libraries and how librarians have overcome these challenges. Human resource functions include but are not limited to recruiting and hiring staff, training and development, designing performance appraisal systems, compensation and benefits, and human resource law. This study hopes to shed light on how to improve the management of public libraries. Explanation of Procedures: The survey will take about 15 minutes to complete. This is a blind study, in which all participants will remain anonymous. The questions consist of multiple-choice questions and fill in the blank responses. Potential risks and discomforts: Due to the anonymity of the participants there will be minimal to no risk in answering the survey questions honestly. The publication of any quotations from the answers will be anonymous. The answered surveys will be saved in a confidential manner. A slight risk may occur if a participant’s embarrassing response becomes accessible by other employees. However, the risk is minimal and sufficient steps have been taken to prevent any risk due to the anonymity of the survey. The confidentiality of the responses will be maintained by not collecting any contact information. The answers will be maintained on the www.surveygizmo.com website and on this researchers personal computer, and will be password protected to avoid data being leaked. The responses will be reported in the aggregate and not individually. Some individual test responses that are significant may be reported individually, but will not be associated with a particular respondent, library, city, or state. Potential Benefits: The goal is to publish the survey results in an academic journal after the results have been analyzed. Hopefully, the results of the study will help librarians to improve conditions in public libraries and aid others in their research. Withdrawal from the Study: Your participation is voluntary. Your decision whether or not to participate will not affect your relationship with your current employer, with this researcher, this university, or the librarian profession. If you decide to participate, you are
R. K. Fischer
38
free to withdraw your consent and discontinue participation at any time by not submitting the survey. For further information: Feel free to ask questions now or at any time during the study. If you have questions, you can contact Rachel K. Fischer at [email protected]. The sponsoring faculty member, Dr. Gary Ross, can be contacted at [email protected]. The Institutional Review Board chair of Minot State University, Dr. Jynette Larshus, can be contacted at [email protected], 701-858-4324.
Do you agree to participate?
Qualifying Questions
1. Are you currently working for a public library? If your answer is no, please do not complete this survey.
a. Yes
b. No
2. Are you responsible for participating in any of the following human resource functions? Check all that apply. If you do not have experience working in any one of these functions, please do not complete the survey.
a. Recruiting and hiring activities
b. Training and development activities
c. Compensation and benefits decisions
d. Decision making process related to human resource related strategic
planning and human resource policies
3. What is your current job title or equivalent corresponding job title?
a. Library Director
b. Assistant Library Director
c. Branch Manager or Library Manager
d. Library Department Manager
e. Assistant Library Manager

R. K. Fischer
39
f. Library Supervisor
g. Librarian
Human Resource Management Challenges
4. Think about how challenging the following human resource functions are for your library. Rate them according to their difficulty.
Serious Challenge
Moderate Challenge
Minor Challenge
Not a Challenge
Not Sure
Recruitment
Hiring staff
Retaining staff Training and development
Performance Appraisal Strategic planning related to human resource management
Benefits Plans
Compensation Job analysis and job design
Employee Rights/Human resource law
5. List up to three solutions that your library has tried in order to overcome the
human resource related challenges. a. b. c.
6. Think about how successful these solutions were for your library. Rate them according to their success.
Unsuccessful Somewhat unsuccessful Neutral
Somewhat Successful
Very Successful
Decline to Comment
Solution A Solution B Solution C
Administrative Questions

R. K. Fischer
40
7. What is the total amount of your library’s budget?
a. $0-24,999
b. $25,000-49,999
c. $50,000-74,999
d. $75,000-99,999
e. $100,000-249,999
f. $250,000-499,999
g. $500,000-999,999
h. $1 million – 2 million
i. more than $2 million
8. Has your library’s budget increased or decreased in the last 5 years?
a. Increased
b. Decreased
c. Stayed the same
d. Not sure
9. Does your library have one or more dedicated human resource staff members that work within the library, separate from the town’s human resource office?
a. Yes
b. No
10. Who is the primary decision maker when it comes to making decisions about human resource policy?
a. Library Director
b. Board of Trustees
c. Human resource Manager of the Town
d. Human resource Manager that is just for the library

R. K. Fischer
41
e. Other Town Employees
f. Not sure
11. Has your library needed to reduce staff in the last 10 years? If the answer is “no” or “I don’t know,” skip the next question.
a. Yes
b. No
c. I do not know.
12. How has your library coped with its need to reduce staff?
13. Do you feel that your library has an adequate number of staff? If your answer is yes, please skip the next question.
a. Yes
b. No
c. Not sure
14. If your answer was no to the previous question, why have you not been able to adequately staff the library?
Demographics 15. In what state or US territory do you reside?
16. What is the service population that your library serves?
a. Under 2,500
b. 2,500 - 4,999
c. 5,000 - 9,999
d. 10,000 - 19,999
e. 20,000 - 29,999
f. 30,000 - 39,999
g. 40,000 - 49,999
h. 50,000 - 99,999

R. K. Fischer
42
i. 100,000-499,999
j. 500,000 – 999,999
k. 1 million or more
17. Do you work for a library that operates more than one branch? If yes, please answer question 18. If no, or not sure please skip to question 19.
a. Yes
b. No
18. How many branches make up your library system?
19. How many full-time employees work for your library?
20. How many part-time employees work for your library?
21. How many of these employees are managers?
22. Do you have a Master Degree in Library Science (MLS, MLIS, or MIS)?
a. Yes
b. No
23. Did your previous course work in library management adequately educate you about human resource management?
a. Yes
b. No
c. I have not taken a class.
d. Not sure
24. How many employees have a Master degree in Library Science (MLS, MLIS, or MIS)?
25. What is the starting hourly wage of paraprofessional employees at your library?
26. What is the starting hourly wage of professional librarians at your library?
27. What is the median hourly wage of librarians at your library?
28. Do you have any additional comments?
R. K. Fischer
43
Appendix B – Tables
Table B1. States
Value Count Percent
Texas 23 26.40%
Virginia 7 8.00%
Iowa 6 6.90%
Pennsylvania 5 5.70%
West Virginia 5 5.70%
California 4 4.60%
Illinois 4 4.60%
New Mexico 4 4.60%
Connecticut 3 3.40%
Missouri 3 3.40%
Florida 2 2.30%
New Hampshire 2 2.30%
New York 2 2.30%
Ohio 2 2.30%
Oregon 2 2.30%
Wisconsin 2 2.30%
Alabama 1 1.10%
Delaware 1 1.10%
Georgia 1 1.10%
Idaho 1 1.10%
Maryland 1 1.10%
Massachusetts 1 1.10%
Nebraska 1 1.10%
North Carolina 1 1.10%
Tennessee 1 1.10%
Utah 1 1.10%
Washington 1 1.10%
Total 87

R. K. Fischer
44
Table B2. Results of the Regression Analysis for a Change in Budget
Regression Statistics
Multiple R 0.21411672
R Square 0.04584597
Adjusted R Square 0.00180809
Standard Error 0.81940105
Observations 69
ANOVA
df SS MS F Significance
F
Regression 3 2.09695478 0.69898493 1.0410576
4 0.3804033
9
Residual 65 43.6421756
5 0.67141809
Total 68 45.7391304
3
Coefficients Standard
Error t Stat P-value Lower 95% Upper 95% Lower 95.0%
Upper 95.0%
Intercept 2.49008492 0.39905619 6.23993553 0.0000000
4 1.6931146
7 3.2870551
7 1.69311467 3.28705517
Budget Amount 0.07513590 0.06287717 1.19496328 0.2364433
0
-0.0504384
7 0.2007102
7 -
0.05043847 0.20071027
Service Population Size
-0.06442909 0.04871139 -1.32267011
0.19057994
-0.1617124
5 0.0328542
6 -
0.16171245 0.03285426
Professional Librarian Wage
-0.01892862 0.01886357 -1.00344848
0.31936553
-0.0566017
8 0.0187445
3 -
0.05660178 0.01874453

R. K. Fischer
45
Table B3. Regression Analysis Results for a Staff Reduction
Regression Statistics
Multiple R 0.27105
R Square 0.07347 Adjusted R Square 0.03004
Standard Error 0.48547
Observations 68
ANOVA
df SS MS F Significance
F
Regression 3 1.19600 0.39867 1.69157 0.17766
Residual 64 15.08341 0.23568
Total 67 16.27941
Coefficients Standard
Error t Stat P-value Lower 95% Upper 95%
Lower 95.0%
Upper 95.0%
Intercept 1.88838 0.23430 8.05963 2.53071E-
11 1.4203 2.3564 1.4203 2.3564
Budget Amount 0.03076 0.03653 0.84187 0.40300 -0.04223 0.10374 -0.04223 0.10374
Population Size -0.05846 0.02856 -
2.04698 0.04477 -0.11552 -0.00141 -0.11552 -0.00141 Professional Librarian Salary -0.00574 0.01071
-0.53551 0.59415 -0.02713 0.01566 -0.02713 0.01566

R. K. Fischer
46
Table B4. Results of the Regression Analysis on Adequate Number of Staff
Regression Statistics
Multiple R 0.21892
R Square 0.04792 Adjusted R Square 0.00529
Standard Error 0.49817
Observations 71
ANOVA
df SS MS F Significance
F
Regression 3 0.83699 0.27900 1.12419 0.34560
Residual 67 16.62780 0.24818
Total 70 17.46479
Coefficients Standard
Error t Stat P-value Lower 95% Upper 95%
Lower 95.0%
Upper 95.0%
Intercept 1.33997 0.23298 5.7515 2.38558E-
07 0.87495 1.804997 0.87495 1.804997
Library Budget -0.03966 0.03730 -1.0634 0.29142 -0.11412 0.03479 -0.11412 0.03479
Service Population 0.03905 0.02955 1.3216 0.19078 -0.01993 0.09804 -0.01993 0.09804
Professional Library Salary 0.01222 0.01087 1.1237 0.26515 -0.00949 0.03393 -0.00949 0.03393

R. K. Fischer
47
Table B5. Human Resource Management Challenges
Human Resource Aspect Count Percent
Recruitment
Serious Challenge 35 25.74%
Moderate Challenge 59 43.38%
Minor Challenge 29 21.32%
Not a Challenge 13 9.56%
Total 136
Hiring staff
Serious Challenge 17 12.41%
Moderate Challenge 69 50.36%
Minor Challenge 28 20.44%
Not a Challenge 23 16.79%
Total 137
Retaining staff
Serious Challenge 26 18.84%
Moderate Challenge 30 21.74%
Minor Challenge 39 28.26%
Not a Challenge 43 31.16%
Total 138
Training and development
Serious Challenge 22 15.94%
Moderate Challenge 55 39.86%
Minor Challenge 39 28.26%
Not a Challenge 22 15.94%
Total 138
Performance Appraisal Design
Serious Challenge 34 26.77%
Moderate Challenge 43 33.86%
Minor Challenge 28 22.05%
Not a Challenge 22 17.32%
Total 127
Strategic planning related to human resource management
Serious Challenge 33 27.05%
Moderate Challenge 45 36.89%
Minor Challenge 31 25.41%
Not a Challenge 13 10.66%

R. K. Fischer
48
Total 122
Benefits Plans
Serious Challenge 15 14.02%
Moderate Challenge 29 27.10%
Minor Challenge 31 28.97%
Not a Challenge 32 29.91%
Total 107
Compensation
Serious Challenge 31 26.72%
Moderate Challenge 36 31.03%
Minor Challenge 27 23.28%
Not a Challenge 22 18.97%
Total 116
Job analysis or job design
Serious Challenge 21 16.41%
Moderate Challenge 45 35.16%
Minor Challenge 36 28.13%
Not a Challenge 26 20.31%
Total 128
Employee Rights/Human resource law
Serious Challenge 20 16.39%
Moderate Challenge 28 22.95%
Minor Challenge 34 27.87%
Not a Challenge 40 32.79%
Total 122

R. K. Fischer
49
B6. Results of the Regression Analysis for Recruitment
Regression Statistics
Multiple R 0.2649
R Square 0.0702 Adjusted R Square 0.0285
Standard Error 0.9345
Observations 71
ANOVA
df SS MS F Significance
F
Regression 3 4.41493 1.47164 1.68505 0.17855
Residual 67 58.51465 0.87335
Total 70 62.92958
Coefficients Standard
Error t Stat P-value Lower 95% Upper 95%
Lower 95.0%
Upper 95.0%
Intercept 2.17481 0.43672 4.97983 4.72437E-
06 1.303103 3.04651 1.30310 3.04651 Budget Amount -0.05855 0.07056 -0.82984 0.40957 -0.19939 0.08228
-0.19939 0.08228
Service Population -0.05005 0.05458 -0.91703 0.36242 -0.15899 0.05889
-0.15899 0.05889
Professional Librarian Salary 0.04045 0.02044 1.97957 0.05186 -0.00034 0.08125
-0.00034 0.08125

R. K. Fischer
50
Table B7. Solutions for Human Resource Problems
Codes of Solutions Count
Improve professional development 24
Improve compensation and benefits 23
Improve recruitment process 19
Utilize HR department 13
Improve new hire training 11
Improve performance appraisal 10
Improve interview process 9
Improve staff communication 8
Improve policies 6
Redesign jobs/improve job descriptions 6
Hire new HR staff 5
Improve staff schedules 5
Improve evaluation process 4
Improve hiring process 4
Improve understanding of HR law 4
Cross-train staff 3
Improve performance incentives 2
Improve policies 2
Improve problem solving process 2
Promotion from within 2
Reorganize staff according to needs 2
Utilize outside consultant 2
Utilize volunteers 2
Add hours 1
Hire temporary employees 1
Hiring new executive staff 1
Improve ability to handle disciplinary issues 1
Improve background check process 1
Improve communication with board of trustees 1
Improve communication with HR department 1
Improve documentation process 1
Improve networking with other libraries 1
Improve retention by allowing creativity 1
Improve strategic planning for future 1
Improve information systems for HR 1
Increase number of internships 1

R. K. Fischer
51
Increase number of supervisors 1
Increase part-time positions 1
Promote librarianship as a career 1
Remove part time positions 1
Team building 1
Utilize substitutes 1
Total 187