HUMAN BODY AND HUMAN TUMOR
23
1 HUMAN BODY AND HUMAN TUMOR GROWTH KINETICS: A MODEL Antonio Casolari Introduction A model describing microbial inactivation and growth kinetics as affected by chemical and physical agents (Casolari, 1981), suggested some years ago, led to some understanding of a series of phenomena otherwise unexplained. The expected evolution of such a modeling activity would be to try the application of the same basic principle to the growth kinetics of eukaryotic organisms and mostly of metazoa. The human embryo and human tumor growth kinetics were quite attractive as immediate targets. Some difficulties arisen very early in borrowing the model describing prokaryotic organisms. Seemingly, a quite peculiar mechanisms supporting the growth of the eukaryon and entirely unknown to the prokaryotic cells, it’s working. In fact, the prokaryotic and the metazoan cell although fundamentally alike they differ in several respects and mostly in the surface / volume ratio. I am inclined to believe indeed, that the quite prominent characteristic of the metazoan cell resides in the low value of this ratio and that further studies could show substantial connections with this character and the ultimate outcome represented by the metazoan organisms and very likely with their evolution into metazoa. Approach to the model As previously shown (Casolari, 1981), a definite prominence of the water in supporting the molecular interactions leading to such a relevant phenomena of
Transcript of HUMAN BODY AND HUMAN TUMOR

1
HUMAN BODY AND HUMAN TUMOR
GROWTH KINETICS: A MODEL
Antonio Casolari
Introduction
A model describing microbial inactivation and growth kinetics as affected by
chemical and physical agents (Casolari, 1981), suggested some years ago, led to some
understanding of a series of phenomena otherwise unexplained. The expected
evolution of such a modeling activity would be to try the application of the same
basic principle to the growth kinetics of eukaryotic organisms and mostly of metazoa.
The human embryo and human tumor growth kinetics were quite attractive as
immediate targets. Some difficulties arisen very early in borrowing the model
describing prokaryotic organisms. Seemingly, a quite peculiar mechanisms
supporting the growth of the eukaryon and entirely unknown to the prokaryotic cells,
it’s working. In fact, the prokaryotic and the metazoan cell although fundamentally
alike they differ in several respects and mostly in the surface / volume ratio. I am
inclined to believe indeed, that the quite prominent characteristic of the metazoan cell
resides in the low value of this ratio and that further studies could show substantial
connections with this character and the ultimate outcome represented by the
metazoan organisms and very likely with their evolution into metazoa.
Approach to the model
As previously shown (Casolari, 1981), a definite prominence of the water in
supporting the molecular interactions leading to such a relevant phenomena of
2
prokaryons as are the growing and dying mechanisms, can be backed up on the basis
of bringing together the kinetic concern with the known physiologic evidence. The
hypothesis was that kinetic behavior of eukaryons could be expected to be held on the
same basis. If it would be the case, the growth curve of metazoan organisms would be
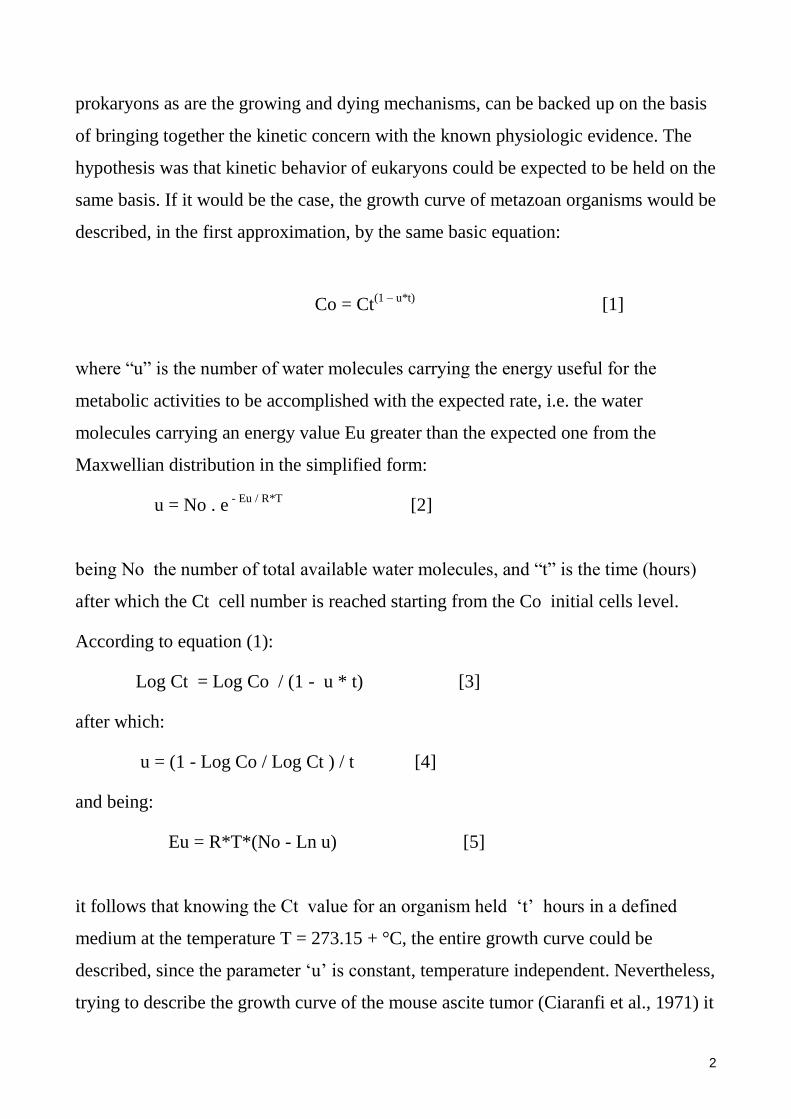
described, in the first approximation, by the same basic equation:
Co = Ct(1 – u*t)
[1]
where “u” is the number of water molecules carrying the energy useful for the
metabolic activities to be accomplished with the expected rate, i.e. the water
molecules carrying an energy value Eu greater than the expected one from the
Maxwellian distribution in the simplified form:
u = No . e - Eu / R*T
[2]
being No the number of total available water molecules, and “t” is the time (hours)
after which the Ct cell number is reached starting from the Co initial cells level.
According to equation (1):
Log Ct = Log Co / (1 - u * t) [3]
after which:
u = (1 - Log Co / Log Ct ) / t [4]
and being:
Eu = R*T*(No - Ln u) [5]
it follows that knowing the Ct value for an organism held ‘t’ hours in a defined
medium at the temperature T = 273.15 + °C, the entire growth curve could be
described, since the parameter ‘u’ is constant, temperature independent. Nevertheless,
trying to describe the growth curve of the mouse ascite tumor (Ciaranfi et al., 1971) it

3
was evident that the ‘u’ value could not be constant, by applying the above functions,
while it decreased steadily increasing the tumor cell number. Such a situation could
be produced by a water decrease in the environment, occurring as the cell number
increases, owing to both the capture action of water required to build new cells, and
also by the water capture by the hydration shell of by-products delivered into the
environment by metabolizing cells.
Both mechanisms are active in the growing prokaryons, while in a less dramatic
measure. The application of the previously reported relationship for prokaryons was:
µ = Ln 2 / [u * Ln Ct - 60 * Ln Co * (M+ (L*Ct )2 )]
[6]
However, describing the bacterial growth curves, the ‘M’ and ‘L’ parameters, and
mostly the ‘L’ one, affected the fitting of the curves only at cell concentrations
greater than about 1/10-1/50 of the maximum attainable cell value (ca. 109.5
), while at
lower cell concentrations the ‘u’ value was very constant.
The water content of a bacterial cell of average size [~1 µm3] amounts to about 10
10
molecules; while an eukaryotic cell of average size will hold more than 1013
water
molecules. Hence, before attempting to work out an ad hoc solution to the above
unexpected problem, it was tried to ascertain if an alike behavior would be peculiar to
the growing animal cell.
To this end, the growth curve of the human embryo up to the birth and then to the full
growth of human body was taken into consideration. Studying the human body
growth kinetics, the mammalian cell was regarded as a spherical cell having 12.4 µm
mean diameter, which leads to an eukaryon volume of 103 µm
3 , having an average
80% water content, what leads to about CW = 2.676867 * 1013
water molecules.
Since the water content of the growing body will decreases during the entire life
period, it was attempted to mediate the quite different values of the body water
4
content as the embryonic and post-natal development is concerned (Kelly et al., 1951;
Tables Geigy, 1963), attaining the following relationship:
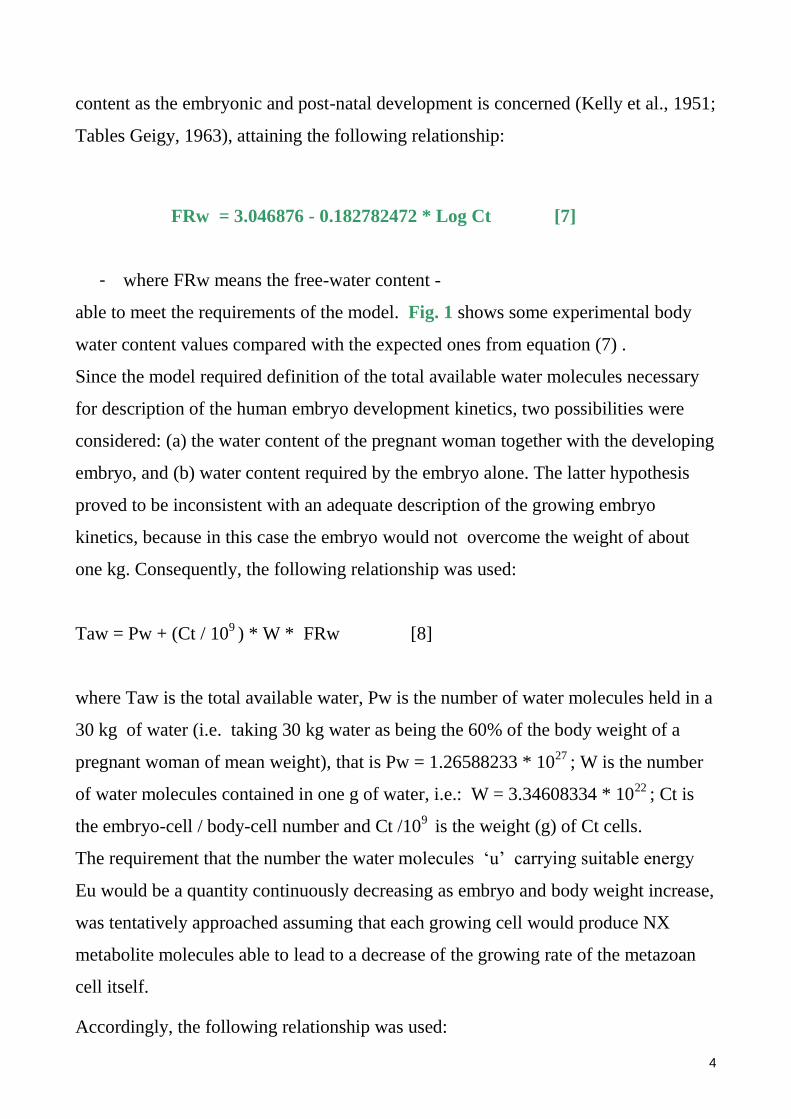
FRw = 3.046876 - 0.182782472 * Log Ct [7]
- where FRw means the free-water content -
able to meet the requirements of the model. Fig. 1 shows some experimental body
water content values compared with the expected ones from equation (7) .
Since the model required definition of the total available water molecules necessary
for description of the human embryo development kinetics, two possibilities were
considered: (a) the water content of the pregnant woman together with the developing
embryo, and (b) water content required by the embryo alone. The latter hypothesis
proved to be inconsistent with an adequate description of the growing embryo
kinetics, because in this case the embryo would not overcome the weight of about
one kg. Consequently, the following relationship was used:
Taw = Pw + (Ct / 109 ) * W * FRw [8]
where Taw is the total available water, Pw is the number of water molecules held in a
30 kg of water (i.e. taking 30 kg water as being the 60% of the body weight of a
pregnant woman of mean weight), that is Pw = 1.26588233 * 1027
; W is the number
of water molecules contained in one g of water, i.e.: W = 3.34608334 * 1022
; Ct is
the embryo-cell / body-cell number and Ct /109 is the weight (g) of Ct cells.
The requirement that the number the water molecules ‘u’ carrying suitable energy
Eu would be a quantity continuously decreasing as embryo and body weight increase,
was tentatively approached assuming that each growing cell would produce NX
metabolite molecules able to lead to a decrease of the growing rate of the metazoan
cell itself.
Accordingly, the following relationship was used:

5
AvW = Taw - Ct * (Cw * FRw + NX * WL) [9]
where AvW was the actual available water and WL was the number of water
molecules bound by each NX molecule. Equation (5) becomes:
Ln u = Ln AvW – Eu / R*T [10]
where Eu was in cal / mole , R = 1.987 and the absolute temperature T = 273.15 +
37°C.
The experimental values of the starting weight of human embryo available from the
literature (Tables Geigy, 1963; Hamilton et al., 1978) were not lower than 0.02 g,
which corresponds to a Ct value of 2*107 cells.
The series of ‘u’ values able to describe with the required accuracy the entire growth
curve of the human body were related to the number of cells by three relationship: the
first one describing the growth up to the seventh month of pregnancy:
Log u7 = - 1.48421632 - 0.182782472 * Log Ct
[11]
the second one, from the seventh month to the birth:
Log ub = - 0.33504552 – 0.27845682 * Log Ct
[12]
and the last equation, after the birth:
Log u = 12.99743970 - 1.32609003 * Log Ct
[13]
The above reported three relationships could be certainly represented by a single
function of higher degree, but the breakage into three functions intersecting at the
seventh month of prenatal development and at the birth, seems to suggest that some

6
event of such a paramount importance does occur in the final period of the prenatal
development, and at the birth, greatly affecting the growth kinetics.
At the birth and afterwards, the model requires that the equation (8) would be
changed into the following:
Taw = (Bw + (Ct /109)*W)*FRw [14]
to neglect the water content of the mother, while considering the water content of the
new-born only, and actually the water content of the new individual, where Bw is the
water fraction of the new-born, that is 0.74 * (1012.6
/ 109 ) * 3.34608334 * 10
22
leading to Bw = 9.908294 * 1025
.
Replacing the equation (8) with the equation (14) does agree very well with the
sudden change in the relationship between Log u and Ct, occurring in the growing
rate at the starting of the post-natal development.
The events occurring at the seventh month of the prenatal development, determining
the visible change of growth kinetics, are not obvious. Quite likely, it could be linked
to an increased cell weight disjoined from an increase in the cell number (Hamilton et
al., 1978), as the growth curve [Fig. 3] seems to suggest.
This event can be justified by the model?
The last parameter, and a quite important one, related to the ‘u’ value, and whose
magnitude requires to be defined is the NX value (see rela-tionship 9). NX is the
number of cell molecules really affecting the growth of the mammalian cell. It was
found, by trial and trial, that the best results (i.e., the growth curve fitting and the
physiological concern) could be obtained by a value of NX increasing with the
increasing too of the cell number of the growing embryo; the reverse was true for
‘AL’ molecules. In spite of the paramount relevance of NX values as regards the
ability of the model to fit the experimental data, the best first order equation linking
NX to Ct [ i.e. Log NX = f(Ct )] had a general correlation coefficient not higher than

7
0.9999 and it was then useless without decreasing significantly the accuracy of the
fitting, mostly at cell concentrations lower than one thousand. Anyhow, since the
utilized computer was unable to handle numbers greater than 1038
, it was impossible
to me to obtain a better fitting. Different computer facilities and or mathematician
ability would meet the requirement. [For the present description of the human body
growth curve, the used computing algorithm allowed to overcome the problem].
Finally, being defined the magnitude of ‘u’ and Aw parameters, the useful energy
value for the metabolic activity of the mammalian cell was easy [eq. 5] found to be
Eu = 40,564.6442 cal/mole, i.e. 160, 738.318 J / mole.
Human embryo and human body growth curve
Fig. 2 shows the human body growth curve, from the early fetal stage up to the age of
20 years. Fig. 3 shows the human growth curve during the first 88 weeks. As can be
seen, the degree of fitting can be regarded as being quite satisfactory. It was claimed
(Lewis and Hartman, 1933), on the basis of data obtained from different cleavage
stages of the eggs of Macacus rhesus, that three days after fertilization the number of
cells would be close to 16. As can be seen from Fig. 3b, this event is exactly expected
from the model. The first duplication requires, according to the model, 34.6 hours,
and the second one, 19.6 hours. Afterwards, the duplication time decreases down to a
minimum value of 8 hours, after which it increases steadily. The growth of the human
embryo during the first ten days is described by a typical sigmoid curve, as
represented in Fig. 3c.
Fig. 4 shows the duplication time behavior as a function of the number of embryo
cells. As can be seen, the shape of the represented curve is entirely different from
that of a prokaryon, in what is very close to an asymmetric parabola. It recalls the
curve describing the growth rate of a procaryon as a function of the temperature,
though reversed as regards the magnitude of the abscissa. This reversion seems to

8
suggest that fertilized egg is very prone to grow, being the environmental conditions
very suitable for cell multiplication, while after only few duplications (five) some
factors suddenly affect the natural cell trend to the development.
As it is well known (Forfar and Arneil, 1978) and as expected from the model, the
birth occurs after 38 weeks and at this time the number of cells of the embryo is about
1012.5
.
It might be asked why the delivery occurs after about 9.5 months. I believe that the
pregnant woman has two possibility, at this time: to eject the embryo or to die.
Really, according to the model, the early increasing of the duplication time of the
mammalian cells (i.e. the early decreasing of the doubling rate) as compared with the
behavior of a prokaryotic cell, comes from the peculiar ability of the metazoan cell to
establish characteristically multiple inter-cells linkages. As a matter of fact it can be
envisioned that the procaryotic cell differs substantially from the eukaryotic one,
because the latter cannot avoid the linking of itself with neighboring eukaryons,
owing to the presence at the surface of the cell membrane a kind of molecules that
unavoidably bind to molecules of the same type located at the surface of the
neighboring cells.
This linkage among eukaryons is the prerequisite for tissues building. While losing
the ability of freely swimming in a watery environment, the metazoan cell organized
as tissue, seems to acquire unavoidably the characteristic to proceed towards a series
of phenomena leading in the end to liberty eprivation, that is leading to senescence
and death of the entire organism.
Really, according to the model, the growth curve of the human body can be described
only taking into account a defined type of molecules synthesized by the metazoan cell
itself and located at the outer surface of the membrane, i.e. the above called NX
metabolites, and afterwards called Gp molecules.

9
This means that suggested model cannot envisage a human body growth curve, while
unaffected by molecules leading unavoidably to cell death.
A hypothesis anything but unlikely!
On the other hand, prokaryotic cells can reproduce at will, without any restriction,
transfer by transfer, without advises of biosenescent process, unless leaved to crowd
together in an intoxicated environment.
But prokaryotic cells do not link together; actually, they are free living units.
Nevertheless, while living in an environment densely populated of cells is not always
an enjoying condition, as procaryons prove, it is the unavoidable linkage with the
other members of the community that unavoidably leads to the death, as the metazoan
cells prove, according to the model.
So, I am inclined to believe that the observed decrease of the growing rate of the
mammalian cells after five duplications only, i.e. at cell concentration greater than 32
units, would mean that some difficulties are encountered very early, by the
mammalian cell, as regards the probability for a free development; and since an
increase of the duplication time cannot be biologically regarded otherwise than a
senescent symptom, the human life must be regarded in practice as a steadily
approach to the death.
In this view, the metazoan organism arose from a damaged free living cell,
synthesizing molecules designed to the outer surface of the cell membrane and forced
by their own structure to link together with molecules of the same type carried out by
the neighboring cells of the same type. The above linkage, quite extraneous to
prokaryons, while not unknown, restricts the individual motility of the metazoan cells
and above all decreases the probability of the cell to be struck by the water molecules
carrying useful energy, and able to trigger and to keep the metabolic activities at the
right rhythm. The above restriction is mostly a physical one, since the cell surface
facing the watery environment decreases further on by the cell joining together. It is

10
for the above reported reason, perhaps, that the value of the useful energy obtained
for the growing human body, already expected to be in the mesophilic range, is on the
contrary higher than the value obtained for thermophilic bacteria (Casolari,1981).
Really, only water molecules having an energy value high enough to overcome the
wall represented by the crowding eukaryons in a tissue, can be regarded as water
molecules carrying useful energy.
As expected from the model, the number of Gp molecules synthesized by the
mammalian cell increases about 1,000 times from the beginning of the embryo
development (about 108 Gp /cell at the stage of’ two cells) up to the body age of about
20 years old (about 1011
Gp molecules/cell at a cell level of 1013.8
). At the same time,
the level of the AL molecules, i.e. the water molecules available per each Gp
molecule, it decreases of about 17 Log cycles. From the above values it follows that
at the human age of about 20 years, the concentra-tion of the Gp molecules is very
close to the osmolality value, that is about 0.3 moles / kg water. It can be expected
that both the increasing of Gp concentration and the decreasing availability of water
molecules, do work together in the biosenescence progression of the human body. As
a matter of fact, the increasing number of Gp molecules would extend the linkages
among mammalian cells, and the decreasing water content would support the
reinforcement of the same linkages in consequence of the increased proximity of the
Gp molecule’s binding sites quite deprived of their own hydration shell.
Nevertheless, there is perhaps no absolute system.
Sometimes, few eukaryons lose the ability of linking together, becoming unable to
synthesize properly the Gp molecules, as a result of a modified DNA information. As
a result, they separate from the neighboring cells as much as the synthetic property is
modified and they resume the duplication activity with comparatively more or less
extent. The event occurs owing to the increased probability for water molecules
carrying useful energy to hit such type of cells, for the greater exposition of the cell’s

11
having lessened links with neighboring ones, following the mutated equipment of
surface molecules.
These cells will become able to go away from the site of origin, in a more or less
degree, following the magnitude of the acquired inability to supply “normal” Gp
molecules to the outer surface of the membrane.
These cells become insensitive to the “contact inhibition”, to a more or less degree, in
proportion of the extent of the surface molecules structure change.
Accordingly, these ”rejuvenated” cells [RC] may lose also the ability to bind the
synthesized abnormal Gp molecules (AGp) to the cell surface, thus delivering them in
the environment. Such AGp molecules affect seriously the metabolic activity of
normal cells. The network of AGp molecules delivered in the body fluids, by
diffusion and through vessels, increases further as the inability of the normal cells to
fix such AGp molecules to the surface membrane increases too, as it decreases the
differentiation of RC . The most prominent effect due to the increase of AGp
molecules in neighboring tissues and in the end in the entire organism, can be
recognized in a some kind of cytotoxicity, leading in the end to the cell death.
The above reported one would be the process of carcinogenesis, as can be outlined
according to the model.
On the other hand, if the ability to synthesize normal Gp molecules is modified to a
degree not high enough, or of a kind not different enough, the delivering of AGp
molecules into the neighboring tissues and entire organism does nor occur. Such cells
keep on the outer surface a high enough number of AGp molecules (a phenomenon
that would occur more frequently) and by a process very close to the one of the
normal cell they form strong enough linkages - and/or in a number high enough -
with neighboring cells (to an extent related to the actual difference between GP and
AGp molecules) to build a tumor-like structure. Following the type and/or extent
[the nature] of such inter-cells linkages, as it come from the kind of the modification
undergone by Gp molecules, the growing activity may be self-limiting and or

12
anyhow not affecting the body cells down to the host death. To a process of the latter
kind would be ascribed the one of the benign tumor development.
Human tumor growth kinetics.
The principal object of studies about the tumor cell population kinetics is to explain
how a tumor attains its particular growth rate, and thus to reach a more informed
judgement on methods of growth control (Steel, Adams and Barret, 1966).
As at is well known, the size and weight of solid tumors could be directly measurable
parameters. Estimates of the size can be obtained by external measurements using
vernier caliper (tumors arising in the skin or in soft tissues), the measures including
the greatest and/or mean diameter, tumor area or volume (Lala, 1971). Most data can
be obtained from sequential measurements on plain films as in chest X-rays for
pulmonary metastases and primary bronchial carcinomas, or from mammography for
breast cancers, or on films where a contrast medium has been used (Tubiana and
Malaise, 1976). It has been shown, as for breast cancers and pulmonary metastases,
that there is a close agreement between the size of the excised tumor measured
directly and that calculated from radiographs showing the tumor in situ [Contesso et
al., 1971; Weiss, 1971]. But only lesions from untreated patients can be considered
suitable for studies of the growth rata of tumors, while the precision of the measures
is affected by both the time intervals between observations and the growth rate itself
of the tumor. Conflicting situations arise very often and mostly concerning ethical
considerations, obviously, since to obtain a high number of measurements, the
growing tumor would not be subjected to a treatment of any kind, leaving the illness
to worsen. It follows that the majority of observations have been made on the basis of
only a few (2-4) radiographs.
When, as it is the case with experimental tumors [animal solid neoplasms,
spontaneous or transplanted, animal ascitic tumors, leukemia] it is valid to calculate
an average growth curve, the result is usually a smooth curve which is convex

13
upwards in semi-Log plot [Tubiana, 1971; Sommers, 1973; Steel, 1982). The curve
may be fitted by the common Gompertz equation [McCredie et al., 1965; Laird,
1969):
St = So * e (A/a*(1 – exp (-a*t)))
[15]
where St and So are the tumor size at the time t and the initial size, respectively; ‘A’
is the specific growth rate in the observation period and ‘a’ is the rate of exponential
decay of A.
Clearly, the equation [15], able to describe a wide variety of biological, physical,
technological, economic events (Sommers, 1973) does add very little or nothing to
the knowledge of the cancerous phenomenon (Steel, 1982).
Tumor growth is rarely exponential, but it is often convenient to regard it of such a
kind over short periods of time (Steel, 1982); if tumor increases linearly with time,
the specific growth rate K would be:
k = (dV/V) *dt [16]
leading to:
V = Vo * e k*t
[17]
and
Ln Vt = Ln Vo + K*t [18]
so that:
Dt = 0.693 / K [19]
where Dt is the tumor volume doubling time.

14
Really, it is impossible to distinguish an exponential growth curve from a
Gompertzian one over such a short period of observation that is achieved in the
practice (Steel and Lamerton, 1966; Tubiana and Malaise, 1976).
Different solutions to the problem were approached [Mendelshon, 1963; Hoffman,
l953; Till et al., 1964; Dethelfsen et al., 1968; Summers, 1966], while their relative
merits stand not yet established.
Very likely, the situation reflects a lack of hypotheses about tumor kinetics, defined
enough to be tested with the required accuracy.
Really, the published models, more or less mathematically complex, provide one or
more kinetic parameter while devoid of defined, although hypothetical, physiological
meaning. It must be recognized moreover, the complete lack [to my knowledge] of
human tumor growth curves over which one could exercise his aim of modeling.
The main experimental data abundance concerns the distribution of the tumor
doubling times. It is commonly accepted that the distribution of the time required to
double the diameter, the volume or the mass of a tumor, can be expected to be of the
log-normal type (Sommers, 1973; Tubiana and Malaise, 1976; Steel, 1982).
The median Dt value is expected to be 50 days (Steel, 1977), 58 days (Charbit et al.,
1971); only 0.1% of the Dt having a value equal or lover than one week and equal or
higher than one year [Tubiana and Malaise, 1976; Steel, 1982).
Tumor size and Dt may vary independently [Steele and Buell, 1973; Kusama et al.,
1972; Tubiana and Malaise, 1976).
A short Dt is believed to indicate a bad prognosis, whether applied to small or to
large tumors. Nevertheless, a large tumor size is an adverse prognostic factor
irrespective of Dt, since it is very often associated with metastases to regional nodes
(Steele and Buell, 1973). Some authors have claimed that cancers which grow more
rapidly are more likely to metastasize [Gershon-Cohen et al., 1963; Slack et al., 1969;
Weiss, 1971; Chahinian, 1972].

15
A relationship could be expected between the Dt value and the survival time (St).
Kusama et al. (1972) have shown that breast cancers having 17 days Dt 15
months lead to 2.3 St 9.3 years. Steele and Buell (1973) have shown that about
20% of patients carrying a primary bronchial carcinoma with a Dt lower than 120
days can survive more than 5 years, while up to 39% of those having the same type of
cancer but with a Dt greater than 135 days might survive more than 5 years.
According to Weiss (1971), at Dt values lower than six months will correspond a St
lower than 4.3 years, while at Dt greater than six months, the St would be greater.
Collecting data of about 180 cases of tumors of five different types [embrional,
haematosarcomas, mesenchimal sarcomas, squamous cell carcinomas and
adenocarcinomas] Tubiana and Malaise (1976) showed that a rough relationship does
exist between Dt and St. From their data, this relationship can be obtained:
St = 7.6172 + 0.1479 * Dt [20]
while the correlation coefficient is quite low (r = 0.93).
According to Steel and Lamerton (1966) the problem of measuring cell production
rate in a tumor is essentially the same as in normal tissues.
The growth kinetics of human tumors, as expected from the proposed model, are
obtained just assuming that the tumor mass grows like an human embryo, the rate of
growth being affected by the number of GP molecules till bound to the surface of the
clonogenic cell. It follows that cancerogenic cells having a GP level not very lover
than the one pertaining to normal cells are expected to grow at a rate not very greater
than the rate of the cells of the host. While the cancerous cells having much lowered
GP molecules level, they will grow very much faster. Anyhow, the reference rate of a
normal mammalian cell is the one expected by the model for a 20 years old person,
that is a cell having a Dt equal or greater than about 1,000 days.
Fig. 5 shows the growth curves of human tumors, as expected by the suggested
model. As can be seen, the curves are represented on the basis of the clonogenic cell

16
number changing as a function of the time, while in parallel ordinates the tumor
weight and the tumor diameter are reported too, for the sake of comparison with more
usual parameters [the latter case is based on the hypothesis of tumors having a
spherical mass].
On the same figure, the Dt values expected at the cell concentration of 109 /tumor
mass [i.e. at a tumor diameter of 1.24 cm on a spherical basis and at the weight of one
g) are also reported.
As can be seen from Fig. 5, the human tumor growth curves are concave upwards, as
expected, and cannot be recognized as exponential unless, according to Tubiana and
Malaise [1976] and Steel (1982) among others, only a limited portion of the curve
[i.e. perhaps one to three Log cycles, as a function of the growing rate of the tumor]
is considered. As previously said, the decreasing rate of the tumors – going from the
curves in the left side of the Fig. 5 towards those on the right side - is obtained
considering that the number of GP molecules still bound to the clonogenic cells
would increase, just coming from the curves in the left side of the Fig. 5, towards
those in the right side.
The number of GP molecules linked to the clonogenic cells changes very little,
although increasing, coming from tumors growing rapidly to the tumors growing
more slowly. At a cell number of 109 the number of GP molecules per clonogenic
unit ranges between 104.8136
and 104.8168
while the Dt ranges between 6.6 and 132
days, respectively. At the tumor cell number ranging from 109
[one g tumor, 1.24 cm
diameter) to 1011
[about 100 g tumor, 5.76 cm diameter], the GP molecules level
ranges between 6 * 104 and 1.5 * 10
7. The latter range is very close to the one
obtained by Salmon (1973) for multiple myeloma.
In a mammalian cell of a 20 years old person the GP molecules amount to 2-6 * 1010
/
single cell. Nevertheless, in order to describe the tumor growth kinetics according to
the suggested model, it is required that the cancerous cell had quite completely lost
the GP molecules linked to the membrane surface at the starting of the cancerogenic

17
process (101 –10
2 clonogenic cells), while increasingly producing GP molecules as
the tumor mass increases. A decrease of molecular equipment of such an extent must
inevitably follows some kind of genetic mutation, whichever the physico-chemical
agent would be primary responsible. Coming back to the above outlined mechanisms
of growth inhibition by cell-to-cell linking through GP molecules, the cancerous cells
had not completely lost the ability to synthesize this type of molecules, but produce
AGp molecules, quite unrecognizable by the cell surfaces of the host. Moreover,
since the number of AGp molecules does not differ significantly, though different
tumors are growing at very different rate, it follows that it can be expected that it
would be the chemical structure of the AGp molecules, the biochemical one basis of
the observed wide range of the clonogenic cell malignancy level, i.e. the wide range
of both Dt and St values, and mostly the metastatic power of the tumor.
The nature of the GP molecules and a therapy outline.
The suggested model cannot go deeper into the carcinogenic process. Nevertheless,
making an attempt to identify the nature of the above called GP molecules, I am very
inclined to believe, on several basis [Rosen et al., l973; Bramwell and Harris, l978,
1979; Ray et al., 1979; Omary et al., 1980; Gahmberg, 1981), that they are
glycoproteins. It can be expected that AGp molecules differ mainly in the
carbohydrate moiety from normal GP molecules, and that the extent of the difference
would be log-normally distributed,
on the analogy of the Dt distribution.
If this would be the case, whether contiguous cells have altered affinity for Gp and/or
AGp molecules, a suitable therapy could bring clonogenic cells to restore some kind
of bonds with neighboring ones, so that a tissue-like structure must be restored,
together with a cell metabolism though differing from the normal one to some degree,
so that the cancerogenic process would be slowed down to be stopped. The new-

18
linking process would be achieved by promoting modification (oxidation, reduction,
methylation?) of suitable AGp molecules site.
The human tumor doubling time.
According to the suggested model, tumors having the same characteristics, as it is
expected for single metastases ( Spratt and Spratt, 1964; Tubiana and Malaise, 1976),
it must have the same Dt, while at the same level of the clonogenic cells number.
Otherwise, also tumors having the same characteristics must have a Dt value
decreasing with the increasing tumor mass.
Nevertheless, according to the literature (Kusama et al. 1972; Steele and Buell, 1973;
Tubiana and Malaise, 1976) there is no correlation between tumor size and Dt,
because at the same size the Dt value is a property of physiological characteristics of
the tumor considered. Such a situation is well described with reference to the Fig. 5.
The metastatic condition.
According to the model, the probability of finding tumor metastases is expected to be
higher in the hosts carrying a tumor having a low Dt (i. e. a high doubling rate), since
high doubling rates are expected to be coupled with highly modified GP molecules,
as said above, and thus with clonogenic cells having a greater motility owing to the
lower contact-inhibition. Several authors besides (Gersom et al, 1963; Slak et al.,
1969; Weiss, 1971; Chahinian, 1972) proved that tumors growing more rapidly are
more likely to metastasize.
The survival time.
Of quite relevant interest is the relationship always shown by the majority of the
clinicians, between the doubling time and the probability of survival, often reported
19
as survival time, St. It is quite useless to make a comparison between the clinical data
and those expected from the model, since the physical, surgical and pharmacological
treatments applied to the patients, inevitably affect the survival time, even though at a
limited extent. Nevertheless, from a pure theoretical standpoint, the two parameters
are expected by the model to be linked by a linear relationship. Tubiana and Malaise
(1976) have outlined a linear relationship between Dt and St, although with a low
correlation coefficient, as seen above. As a matter of fact, the St value is highly
affected by actual tumor mass at the time at which the tumor itself reaches the clinical
level, besides by the Dt.
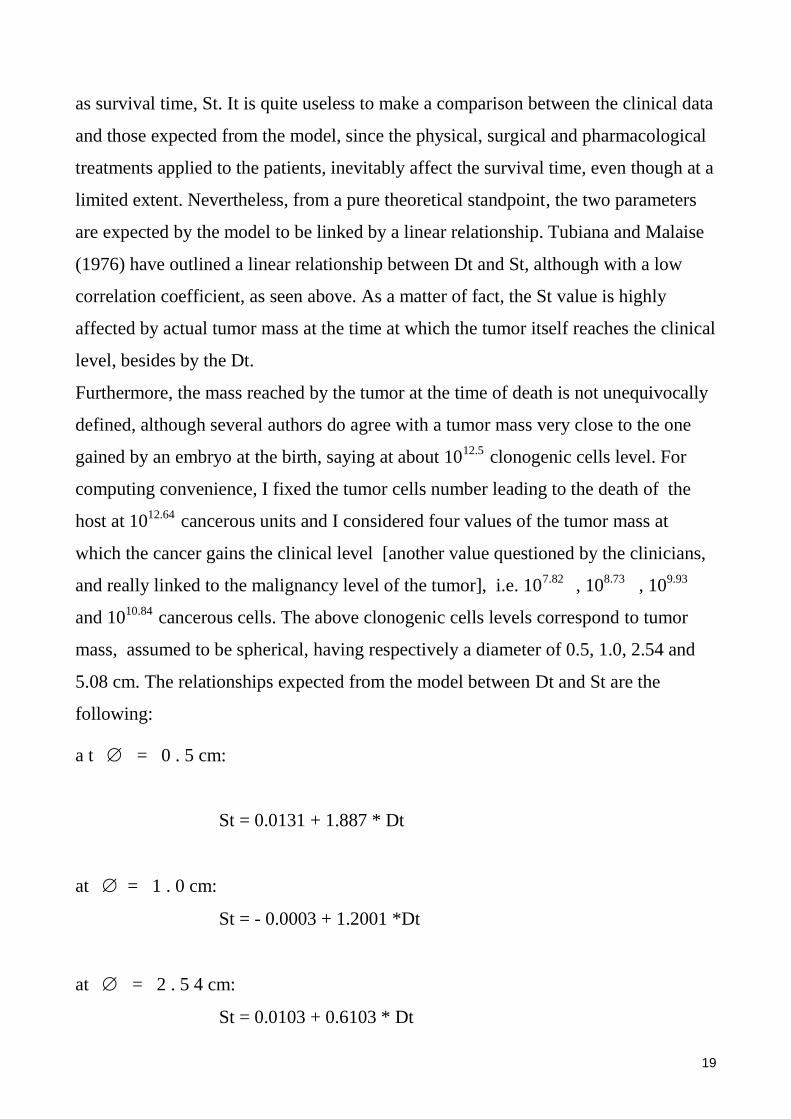
Furthermore, the mass reached by the tumor at the time of death is not unequivocally
defined, although several authors do agree with a tumor mass very close to the one
gained by an embryo at the birth, saying at about 1012.5
clonogenic cells level. For
computing convenience, I fixed the tumor cells number leading to the death of the
host at 1012.64
cancerous units and I considered four values of the tumor mass at
which the cancer gains the clinical level [another value questioned by the clinicians,
and really linked to the malignancy level of the tumor], i.e. 107.82
, 108.73
, 109.93
and 1010.84
cancerous cells. The above clonogenic cells levels correspond to tumor
mass, assumed to be spherical, having respectively a diameter of 0.5, 1.0, 2.54 and
5.08 cm. The relationships expected from the model between Dt and St are the
following:
a t = 0 . 5 cm:
St = 0.0131 + 1.887 * Dt
at = 1 . 0 cm:
St = - 0.0003 + 1.2001 *Dt
at = 2 . 5 4 cm:
St = 0.0103 + 0.6103 * Dt

20
at = 5.08 cm:
St = 0.0122 + 0.3283 * Dt
being always the St value expressed in months and the Dt value in days.
Graphical representation of the above relationships is reported in Figs. 6 and 7.
As it results from the above equations and from the Figs. 6 -7, the most relevant
parameter affecting the host survival is the Dt, which means the extent of the ability
acquired by the tumor to escape the contact inhibition, and ultimately the extent of
the difference between GP and AGp molecules.
As may be seen from Figs. 6-7 too, the earliest the cancer could be evidenced, as
besides it is well known, the longer will be the time available for the cure.
The silent growth
It is a widespread practice in finding a tumor growth curve [or very often a sketch of
curve] to extrapolate to the initial size of the first small clone of cancerous cells,
aiming to define the time at which the tumor induction has been completed.
Really, as stated by Steel and Lamerton (1966) “.. the total portion of a growth curve
which can normally be obtained from a human tumor, is insufficient for more than
the first differential (slope) and the second differential (curve) as wells to be
established in a semi-Log plot”. From the growth data of an experimental multiple
myeloma Salmon (1973) obtained by backward titration a “silent time” [the time
during which the tumor grows at sub-clinical level] of about 20 years on exponential
basis, and only 1-2 years on Gompertzian basis. The above values show very well the
magnitude of the range over which does crowd the actual uncertainty.
According to the suggested model, the carcinogenic process had begun, as shown in
Fig. 8, not more than few years before it gained the clinical level, quite irrespective of
the magnitude of the tumor at the time at which the Dt is recorded.

21
Being the average Dt value of the human tumors about two months (Steel, 1982),
backward extrapolation yields a mean silent time of 1.5 years.
Radiotherapy and chemotherapy
Experimental inactivation curves of animal and human tumor cells have typical
shapes of the inactivation curves already discussed for prokaryons (Casolari, 1981),
i.e. they are sigmoid, exponential or concave in semi-log plot, according to the
physico-chemical agent applied and the cycle phase of the growing cells (Breur,
1966; Van Peperseel, l972; Malaise et al., 1972; Van Peperseel and Breur, 1974;
Skipper and Shabel, 1982).
The aim of the radiotherapy is to kill the greatest number of the tumor cells while
sparing the normal tissue as much as possible (Tubiana, 1971). Taking into account
the very moderate inactivation of the cancerous cells brought about by radiation and
currently used chemicals, very often restricted to only 2-5 Log cycles (Denekamp and
Fowler, 1977; Fowler and Denekamp, 1977; Hall, 1977; Kallman and
Rockwell,1977; Skipper and Shabel, 1982), the aim to cure the cancer by available
physical and/or chemical means alone can be regarded as quite hopeless. Combined
treatments would be expected of greater effectiveness, above all if coupled, when
possible, with the surgical practice
[Corbett et al., 1975; Fugman et al., l970; Griswold and Corbett, l976; Skipper and
Shabel, 1982]. It is well known that few surviving clonogenic cells would be the
starting points for the quite unavoidable recurrence phenomena (Skipper et al., 1964;
Wilcox, 1966; Brockman, 1974; Shabel, 1975). So, the applied therapy must kill the
highest number of cancerogenic cells. As it is extensively discussed otherwise for
prokaryions [Casolari, 1981], the destruction of the highest number of cells – up to
the highest attainable – can be obtained only by increasing at will – when feasible –
the killing power of the applied agents. The recurrence phenomena can be avoided

22
only by decreasing the survival probability of clonogenic cells to the lowest possible
level. And this target can be obtained with the highest probability by therapies
employing multiple physical and/or chemical agents, simultaneously.
Only simultaneous application of lethal - radiative/thermal/chemical - agents could be
effective in killing tumor cells.
Carcinogens and carcinogenesis
The known carcinogens are expected to bind to the DNA. If the above suggested
model is not very far from the reality, the cancerogenic substances are such
chemicals able to link to DNA sites coding for the chemical characteristics of the
GP molecules and mostly their carbohydrate moiety.
Conclusions
According to the model, the growth rate of the human cell decreases continuously,
beginning from the embryonic level of 32 cells. There is only one requirement that
must be met in order to describe the human body and the human tumor development
curves: the continuously decreasing growth rate of the mammalian cell must be due
to the extent of the cell-to-cell adhesion, causing an increasing inhibition of the
metabolic activity. The inter-cells linkages would be brought about by molecules
linked to the outer surface of the cell membrane. The above molecules are expected
to be glycoproteins.
The carcinogenic substances interact with the DNA fraction coding for the surface
glycoproteins and probably the carbohydrate moiety. The cells carrying modified
glycoproteins at the surface become clonogenic to a more or less degree, according,
to the extent of the modification occurred in the glycoproteins at the cell surface.
Meeting this requirement, all relevant observations concerning human growth curve,

23
(senescence), death and the human tumor growth behavior can be described. From
the above single basis, a therapeutic approach to tumor diseases can be envisaged.
REFERENCES
C:\Users\vency\Documents\SCANSIONI personali\2012-06 (giu)