HU151: Industrial Safety Prof. Dr. Abdelsamie Moet Fall 2012/13 Pharos University in Alexandria...
30
HU151: Industrial Safety Prof. Dr. Abdelsamie Moet Fall 2012/13 Pharos University in Alexandria Faculty of Engineering Lecture 2: Overview
-
Upload
juliet-hopkins -
Category
Documents
-
view
216 -
download
0
Transcript of HU151: Industrial Safety Prof. Dr. Abdelsamie Moet Fall 2012/13 Pharos University in Alexandria...

HU151: Industrial Safety
Prof. Dr. Abdelsamie Moet
Fall 2012/13
Pharos University in AlexandriaFaculty of Engineering
Lecture 2: Overview
HU151, Lect2, Overview 2

HU151, Lect2, Overview 3
Industrial Safety
Contextual definitions

HU151, Lect2, Overview 4
IndustrialSafety
OccupationalSafety
EnvironmentalSafety
ProductSafety

HU151, Lect2, Overview 5
Includes, but not limited to:
• SAFETY MANAGEMENT• PLANT LAYOUT• MATERIALS HANDLING• OCCUPATIONAL HEALTH • FIRE PREVENTION AND CONTROL• HAZARD ANALYSIS• ELECTRICAL SAFETY• ERGONOMICS
IndustrialSafety

HU151, Lect2, Overview 6
Safety Defined
• U.S. National Safety Council –
"Safety" is the control of hazards to attain an acceptable level of risk.
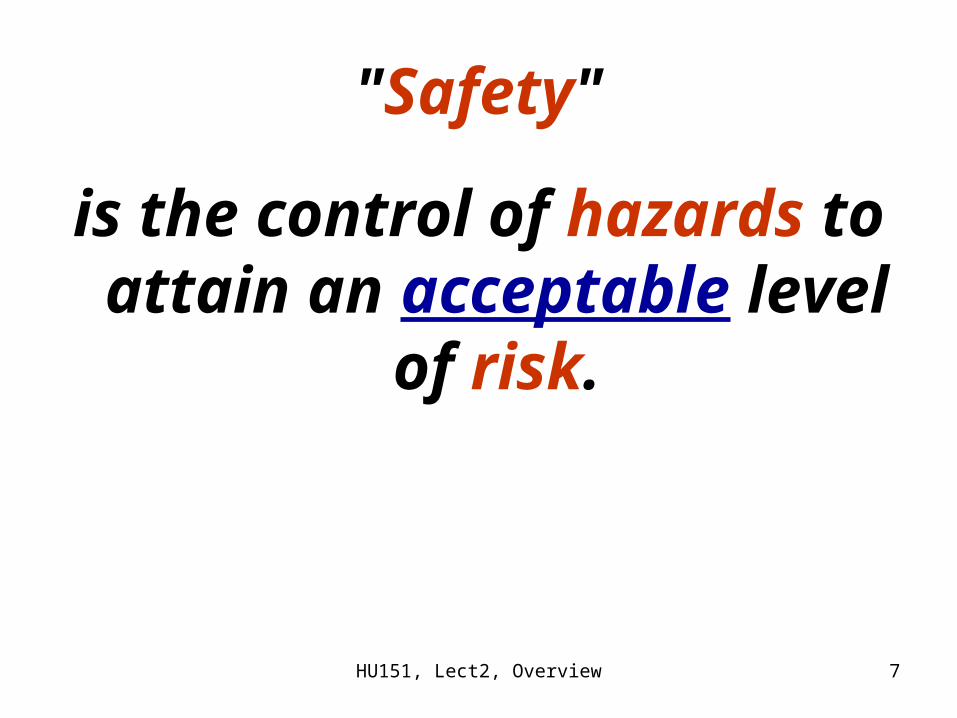
HU151, Lect2, Overview 7
"Safety"
is the control of hazards to attain an acceptable level
of risk.

HU151, Lect2, Overview 8
"Safety"
HazardAcceptable
Risk
the control of hazards to attain an acceptable level of risk

HU151, Lect2, Overview 9
Hazard
• Hazard are defined as the
"potential for harm or damage to people, property, or the environment" and are the "source of risk".
Hazards include:- the characteristics of things-"actions" or "inactions" of people.
As such, they are the "base" of all safety concerns

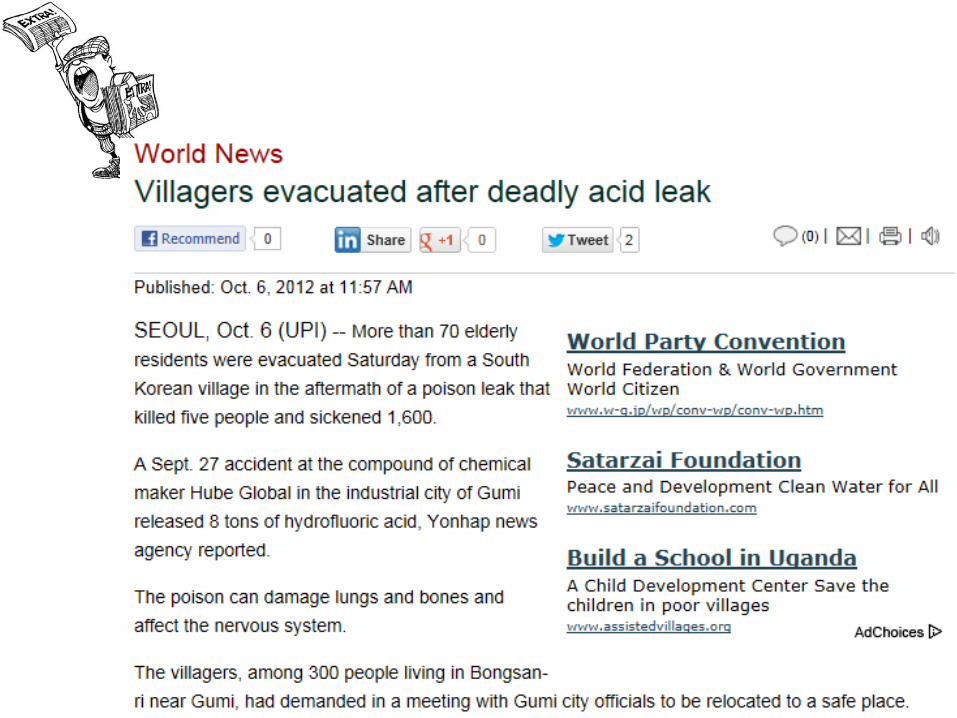
HU151, Lect2, Overview 10
HAZARDS
“Events or physical conditions that have the potential to cause fatalities, injuries, property damage, infrastructure damage, damage to the environment, interruption of business, or other types of harm or loss.”
- FEMA, 1997
FEMA. 1997. Multi Hazard Identification and Assessment. FEMA. Washington, D.C.

HU151, Lect2, Overview 11
Hazard Categories1. Biological - bacteria, viruses, insects, plants, birds and
animals, etc.,2. Chemical - depends on the physical, chemical and toxic
properties of the chemical.3. Ergonomic - repetitive movements, improper set up of
workstation, etc., 4. Psychosocial - stress, violence, etc., 5. Physical (Mechanical, Electrical)
- slipping/tripping, - inappropriate machine guarding, equipment malfunctions or breakdowns.- radiation, magnetic fields, pressure extremes (high pressure or vacuum), noise, etc,

HU151, Lect2, Overview 12
Common Hazards in the Workplace
Stressor Type Type Type
Chemical Corrosive Fire
Explosion
Toxic
Electrical Shock Short Circuit
Fire-Static
Mechanical Moving Parts
Failure Noise
Pressure
Ergonomic Strain Human Error
Fatigue

HU151, Lect2, Overview 13
Common Hazards in the Workplace
Stressor Type Type Type
Radiation Ionizing Non
Ionizing
Contact Struck By Struck Against
Caught In
Environment Temp. Visibility Weather
Misc. Slips Trips Falls

HU151, Lect2, Overview 14
Risk*
"A measure of the probability and severity of adverse effects"
-------------------------------* Of acceptable risk: science and the determination of safety, William W.
Lowrance,1976, W. Kaufmann (Los Altos, Calif)

HU151, Lect2, Overview 15
Hazard

HU151, Lect2, Overview 16
Deliverables of RM Process
Process DeliverableRisk Identification Risk Register
Risk Assessment Risk Assessment Matrix
Risk Response Planning Risk Response Plan
Risk Monitoring and Review Updated Risk Register

HU151, Lect2, Overview 17
Risk Matrix

HU151, Lect2, Overview 18
Tools of Risk Analysis • Cause-Consequence Analysis• Reliability Centered Maintenance• Hazard and Operability Studies
(HAZOP)• Bow-tie Analysis• Brainstorming• Structured interviews• Delphi• Check-lists• Primary Hazard Analysis• Hazard Analysis and Critical Control
Points (HACCP)• Environmental Risk Assessment• Structure <What if?> (SWIFT)• Scenario Analysis• Business Impact Analysis• Root Cause Analysis
• Fault Tree Analysis • Event Tree Analysis• Cause and Effect Analysis• Layer Protection Analysis (LOPA)• Decision Tree• Human Reliability Analysis• Sneak Circuit Analysis• Markov Analysis• Monte Carlo Simulation• Bayesian Statistics and Bayes Nets• FN Curves• Risk Indices• Consequence/Probability Matrix• Cost/Benefit Analysis• Multi-criteria Decision Analysis
(MCDA)
• Failure Mode Effect Analysis

HU151, Lect2, Overview 19
Cause-and-Effect Diagram
• The Cause-and-Effect Diagram was created by Dr. Kaoru Ishikawa, an engineer and professor in Japan.
• The Cause-and-Effect Diagram is also referred to as a "Fishbone" diagram, getting the name from its resemblance to a fish skeleton when created.
• The main purpose of this diagram is to define a problem, identify a possible cause, isolate the cause, and then develop a solution.

HU151, Lect2, Overview 20
Fishbone Analysis: 5ME1. MAN - Does the operator have the proper training, experience, and
ability to perform the function?2. METHOD - Are the work instructions available and up-to-date? Do they
reflect the best method to perform the task? Are the proper tools available? Are the process parameters specified clearly?
3. MACHINE - Does the machine have the capability to produce the product as specified? Does the machine have the ability to produce the product on a consistent basis? Are there regular routine maintenance and preventative maintenance tasks? Are they performed according to schedule?
4. MATERIAL - Are the correct materials available for the process? What is the quality of the material used in the process? Is there more than one supplier and does quality vary with different suppliers? What types of material problems could exist?
5. MEASUREMENT - Are the measurement instruments adequate for the process? Are they maintained correctly and regularly calibrated? Are the measurement instruments affected by environmental conditions such as temperature, vibration, dirt, etc.?
6. ENVIRONMENT - Is the manufacturing environment affected by temperature, humidity, dust and dirt, power fluctuations or seasonal differences?
• The real problem becomes which one of the above factors is either totally, mostly, or somewhat responsible for the cause of our problem? Or is it a combination of several causes?

HU151, Lect2, Overview 21
Procedure for Fishbone Analysis
1. First, formulate the problem and write it in a box on the right side of the diagram. Everyone must clearly understand the nature of the problem and the process/product being discussed. If everyone is not clear on the purpose of the session, the session will not resolve the problem.
2. Next, draw an arrow from the left side of your chart or board, over to the right side and make and arrowhead point. To the right of the arrowhead, place your "problem" topic. This arrow is called the "EFFECT" arrow.
3. Now place your main "fishbones" in place, the "5 M's" and the "E", laying it out as illustrated. If using a drawing board or flip chart, draw the slanted lines in place and label them, spacing each slanted "bone" apart so as to be able to place smaller "bones" on the main bones. Once your chart is prepared, you are ready to begin the "brain storm" session.

HU151, Lect2, Overview 22

HU151, Lect2, Overview 23
HAZOP
http://www.isograph-software.com/2011/software/hazop/
Hazard and Operability Study

HU151, Lect2, Overview 24
Hazard and Operability Study (HAZOP)
• Hazard and Operability Study (or HAZOP Study) is a risk analysis technique used for new systems or modifications to existing ones.
• The HAZOP study is a detailed examination, by a group of specialists, of components within a system to determine what would happen if that component were to operate outside its normal design mode.
• The effects of such behavior is then assessed and noted down on study forms. The categories of information entered on these forms can vary from industry to industry.

HU151, Lect2, Overview 25
HAZOP Guide words :
NO OR NOT = Complete negation of the design intent
MORE = Quantitative increase
LESS = Quantitative decrease
AS WELL AS = Qualitative modification/increase
PART OF = Qualitative modification/decrease
REVERSE = Logical opposite of the design intent
OTHER THAN = Complete substitution
EARLY = Relative to the clock time
LATE = Relative to the clock time
BEFORE = Relating to order or sequence
AFTER = Relating to order or sequence

HU151, Lect2, Overview 26

HU151, Lect2, Overview 27

HU151, Lect2, Overview 28
Components of a Plan
Strategy
Execution Resources

HU151, Lect2, Overview 29
Risk Response Strategies
• Four main response strategies for negative risks:
1. Risk avoidance
2. Risk acceptance
3. Risk transference
4. Risk mitigation

HU151, Lect2, Overview 30


![Pharos Manual[1].pdf](https://static.fdocuments.us/doc/165x107/577cc34f1a28aba711959d3c/pharos-manual1pdf.jpg)