HTL INTERNATIONAL HOLDINGS LIMITED · Cash flows used in operations ... Effect of exchange rate...
22
HTL INTERNATIONAL HOLDINGS LIMITED First Quarter Financial Statements Announcement For the Period Ended 31 March 2016 (Incorporated in Singapore) (Registration Number: 198904162H)
Transcript of HTL INTERNATIONAL HOLDINGS LIMITED · Cash flows used in operations ... Effect of exchange rate...
HTL INTERNATIONAL HOLDINGS LIMITED
First Quarter Financial Statements Announcement
For the Period Ended
31 March 2016
(Incorporated in Singapore) (Registration Number: 198904162H)

CONTENTS Page 1. CONSOLIDATED INCOME STATEMENT AND STATEMENT OF COMPREHENSIVE INCOME 1 2. BALANCE SHEETS 2 3. STATEMENTS OF CHANGES IN EQUITY 3 - 4 4. CONSOLIDATED CASH FLOW STATEMENT 5 5. NOTES TO THE FINANCIAL STATEMENTS 6 - 10 6. AUDIT 10 7. AUDITOR’S REPORT 10 8. ACCOUNTING POLICIES 10 9. CHANGES IN THE ACCOUNTING POLICIES 10 10. REVIEW OF GROUP PERFORMANCE 11 – 14 11. VARIANCE FROM PROSPECT STATEMENT 14 12. OUTLOOK 14 13. KEY BUSINESS RISKS 14 – 16 14. DIVIDEND 16 15. SEGMENTAL INFORMATION 17 – 19
16. CONFIRMATION PURSUANT TO RULE 720 (1) OF THE LISTING MANUAL 19
17. CONFIRMATION PURSUANT TO RULE 705 (5) OF THE LISTING MANUAL 19

1
1. CONSOLIDATED INCOME STATEMENT AND STATEMENT OF COMPREHENSIVE INCOME For the First Quarter Ended 31 March 2016 (“Q1 2016”)
CONSOLIDATED INCOME STATEMENT
Change
Notes 2016 2015 %
US$’000 US$’000
Revenue 106,120 109,067 (2.7)
Cost of sales (71,269) (77,920) (8.5)
Gross profit 34,851 31,147 11.9
Other operating income 642 986 (34.9)
Sales, marketing and distribution expenses (22,255) (26,774) (16.9)
Administrative expenses (7,188) (7,838) (8.3)
Other operating expenses (2,144) (233) 820.2
Operating profit/(loss) before finance income and expense and net foreign exchange gain 5A 3,906 (2,712) NM
Finance income 16 23 (30.4) Net foreign exchange loss from
Finance expense (352) (362) (2.8)
Operating profit/(loss) before net foreign exchange gain
3,570 (3,051) NM
Net foreign exchange gain* 1,942 3,121 (37.8)
Profit before tax 5,512 70 7,774.3
Income tax expense 5B (1,850) (647) 185.9
Net profit/(loss) for the period 3,662 (577) NM
Attributable to:
Owners of the Company 3,751 (582) NM
Non-controlling interest (89) 5 NM
3,662 (577)
CONSOLIDATED STATEMENT OF COMPREHENSIVE INCOME
Net profit/(loss) for the period 3,662 (577) NM
Other comprehensive income/(loss):
Foreign currency translation arising from consolidation 1,340 (545) NM
Total comprehensive income/(loss) for the period 5,002 (1,122)
Attributable to:
Owners of the Company 5,057 (1,123) NM
Non-controlling interest (55) 1 NM
5,002 (1,122)
Gross profit margin (GP%) 32.8% 28.6%
Net profit/(loss) margin 3.5% -0.5%
EBITDA 7,224 2,169
EBITDA before net foreign exchange gain 5,282 (952)
EBITDA margin 6.8% 2.0%
EBITDA margin before net foreign exchange gain 5.0% -0.9%
NM : Not meaningful
Item that may be reclassified subsequently to income statement:
The Group
3 months ended 31 Mar
2016 2015
US$'000 US$'000
Net foreign exchange gain comprises:
Realised foreign exchange gain 579 6,147
Unrealised foreign exchange loss (558) (860)
Net fair value gain/(loss) on derivative
financial instruments (1)
1,921 (2,166)
Total net foreign exchange gain* 1,942 3,121
Note:
(1) These fair value adjustments are unrealised and non-cash in nature.
3 months ended 31 Mar
The Group

2
2. BALANCE SHEETS
Notes 31 Mar 2016 31 Dec 2015 31 Mar 2016 31 Dec 2015
US$'000 US$'000 US$'000 US$'000
Current assets
Cash and short-term deposits 35,197 42,487 6 8
Trade and other receivables 55,014 49,970 680 672
Inventories 5C 133,377 133,212 - -
Tax recoverable 12 - - -
Deposits 5,173 5,134 2,534 2,534
Prepayments 6,223 4,315 12 -
234,996 235,118 3,232 3,214
Non-current assets
Investments in subsidiaries - - 91,049 88,049
Property, plant and equipment 43,767 44,044 - -
Intangible assets 5D 7,628 7,849 - -
Deferred tax assets 2,386 2,631 - -
Other receivables 343 342 - -
54,124 54,866 91,049 88,049
Total assets 289,120 289,984 94,281 91,263
Current liabilities
Trade and other payables 68,941 70,612 4,469 4,494
Current income tax liabilities 686 1,147 - -
Derivative financial instruments (i) 1,562 3,483 - -
Bank loans 5E 8,814 5,286 - -
Bills payable 5E 35,939 42,985 - -
Provision for warranty 3,490 2,741 - -
119,432 126,254 4,469 4,494
Non-current liabilities
Deferred tax liabilities 1,721 771 771 771
Advances from a subsidiary - - 34,023 31,940
1,721 771 34,794 32,711
Total liabilities 121,153 127,025 39,263 37,205
Net assets 167,967 162,959 55,018 54,058
Equity attributable to owners
of the Company
Share capital 5F 67,982 67,982 67,982 67,982
Treasury shares 5F (5,025) (5,062) (5,025) (5,062)
Non-distributable reserves 23,025 21,750 (1,156) (1,125)
Retained earnings 81,207 77,456 (6,783) (7,737)
167,189 162,126 55,018 54,058
Non-controlling interest 778 833 - -
Total equity 167,967 162,959 55,018 54,058
Group net borrowings 9,556 5,784 NA NA
Group net gearing (%) 5.72 3.57 NA NA
Net tangible assets per share (cents) 39.92 38.61 13.76 13.53
NA : Not applicable
Note :
(i) This represents fair value arising from the mark to market (MTM) on all outstanding foreign exchange forward
contracts/options which are entered into to hedge currency exchange exposure as at the end of each financial
period/year.
The Group The Company

3
3. STATEMENTS OF CHANGES IN EQUITY Group
Share
capital
Treasury
shares
Share
option
reserve
Foreign
currency
translation
reserve
Capital
reserve
Statutory
reserve
fund
Retained
earnings
Equity
attributable to
owners of the
company, total
Non-
controlling
interest
Equity,
total
US$'000 US$'000 US$'000 US$'000 US$'000 US$'000 US$'000 US$'000 US$'000 US$'000
Balance at 1 January 2016 67,982 (5,062) 911 10,890 (2,036) 11,985 77,456 162,126 833 162,959
Net profit/(loss) for the quarter - - - - - - 3,751 3,751 (89) 3,662
Other comprehensive income
Foreign currency translation
arising from consolidation - - - 1,306 - - - 1,306 34 1,340
Total comprehensive income/(loss) - - - 1,306 - - 3,751 5,057 (55) 5,002
Treasury shares reissued pursuant
to employee share option plan - 37 - - (31) - - 6 - 6
Balance at 31 March 2016 67,982 (5,025) 911 12,196 (2,067) 11,985 81,207 167,189 778 167,967
Balance at 1 January 2015 67,982 (3,945) 911 19,141 (2,036) 11,770 79,301 173,124 852 173,976
Net (loss)/profit for the quarter - - - - - - (582) (582) 5 (577)
Other comprehensive loss
Foreign currency translation
arising from consolidation - - - (541) - - - (541) (4) (545)
Total comprehensive (loss)/income - - - (541) - - (582) (1,123) 1 (1,122)
Purchase of treasury shares - (248) - - - - - (248) - (248)
Balance at 31 March 2015 67,982 (4,193) 911 18,600 (2,036) 11,770 78,719 171,753 853 172,606
Net (loss)/profit for the quarter - - - - - - (1,878) (1,878) 10 (1,868)
Other comprehensive income/(loss)
Foreign currency translation
arising from consolidation - - - 574 - - - 574 (4) 570
Total comprehensive income/(loss) - - - 574 - - (1,878) (1,304) 6 (1,298)
Balance at 30 June 2015 67,982 (4,193) 911 19,174 (2,036) 11,770 76,841 170,449 859 171,308
Net profit for the quarter - - - - - - 73 73 10 83
Other comprehensive loss
Foreign currency translation
arising from consolidation - - - (5,525) - - - (5,525) (26) (5,551)
Total comprehensive (loss)/income - - - (5,525) - - 73 (5,452) (16) (5,468)
Purchase of treasury shares - (869) - - - - - (869) - (869)
Balance at 30 September 2015 67,982 (5,062) 911 13,649 (2,036) 11,770 76,914 164,128 843 164,971
Net profit/(loss) for the quarter - - - - - - 757 757 (1) 756
Other comprehensive loss
Foreign currency translation
arising from consolidation - - - (2,759) - - - (2,759) (9) (2,768)
Total comprehensive (loss)/income - - - (2,759) - - 757 (2,002) (10) (2,012)
Transfer from retained earnings
to statutory reserve fund - - - - - 215 (215) - - -
Balance at 31 December 2015 67,982 (5,062) 911 10,890 (2,036) 11,985 77,456 162,126 833 162,959
ATTRIBUTABLE TO OWNERS OF THE COMPANY

4
3. STATEMENTS OF CHANGES IN EQUITY (Cont’d) Company
Share capital
Treasury
shares
Share option
reserve
Capital
reserve
Retained
earnings Equity, total
US$’000 US$’000 US$’000 US$’000 US$’000 US$’000
Balance at 1 January 2016 67,982 (5,062) 911 (2,036) (7,737) 54,058
Net profit for the quarter, representing total
comprehensive income for the quarter - - - - 954 954
Treasury shares reissued pursuant
to employee share option plan - 37 - (31) - 6
Balance at 31 March 2016 67,982 (5,025) 911 (2,067) (6,783) 55,018
Balance at 1 January 2015 67,982 (3,945) 911 (2,036) 4,023 66,935
Net profit for the quarter, representing total
comprehensive income for the quarter - - - - 885 885
Purchase of treasury shares - (248) - - - (248)
Balance at 31 March 2015 67,982 (4,193) 911 (2,036) 4,908 67,572
Net loss for the quarter, representing total
comprehensive loss for the quarter - - - - (245) (245)
Balance at 30 June 2015 67,982 (4,193) 911 (2,036) 4,663 67,327
Net profit for the quarter, representing total
comprehensive income for the quarter - - - - 2,024 2,024
Purchase of treasury shares - (869) - - - (869)
Balance at 30 September 2015 67,982 (5,062) 911 (2,036) 6,687 68,482
Net loss for the quarter, representing total
comprehensive loss for the quarter - - - - (14,424) (14,424)
Balance at 31 December 2015 67,982 (5,062) 911 (2,036) (7,737) 54,058

5
4. CONSOLIDATED CASH FLOW STATEMENT
2016 2015
US$’000 US$’000
Operating activities
Net profit/(loss) for the period 3,662 (577)
Adjustments for :
Income tax expense 1,850 647
Depreciation of property, plant and equipment 1,101 1,448
Amortisation of intangible assets 275 312
Net loss on disposal of property, plant and equipment 96 16
Interest income (16) (23)
Interest expense 352 362
Property, plant and equipment written off 1,129 12
Warranty provision 2,609 2,440
Net fair value (gain)/loss on foreign exchange derivative instruments (1,921) 2,166
Unrealised foreign exchange translation differences 490 92
Operating cash flows before changes in working capital 9,627 6,895
Inventories (165) 1,285
Trade and other receivables, deposits and prepayments (6,992) 6,991
Provision for warranty (1,861) (3,352)
Trade and other payables (1,671) (17,601)
Cash flows used in operations (1,062) (5,782)
Income taxes paid (1,128) (612)
Net cash flows used in operating activities (2,190) (6,394)
Investing activities
Proceeds from disposal of property, plant and equipment 16 2
Purchase of property, plant and equipment (1,533) (1,677) Purchase of intangible assets (1) (47)
Interest received 16 23
Net cash flows used in investing activities (1,502) (1,699)
Financing activities
Interest paid (352) (362)
Repayment of bank term loans (79) (2,326)
(Repayment of)/proceeds from short-term borrowings (3,439) 12,035
Purchase of treasury shares - (248)
Proceeds from re-issuance of treasury shares 6 -
Net cash flows (used in)/from financing activities (3,864) 9,099
Net (decrease)/increase in cash and cash equivalents (7,556) 1,006
Effect of exchange rate changes on cash and cash equivalents 266 (311) Cash and cash equivalents at the beginning of the financial period 42,487 35,815
Cash and cash equivalents at the end of the financial period(1)
35,197 36,510
Free Cash Flow (2)
(3,724) (8,118)
Notes:
(1) Cash and cash equivalents comprise cash on hand, deposits with banks, net of bank overdrafts.
(2) Free cash flow is defined as net cash from operating activities less capital expenditure.
The Group
3 months ended 31 Mar

6
5. NOTES TO THE FINANCIAL STATEMENTS
A. Operating profit/(loss) before finance income and expense and net foreign exchange gain
This is arrived at after charging/(crediting) the following:
2016 2015
US$'000 US$'000
Depreciation of property, plant and equipment 1,101 1,448
Amortisation of intangible assets 275 312
Total depreciation and amortisation 1,376 1,760
Reversal of impairment of trade receivables (9) (238)
Bad trade debts (recovered)/written off (2) 246
Allowance made for slow moving and obsolete inventories 344 379
Warranty and claim expenses 3,247 3,241
Employee benefits 20,782 21,561
Net loss on disposal of property, plant and equipment 96 16
Property, plant and equipment written off 1,129 12
The Group
3 months ended 31 Mar
B. Income tax expense
2016 2015
US$'000 US$'000
Tax expense attributable to profit is made up of:
Current income taxes:
- Current income tax 572 182
- Under provision in respect of previous years 7 8
Deferred income taxes:
- Current deferred tax 1,207 457
Witholding taxes (1)
64 -
1,850 647
The Group
3 months ended 31 Mar
Note:
(1) These represent withholding tax paid on the dividends declared by overseas subsidiaries.
As a result of higher profitability, the Group’s income tax expense increased from US$0.6 million in Q1 2015 to US$1.9 million in Q1 2016.

7
5. NOTES TO THE FINANCIAL STATEMENTS (Cont’d)
C. Inventories
31 Mar 2016 31 Dec 2015
US$'000 US$'000
Raw materials 61,757 61,695
Work-in-progress 22,259 20,718
Finished goods 49,361 50,799
133,377 133,212
The Group
D. Intangible assets
Goodwill
on
Acquisition IP Rights
Computer
Software
Licenses &
Development
Costs Total
US$'000 US$'000 US$'000 US$'000
Group
Cost
At 1 January 2015 620 13,140 10,794 24,554
Additions - - 246 246
Write-off - - (34) (34)
Exchange rate adjustments (63) - (16) (79)
At 31 December 2015 and
1 January 2016 557 13,140 10,990 24,687
Additions - - 1 1
Write-off - - (7) (7)
Exchange rate adjustments 21 - 85 106At 31 March 2016 578 13,140 11,069 24,787
Accumulated amortisation
At 1 January 2015 - 6,065 9,567 15,632
Charge for the financial year - 653 592 1,245
Write-off - - (34) (34)
Exchange rate adjustments - - (5) (5)
At 31 December 2015 and
1 January 2016 - 6,718 10,120 16,838
Charge for the financial period - 163 112 275
Write-off - - (7) (7)
Exchange rate adjustments - - 53 53 At 31 March 2016 - 6,881 10,278 17,159
Net book value
At 31 December 2015 557 6,422 870 7,849
At 31 March 2016 578 6,259 791 7,628
8
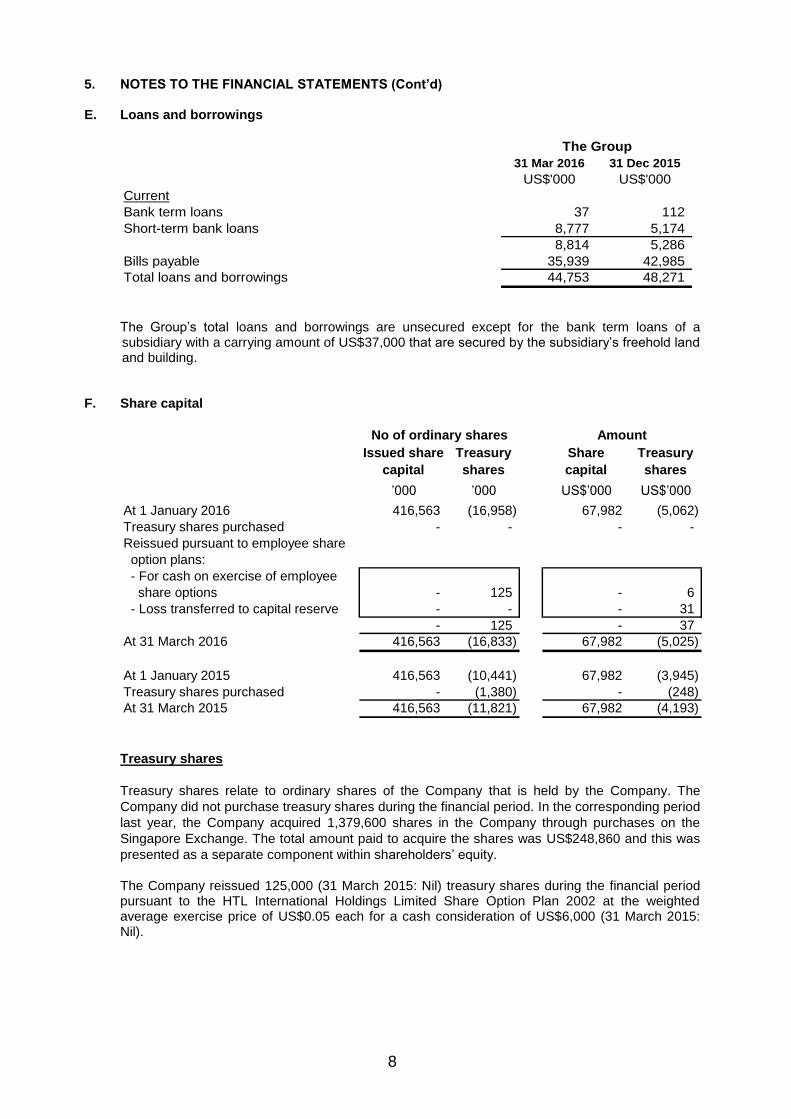
5. NOTES TO THE FINANCIAL STATEMENTS (Cont’d) E. Loans and borrowings
31 Mar 2016 31 Dec 2015
US$'000 US$'000
Current
Bank term loans 37 112
Short-term bank loans 8,777 5,174
8,814 5,286
Bills payable 35,939 42,985
Total loans and borrowings 44,753 48,271
The Group
The Group’s total loans and borrowings are unsecured except for the bank term loans of a subsidiary with a carrying amount of US$37,000 that are secured by the subsidiary’s freehold land and building.
F. Share capital
Issued share
capital
Treasury
shares
Share
capital
Treasury
shares
’000 ’000 US$’000 US$’000
At 1 January 2016 416,563 (16,958) 67,982 (5,062)
Treasury shares purchased - - - -
Reissued pursuant to employee share
option plans:
- For cash on exercise of employee
share options - 125 - 6
- Loss transferred to capital reserve - - - 31
- 125 - 37
At 31 March 2016 416,563 (16,833) 67,982 (5,025)
At 1 January 2015 416,563 (10,441) 67,982 (3,945)
Treasury shares purchased - (1,380) - (248)
At 31 March 2015 416,563 (11,821) 67,982 (4,193)
No of ordinary shares Amount
Treasury shares
Treasury shares relate to ordinary shares of the Company that is held by the Company. The
Company did not purchase treasury shares during the financial period. In the corresponding period
last year, the Company acquired 1,379,600 shares in the Company through purchases on the
Singapore Exchange. The total amount paid to acquire the shares was US$248,860 and this was
presented as a separate component within shareholders’ equity.
The Company reissued 125,000 (31 March 2015: Nil) treasury shares during the financial period pursuant to the HTL International Holdings Limited Share Option Plan 2002 at the weighted average exercise price of US$0.05 each for a cash consideration of US$6,000 (31 March 2015: Nil).
9
5. NOTES TO THE FINANCIAL STATEMENTS (Cont’d) F. Share capital (Cont’d)
Share options
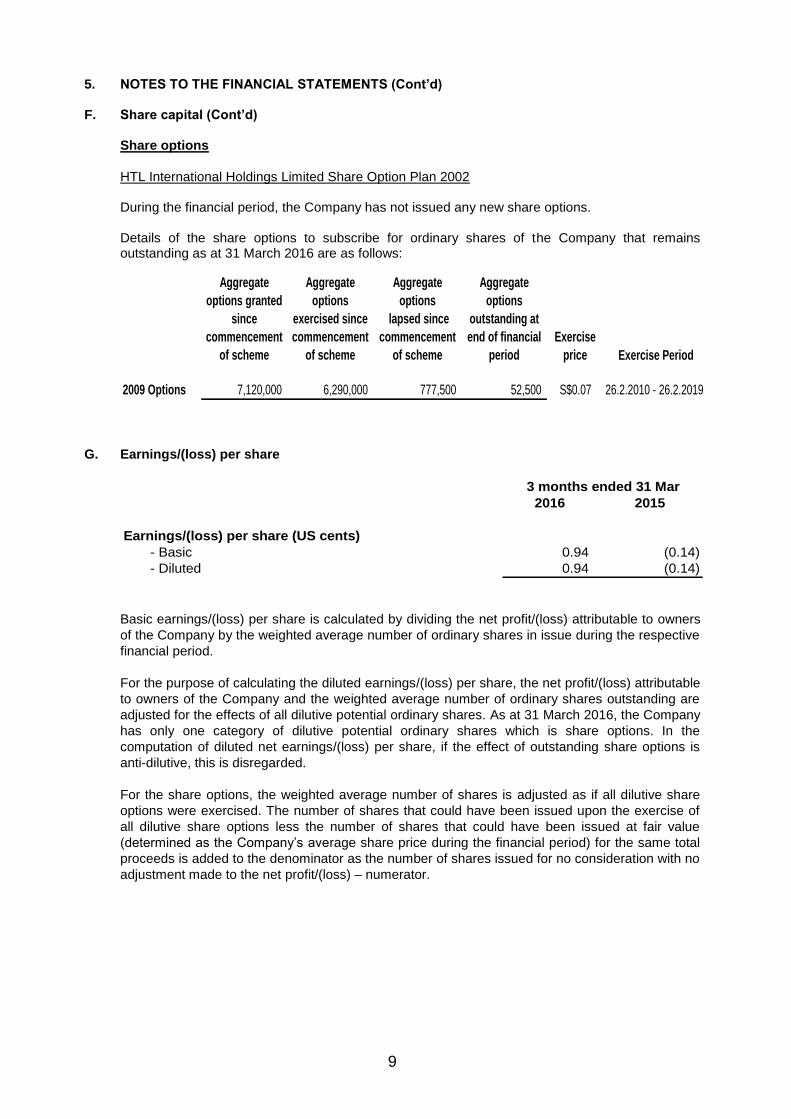
HTL International Holdings Limited Share Option Plan 2002
During the financial period, the Company has not issued any new share options. Details of the share options to subscribe for ordinary shares of the Company that remains outstanding as at 31 March 2016 are as follows:
Aggregate
options granted
since
commencement
of scheme
Aggregate
options
exercised since
commencement
of scheme
Aggregate
options
lapsed since
commencement
of scheme
Aggregate
options
outstanding at
end of financial
period
Exercise
price
2009 Options 7,120,000 6,290,000 777,500 52,500 S$0.07 26.2.2010 - 26.2.2019
Exercise Period
G. Earnings/(loss) per share
2016 2015
Earnings/(loss) per share (US cents)
- Basic 0.94 (0.14)
- Diluted 0.94 (0.14)
3 months ended 31 Mar
Basic earnings/(loss) per share is calculated by dividing the net profit/(loss) attributable to owners
of the Company by the weighted average number of ordinary shares in issue during the respective
financial period.
For the purpose of calculating the diluted earnings/(loss) per share, the net profit/(loss) attributable
to owners of the Company and the weighted average number of ordinary shares outstanding are
adjusted for the effects of all dilutive potential ordinary shares. As at 31 March 2016, the Company
has only one category of dilutive potential ordinary shares which is share options. In the
computation of diluted net earnings/(loss) per share, if the effect of outstanding share options is
anti-dilutive, this is disregarded.
For the share options, the weighted average number of shares is adjusted as if all dilutive share
options were exercised. The number of shares that could have been issued upon the exercise of
all dilutive share options less the number of shares that could have been issued at fair value
(determined as the Company’s average share price during the financial period) for the same total
proceeds is added to the denominator as the number of shares issued for no consideration with no
adjustment made to the net profit/(loss) – numerator.

10
5. NOTES TO THE FINANCIAL STATEMENTS (Cont’d)
G. Earnings/(loss) per share (Cont’d)
2016 2015
US$'000 US$'000
Net profit/(loss) attributable to owners of the Company used
to determine basic and diluted earnings/(loss) per share 3,751 (582)
No. of shares No. of shares
’000 ’000
Weighted average number of ordinary shares used in the
calculation of basic earnings/(loss) per share 399,619 405,870
Adjustment for assumed conversion of share options 147 130
Weighted average number of ordinary shares used in
the calculation of diluted earnings/(loss) per share 399,766 406,000
Diluted earnings/(loss) per share (US cents) 0.94 (0.14)
3 months ended 31 Mar
H. Net asset per share
As at As at As at As at
31 Mar 2016 31 Dec 2015 31 Mar 2016 31 Dec 2015
Net asset value per ordinary share based
on issued share capital as at the end of the respective period/year (US cents) * 41.83 40.57 13.76 13.53
The Group The Company
* Based on issued share capital of 399,730,718 ordinary shares (excluding treasury shares) as at
31 March 2016 and 399,605,718 ordinary shares (excluding treasury shares) as at 31 December 2015.
6. AUDIT
The figures have been reviewed by the Company’s auditor in accordance with Singapore Standard
on Review Engagement 2410 “Review of Interim Financial Information Performed by Independent
Auditor of the Entity”.
7. AUDITOR’S REPORT
Please refer to the Independent Auditor’s Review Report dated 12 May 2016 as enclosed in Annexure 1.
8. ACCOUNTING POLICIES
Except as disclosed in paragraph 9 below, the Group has applied the same accounting policies and methods of computation in the financial statements for the current financial period compared with those of audited financial statements as at 31 December 2015.
9. CHANGES IN THE ACCOUNTING POLICIES
The Group adopted the new/revised Singapore Financial Reporting Standards (“FRS”) and Interpretations of FRS (“INT FRS”) that are effective for annual periods beginning on or after 1 January 2016. The adoption of these new/revised FRS did not have any material impact on the financial statements of the Group.

11
10. REVIEW OF GROUP PERFORMANCE
Overview
(A) (B) (C) =(A) - (B)
Q1 2016 Change
US$'000 US$'000 US$'000 %
Sofa Business Unit ("Sofa BU")
- External 101,168 105,012 (3,844) (3.7)
- Internal 1,045 915 130
102,213 105,927 (3,714)
Leather Business Unit ("Leather BU")
- Internal 28,798 32,557 (3,759) (11.5)
Home Furnishing Retail Business Unit
("HFRBU")
- External 4,952 4,055 897 22.1
- Internal 1 1 -
4,953 4,056 897
Less : Inter-segment sales (29,844) (33,473) 3,629
Group Turnover 106,120 109,067 (2,947) (2.7)
Q1 2015
Notes:
(1) Core Business comprises the Sofa, Leather Business Units (“BU”) and Corporate Office (2) Q1 2016/2015 – three months ended 31 March 2016/2015 (3) SG&A – represents the aggregate of total sales, marketing, distribution and administrative expenses
Q1 2016 vs. Q1 2015 Turnover Revenue declined by 2.7% to US$106.1 million, mainly due to lower sales in Australia and New Zealand (“ANZ”), and the weaker Euro and Australian Dollar (“AUD”) against the United States Dollar (“USD”). This was partially offset by stronger sales in North America. Profitability
The Group’s gross profit margin rose by 4.2% from 28.6% in Q1 2015 to 32.8% in Q1 2016, mainly due to lower leather costs, and lower other materials and overhead costs as a result of weaker RMB against USD. These were partially mitigated by the weaker Euro and AUD against the USD. Other operating income reduced by US$0.4 million to US$0.6 million, predominantly as a result of lower leather scrap sales and lower suppliers rebate received by Domicil Home in Germany.

12
10. REVIEW OF GROUP PERFORMANCE (Cont’d)
Q1 2016 vs. Q1 2015 (Cont’d) Profitability (Cont’d) SG&A fell by 14.9% to US$29.4 million in Q1 2016, in tandem with the decreased in sales and lower distribution costs due to lower freight rates. Other operating expenses increased significantly from US$0.2 million in Q1 2015 to US$2.1 million in Q1 2016. This was primarily due to the closure costs of two retail stores and a sofa plant in China. The closure costs included write-off of store renovation costs previously capitalised under property, plant and equipment, employees’ redundancy costs and penalties from early termination of tenancy agreements. Consequently, the Group registered an operating profit before net foreign exchange gain and tax of US$3.6 million, a reversal from an operating loss of US$3.1 million in Q1 2015. The Group reported lower net foreign exchange gain of US$1.9 million in Q1 2016 compared to US$3.1 million in Q1 2015. This was largely attributable to the realised loss on delivery of foreign exchange contracts compared to a gain in Q1 2015. This was partially offset by a turnaround of unrealised mark-to-market loss on foreign exchange contracts in Q1 2015 to unrealised gain in Q1 2016 coupled with realised gain on payables/receivables compared to a loss in Q1 2015. Overall, the Group registered a net profit of US$3.7 million for Q1 2016, a turnaround from a net loss of US$0.6 million for Q1 2015.
Analysis by Major Business Units (“BU”)
Change Change
2016 2015 % 2016 2015 %
US$'000 US$'000 US$'000 US$'000
Revenue (exclude inter-segment sales) 101,168 105,012 (3.7) 4,952 4,055 22.1
Operating profit/(loss) before net foreign exchange gain 6,763 (104) NM (3,193) (2,946) 8.4
EBITDA before net foreign exchange gain 8,141 1,717 374.1 (2,859) (2,669) 7.1
Net profit/(loss) for the period 6,861 2,382 188.0 (3,199) (2,959) 8.1
Net margin 6.8% 2.3% -64.6% -73.0%
Total net foreign exchange gain 1,899 3,089 43 32
NM : Not meaningful
Notes:
(1) Core Business comprises the Sofa BU, Leather BU and Corporate Office.
Core Business (1)
Home Furnishing Retail
3 months ended 31 Mar 3 months ended 31 Mar

13
10. REVIEW OF GROUP PERFORMANCE (Cont’d)
Analysis by Major Business Units (“BU”) (Cont’d)
Core Business
Sofa BU - Revenue by Regions
2016 2015
US$’000 US$’000 US$’000 %
Asia (excluding China) 12,688 13,390 (702) (5.2)
China (including Hong Kong) 852 1,076 (224) (20.8)
Europe 49,056 50,259 (1,203) (2.4)
North America 25,962 22,937 3,025 13.2
ANZ 12,271 17,139 (4,868) (28.4)
Others 339 211 128 60.7
101,168 105,012 (3,844) (3.7)
Notes:
(1) These exclude inter-segment sales.
Total (1)
Change
3 months ended 31 Mar
Sofa BU posted lower revenue of US$101.2 million compared to US$105.0 million in Q1 2015, predominantly due to lower sales in ANZ coupled with the weaker Euro and AUD against the USD. This was partially mitigated by the stronger sales in North America.
Europe continued to be our largest market, accounting for 48.5% (Q1 2015: 47.9%) of the Core Business’ turnover, followed by North America (25.7%), ANZ (12.1%) and Asia (13.4%). With higher gross profit, savings from lower SG&A expenses and despite the aforementioned sofa plant’s closure costs, the Core Business posted operating profit before net foreign exchange gain and tax of US$6.8 million in Q1 2016 compared to operating loss of US$0.1 million in Q1 2015. Home Furnishing Retail BU (“HFRBU”) HFRBU’s revenue improved by 22.1% to US$5.0 million, largely attributable to the expansion of retail presence in China and Singapore. Despite the increase in turnover, HFRBU’s operating loss before net foreign exchange gain and tax increased by US$0.3 million to US$3.2 million in Q1 2016 (Q1 2015: US$2.9 million). This was mainly due to the higher other operating expenses as a result of closure of retail stores in China. Excluding the closure costs, HFRBU’s operating loss before net foreign exchange gain and tax would have been lower at US$2.1 million.
Liquidity, financial and working capital resources Trade and other receivables increased by US$5.0 million to US$55.0 million, primarily due to lower factoring without recourse. Consequently, the average day sales outstanding (“DSO”) was higher at 1.6 months as at 31 March 2016 (31 December 2015: 1.3 months).

14
10. REVIEW OF GROUP PERFORMANCE (Cont’d)
Liquidity, financial and working capital resources (cont’d) Inventory remained fairly stable at US$133.4 million as at 31 March 2016 (31 December 2015: US$133.2 million). The outstanding days in inventory (“DIO”) was higher at 5.6 months as at 31 March 2016 (31 December 2015: 4.9 months), partly as a result of higher leather procurement. Trade and other payables fell by US$1.7 million to US$68.9 million, in line with lower business activities. The average day payables outstanding (“DPO”) was higher at 2.9 months, mainly due to lower payments to suppliers.
The Group’s net borrowings (loans and borrowings less cash and short term deposits) increased by US$3.8 million to US$9.6 million as at 31 March 2016, predominantly due to higher leather procurement activities. Accordingly, the Group’s overall net gearing was also higher at 5.7% (31 December 2015: 3.6%). Improvement in operating profitability brought about the reduction in negative free cash flow from US$8.1 million in Q1 2015 to US$3.7 million in Q1 2016.
11. VARIANCE FROM PROSPECT STATEMENT
No prospect statement was previously provided.
12. OUTLOOK
Challenging macroeconomic conditions will continue to put pressure on our revenue and profitability. Offsetting the strain will be reduced raw leather hide costs and freight rates, as well as lower operating costs. Overall, we expect the outlook for the sofa business to remain positive, and the on-going restructuring of our retail business is expected to reduce our operating loss further.
13. KEY BUSINESS RISKS Macro Risks
Commodity risks Raw leather hide is the principal raw material in the Group’s upholstered furniture, accounting for almost half of the sofa upholstery cost. As such, the cost of upholstered furniture is exposed to fluctuations in the price of cattle raw hide. The supply of cattle raw hide is principally dependent on the consumption of beef. The cattle industry is also exposed to veterinary health issues like foot-and-mouth and mad cow disease, which will have an impact on the slaughter rate of cattle. Fluctuations in the price of raw leather hides will significantly affect operating margins.

15
13. KEY BUSINESS RISKS (Cont’d) Macro Risks (Cont’d)
Cyclical demand for furniture
Historically, the furniture industry has been cyclical, fluctuating with economic cycles, and is sensitive to general economic conditions, housing starts, interest rate levels, credit availability and other factors that affect consumer spending habits. As most furniture purchases are discretionary in nature and may represent a significant expenditure to the average consumer, such purchases may be deferred during times of economic uncertainty. Any prolonged global economic slowdown may have an adverse effect on the Group’s operating results. Seasonal operations The Group’s sale of leather upholstered furniture is subject to seasonal variations given that the increased contribution from the Europe and North America markets now accounts for over two-thirds of the Group’s turnover. In general, shipments of goods from July to August (i.e. the summer months) are lower than in the other months of a calendar year. These seasonality variations may cause short term fluctuations in the Group’s turnover and performance.
Changes in the regulations of The People’s Republic of China (“PRC”) relating to export Value Added Tax (“VAT”) rebates and import duties In order to reduce its massive trade surplus, the PRC government has gradually reduced its export VAT rebates for many business sectors. With effect from 1 July 2007, export VAT rebates for the Group’s product segments had been reduced from 8% to nil for finished leather, and from 13% to 11% for sofa upholstery. With effect from 1 June 2009, the export VAT rebate for the sofa upholstery was temporarily reinstated to 15%. Should the PRC government revises the effective export VAT rebates downwards, this would adversely impact the Group’s operating margins.
Changes in the PRC processing trade policy
Since 2006, the PRC government has been introducing changes to the processing trade policy, such as moving certain widely used materials to the prohibited category, these changes being aimed at restricting the production and export of high pollution, high energy consumption and resource consuming products. In its latest policy switch in July 2007, the government requested that enterprises engaged in the processing trade industry in the prohibited category pay a mandatory duty deposit for imported raw materials. At this juncture, the Group’s products have been exempted from this prohibited category. However, any expansion of the prohibited category to include the Group’s products may impact the Group’s cash flow and incur increased financial costs. Environmental risk The production of leather is generally pollutive. As the PRC government is tightening its environmental protection policy, the Group’s production activities may be put under close scrutiny. The Group has always observed a high standard of social and environmental responsibility, and welcomes the PRC government’s new initiatives. However, it is possible that further investments may be needed to upgrade the Group’s waste treatment facilities and this will in turn increase production costs.

16
13. KEY BUSINESS RISKS (Cont’d)
Company Risks Foreign exchange risks The global financial markets remain volatile. The Group transacts primarily in USD which is also its primary functional currency. The Group also transacts in other major foreign currencies like Japanese Yen, Sterling Pound, Euro and Australian Dollar. Majority of the Group’s operations are also situated outside of Singapore, most notably in China. Consequently, any movement between Renminbi and USD will also affect the Group’s currency exposure risks. Any significant adverse movements in the other major trading currencies against USD will also have an impact on the Group’s performance. The Group actively monitors and hedges its foreign currency exchange exposure by using relevant foreign exchange forward contracts and options to hedge its cash flow and margins. Where appropriate, the Group will borrow in the same currency to provide a natural hedge for balance sheet items. Vulnerable to freight rate increases The Group exports its upholstery products to more than 40 countries across 6 continents and relies on shipping companies for the shipment of its products to these countries. As such, the Group bears freight costs when it sells on Cost, Insurance and Freight (CIF), Delivered Duty Unpaid (DDU) or Cost and Freight (CFR) terms, and when it purchases on Free on Board (FOB) term. The freight market can be volatile, and freight rates are affected by fluctuations in oil prices. If freight rates are high, the Group’s distribution costs will increase and operating margins can be affected. The Group has no control over the supply and demand of freight services and it is therefore difficult for the Group to manage its freight costs. The Group does factor in an appropriate amount of the expected freight rate increases in the quotation of sales price to customers.
14. DIVIDEND
(i) Current financial period reported on - None
(ii) Corresponding period of the immediately preceding financial year – None
(iii) Date payable – Not applicable
(iv) Books closure date – Not applicable

17
15. SEGMENTAL INFORMATION
Sofa Leather
Home
Furnishing
Retail Corporate Elimination Group
US$'000 US$'000 US$'000 US$'000 US$'000 US$'000
Financial period ended 31 March 2016
Revenue
External sales 101,168 - 4,952 - - 106,120
Inter-segment sales 1,045 28,798 1 - (29,844) -
Total revenue 102,213 28,798 4,953 - (29,844) 106,120
Segment results 6,738 536 (3,129) (239) - 3,906
Finance income 16
Finance expense (352)
Net foreign exchange gain 1,942
Income tax expense (1,850)
Net profit for the period 3,662
Segment assets 163,834 94,927 24,551 3,410 - 286,722
Tax assets 2,398
Consolidated total assets 289,120
Segment liabilities (52,996) (13,114) (6,183) (1,700) - (73,993)
Loans and borrowings (44,753)
Tax liabilities (2,407)
Consolidated total liabilities (121,153)
Other segment items
Addition to non-current assets
- property, plant and equipment 1,073 20 440 - - 1,533
- intangible assets 1 - - - - 1
Depreciation 604 232 265 - - 1,101
Amortisation 247 23 5 - - 275
- - - - - -
Other non-cash expenses
Inventories written-down 273 - 71 - - 344
Provision for warranty 2,609 - - - - 2,609

18
15. SEGMENTAL INFORMATION (Cont’d)
Sofa Leather
Home
Furnishing
Retail Corporate Elimination Group
US$'000 US$'000 US$'000 US$'000 US$'000 US$'000
Financial period ended 31 March 2015
Revenue
External sales 105,012 - 4,055 - - 109,067
Inter-segment sales 915 32,557 1 - (33,473) -
Total revenue 105,927 32,557 4,056 - (33,473) 109,067
Segment results 709 (150) (2,934) (337) - (2,712)
Finance income 23
Finance expense (362)
Net foreign exchange gain 3,121
Income tax expense (647)
Net loss for the period (577)
Segment assets 164,874 100,403 22,991 3,256 - 291,524
Tax assets 4,560
Consolidated total assets 296,084
Segment liabilities (51,763) (12,232) (6,509) (1,449) - (71,953)
Loans and borrowings (46,013)
Tax liabilities (5,512)
Consolidated total liabilities (123,478)
Other segment items
Addition to non-current assets
- property, plant and equipment 137 6 1,534 - - 1,677
- intangible assets 47 - - - - 47
Depreciation 866 319 263 - - 1,448
Amortisation 266 44 2 - - 312
Other non-cash expenses
Inventories written-down 81 - 298 - - 379
Provision for warranty 2,439 - 1 - - 2,440
Secondary reporting format – geographical segments
The following table shows the distribution of the Group’s consolidated sales by geographical market regardless of where the products were manufactured:
2016 2015
US$’000 US$’000 US$’000 %
Asia (excluding China) 14,936 15,190 (254) (1.7)
China (including Hong Kong) 2,487 2,263 224 9.9
Europe 50,125 51,328 (1,203) (2.3)
North America 25,962 22,937 3,025 13.2
ANZ 12,271 17,139 (4,868) (28.4)
Others 339 210 129 61.4
Total 106,120 109,067 (2,947) (2.7)
3 months ended 31 Mar
Change

19
15. SEGMENTAL INFORMATION (Cont’d)
The following table shows the distribution of the Group's non-current assets (excluding deferred tax assets) based on the geographical location of where the Company and its subsidiaries are located:
31 March 2016 31 Dec 2015
US$'000 US$'000
China (including Hong Kong) 25,523 27,321
Asia (excluding China) 17,946 17,571
United States 5,071 4,201
Europe 1,668 1,668
Australia 1,530 1,474
Total 51,738 52,235
Non-current assets (excluding
deferred tax assets)
16. CONFIRMATION PURSUANT TO RULE 720 (1) OF THE LISTING MANUAL
The Company confirms that it has procured undertakings from all its Directors and Executive Officers (in the format set out in Appendix 7.7) pursuant to Rule 720 (1) of the Listing Manual.
17. CONFIRMATION PURSUANT TO RULE 705 (5) OF THE LISTING MANUAL
We, the undersigned, being two directors of HTL International Holdings Limited (the “Company”)
do hereby confirm on behalf of the directors of the Company that, to the best of their knowledge
nothing has come to the attention of the Board of Directors of the Company which may render the
unaudited financial results of the Group comprising the balance sheets (Group and Company),
consolidated income statement, consolidated statement of comprehensive income, statements of
changes in equity (Group and Company) and consolidated cash flow statement, (together with the
accompanying notes) for the quarter ended 31 March 2016 to be false or misleading in any
material respect.
On behalf of the Board of Directors,
Phua Yong Tat Phua Yong Sin
Director Director
BY ORDER OF THE BOARD
Jacqueline Loke
Company Secretary
12 May 2016

20
Annexure 1
To the Board of Directors of HTL International Holdings Limited and its subsidiaries
Report on review of condensed interim financial information
We have reviewed the condensed interim financial information of HTL International Holdings Limited (the
"Company") and its subsidiaries (collectively, the "Group") set out on pages 2 to 37, which comprise the
condensed interim balance sheets of the Group and the Company as of 31 March 2016, and the related
condensed interim income statement and statement of comprehensive income of the Group, statements
of changes in equity of the Group and the Company and statement of cash flow of the Group for the
three months ended 31 March 2016, and certain explanatory notes. Management is responsible for the
preparation and fair presentation of this interim financial information in accordance with Singapore
Financial Reporting Standard 34, ‘Interim Financial Reporting’. Our responsibility is to express a
conclusion on this condensed interim financial information based on our review.
Scope of review
We conducted our review in accordance with Singapore Standard on Review Engagements 2410,
‘Review of Interim Financial Information Performed by the Independent Auditor of the Entity’. A review of
interim financial information consists of making inquiries, primarily of persons responsible for financial
and accounting matters, and applying analytical and other review procedures. A review is substantially
less in scope than an audit conducted in accordance with Singapore Standards on Auditing and
consequently does not enable us to obtain assurance that we would become aware of all significant
matters that might be identified in an audit. Accordingly, we do not express an audit opinion.
Conclusion
Based on our review, nothing has come to our attention that causes us to believe that the accompanying
interim condensed financial information are not prepared, in all material respects, in accordance with
Singapore Financial Reporting Standard 34, ‘Interim Financial Reporting’.
Ernst & Young LLP
Public Accountants and Chartered Accountants Singapore
12 May 2016