Litigation Risk, Cash Holdings, and Corporate Investment · Litigation Risk, Cash Holdings, and...
45
Litigation Risk, Cash Holdings, and Corporate Investment MATTEO ARENA * Marquette University BRANDON JULIO † London Business School March 2011 ABSTRACT We show that litigation risk has a significant impact on corporate financial policy. Firms with greater exposure to securities litigation hold significantly more cash in an- ticipation of future settlement costs, controlling for the other determinants of corporate liquidity policy. The result is due to firms accumulating cash in anticipation of lawsuits and not a consequence of plaintiffs targeting firms with high cash levels. We also find strong evidence of lawsuit spillover effects within industries. The value of an additional dollar of cash is significantly lower for firms exposed to litigation risk. We also find that corporate investment decisions are affected by litigation risk, as firms cut back on capital expenditures in response to increases in litigation risk. Our results are robust to different proxies of litigation risk, endogeneity concerns, firm characteristics, and possible spuri- ous temporal effects. Our results suggest that firms follow a risk management strategy in which they partially hedge with limited insurance contracts and adopt a more conservative capital structure through the accumulation of cash. * Department of Finance, Marquette University, 312 Straz Hall, P.O. Box 1881, Milwaukee, WI 53201-1881; email [email protected]; phone: (414) 288-3369. † Department of Finance, London Business School, Regent’s Park, London NW1 4SA, United Kingdom; e- mail: [email protected]; phone: +44 (0)20 7000 8254. We thank Vito Gala, LiuLing Liu, Andrew Roper, Vikrant Vig, Olga Yakusheva, and seminar participants at Marquette University and the 2010 Financial Manage- ment Association Conference for helpful comments.
Transcript of Litigation Risk, Cash Holdings, and Corporate Investment · Litigation Risk, Cash Holdings, and...
Litigation Risk, Cash Holdings, and CorporateInvestment
MATTEO ARENA∗
Marquette University
BRANDON JULIO†
London Business School
March 2011
ABSTRACT
We show that litigation risk has a significant impact on corporate financial policy.Firms with greater exposure to securities litigation hold significantly more cash in an-ticipation of future settlement costs, controlling for theother determinants of corporateliquidity policy. The result is due to firms accumulating cash in anticipation of lawsuitsand not a consequence of plaintiffs targeting firms with highcash levels. We also findstrong evidence of lawsuit spillover effects within industries. The value of an additionaldollar of cash is significantly lower for firms exposed to litigation risk. We also find thatcorporate investment decisions are affected by litigationrisk, as firms cut back on capitalexpenditures in response to increases in litigation risk. Our results are robust to differentproxies of litigation risk, endogeneity concerns, firm characteristics, and possible spuri-ous temporal effects. Our results suggest that firms follow arisk management strategy inwhich they partially hedge with limited insurance contracts and adopt a more conservativecapital structure through the accumulation of cash.
∗Department of Finance, Marquette University, 312 Straz Hall, P.O. Box 1881, Milwaukee, WI 53201-1881;email [email protected]; phone: (414) 288-3369.
†Department of Finance, London Business School, Regent’s Park, London NW1 4SA, United Kingdom; e-mail: [email protected]; phone: +44 (0)20 7000 8254. We thank Vito Gala, LiuLing Liu, Andrew Roper,Vikrant Vig, Olga Yakusheva, and seminar participants at Marquette University and the 2010 Financial Manage-ment Association Conference for helpful comments.
The rights of shareholders, from the basic right to vote to replace directors to the right to
sue for damages in a court of law, are widely recognized as being important for the efficient
allocation of capital through an economy. However, the benefits generated by granting strong
legal rights to investors may change firm behavior in unintended ways. In this paper, we in-
vestigate how the litigation environment in the US affects corporate liquidity and investment
policy. Under the Securities Acts of 1933 and 1934, all publicly listed firms in the United
States are exposed to the risk of security class action lawsuits. Given the potential size of law-
suit settlements, this risk has important implications forexpected cash flows. The probability
of a significant one-time reduction in cash flow from litigation may induce firms to alter firm
policy in an attempt to offset possible shocks. While litigation risk has been present since
the advent of the securities acts, there is evidence to suggest that litigation risk or at least the
perception of litigation risk has been increasing over the past decade despite the passing of the
Private Securities Litigation Reform Act of 1995 that intended to make it more difficult to ini-
tiate shareholder lawsuits by requiring plaintiffs to provide proof that executives intentionally
defrauded investors. As Zingales (2006) indicates, the total dollar value of lawsuit settlements
totaled $9.7 billion in 2005.
While litigation risk may affect firms in various ways, one corporate policy that may be
particularly sensitive to this risk is the decision to accumulate cash flow in the form of liquid
assets. Specifically, we hypothesize that litigation risk is an important determinant a firm’s
decision to hold cash. The main prediction follows directlyfrom the precautionary savings
motive (Keynes (1936)) for corporate cash holdings. Due to the costs associated with raising
external finance and the possibility of future cash flow shocks, firms have an incentive to save
more cash to avoid raising external capital to finance new investments and other corporate
activities (Lins, Servaes, Tufano (2010)). Thus, we expectthat, all else equal, firms with
higher exposure to litigation risk will hold more cash on their balance sheets in anticipation
of future settlement costs. We also look at whether the accumulation of cash due to litigation
risk exposure has an impact on firms’ real investment decisions.
Litigation risk is inherently unobservable and difficult tomeasure. In addition, there are
several complications associated with estimating a relation between litigation risk and corpo-
rate policy. One problem is that of possible simultaneity bias. Firms may hold higher cash
balances because of their exposure to litigation risk, but firms with higher cash balances may
1
be more likely targets of litigation. Another potential problem is the omitted variable bias,
as some unobserved characteristic may be driving both litigation risk and cash holdings. As
such, we investigate the impact of litigation risk on corporate cash holdings in both the cross-
section and over time using a variety of approaches. We first investigate the impact of actual
litigation events on the corporate savings behavior of the defendant firm. We then construct
measures ofex ante litigation risk by modeling the probability of being brought into securities
litigation as a function of firm characteristics and firm performance variables that have been
demonstrated to be related to litigation. To address the potential for omitted variables bias,
we assess the effect of changes in litigation risk on changesin cash holdings by analyzing
the spillover effects of litigation on industry peer firms not involved in a litigation. Finally,
we employ a simultaneous equations framework, similar to the analysis of Lowry and Shu
(2002) and Field, Lowry, and Shu (2005), to address potential simultaneity bias. Regardless
of the approach we use to estimate litigation risk, our results consistently show a significant
positive relation between litigation risk and cash holdings. After accounting for endogeneity,
our results show that firms preemptively accumulate cash before possible lawsuits rather than
plaintiffs targeting firms with high pre-litigation levelsof cash.
In addition to class action securities lawsuits, firms are exposed to other legal risks, such
as copyright infringement, product liability, and antitrust lawsuits. As with other papers ex-
amining litigation risk, we choose to focus on securities class action lawsuits. This choice is
motivated by several reasons. First, detailed informationrelated to the class action lawsuits
is publicly available and provides us with an observable sample of litigation events. Sec-
ond, class action securities fraud litigations are broughtunder the Securities Acts of 1933 and
1934. As such, all publicly traded firms are susceptible to this particular type of lawsuit. Fi-
nally, class action securities litigation is of interest because the average settlement or penalty
amounts tend to be quite large and therefore represents a significant source of loss from the
firm’s perspective. In our sample of lawsuits, the average settlement amount is $56.4 mil-
lion, which corresponds to more than the level of cash holdings of the sued firms that settle.
Moreover, the statistical distribution of settlement amounts is characterized by considerable
positive skewness. A few settlements surpass the $1 billionmark, and the largest settlement
in our sample amounts to $3.2 billion. In addition to the direct costs of litigation represented
by settlement costs and attorneys fees, sued firms face several indirect costs (Engelmann and
2

Cornell (1988)). Even though indirect costs are difficult tomeasure, they are significant in
most cases. When a firm becomes a defendant in a lawsuit, the cost of implicit and explicit
contracts rises. Major lawsuits can also damage the defendant’s reputation and can negatively
affect its relationship with suppliers and customers (Engelmann and Cornell (1988)). One
potential concern with our sample of events is that securities litigation may be more sensitive
to changes in firm performance compared to other types of litigation. While we do control
for changes in performance in our analysis, we also investigate other litigations that are not
related to securities law from the Audit Analytics litigation database. The results from the
sample of non-securities litigation events are similar to our main results, suggesting that the
effects of litigation risk are not special to class action securities litigation.
Litigation risk provides an interesting setting for examining the manner in which firms
manage risk. Froot and Stein (1998) model a firm’s risk management choices in a world in
which some risks cannot be perfectly hedged in the capital market. In this framework, firms
face a trade-off between managing risk by entering hedging transactions and managing risk
through capital structure choices. If it is difficult or costly to hedge a particular type of risk,
firms will instead adopt a more conservative capital structure by accumulating a cash buffer.
Firms may enter into contracts to protect themselves from litigation risk. Indeed, almost all
public firms in the U.S. buy A-side or B-side insurance to indemnify officers or directors.1
Many firms buy also optional entity securities coverage (C-side insurance). Such coverage
provides protection for the corporation for its own liability. However, litigation insurance
does not provide full or even partial coverage in several cases. According to the annual Towers
Perrin Directors and Officers Liability Surveys, during oursample period (1996-2006) public
firms have an average litigation insurance limit of about $15million. The average settlement
amount in our sample is more than three times larger ($56 million) than the average litigation
insurance limit.2 Moreover, even though according to Towers Perrin about 85% of public firms
in the U.S. bought some C-side insurance in 2006, only about 50% firms had c-side coverage
at the beginning of our sample period. Additionally, insurance cannot offer protection from
1A-Side coverage provides coverage directly to the directors and officers for loss resulting from claims madeagainst them for their wrongful acts. A-Side Coverage applies in cases when the corporation does not indemnifyits directors and officers. B-side coverage reimburses a corporation for its loss if the firm indemnifies its directorsand officers for claims against them.
2The actual total litigation cost for the average firm is actually larger than $56 million when accounting forlegal fees.
3
the indirect costs that defendant firms usually face. Thus, our study provides an insight into
how firms adjust their financial policies to reduce risks thatcan only partially be mitigated
through explicit contracts.
We start our empirical investigation by examining whether changes in litigation risk lead
to changes in cash holdings for firms directly involved in securities litigation. We do so by
examining the impact of actual class action lawsuits filed onUS firms between 1996 and
2006. We find that, controlling for changing firm characteristics, cash holdings of these firms
increase by an average of 15.5% relative to pre-litigation levels. The results are robust to
different specifications and the inclusion of firm and year fixed effects.
Our second set of results demonstrate that variousex ante measures of litigation risk are
positively and significantly related to cash holdings in thecross-section of US firms, control-
ling for all other factors that are known to be correlated with cash. Specifically, we construct
ex ante measures of litigation risk by obtaining predicted probabilities from a series of probit
regressions that attempt to explain the probability that a firm is sued in a given year. The
economic effects of litigation risk are significant and quite large. We find that a one-standard
deviation increase in the ex-ante measures of litigation risk yield expected increases in the con-
ditional mean cash/assets ratio ranging from 5.9% to 6.5%, depending on the specific measure
and model specification.
One important concern related to the link between cash holdings and litigation risk is the
potential endogeneity between the choice of how much cash tohold and the decision of share-
holders to file litigation. While the first two sets of findingsare consistent with the hypothesis
that litigation risk is an important determinant of corporate cash holdings, they are subject
to the criticism that some unobserved, omitted factor may beexplaining both the probabil-
ity of litigation and the level of cash holdings. Our resultsmight also potentially be affected
by reverse causality because holding considerable amountsof cash might increase the risk of
litigation. To identify the causal effects of litigation risk, we examine the spillover effects
of class action litigation on peer firms. Gande and Lewis (2009) demonstrate that the share
prices of firms that are not brought into a legal dispute adjust downward significantly on the
announcement of a lawsuit filing of a firm in the same industry.They also show that litiga-
tion concentration in a particular in industry is a strong predictor of actual litigation events.
4
Thus, we treat litigation events on peer firms as an exogenoussource of variation in litigation
risk for firms in the same industry. We find that peer firms increase their cash holdings sig-
nificantly when industry peers are involved in litigation. Specifically, the conditional mean
cash-to-assets ratio for peer firms increases by 10.2% relative to pre-litigation levels following
a litigation event in their industry.
In addition to the spillover effects analysis, we also deal with the potential simultaneity
problem by estimating a system of simultaneous equations that allows us to decompose the
impact of litigation risk on cash holdings (the precautionary savings motive) and the impact
of cash holdings on litigation risk (the enticement effect). The approach we employ is similar
to that adopted by Lowry and Shu (2002), who examine the impact of litigation risk on IPO
underpricing. The results of this system of simultaneous equations dispel concerns of reverse
causality. The evidence from the simultaneous equations suggests that firms accumulate cash
in anticipation of a possible lawsuit. The estimates do not support the conjecture of firms with
larger amounts of cash being more exposed to predatory classaction lawsuits.
Having established that firms increase their cash holdings in the face of increased litigation
risk, a natural question is whether this accumulation of cash has an impact on firm value.
Given that a successful lawsuit from the plaintiff’s perspective will lead to a net payout of
cash to the litigation claimants that in many instances are not current shareholders of the firm,
we expect that the value of the marginal accumulated dollar of cash will be lower for firms
exposed to litigation risk. Using the methodology of Faulkender and Wang (2006), we find
that the risk of litigation decreases a firm’s marginal valueof cash. Our finding that the value
of an additional dollar of cash is significantly lower for firms exposed to litigation risk is also
consistent with Gormley and Matsa (2009), who argue that shareholders of firms exposed to
litigation risk would prefer to receive higher payouts because excess cash might potentially
increase damage awards.
In a later section of this study, we examine corporate investment policy around litigation
events. We find a significant reduction in capital expenditures for firms involved in litigation,
controlling for Tobin’sQ and cash flow. We also find evidence of litigation spillover effects
in corporate investment. Specifically, we find that firms reduce their capital expenditures
when they see some of their competitors being sued. The spillover effect is economically and
5
statistically significant, though smaller in magnitude compared to the firms that are directly
involved in the lawsuit.
Overall, our results on the relation between litigation risk and cash holdings are excep-
tionally robust to different proxies of litigation risk, endogeneity concerns, an extensive set of
firm characteristics that previous studies have shown to be related to cash holdings levels (e.g.,
Kim, Mauer ,and Sherman (1998); Opler, Pinkowitz, Stulz, and Williamson (1999); Mikkel-
son and Partch (2003)), corporate governance characteristics (Harford, Mansi, and Maxwell
(2008), Dittmar and Mahrt-Smith (2007)), unionization rates (Klasa, Maxwell, Ortiz-Molina
(2009)), the inclusion of other risk proxies, different empirical specifications, different mea-
sures of cash holdings, and concerns about possible spurious effects due to temporal trends.
Our results also hold when we include all types of corporate lawsuits in our analysis.
Our paper makes two primary contributions. First, we contribute to the literature on the
effects of litigation risk on firm behavior and corporate financial decisions. Litigation risk
affects IPO underpricing (Lowry and Shu (2002)), accounting disclosure (Skinner (1994),
Field, Lowry, and Shu (2005)), executive pay (Peng and Roell(2007), and M&A activity
(Gormley and Matsa (2009)). We extend this stream of research by investigating for the first
time the link between litigation risk, cash holdings, and corporate investment policy, providing
another avenue whereby legal institutions affect corporate behavior. Second, we identify a new
determinant of cash holdings and provide evidence that litigation risk has a significant effect on
corporate liquidity and investment policy, supporting theview that the precautionary savings
motive is particularly important. This paper identifies a clear channel whereby precautionary
savings operates and contributes to cash holdings and depress investments. Our results also
offer an insight into how firms manage risk in an integrated framework by both entering into
insurance contracts and adjusting the firm’s financial structure to hedge litigation risk.
The remainder of this paper proceeds as follows. Section I reviews the prior literature
on the determinants of cash holdings and securities litigation. Section II summarizes and
describes our sample of firms and litigation events. SectionIII presents our primary empirical
results. Section IV discusses our robustness tests. Finally, Section V offers a summary and
conclusions.
6

I. Related literature and hypothesis development
A. Corporate Litigations and Litigation Risk
Poor stock performance, high stock volatility, and turnover increase the risk of corporate
lawsuits and settlement amounts (Dyl (1999); Simmons and Hoyt (1993); Jones and Weingram
(1996); Gande and Lewis (2009)). Earnings manipulation anddisclosure quality also influence
litigation risk. Firms that manipulate earnings upward prior to stock issues are more vulnerable
to litigation (DuCharme, Malatesta, and Sefcik (2004)). The incentive compensation mix
for executives has also an effect on litigation risk by increasing the probability of earnings
manipulation (Peng and Roell (2008)). Companies that issueearning warnings are in certain
cases able to deter lawsuits (Field, Lowry, and Shu (2005)).
Even though Romano (1991) does not find significant abnormal returns for lawsuit initi-
ations, subsequent evidence consistently shows that the stock market reacts negatively to the
initiation of corporate lawsuits. Bhagat, Brickley, and Coles (1994), Bizjak and Coles (1995),
and Bhagat, Bizjak, and Coles (1998) examine the wealth effects of inter-firm lawsuits and find
that defendant firms experience statistically significant negative price reactions at the time of
the lawsuit filing. Gande and Lewis (2009) show significantlynegative stock price reactions to
shareholder-initiated class action lawsuits. They also find that shareholders partially anticipate
these lawsuits based on lawsuits against other firms in the same industry and capitalize some
of the losses before the lawsuit filing date.
Litigation risk and actual litigations have important effects on the defendant firm, its exec-
utives and directors. Firms at higher risk of litigation underprice more their IPOs as a form of
insurance (Lowry and Shu (2002)) and are more likely to undertake aggressive growth through
acquisitions (Gormley and Matsa (2009)). Litigation risk potentially affects firms’ disclosure
behavior (Skinner (1994)). Auditors are likely to stay awayfrom corporate clients at risk of
litigation (Krishnan and Krishnan (1997) and Shu (2000)). Romano (1991) finds that manage-
rial turnover is more frequent for firms involved in litigations. Lawsuits that terminate with
large settlements are likely to result in CEO turnover (Niehaus and Roth (1999)). Outside
board directors do not face abnormal turnover in firms involved in litigations but they tend
to lose a significant number of board seats held in other firms (Fich and Shivdasani (2007)).
7
The monitoring quality of boards of directors significantlyimproves following the filing of
derivative lawsuits (Ferris et al. (2007)).
Litigations in many cases result into significant costs for the sued firms. Before the Private
Securities Litigation Reform Act (PSLRA) of 1995, 20% of thecases resolved into settlements
that exceeded 10% of the firm’s annual revenues (Skinner (1997)). Even though the PSLRA
has significantly decreased the number of frivolous shareholder lawsuits (Ferris and Pritchard
(2001), Johnson, Nelson and Pritchard (2007)), it has not resulted in lower settlement costs
(Karpoff, Lee, and Martin (2006)). Settlement amounts are positively related to the severity
of the case (Cox and Thomas(2004)) and the magnitude of shareholder losses (Karpoff, Lee,
and Martin (2006)).
B. Corporate Cash Holdings
A large and recent body of literature has focused on the determinants and implications of
the corporate decision to accumulate liquid assets in the form of cash holdings. Beginning
with Opler, Pinkowitz, Stulz and Williamson (1999), researchers have studied the trade-offs
related to holding large amounts of cash on the balance sheet. On the benefits side, holding
cash allows a firm to finance investment without resorting to external finance and incurring
the associated transactions costs. Cash is also hypothesized to increase the likelihood that a
firm can continue to invest when other sources of funds are unavailable. It also acts as a buffer
between cash flows and debt obligations and potentially reduces the costs of financial distress.
On the cost side, holding cash has direct costs such as taxes and liquidity premium. Large
cash balances can also incur agency costs, as it increases managerial discretion and could lead
to suboptimal investments.
Empirical research has found evidence supporting these hypothesized costs and benefits.
Opler, et al.(1999) find that firms with larger growth opportunities and higher measures of
risk tend to hold more cash. They also note that firms tend to hold more cash than the simple
trade-off model would suggest. Other researchers have documented correlations between cash
holdings and governance (Dittmar, Mahrt-Smith, and Servaes (2003)), product market com-
petition (Haushalter, Klasa and Maxwell (2007)), taxes on repatriating foreign income Foley,
8
Hartzell, Titman and Twite (2007)), and the presence of labor unions (Klasa, Maxwell and
Ortiz-Molina (2009). Riddick and Whited (2009) find that cash holdings change in response
to future income uncertainty and the timing of large, lumpy investments. Faulkender and
Wang (2006) and Pinkowitz and Williamson (2007) examine howthe market values changes
in cash holdings in general, depending on the expended use ofeach marginal dollar saved by
the firm. Faulkender and Wang (2006) find that the value of an extra dollar of cash saved is
lower in cases in which the shareholders are expected to receive less of that dollar in future
payouts through dividends and share repurchases do to otherobligations such as the service
of debt and other liabilities.
C. Hypothesis Development
The main predictions of this paper follow directly from someof the main insights in the
literature reviewed above. First, litigation is costly andthe potential size of lawsuit settlements
or awards is large enough to generate large, negative shocksto expected cash flows. A change
in the risk of litigation increases the benefits of holding liquid assets. Thus, our first main
hypothesis is related to the corporate strategic decision to hold cash as a precaution so as to
compensate for possible large future cash outflows. We expect that the risk of litigation has a
significant influence on the corporate cash holding decisiondue to the large settlement costs
associated with corporate lawsuits documented by previousstudies. We posit that firms that
are significantly exposed to litigation risk will tend to hold more cash as a form of insurance
against expected settlement costs. That is, firms at risk of litigation will hold significantly
more cash than firms at no or low risk of litigation, all else equal. In addition, cash holdings
will change over time in response to changes in a firm’s exposure to litigation risk.
We also expect litigation risk to have a significant effect onthe value of corporate cash
holdings since not the entirety of the settlement dollar amount accrues to current shareholders.
A large portion of settlements of several class action lawsuits goes to individuals that were
shareholders during the period under dispute but not at the time of the settlement. Moreover,
the law firms representing the plaintiff group receive a portion of the settlement amount as
compensation. Therefore, only part of the settlement cash will accrue to current shareholders.
As a consequence we expect that even if firms at risk of litigation accumulate excess cash
9

as a necessity to shield from possible large settlement amounts, current shareholders do not
perceive this cash contributing fully to share value. An additional dollar of cash will increase
firm value less for firms exposed to higher risk of litigation than for firms with no or low
litigation risk.
Finally, firms might accumulate cash in anticipation of future lawsuits by reducing capital
investments, postponing planned acquisitions, divestingassets, or by reducing dividends and
repurchasing fewer shares. While corporate control and payout policy implications are outside
the scope of this paper, we investigate if the accumulation of cash caused by litigation risk has
a negative effect on the level of capital expenditures.
II. Data
A. Sample
Our initial sample consists of the entire population of Compustat firms from 1996 to 2006
with no missing data for the main variables used in the analysis. We then match our sam-
ple with the CRSP database and exclude firms that CRSP does notcover. After this match
our sample contains 84,078 firm-year observations. We then match this sample with Execu-
comp and First Call to obtain variables required by some of our multivariate tests. After this
match our sample consists of 13,589 observations. We then identify a sample of firms subject
to class action lawsuits by collecting litigation data fromthe Securities Class Action Clear-
inghouse website (http://securities.stanford.edu/) from 1996 to 2006. From this website we
collect information about lawsuit filing dates, beginning and ending of each class period, type
of resolution and settlement amounts when available. We identify 1,397 sample firms as being
involved in security class action lawsuits during our sample period. We define all the variables
used in this study in the Appendix.
We also collect information about corporate litigations other than security class action
lawsuits from the Audit Analytics Litigation database. Thecoverage provided by this datasets
begins in 2000 and reports information on lawsuits for U.S. publicly-traded firms. Audit An-
alytics collects information from corporate disclosures,corporate newswires, and from legal
10
disclosures, registrations and legal opinions filed with the SEC. Audit Analytics reports details
related to the specific litigation, including the type of lawsuits, the original date of filing, and
if available, the settlement amount. Our sample of non-security lawsuits obtained from Audit
Analytics spans from 2000 to 2006 and consists of 4,396 firm-year observations (firms that
were sued at least once in a given fiscal year). The most commontypes of corporate lawsuits
are product liability, copyright, patent, antitrust, and trade regulation lawsuits.
B. Descriptive Statistics
Table I presents the distribution of litigation firms by yearand industry. The year with
the largest amount of lawsuit filings in our sample is 2001. Out of the 319 lawsuits initiated
that year, 199 (68.8%) involve firms in the communications, computers and electronics indus-
try(SIC = 3570-3579, 3600-3699, 4800-4899, 7370-7379). The very large number of lawsuits
for this industry in 2001 is likely due to the burst of the internet bubble that characterized the
US stock market during that period.
Table II presents descriptive statistics on the resolutionof the lawsuits involving our sam-
ple firms. Of the 1,128 (81%) cases that reached a resolution by the end of 2009, the majority
(613) settled. Overall, Panel A of Table II shows that, for our sample, when the plaintiffs
receive compensation, it is always through settlement. Thedescriptive statistics of settle-
ment amounts presented in Panel B of Table II show that in manycircumstances the monetary
awards negotiated through settlements are considerably high. The mean settlement award in
our sample is $56.4 million - an amount larger than the average level of cash held by the
sued firm at the year of filing. Even when we include dismissed and withdrawn cases in the
computation of the settlement statistics by assigning to those cases an award of $0, the mean
settlement award to cash holdings is 59.6%. The largest settlement award amounts to $3.2
billion. These summary statistics demonstrate that these settlement amounts are by no means
trivial. In addition to explicit settlement costs, firms face other direct costs (e.g., attorneys
fees), and several indirect costs as explained in the introduction. Effectively, the total amount
of litigation costs is higher than the settlement costs presented in Table II. These costs ap-
pear large enough to induce firms to increase their cash holdings if the probability of a similar
lawsuit is high.
11

III. Empirical Results
A. Litigation Risk and Cash Holdings
To investigate the relationship between litigation risk and cash holdings, we first examine
the impact of litigation events on cash holdings in a univariate setting. We then explore the
relationship between litigation and cash holdings by employing various multivariate analyses.
We begin by analyzing the effect of litigation events on firmsthat are directly involved in
securities litigation. We then focus on the cross section ofCompustat firms and test whether
variousex ante measures of litigation risk can explain differences in cashholdings across
firms. To get a better handle on the causal link between changes in litigation risk and cash
holdings, we examine the effect of a litigation event for a particular firm on the cash holdings
of peer firms that are not involved in litigation themselves.Since higher cash holdings may
increase the probability of a litigation event in the first place, we then jointly estimate the prob-
ability of being brought into litigation and the effect of litigation on the firm’s cash holdings.
We also investigate the value implications of increased cash holdings brought on by changes
in litigation risk. Finally, we analyze the effect of litigation risk on corporate investments.
B. Univariate Analysis
Table III reports summary statistics for the cash holdings for US firms involved in litiga-
tions over the period 1996 to 2006. We report summary statistics in event time, where year
zero represents the year of the litigation filing. We then calculate means and quartiles of the
cash distribution for the two years prior and the two years following the litigation event. The
mean cash to total assets ratio in the year prior to the litigation filing is 0.223. Cash hold-
ings jump significantly in the year of the litigation, rising17.5% relative to the pre-litigation
level to 0.268. The increase in cash holdings appears to be persistent, remaining higher at
nearly 25% of total assets two years after the filing. Panel B confirms that this increase is
statistically significant for both the year of the litigation and the two-year period immediately
following the lawsuit. The mean difference between the litigation year and the two prior years
is 0.039 with a t-statistic of 3.545. The mean difference between the post-litigation period
12

(years 1 and 2) and the pre-litigation period (years -2 and -1) is also statistically significant,
with post-litigation holdings averaging 0.025 higher thanpre-litigation years.
To check that the mean increase is not driven by a few outliers, we also summarize changes
in the distribution of cash holdings in event time. Panel A reports the first quartile, median,
and third quartile of the cash holdings distribution for firms involved in litigation. The entire
distribution of cash holdings for the sample firms shifts upwards. The first quartile increases
from 0.029 to 0.046 in the litigation year, while the median and third quartile increase from
0.130 to 0.185 and 0.369 to 0.490, respectively.
The firm’s involved in litigation in our sample have slightlyhigher cash holdings even
before the litigation event. Two years before litigation, firms in the sample have a mean
cash-to-assets ratio of 0.224, compared with 0.191 for the overall Compustat sample. Firms
are possibly anticipating the incidence of a lawsuit and begin accumulating additional cash.
Alternatively, firms with higher cash holdings might be morelikely to be targeted for litigation
in the first place. In our multivariate analysis we revisit this possibility by investigating this
possible reverse causality between cash holdings and litigation risk.
C. Effects of Litigation on the Cash Holdings of Sued Firms
The univariate results suggest that firms involved in litigation do indeed increase their cash
holdings. We now turn to a multivariate approach to control for changing firm characteristics
and time trends that may also affect changes in cash holdings. We estimate several specifi-
cations of cash regressions in which the main independent variable of interest is a litigation
dummy variable. The specification of the cash holdings regression is similar to that of Opler
et. al (1999) and Bates, Kahle, and Stulz (2009), who identify potential determinants of cash
holdings, both in the cross-section and over time. The dependent variable in the regressions
is defined as cash and short-term investments scaled by net-of-cash total assets. As control
variables, we include firm size, leverage, cash flow, net working capital, dividend paying sta-
tus, market-to-book ratio, capital expenditures, acquisition expenditures, R&D to sales ratio,
net debt and equity issuance, and a measure of cash flow volatility. The specific definitions of
these variables are included in the appendix. The litigation dummy variable is set equal to one
13
in both the year of a litigation event and one year after. The timing of the dummy variable is
constructed to capture the duration of actual litigation events. Klausner and Hegland (2010)
find that the average time from class action filing to settlement is close to two years. Thus,
the dummy variable is meant to capture changes in cash holdings for firms directly involved
in litigation events. We also include industry and year fixedeffects in various specifications.
Table IV reports the estimates from the cash holdings regressions. Standard errors are
clustered at the firm level in all specifications. The first specification is estimated via ordinary
least squares without industry and time effects. The secondspecification adds time effects
in the form of calendar year dummies. The third and fourth specifications include industry
fixed effects, with the fourth specification including both industry and year dummies. The
magnitude and signs of the coefficients of the control variables are consistent with previous
research. The coefficients on the litigation event dummies are positive and statistically signif-
icant across all specifications, suggesting that firms permanently increase their cash holdings
following a litigation event. The fixed-effects estimates suggest that firms increase their cash
holdings above their pre-litigation levels by almost 4.7% of total assets. In economic terms,
this translates into a relative increase of about 15.5% relative to pre-litigation levels.
Bates, Kahle and Stulz (2009) indicate that cash holdings inthe United States have a
significant temporal trend. They find in their sample that average cash holdings increase by
129% between 1980 and 2004. While we control for various measures of time-varying firm
risk and calendar year dummies, there is still some concern that our results might be coming
from non-linear temporal trends in the data. To address thisconcern, we re-estimate the cash
holdings regressions over the sample period using random ’placebo’ dummy variables. To
do this, we randomly select 1,379 firm-year observations with replacement from the overall
Compustat sample. The sample size is selected such that we have an equal number of placebo
events as we have actual litigation events. For each firm-year randomly selected, we create
a dummy variable that is set equal to one for that firm after theyear of selection. After
the random selection, we end up with a variable that looks like the litigation dummy in the
previous regressions, except that the timing is randomly allocated across the panel. Thus,
if a temporal trend were driving the results in the earlier specifications, we would expect a
significantly positive coefficient on the random placebo variable. Specification (5) of Table IV
reports the estimates of this random placebo test. All of theestimates on the control variables
14
are similar as in the other specifications. The coefficient onthe placebo dummy variable is
0.004 and insignificant, suggesting that the effects in the other regressions are systematically
related to litigation events and not to temporal trends in the sample.
D. Litigation Risk and the Cross-section of Cash Holdings
The previous section documented that a firm’s cash holdings change in a systematic way
when it enters into securities litigation. We now turn and examine whether the risk of being
brought into litigation leads firms to increase their cash holdings, regardless of whether or not
they are actually involved in a lawsuit. To do so, we construct several ex ante measures of
litigation risk and investigate whether these measures canexplain some of the cross-sectional
variation in cash holdings in a multivariate setting.
We follow the literature related to securities litigation to obtain a predicted probability of
litigation for each firm-year using the method of Gande and Lewis (2009)and Kim and Skinner
(2010). They estimate the propensity to be sued by employinga probit model to generate the
predicted probability of being sued for a firm given various explanatory variables related to
the size of potential settlement or damages in the case of a lawsuit, the litigation environment
at a given point of time, and firm-specific variables.
The proxy variables for the size of potential damage awards include share turnover, stock
return volatility, stock returns, and firm size. High share turnover and return volatility capture
the idea that investors are more likely to purchase shares based on incorrect or misleading in-
formation and have been found to be positively related to actual damage awards (Dyl (1999)).
Jones and Weingram (1996) find evidence that firms with relatively high stock returns are less
likely to be sued. We also include the market value of equity to capture the idea that large
firms are more likely to be able to pay out large amounts in the case of a successful lawsuit.
To capture the overall litigation environment for a firm, Gande and Lewis (2009) include
litigation intensity variables for each industry and firm. To measure past litigation activity,
a dummy variable is set equal to one in a given firm-year if thatparticular firm has been
sued in a previous year. We measure litigation intensity in agiven industry as the number
of lawsuit actions in a given industry in year, where industry membership is given by the 4-
15
digit SIC code. To capture a potential non-linear relationship, Gande and Lewis (2009) also
include litigation intensity squared on the right hand sideof the probit regression as well.
Since lawsuits tend to cluster in specific industries, we also follow Lowry and Shu (2005) by
including dummy variables to indicate whether a firm is classified as a regulated, financial,
technology or retail firm.
Firm-specific factors include return on assets, unexpectedearnings, discretional accruals,
and executive ownership and compensation information. We include ROA to capture the over-
all performance of a firm as it is hypothesized that firms that perform better tend to be less
likely to be sued. Standardized unexpected earnings are thought to be negatively related to
the probability of being sued. Discretionary accruals, calculated using the modified Jones
model in Dechow, Sloan and Sweeney (1995), are included to capture whether firms are over-
reporting earnings. Two lags of discretionary accruals arealso included. The percentage of
total CEO compensation from bonuses, CEO share ownership, and an interaction between
bonus compensation and a dummy set equal to one if ROA is negative are included to control
for differences in incentives related to performance and reporting.
Table V reports the parameter estimates of a probit regression model where the dependent
variable is set to one if a firm is brought into a lawsuit and zero otherwise. Similar to the
findings of Gande and Lewis (2009), we find that the probability of being sued is positively
and significantly related with stock turnover, volatility,firm size, litigation intensity, and mem-
bership in the financial industry. The probability of being sued is negatively related to ROA
and standardized unexpected earnings. The model performs well in predicting actual litigation
events. The pseudo r-squared is 19% and the percent of concordant pairs based on predicted
probabilities is 83.2%, with only 15.7% of pairs being discordant.3
We use the specification in Table V and two other variations ofthe probit model to obtain
ex ante measures of litigation risk. The first measure is simply the predicted probabilities
from the probit model reported in Table V. The predicted probability for each firm-year is an
in-sample ex ante measure of litigation risk. We also construct two out-of-sample measures.
The first out-of-sample measure is obtained by estimating a probit regression each year us-
3A pair of observations with different values of the litigation event indicator are said to be concordant ifthe observation with the lower ordered response (no litigation event) has a lower predicted mean score than theobservation with the higher ordered response (litigation dummy equal to one).
16

ing data from all previous years and applying the parameter estimates to the following year’s
explanatory variables to obtain predicted probabilities.For example, to obtain predicted prob-
abilities for firms in 2001, we estimate the probit model overthe period 1995 to 2000 and
apply the parameter estimates to the information in 2001 andstore the predicted probabilities.
The second set out-of-sample predicted probabilities are obtained in a similar manner, except
that the estimation period is the rolling three-year windowjust prior to the year for which we
are obtaining the predicted probabilities. For example, for the predicted probabilities for firms
in 2001, we use data from 1998 to 2000 to estimate the necessary parameter estimates and
apply them to the 2001 data.
We then incorporate the ex ante measures of litigation risk into a standard cash holdings
regression framework. As before, to control for other potential determinants of a firm’s cash
holdings, we include other explanatory variables that are known to be correlated with cash
holdings (see Bates, Kahle and Stulz (2008)). The main variable of interest is the predicted
probability of litigation. We also include measures of idiosyncratic and systematic risk based
on the methodology of Hoberg and Prabhala (2009) to control for non-litigation risk in the
cash regressions.
Table VI reports the estimates of the cash regressions. The first three columns report the re-
sults of OLS regressions including the three different proxies of litigation risk with year fixed
effects. The litigation risk coefficients are positive and statistically significant at the 1% level.
In terms of economic magnitude, a one-standard deviation increase in predicted probability
of litigation leads to an expected increase in cash holdingsof 0.025 for the in-sample prob-
abilities, representing an expected increases in the cash/assets ratio of 16.5% relative to the
unconditional mean cash-to-assets ratio. The out-of-sample measures yield economic magni-
tudes of 0.018 and 0.017, respectively, representing expected percentage increases of 11.9%
and 11.3% given a one-standard deviation increase in these measures. The signs and magni-
tude of the coefficients of the control variables are consistent with that of Bates, Kahle and
Stulz (2008).
To alleviate concerns that some unobserved industry heterogeneity may be explaining the
results, we include industry fixed effects in the last three columns of Table VI. The coefficients
on the ex-ante measures of litigation risk remain statistically significant and positive. The
17
economic magnitudes of litigation risk are lower when we account for industry fixed effects,
dropping to a range of 5.9% to 6.5% increase in the expected cash/assets ratio in response to
a one-standard deviation increase in the predicted probability of being sued.
E. Spillover Effects of Litigation
The fundamental question we wish to address in this paper is whether litigation risk leads
firms to hold more cash. While we have demonstrated robust evidence consistent with this
hypothesis, establishing a causal link is challenging. Litigation risk is inherently unobservable
and difficult to measure and our measures may be correlated with some unobserved factor that
may driving the changes in cash holdings. To get a better handle on establishing a causal
link between litigation risk and cash holdings, we examine the spillover effects on other firms
that are not actually involved in litigation. The existenceof spillover effects around litigation
events suggest that firms update their subjective probability of being brought into litigation
when a peer firm has a case filed against it. Gande and Lewis (2009) find evidence to support
the spillover effects of litigation risk. They find that lawsuits in a given industry signal an
increased possibility that other firms in the same industry may be sued as well. In particular,
they find that peer firms have negative stock price reactions to the announcement of litigation
events for peer firms. It is reasonable then to assume that an actual lawsuit within an industry
is a good proxy for changes in litigation risk for other firms in the same industry. Employing
the spill-over proxy addresses the concerns about potential endogeneity as it is unlikely that
the characteristics of a firm not involved in litigation are driving the lawsuits of other firms.
We first estimate spillover effects in the panel of firms in oursample. We set the industry
litigation dummy variable to one for a given firm year if another firm in the same four-digit
SIC industry has had a class action lawsuit filed against it inthe same year. Firms that are
actually involved in litigation events are dropped from thesample.4 We then estimate the cash
holdings regression. The results are reported in the first column of Table VII. The coefficient
on the industry litigation dummy variable is positive and statistically significant, suggesting
that exogenous changes in litigation risk exposure lead to higher cash holdings.
4We have repeated the analysis with the sued firms included in the regression and the results are similar.These results are available upon request.
18

We also estimate the time-series effect of litigation on peer firms by constructing industry-
level observations based on firms that have not yet been involved in a litigation event. For
every 4-digit SIC industry each year, we include all firms that have not had any lawsuits filed
against them prior to that year. If at any time a firm in an industry becomes involved in
litigation, that firm is removed from the sample and we set an event dummy variable equal to
one for that industry. We use this dummy variable to measure the impact of the litigation on
the other, non-sued firms in the industry. The industry characteristics (cash holdings, leverage,
etc.) are measured in two ways. In the first approach, we equal-weight each firm in the
industry, so that a particular characteristic is the average of the firm characteristics of all
firms in that particular industry in a given year. In the second approach, we value-weight
the observations by summing up the numerators of the firm ratios and dividing them by the
sum of the denominators. For example, the industry cash holdings variable for industryk in
yeart would be
Cashkt =
Nk
∑i=1
Cashit
Nk
∑i=1
Assetsit
,
whereNk is the number of firms in industryk.
Table VII reports the results of the industry cash regressions. Column 2 reports the re-
sults from the equal-weighted industry observations, while column 3 reports the results for
the value-weighted observations. Year and industry fixed effects are added to some of the
specifications. The unconditional mean cash-to-assets ratio for the industry portfolios is 0.130
for the equal-weighted observations and 0.100 for the value-weighted observations. Table VII
demonstrates that litigation has an effect on the cash holdings of peer firms in the same indus-
try. Across all specifications, the coefficient on the industry litigation dummy is positive and
statistically significant. The results are also economically significant. The estimates imply
that industry cash holdings for the firms that are not involved in the litigation increases by
10.2% relative to the unconditional average in the equal-weighted case and a 15% increase in
the value-weighted case, suggesting that an exogenous change in the probability of a future
lawsuit leads firms to increase their cash holdings.
19

F. Joint Estimation of Cash Holdings and Litigation Risk
The results to this point suggest that firms tend to accumulate excess cash as a form of
insurance against future possible litigations. However, as mentioned earlier, high levels of
cash holdings might also increase the probability of class action lawsuits. We capture the
interaction between these two effects and control for the possible endogenous relation between
litigation risk and cash holdings by adopting the approach used by Lowry and Shu(2002) and
Field, Lowry, and Shu (2005). For this analysis we use the in-sample predicted probabilities
from the probit model reported in Table V as the litigation risk variable.5
We use the following system of equations:
Insurance Effect : Cash Ratio= γ1Litigation+θ1X +β1X1+ ε1, (1)
Enticement Effect : Litigation= γ2Cash Ratio+θ2X +β2X2+ ε2, (2)
where Cash Ratio is the ratio of cash and marketable securities to the book value of total
assets for firm i; Litigation is the probability of litigation for firm i, as described earlier;X is a
vector of control variables, exogenous firm characteristics that are common to both equations
because potentially related both to the cash ratio and to litigation risk;X1 is the identifying
variable of the first equation, an exogenous firm characteristic that is uniquely related to the
cash ratio, but not to litigation risk; andX2 is the identifying variable of the second equation,
an exogenous variable that is directly related to the probability of a lawsuit but not to the cash
ratio.
As identifying variableX1 we use firm leverage. The negative significant relation between
leverage and the cash ratio is well established in the financeliterature (e.g., Opler et al. (1999)
and Bates, Kahle, and Stulz (2007)). However studies of litigation risk determinants do not
find a significant relation between leverage and litigation risk (e.g., Cao and Narayanamoorthy
(2006)). As identifying variableX2 we use stock turnover. Stock turnover is related to plain-
5In untabulated tests, available upon request, we use another ex-ante proxy for litigation risk by assigningthe value of one to a litigation risk dummy for the firms that are involved in a litigation in the following yearas in Lowry and Shu (2002) and Field, Lowry, and Shu (2005). The coefficients maintain the same sign andsignificance.
20

tiffs’ incentives to initiate lawsuits because settlementamounts are generally increasing in the
number of shares traded at the allegedly misleading prices (Lowry and Shu (2002)). However,
stock turnover is not related to the cash ratio.
In the first stage of this analysis, we fit the two models with OLS and regressions using
all the exogenous variables. In the second stage, we replacethe original endogenous variables
(cash ratio and litigation risk) with their respective fitted values. Table V presents the results
of the second-stage regressions in which the dependent variables are the Cash Ratio and the
Litigation Risk respectively6. The table presents three different specifications. The first speci-
fication does not contain unionization rates and governancevariables, the second specification
contains the unionization rate variable, and the third specification contains the governance
index and managerial ownership variables.
In all specifications the litigation instrument (fitted value from the first stage) is signifi-
cantly related to the cash ratio, consistent with firms accumulating cash preceding the filing of
a lawsuit. The cash ratio instrument (fitted value from the first stage) is however not signifi-
cantly related to litigation risk. Thus, our estimation results do not support the conjecture that
firms with larger amounts of cash are more exposed to predatory class action lawsuits. The
majority of the coefficients of the other variables in the first specification are consistent with
previous literature on cash holdings and litigation risk, suggesting that the significant relation
between litigation risk and cash holdings is not due to the correlation between litigation risk
and other firm characteristics such as firm size or amount of dividend payouts.
In the second specification we control for the potential effect of industry unionization
rates on the level of cash holdings7. Our main results persist. In the cash ratio regression
the unionization rate variable is negative and significant consistent with Klasa, Maxwell, and
Ortiz-Molina (2009). In the last specification we control for the governance index and manage-
rial ownership. Our results persist also in this case. The governance variables are significant
and with signs consistent with the results reported by Dittmar and Mahrt-Smith (2007) and
6The results of the first-stage regressions are available upon request.7The industry unionization rate data that is publicly available at www.unionstats.com is organized by Census
Industry Classification (CIC) industries. Since some general SIC four-digit industries ending with 00 do notcorrespond to any specific CIC industry, about 5% of our observations have missing unionization rates when wemerge our Compustat data with unionization data. In order tonot losing these observations in our regressionswe equal missing unionization rates to 0 and create a “missing unionization” indicator variable equal to 1 whenunionization rates are missing, and 0 otherwise.
21

Harford, Mansi, and Maxwell (2008). In unreported regressions, we use the two out-sample
predicted probabilities to proxy for litigation risks. Thecoefficients maintain the same sign
and significance.
G. The Effect of Litigation Risk on the Market Valuation of Cash Hold-
ings
The evidence offered by our tests thus far presents a consistent picture. Firms that perceive
being significantly exposed to risk of litigation tend to accumulate cash in excess over what
predicted by the determinants established previously by the literature. An important question
is how the market values these changes in cash holdings. In this section we investigate to
what extent cash that is put aside preemptively to cope with the anticipated cost of litigation
contributes to firm value. A large portion of the settlement paid by the defendant firm is
allocated to the law firms of the plaintiffs and to plaintiff shareholders that are not anymore
shareholders of the firm at the time of the settlement. We expect, therefore, that the changes
in cash held by firms at risk of litigation contribute less to shareholder value than cash of firms
with low or no risk of litigation.
We investigate this issue by applying the method introducedby Faulkender and Wang
(2006). We present the results of our analysis on the valuation of cash holdings in Table IX.
The litigation variable used for this regression is the in-sample predicted probability from the
probit model reported in Table V. In unreported regressions, we instead use the two out-
sample predicted probabilities to proxy for litigation risks. The coefficients maintain the same
sign and significance. With the exception of the litigation risk variable and the unionization
rate variables, we construct all the other variables as in Faulkender and Wang (2006). We
measure all variables for the fiscal year preceding the litigation filing. The dependent variable
is the firm’s excess stock return calculated as the firm’s annual stock return minus the annual
stock return of the matched Fama and French 5 x 5 size and book-to-market portfolio. With
the exception of the litigation indicator variable, leverage, and the unionization variables, we
scale all other independent variables by the lagged market value of equity.
22
The results of all regressions presented in Table IX show that, consistent with Faulkender
and Wang (2006) and Pinkowitz and Williamson (2007), the coefficient of the annual change
in cash holdings is positive and significant. The litigationrisk variable is negative and sig-
nificant suggesting that, everything else constant, the stock market values significantly less
firms exposed to litigation risk. The coefficient of the interaction between the change in cash
holdings and the litigation risk variable is negative and significant, indicating that the marginal
value of an additional dollar of cash is lower for firms exposed to litigation risk. These find-
ings are consistent with the plaintiff law firms and former shareholders receiving a significant
portion of the settlement. Our result persists also when controlling for the potential effect
of the degree of industry unionization on the value of cash holdings as in Klasa, Maxwell,
and Ortiz-Molina (2009), and the Gompers, Ishii, and Metrick (2003) governance index as in
Dittmar and Mahrt-Smith (2007).
In order to appreciate the economic significance of the litigation risk on the value of cash,
we calculate the marginal value of a dollar of cash for the average sample firm using the mean
values of the independent variables that interact with the change in cash and their coefficients
in the first specification. We use the mean values of cash holdings divided by market value of
equity and market leverage of 21.5% and 15.2%, respectively. The marginal value of a dollar
of cash for a company with an average predicted probability of litigation (3.6%) is therefore
$0.93 = 1.246 -1.146 * 3.6% - 0.084 * 21.5% - 1.667 * 15.2%. Thisvalue is almost identical
to the marginal value of a dollar of cash for the average firm of$0.94 obtained by Faulkender
and Wang (2006). The marginal value of a dollar of cash for a company with a predicted
probability of litigation one standard deviation above themean (9.6%) is $0.86. The marginal
value of a dollar of cash for a company with a predicted probability of litigation equal to zero
(one standard deviation below the mean would be a negative number) is instead $0.97, that
is $0.11 higher. These results show that the contribution oflitigation risk to the firms’ value
of cash is economically significant. Overall, the results presented in Table IX show that the
negative effect of litigation risk on the incremental valueof cash holdings is both statistically
and economically significant.
23
H. Litigation and Corporate Investments
The results above show that firms increase their cash holdings in response to changes in
exposure to litigation risk. An important question that arises is whether this behavior has any
effect on real investment. That is, do firms forgo investmentin order to save cash due to the
lawsuit? To examine this possibility, we estimate the investment regression
Iit = αi +β1Litigationit +β2Qi,t−1+β3CFi,t−1+ γt + εit ,
whereIit is capital expenditures scaled by beginning-of-year net property, plant and equip-
ment,Qi,t−1 is beginning-of-year Tobin’sQ, andCFi,t−1 is the beginning-of-year cash flow
rate, andLitigationit is set equal to one if the firm is involved in a class action lawsuit in year
t.
The first two columns of Table X report the results where the litigation dummy is con-
structed based on the firms actually involved in the litigation. We see that for both specifica-
tions, capital expenditures decrease significantly duringthe class action filing year, consistent
with the view that firms are forgoing investment to accumulate cash. The third column consid-
ers litigation spillover effects on corporate investment.Here, we define the litigation dummy
based on the litigation events of peer firms in the same four-digit SIC industry. Thus, the
dummy is set to one for firmi if a firm in the same industry is involved in a class action law-
suit in yeart. The results provide evidence of spillover effects in corporate investment. Firms
that are not involved in litigation reduce capital expenditures and save cash when peer firms
are sued. The magnitude is smaller than for the sued firms, butstill economically significant.
The coefficient on the litigation dummy in column three implies that firms reduce their invest-
ment rates on average by about 4.6% compared to years when no firms in an industry are in
the litigation process.
IV. Robustness Checks
In this section, we conduct various robustness tests related to the cash holdings results
presented above. One possible concern is related to using the ratio of cash to net-of-cash
24

total assets as our measure of cash holdings. Possible changes in the level of assets before
a lawsuit could significantly change the value of this variable and generate spurious results.
If, for instance, the goodwill impairment following an unsuccessful merger triggered a class
action lawsuit, the cash ratio would be higher pre-litigation due to a decline in assets (the
denominator) instead of an increase in cash (the numerator). To address this concern, we
replicate all our multivariate tests replacing the cash ratio with the natural logarithm of cash
and short-term securities to verify that our results are driven by cash levels and not assets
levels. These robustness checks are reported in the first four columns of Table XI. The first
column replicates the specification reported in Table IV where the litigation dummy is set
equal to one in the year of the class action filing and the year after, and zero otherwise. The
coefficient on the litigation dummy is large, positive, and statistically significant, suggesting
that our results are driven by changes in cash levels and not by changes in assets. Columns
2 through 4 repeat the cash regressions employing our ex-ante litigation risk measures. The
coefficients maintain the same sign and degree of significance as those presented in Table VI.
In untabulated tests we replicate all other cash regressions using the log of cash levels instead
of the cash-to-assets. All our results discussed in SectionIII are unaffected by this different
measure of cash holdings.
Even though class action security lawsuits are the most common type of litigation faced
by U.S. corporations, there exist many other types of lawsuits that have the ability to affect lit-
igation risk. As reported in the data section, we collect information about corporate litigations
other than security class action lawsuits from the Audit Analytics Litigation database. Our
sample of non-security lawsuits obtained from Audit Analytics spans the time period from
2000 to 2006. The most common types of corporate lawsuits areproduct liability, copyright
and patent, and antitrust and trade regulation litigations. These lawsuits are less likely to be
triggered by a decline in stock price performance than security lawsuits. Therefore, expanding
the sample to all lawsuits allows us to verify that our results are not driven by a possible corre-
lation between a general shortfall risk and litigation risk8. The last two columns of Table XI
reports the results of cash holdings regressions using non-security lawsuits to construct the
dummy variables and predicted probabilities for litigation events. The fifth column replicates
the cash regressions using the predicted probability of lawsuits as the explanatory variable and
8This is, however, a minor concern because in our main regressions we control for systematic and idiosyn-cratic risk.
25

the last column reports the cash regression results using the dummy variable approach. In
both cases, we find a strong, positive relationship between cash holdings and measures of liti-
gation risk. The findings in this section suggest that other types of litigation, not just securities
law cases, have a significant effect on corporate liquidity policy. In untabulated analyses, we
replicate all other regressions of this study with the AuditAnalytics sample. The results are
comparable to those obtained with the class action securitylawsuits sample.
V. Conclusions
In this study we link a major external source of corporate risk, litigation risk, with two of
the main corporate financial decisions that executives haveto make, the amount of cash to hold
on the balance sheet and the level of corporate investments to sustain firm’s growth. We find
that the risk of litigation, independently from the way we measure it, significantly affects the
amount of corporate cash holdings. Firms at risk of being sued tend to hold significant larger
amounts of cash even after controlling for a comprehensive array of cash determinants and
possible time effects. We also show that firms pre-emptivelyaccumulate cash before possible
lawsuits rather than stakeholders targeting firms with ex-ante high levels of cash. The impact
of litigation risk on cash holdings is not limited to firms that are actually sued. We find strong
evidence of spillover effects within industries. That is, when a firm is brought into a class
action lawsuit under the Securities Acts, peer firms in the same industry respond by increasing
their holdings as they revise their perceived exposure to litigation risk upwards.
We also provide evidence on the impact of litigation risk on the marginal value of cash. A
dollar of cash is worth less for firms at risk of litigation, likely a reflection of the multiplicity
of recipients of class action lawsuit settlements. Even though cash provides insurance against
possible lawsuit settlements costs, because part of the settlement goes to the plaintiff law firms
and stakeholders that do not currently own shares of the defendant companies, shareholders
appear to value corporate cash less for firms that are expected to pay damages in the near
future.
We find that litigation risk affects corporate investment decisions. Our results suggest
that firms forgo capital expenditures to save cash in response to increases in litigation risk
26
exposure. This finding suggests that the legal protection available to firms stakeholders can
have the unintended consequence of depressing the level of corporate investments.
It is well known that firms on average hold significant amountsof cash. Several studies,
beginning with Opler, Pinkowitz, Stulz and Williamson (1999) show that firm characteristics
cannot totally explain the large amount of cash held by firms on average. Our study identifies
a new determinant of corporate cash holdings that is clearlyrelated to the precautionary mo-
tive for accumulating large quantities of cash reserves. The results of this paper suggest that
institutions, not just firm characteristics, interact withthe costs and benefits of holding liquid
assets. The empirical results also provide an insight into how firms manage risk in general.
Firms appear to deal with litigation risks in an integrated manner, hedging the risk by both en-
tering into limited insurance contracts and holding a larger cash buffer to offset the increased
variability in expected cash flows.
27

ReferencesBarber, B.M., Lyon, J.D., 1996. Detecting abnormal operating performance: the empiricalpower and specification of test-statistics. Journal of Financial Economics 41, 359–399.
Bates, T., Kahle, K. and R. Stulz, 2008. Why do U.S. firms hold so much more cash thanthey used to? Journal of Finance, 64, 1985–2021.
Bhagat, S., Brickley, J. A., and Coles, J.L, 1994. The costs of inefficient bargaining andfinancial distress: evidence from corporate lawsuits. Journal of Financial Economics, Vol. 35,221–247.
Bizjak, J. M., and J. L. Coles, 1995. The effect of private antitrust litigation on the stock-market valuation of the firm. American Economic Review, 85, 436–461.
Cox, J.D. and R.S. Thomas, 2004. SEC enforcement actions forfinancial fraud and privatelitigation: an empirical inquiry. Duke Law Journal, Vol. 53.
Dittmar, A., and J. Mahrt-Smith, 2007. Corporate governance and the value of cash hold-ings. Journal of Financial Economics 83, 599–634.
Dittmar, A., Mahrt-Smith, J. and H. Servaes, 2003. International corporate governance andcorporate cash holdings. Journal of Financial and Quantitative Analysis, 38, 111–133.
DuCharme, L., Malatesta, P and Sefcik, S., 2004. Earnings management, stock issues, andshareholder lawsuits, Journal of Financial Economics 71, 27–40.
Dyl, E.A., 1999. Estimating economic damages in class action securities fraud litigation.Journal of Forensic Economics, Vol. 12.
Engelmann, K. and B. Cornell, 1988, Measuring the cost of corporate litigation: Five casestudies,Journal of Legal Studies 17, 377–399/
Faulkender, M. and R. Wang, 2006. Corporate financial policyand the value of cash. Journalof Finance, 61, 1957–1990.
Ferris, S. P.; T. Jandik; R. M. Lawless; and A. Makhija, 2007.Derivative lawsuits as a corpo-rate governance mechanism: empirical evidence on board changes surrounding filings. Journalof Financial and Quantitative Analysis, 42, 143–165.
Ferris, S.P., Pritchard, A. C., 2001. Stock price reactionsto securities fraud class actionsunder the private securities litigation reform act. The University of Michigan Law and Eco-nomics Research Paper No. 01–009.
28
Fich, E., and A. Shivdasani, 2007. Financial fraud, director reputation, and shareholderwealth, Journal of Financial Economics, 86(2), 306–336.
Field, L., Lowry, M. and S. Shu, 2005. Does disclosure deter or trigger litigation?, Jour-nal of Accounting and Economics, September, 487–507.
Foley, C.F., Hartzell, J., Titman, S. and G. Twite, 2007. Whydo firms hold so much cash? Atax-based explanation. Journal of Financial Economics, 86, no. 3, 579–607.
Froot, K.A. and J.C. Stein, 1998. Risk management, capital budgeting, and capital struc-ture policy for financial institutions: an integrated approach. Journal of Financial Economics,47, 55–82.
Gande, A. and C. M. Lewis, 2009. Shareholder initiated classaction lawsuits: shareholderwealth effects and industry spillovers. Forthcoming, Journal of Financial and QuantitativeAnalysis.
Gompers, P., J. Ishii, and A. Metrick, 2003. Corporate governance and equity prices. Quar-terly Journal of Economics 118, 107–155.
Gormley, T. and D. Matsa, 2009. Growing out of trouble? Legalliability and corporateresponses to adversity, forthcoming Review of Financial Studies.
Haushalter, G.D., S. Klasa, and W.F. Maxwell, 2007. The influence of product market dy-namics on a firms cash holdings and hedging behavior. Journalof Financial Economics 84,797–825.
Harford, J., S.A. Mansi, and W.F. Maxwell, 2008. Corporate governance and firm cash hold-ings. Journal of Financial Economics 87(3):535–555..
Johnson, M., Nelson, K. and Pritchard, A., 2007. Do the merits matter more? Class actionsunder the Private Securities Litigation Reform Act, Journal of Law, Economics, and Organi-zation, 23, 598–626
Jones, C. L. and Weingram, S. E., 1996. The determinants of 10b-5 litigation risk, unpub-lished working paper, John M. Olin Program in Law and Economics, Stanford Law School,Stanford, CA.
Klausner, M. and J. Hegland, 2010, When are securities classactions dismissed, when dothey settle, and for how much? - Part II,Professional Liability Underwriting Society Journal23, 1–5.
Karpoff, J. M.; D. S. Lee; and G. S. Martin, 2008, The cost to firms of cooking the books.Journal of Financial and Quantitative Analysis, 43, 581–612.
29
Keynes, J.M., 1936. The General Theory of Employment. In: Interest and Money. Har-court Brace, London.
Kim, C., Mauer, D.C., Sherman, A.E., 1998. The determinantsof corporate liquidity: the-ory and evidence. Journal of Financial and Quantitative Analysis 33, 305–334.
Kim, I.Y. and D.J. Skinner, 2010, Measuring securities litigation risk, working paper, Uni-versity of Chicago.
Klasa, S., Maxwell, W.F., and H. Ortiz-Molina, 2009. The strategic use of corporate cashholdings in collective bargaining with labor unions. Journal of Financial Economics, Volume92, Issue 3, 421–442.
Lie, E., 2001. Detecting abnormal operating performance: revisited. Financial Management,30, 77–91.
Lins, K.V., H. Servaes, and P. Tufano, 2010, What drives corporate liquidity? An internationalsurvey of cash holdings and lines of credit,Journal of Financial Economics 98, 160–176.
Lowry, M. and S. Shu, 2002. Litigation risk and IPO underpricing, Journal of Financial Eco-nomics, 309–336.
Mikkelson, W., and M. Partch, 2003. Do persistent large cashreserves hinder performance?Journal of Financial and Quantitative Analysis, 38, 275–294.
Opler, T., Pinkowitz, L., Stulz, R., and R. Williamson, 1999. The determinants and impli-cations of corporate cash holdings. Journal of Finance, 52,3–46.
Peng, L. and A. Roell, 2008. Executive pay, earnings manipulation and shareholder law-suits. Review of Finance, 12, 141–184.
Pinkowitz, L. and R. Williamson, 2007. What is the market value of a dollar of corporatecash?, Journal of Applied Corporate Finance, 19(3), 74–81.
Riddick, L.A. and T. Whited, 2009. The corporate propensityto save, Journal of Finance,64, 1729–1766.
Romano, R., 1991, The shareholder suit: litigation withoutfoundation? Journal of Law, Eco-nomics, and Organizations, 7 , 55–87.
Simmons, R.W. and R.C. Hoyt. 1993. Economic damage analysisin Rule 10b-5 securitieslitigations. Journal of Legal Economics, 3(1), 71–88.
30

Skinner, D., 1996. Why is stockholder litigation tied to accounting and disclosure problems?Working paper, University of Michigan.
Zingales, L., 2006. Is the U.S. capital market losing its competitive edge? Working paper,University of Chicago.
31
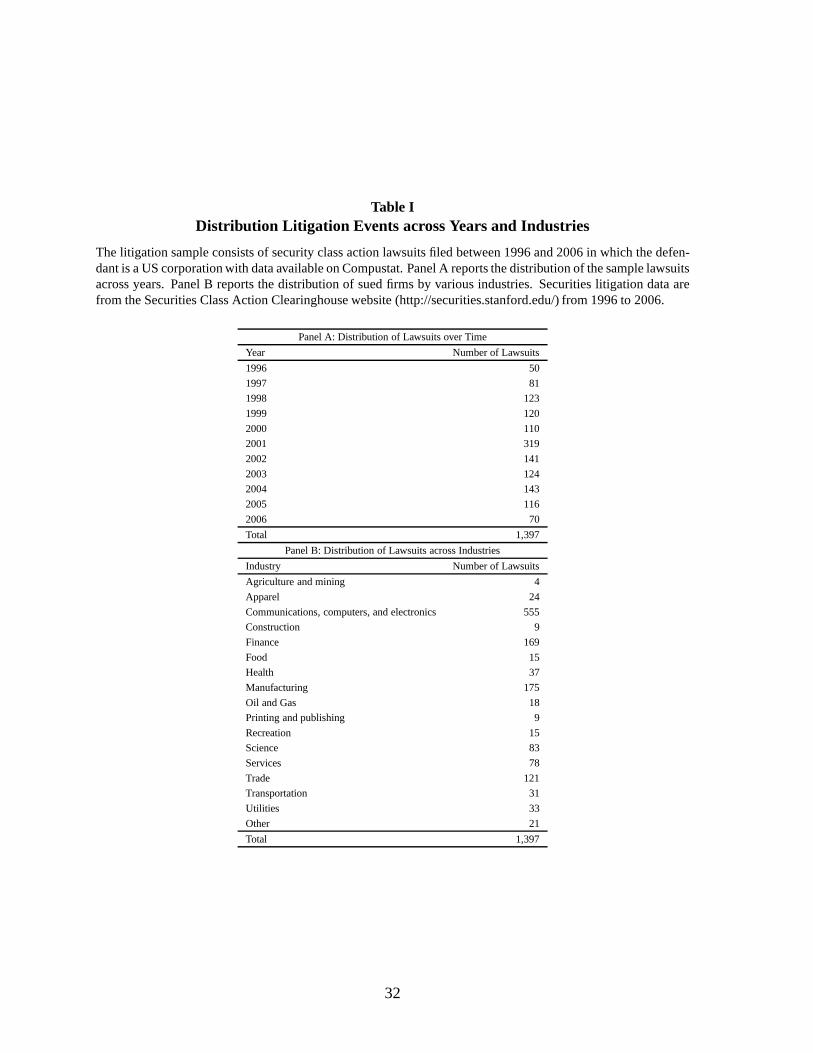
Table IDistribution Litigation Events across Years and Industries
The litigation sample consists of security class action lawsuits filed between 1996 and 2006 in which the defen-dant is a US corporation with data available on Compustat. Panel A reports the distribution of the sample lawsuitsacross years. Panel B reports the distribution of sued firms by various industries. Securities litigation data arefrom the Securities Class Action Clearinghouse website (http://securities.stanford.edu/) from 1996 to 2006.
Panel A: Distribution of Lawsuits over Time
Year Number of Lawsuits
1996 50
1997 81
1998 123
1999 120
2000 110
2001 319
2002 141
2003 124
2004 143
2005 116
2006 70
Total 1,397
Panel B: Distribution of Lawsuits across Industries
Industry Number of Lawsuits
Agriculture and mining 4
Apparel 24
Communications, computers, and electronics 555
Construction 9
Finance 169
Food 15
Health 37
Manufacturing 175
Oil and Gas 18
Printing and publishing 9
Recreation 15
Science 83
Services 78
Trade 121
Transportation 31
Utilities 33
Other 21
Total 1,397
32

Table IILawsuit Resolution Statistics
Panel A presents the outcomes of the lawsuits contained in our security class action litigation sample as ofDecember 31, 2009. Panel B presents summary statistics related to the settlement amounts for the closedcases. For the statistics of “all non-pending cases” we assign a settlement amount equal to 0 to dismissedand withdrawn cases. Securities litigation data are from the Securities Class Action Clearinghouse website(http://securities.stanford.edu/) from 1996 to 2006.
Panel A: Litigation Outcome
Number of Cases Percent of Total
Settled 613 43.9%
Dismissed or withdrawn 515 36.9%
Still pending 269 19.3%
Total 1,397
Panel B: Settlement Amount
Mean Median 25th Percentile 75th Percentile Maximum
Excluding Dismissed and Withdrawn Cases
Settlement ($ millions) 56.4 6.5 3.0 19.3 3,200.0
Settlement / Cash Holdings 114.9% 15.8% 4.1% 54.7% 11,526.5%
All Non-Pending Cases∗
Settlement ($ millions) 29.2 2.3 0.0 7.0 3,200.0
Settlement / Cash Holdings 59.6% 4.3% 0.0% 27.8% 11,526.5%∗In “all non-pending cases” we assign 0 to the settlement amount for dismissed and withdrawn cases.
33
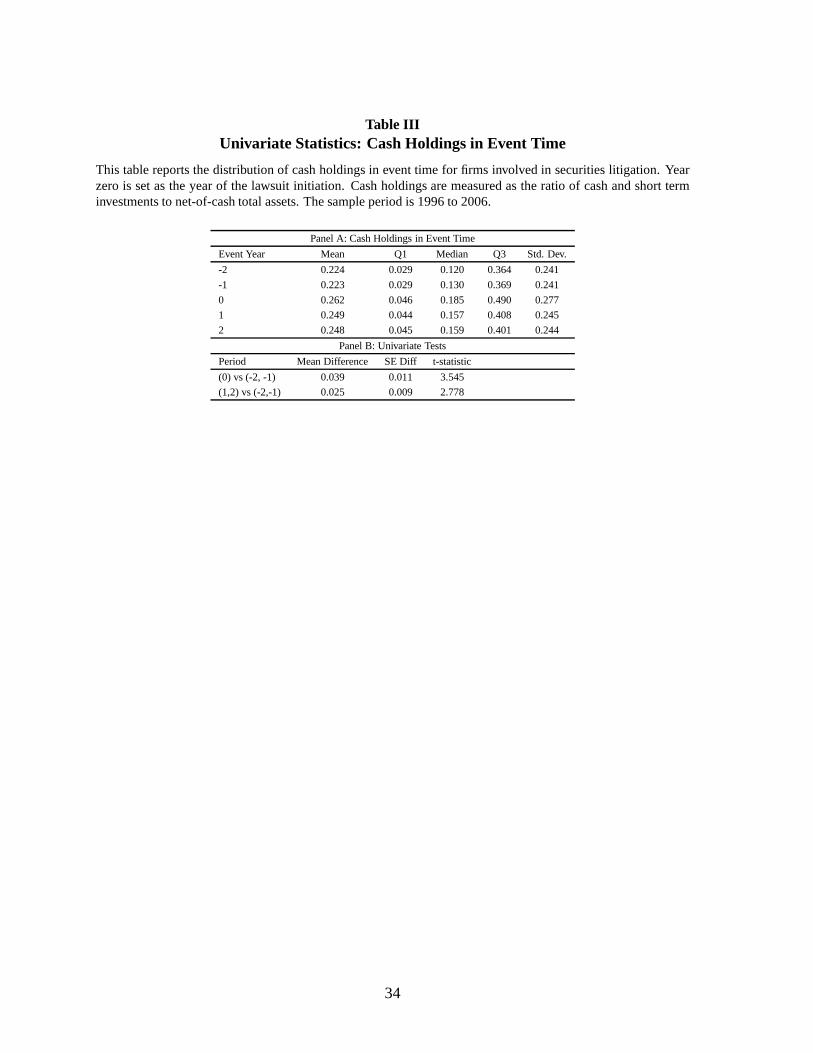
Table IIIUnivariate Statistics: Cash Holdings in Event Time
This table reports the distribution of cash holdings in event time for firms involved in securities litigation. Yearzero is set as the year of the lawsuit initiation. Cash holdings are measured as the ratio of cash and short terminvestments to net-of-cash total assets. The sample periodis 1996 to 2006.
Panel A: Cash Holdings in Event Time
Event Year Mean Q1 Median Q3 Std. Dev.
-2 0.224 0.029 0.120 0.364 0.241
-1 0.223 0.029 0.130 0.369 0.241
0 0.262 0.046 0.185 0.490 0.277
1 0.249 0.044 0.157 0.408 0.245
2 0.248 0.045 0.159 0.401 0.244
Panel B: Univariate Tests
Period Mean Difference SE Diff t-statistic
(0) vs (-2, -1) 0.039 0.011 3.545
(1,2) vs (-2,-1) 0.025 0.009 2.778
34
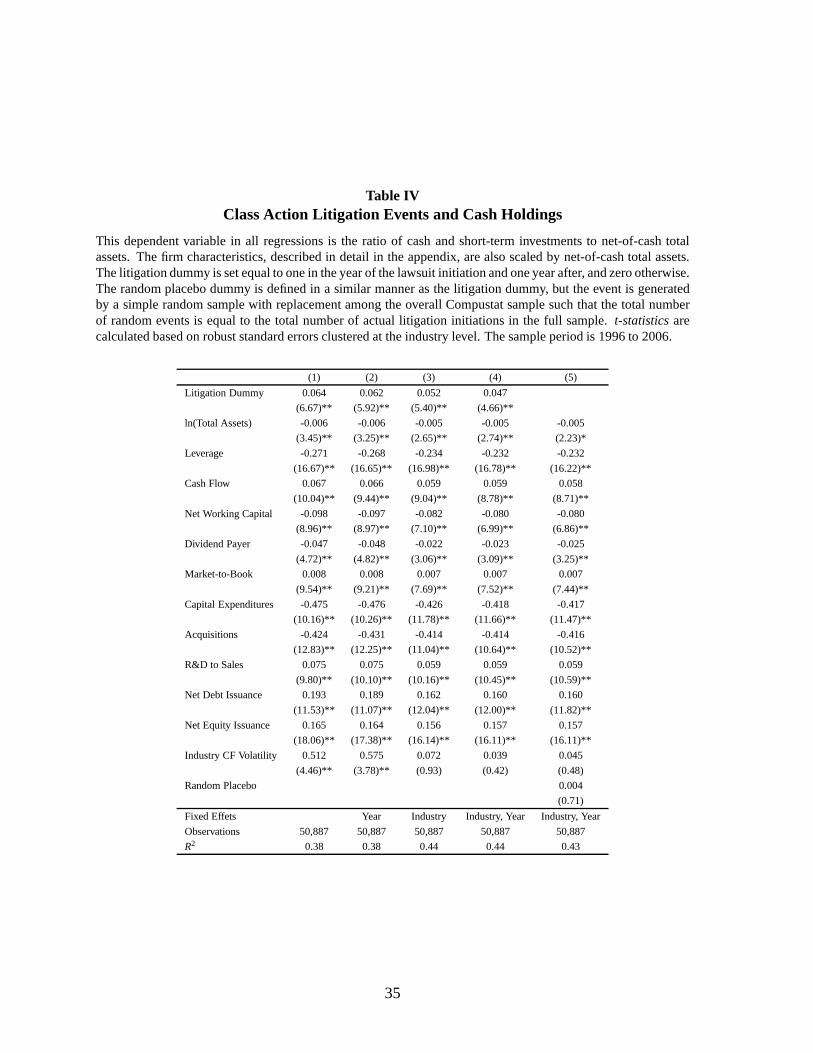
Table IVClass Action Litigation Events and Cash Holdings
This dependent variable in all regressions is the ratio of cash and short-term investments to net-of-cash totalassets. The firm characteristics, described in detail in theappendix, are also scaled by net-of-cash total assets.The litigation dummy is set equal to one in the year of the lawsuit initiation and one year after, and zero otherwise.The random placebo dummy is defined in a similar manner as the litigation dummy, but the event is generatedby a simple random sample with replacement among the overallCompustat sample such that the total numberof random events is equal to the total number of actual litigation initiations in the full sample.t-statistics arecalculated based on robust standard errors clustered at theindustry level. The sample period is 1996 to 2006.
(1) (2) (3) (4) (5)
Litigation Dummy 0.064 0.062 0.052 0.047
(6.67)** (5.92)** (5.40)** (4.66)**
ln(Total Assets) -0.006 -0.006 -0.005 -0.005 -0.005
(3.45)** (3.25)** (2.65)** (2.74)** (2.23)*
Leverage -0.271 -0.268 -0.234 -0.232 -0.232
(16.67)** (16.65)** (16.98)** (16.78)** (16.22)**
Cash Flow 0.067 0.066 0.059 0.059 0.058
(10.04)** (9.44)** (9.04)** (8.78)** (8.71)**
Net Working Capital -0.098 -0.097 -0.082 -0.080 -0.080
(8.96)** (8.97)** (7.10)** (6.99)** (6.86)**
Dividend Payer -0.047 -0.048 -0.022 -0.023 -0.025
(4.72)** (4.82)** (3.06)** (3.09)** (3.25)**
Market-to-Book 0.008 0.008 0.007 0.007 0.007
(9.54)** (9.21)** (7.69)** (7.52)** (7.44)**
Capital Expenditures -0.475 -0.476 -0.426 -0.418 -0.417
(10.16)** (10.26)** (11.78)** (11.66)** (11.47)**
Acquisitions -0.424 -0.431 -0.414 -0.414 -0.416
(12.83)** (12.25)** (11.04)** (10.64)** (10.52)**
R&D to Sales 0.075 0.075 0.059 0.059 0.059
(9.80)** (10.10)** (10.16)** (10.45)** (10.59)**
Net Debt Issuance 0.193 0.189 0.162 0.160 0.160
(11.53)** (11.07)** (12.04)** (12.00)** (11.82)**
Net Equity Issuance 0.165 0.164 0.156 0.157 0.157
(18.06)** (17.38)** (16.14)** (16.11)** (16.11)**
Industry CF Volatility 0.512 0.575 0.072 0.039 0.045
(4.46)** (3.78)** (0.93) (0.42) (0.48)
Random Placebo 0.004
(0.71)
Fixed Effets Year Industry Industry, Year Industry, Year
Observations 50,887 50,887 50,887 50,887 50,887
R2 0.38 0.38 0.44 0.44 0.43
35
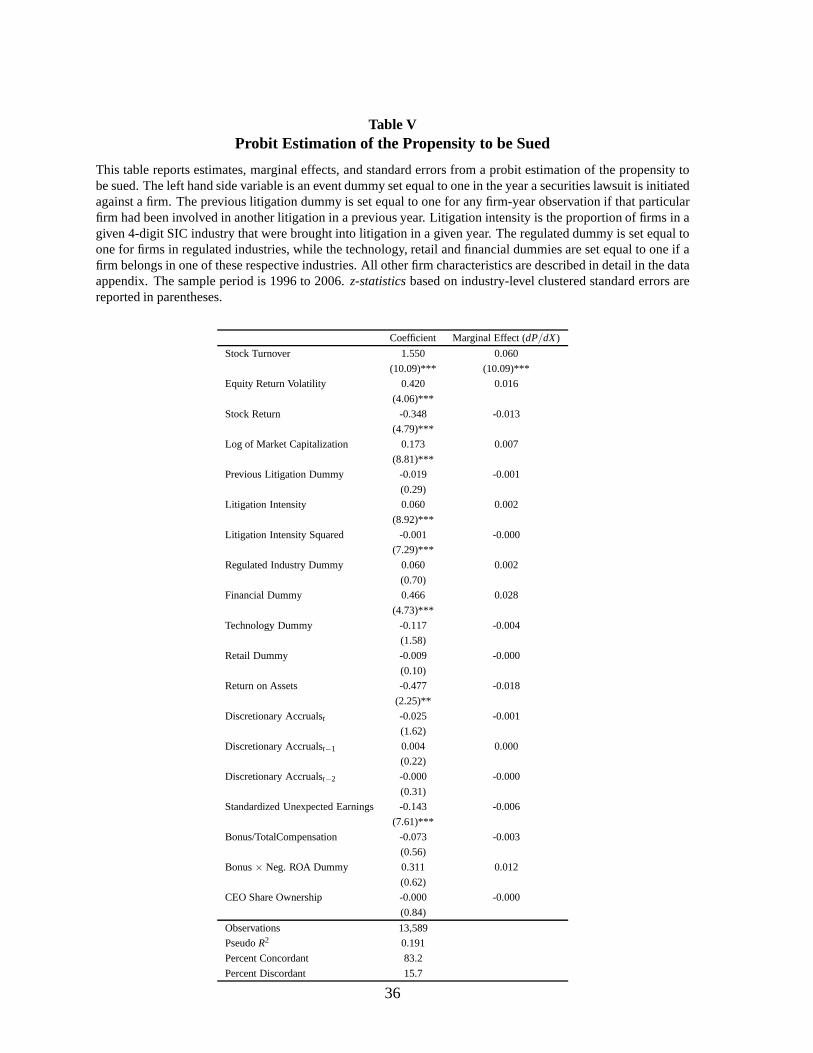
Table VProbit Estimation of the Propensity to be Sued
This table reports estimates, marginal effects, and standard errors from a probit estimation of the propensity tobe sued. The left hand side variable is an event dummy set equal to one in the year a securities lawsuit is initiatedagainst a firm. The previous litigation dummy is set equal to one for any firm-year observation if that particularfirm had been involved in another litigation in a previous year. Litigation intensity is the proportion of firms in agiven 4-digit SIC industry that were brought into litigation in a given year. The regulated dummy is set equal toone for firms in regulated industries, while the technology,retail and financial dummies are set equal to one if afirm belongs in one of these respective industries. All otherfirm characteristics are described in detail in the dataappendix. The sample period is 1996 to 2006.z-statistics based on industry-level clustered standard errors arereported in parentheses.
Coefficient Marginal Effect (dP/dX)
Stock Turnover 1.550 0.060
(10.09)*** (10.09)***
Equity Return Volatility 0.420 0.016
(4.06)***
Stock Return -0.348 -0.013
(4.79)***
Log of Market Capitalization 0.173 0.007
(8.81)***
Previous Litigation Dummy -0.019 -0.001
(0.29)
Litigation Intensity 0.060 0.002
(8.92)***
Litigation Intensity Squared -0.001 -0.000
(7.29)***
Regulated Industry Dummy 0.060 0.002
(0.70)
Financial Dummy 0.466 0.028
(4.73)***
Technology Dummy -0.117 -0.004
(1.58)
Retail Dummy -0.009 -0.000
(0.10)
Return on Assets -0.477 -0.018
(2.25)**
Discretionary Accrualst -0.025 -0.001
(1.62)
Discretionary Accrualst−1 0.004 0.000
(0.22)
Discretionary Accrualst−2 -0.000 -0.000
(0.31)
Standardized Unexpected Earnings -0.143 -0.006
(7.61)***
Bonus/TotalCompensation -0.073 -0.003
(0.56)
Bonus× Neg. ROA Dummy 0.311 0.012
(0.62)
CEO Share Ownership -0.000 -0.000
(0.84)
Observations 13,589
PseudoR2 0.191
Percent Concordant 83.2
Percent Discordant 15.7
36
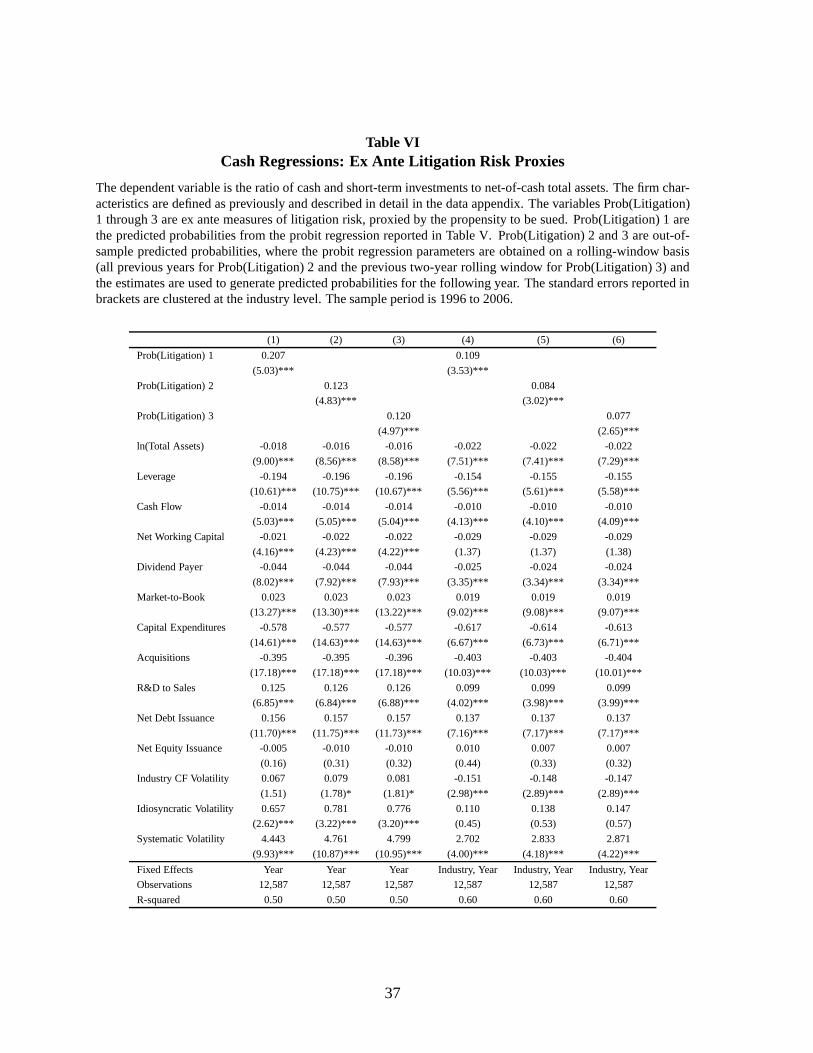
Table VICash Regressions: Ex Ante Litigation Risk Proxies
The dependent variable is the ratio of cash and short-term investments to net-of-cash total assets. The firm char-acteristics are defined as previously and described in detail in the data appendix. The variables Prob(Litigation)1 through 3 are ex ante measures of litigation risk, proxied by the propensity to be sued. Prob(Litigation) 1 arethe predicted probabilities from the probit regression reported in Table V. Prob(Litigation) 2 and 3 are out-of-sample predicted probabilities, where the probit regression parameters are obtained on a rolling-window basis(all previous years for Prob(Litigation) 2 and the previoustwo-year rolling window for Prob(Litigation) 3) andthe estimates are used to generate predicted probabilitiesfor the following year. The standard errors reported inbrackets are clustered at the industry level. The sample period is 1996 to 2006.
(1) (2) (3) (4) (5) (6)
Prob(Litigation) 1 0.207 0.109
(5.03)*** (3.53)***
Prob(Litigation) 2 0.123 0.084
(4.83)*** (3.02)***
Prob(Litigation) 3 0.120 0.077
(4.97)*** (2.65)***
ln(Total Assets) -0.018 -0.016 -0.016 -0.022 -0.022 -0.022
(9.00)*** (8.56)*** (8.58)*** (7.51)*** (7.41)*** (7.29) ***
Leverage -0.194 -0.196 -0.196 -0.154 -0.155 -0.155
(10.61)*** (10.75)*** (10.67)*** (5.56)*** (5.61)*** (5. 58)***
Cash Flow -0.014 -0.014 -0.014 -0.010 -0.010 -0.010
(5.03)*** (5.05)*** (5.04)*** (4.13)*** (4.10)*** (4.09) ***
Net Working Capital -0.021 -0.022 -0.022 -0.029 -0.029 -0.029
(4.16)*** (4.23)*** (4.22)*** (1.37) (1.37) (1.38)
Dividend Payer -0.044 -0.044 -0.044 -0.025 -0.024 -0.024
(8.02)*** (7.92)*** (7.93)*** (3.35)*** (3.34)*** (3.34) ***
Market-to-Book 0.023 0.023 0.023 0.019 0.019 0.019
(13.27)*** (13.30)*** (13.22)*** (9.02)*** (9.08)*** (9. 07)***
Capital Expenditures -0.578 -0.577 -0.577 -0.617 -0.614 -0.613
(14.61)*** (14.63)*** (14.63)*** (6.67)*** (6.73)*** (6. 71)***
Acquisitions -0.395 -0.395 -0.396 -0.403 -0.403 -0.404
(17.18)*** (17.18)*** (17.18)*** (10.03)*** (10.03)*** ( 10.01)***
R&D to Sales 0.125 0.126 0.126 0.099 0.099 0.099
(6.85)*** (6.84)*** (6.88)*** (4.02)*** (3.98)*** (3.99) ***
Net Debt Issuance 0.156 0.157 0.157 0.137 0.137 0.137
(11.70)*** (11.75)*** (11.73)*** (7.16)*** (7.17)*** (7. 17)***
Net Equity Issuance -0.005 -0.010 -0.010 0.010 0.007 0.007
(0.16) (0.31) (0.32) (0.44) (0.33) (0.32)
Industry CF Volatility 0.067 0.079 0.081 -0.151 -0.148 -0.147
(1.51) (1.78)* (1.81)* (2.98)*** (2.89)*** (2.89)***
Idiosyncratic Volatility 0.657 0.781 0.776 0.110 0.138 0.147
(2.62)*** (3.22)*** (3.20)*** (0.45) (0.53) (0.57)
Systematic Volatility 4.443 4.761 4.799 2.702 2.833 2.871
(9.93)*** (10.87)*** (10.95)*** (4.00)*** (4.18)*** (4.2 2)***
Fixed Effects Year Year Year Industry, Year Industry, Year Industry, Year
Observations 12,587 12,587 12,587 12,587 12,587 12,587
R-squared 0.50 0.50 0.50 0.60 0.60 0.60
37
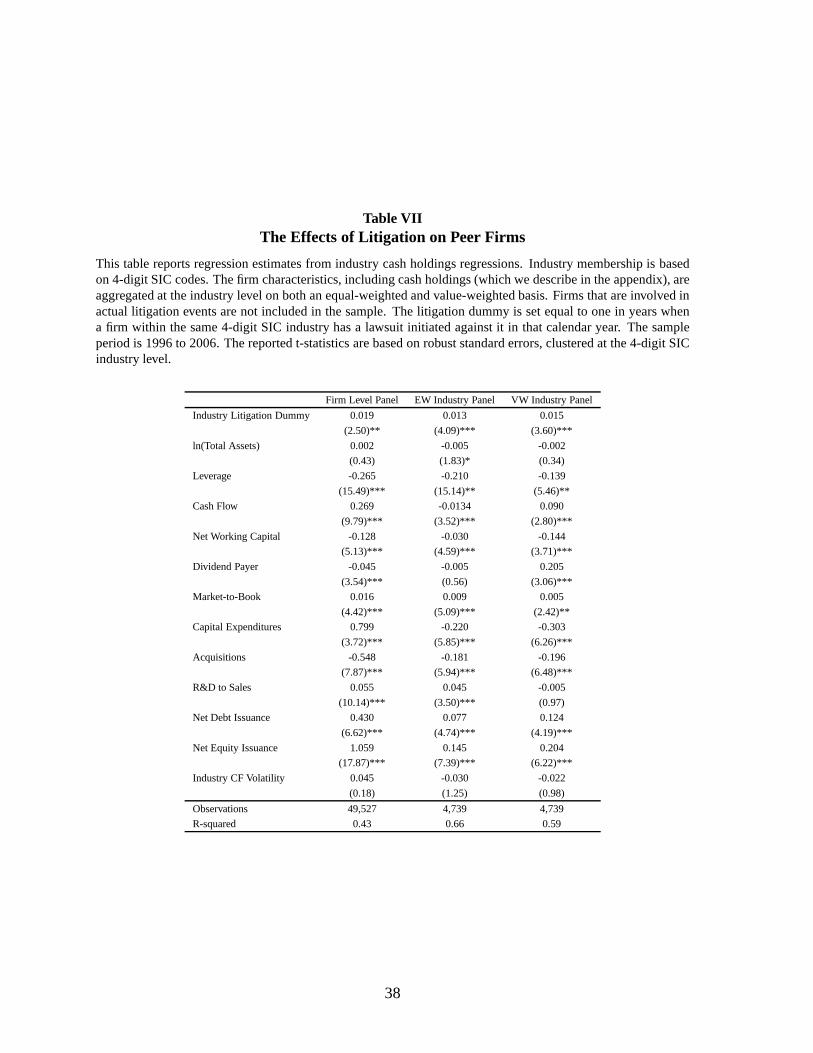
Table VIIThe Effects of Litigation on Peer Firms
This table reports regression estimates from industry cashholdings regressions. Industry membership is basedon 4-digit SIC codes. The firm characteristics, including cash holdings (which we describe in the appendix), areaggregated at the industry level on both an equal-weighted and value-weighted basis. Firms that are involved inactual litigation events are not included in the sample. Thelitigation dummy is set equal to one in years whena firm within the same 4-digit SIC industry has a lawsuit initiated against it in that calendar year. The sampleperiod is 1996 to 2006. The reported t-statistics are based on robust standard errors, clustered at the 4-digit SICindustry level.
Firm Level Panel EW Industry Panel VW Industry Panel
Industry Litigation Dummy 0.019 0.013 0.015
(2.50)** (4.09)*** (3.60)***
ln(Total Assets) 0.002 -0.005 -0.002
(0.43) (1.83)* (0.34)
Leverage -0.265 -0.210 -0.139
(15.49)*** (15.14)** (5.46)**
Cash Flow 0.269 -0.0134 0.090
(9.79)*** (3.52)*** (2.80)***
Net Working Capital -0.128 -0.030 -0.144
(5.13)*** (4.59)*** (3.71)***
Dividend Payer -0.045 -0.005 0.205
(3.54)*** (0.56) (3.06)***
Market-to-Book 0.016 0.009 0.005
(4.42)*** (5.09)*** (2.42)**
Capital Expenditures 0.799 -0.220 -0.303
(3.72)*** (5.85)*** (6.26)***
Acquisitions -0.548 -0.181 -0.196
(7.87)*** (5.94)*** (6.48)***
R&D to Sales 0.055 0.045 -0.005
(10.14)*** (3.50)*** (0.97)
Net Debt Issuance 0.430 0.077 0.124
(6.62)*** (4.74)*** (4.19)***
Net Equity Issuance 1.059 0.145 0.204
(17.87)*** (7.39)*** (6.22)***
Industry CF Volatility 0.045 -0.030 -0.022
(0.18) (1.25) (0.98)
Observations 49,527 4,739 4,739
R-squared 0.43 0.66 0.59
38

Table VIIICash and Litigation Risk: Simultaneous Equations
This table reports the estimation results for the followingsimultaneous equations model:
Insurance Effect : Cash Ratio= γ1Litigation+ θ1X + β1X1 + ε1,
Enticement Effect : Litigation= γ2Cash Ratio+ θ2X + β2X2 + ε2,
Cash Ratio is the ratio of cash and marketable securities to the book value of total assets for firm i; Litigation isthe probability of litigation for firmi; X1 is leverage, the identifying variable of the first equation,andX2 is stockturnover, the identifying variable of the second equation.Litigation risk is defined as the ex ante probability ofbeing involved in a litigation as proxied by the fitted probabilities from the probit model reported in Table V.Year and industry dummy variables are included in all specifications. The sample period is 1996 to 2006.
39
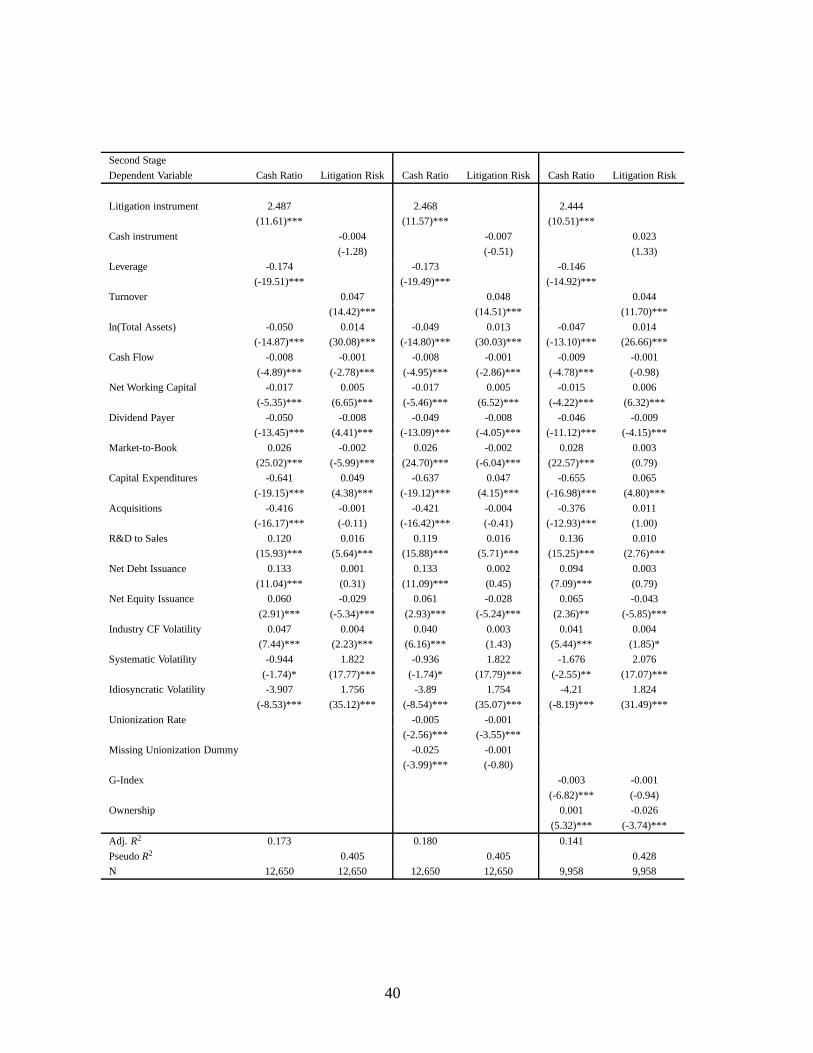
Second Stage
Dependent Variable Cash Ratio Litigation Risk Cash Ratio Litigation Risk Cash Ratio Litigation Risk
Litigation instrument 2.487 2.468 2.444
(11.61)*** (11.57)*** (10.51)***
Cash instrument -0.004 -0.007 0.023
(-1.28) (-0.51) (1.33)
Leverage -0.174 -0.173 -0.146
(-19.51)*** (-19.49)*** (-14.92)***
Turnover 0.047 0.048 0.044
(14.42)*** (14.51)*** (11.70)***
ln(Total Assets) -0.050 0.014 -0.049 0.013 -0.047 0.014
(-14.87)*** (30.08)*** (-14.80)*** (30.03)*** (-13.10)*** (26.66)***
Cash Flow -0.008 -0.001 -0.008 -0.001 -0.009 -0.001
(-4.89)*** (-2.78)*** (-4.95)*** (-2.86)*** (-4.78)*** (-0.98)
Net Working Capital -0.017 0.005 -0.017 0.005 -0.015 0.006
(-5.35)*** (6.65)*** (-5.46)*** (6.52)*** (-4.22)*** (6.32)***
Dividend Payer -0.050 -0.008 -0.049 -0.008 -0.046 -0.009
(-13.45)*** (4.41)*** (-13.09)*** (-4.05)*** (-11.12)*** (-4.15)***
Market-to-Book 0.026 -0.002 0.026 -0.002 0.028 0.003
(25.02)*** (-5.99)*** (24.70)*** (-6.04)*** (22.57)*** (0.79)
Capital Expenditures -0.641 0.049 -0.637 0.047 -0.655 0.065
(-19.15)*** (4.38)*** (-19.12)*** (4.15)*** (-16.98)*** (4.80)***
Acquisitions -0.416 -0.001 -0.421 -0.004 -0.376 0.011
(-16.17)*** (-0.11) (-16.42)*** (-0.41) (-12.93)*** (1.00)
R&D to Sales 0.120 0.016 0.119 0.016 0.136 0.010
(15.93)*** (5.64)*** (15.88)*** (5.71)*** (15.25)*** (2.76)***
Net Debt Issuance 0.133 0.001 0.133 0.002 0.094 0.003
(11.04)*** (0.31) (11.09)*** (0.45) (7.09)*** (0.79)
Net Equity Issuance 0.060 -0.029 0.061 -0.028 0.065 -0.043
(2.91)*** (-5.34)*** (2.93)*** (-5.24)*** (2.36)** (-5.85)***
Industry CF Volatility 0.047 0.004 0.040 0.003 0.041 0.004
(7.44)*** (2.23)*** (6.16)*** (1.43) (5.44)*** (1.85)*
Systematic Volatility -0.944 1.822 -0.936 1.822 -1.676 2.076
(-1.74)* (17.77)*** (-1.74)* (17.79)*** (-2.55)** (17.07)***
Idiosyncratic Volatility -3.907 1.756 -3.89 1.754 -4.21 1.824
(-8.53)*** (35.12)*** (-8.54)*** (35.07)*** (-8.19)*** (31.49)***
Unionization Rate -0.005 -0.001
(-2.56)*** (-3.55)***
Missing Unionization Dummy -0.025 -0.001
(-3.99)*** (-0.80)
G-Index -0.003 -0.001
(-6.82)*** (-0.94)
Ownership 0.001 -0.026
(5.32)*** (-3.74)***
Adj. R2 0.173 0.180 0.141
PseudoR2 0.405 0.405 0.428
N 12,650 12,650 12,650 12,650 9,958 9,958
40
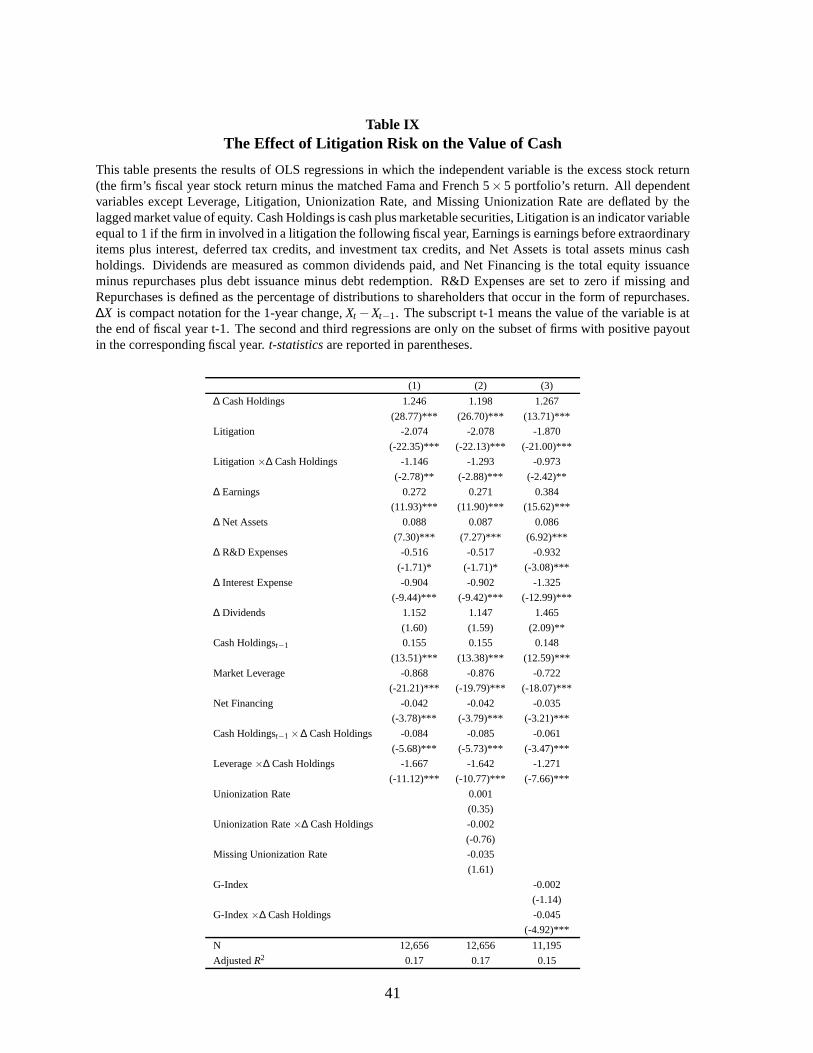
Table IXThe Effect of Litigation Risk on the Value of Cash
This table presents the results of OLS regressions in which the independent variable is the excess stock return(the firm’s fiscal year stock return minus the matched Fama andFrench 5×5 portfolio’s return. All dependentvariables except Leverage, Litigation, Unionization Rate, and Missing Unionization Rate are deflated by thelagged market value of equity. Cash Holdings is cash plus marketable securities, Litigation is an indicator variableequal to 1 if the firm in involved in a litigation the followingfiscal year, Earnings is earnings before extraordinaryitems plus interest, deferred tax credits, and investment tax credits, and Net Assets is total assets minus cashholdings. Dividends are measured as common dividends paid,and Net Financing is the total equity issuanceminus repurchases plus debt issuance minus debt redemption. R&D Expenses are set to zero if missing andRepurchases is defined as the percentage of distributions toshareholders that occur in the form of repurchases.∆X is compact notation for the 1-year change,Xt −Xt−1. The subscript t-1 means the value of the variable is atthe end of fiscal year t-1. The second and third regressions are only on the subset of firms with positive payoutin the corresponding fiscal year.t-statistics are reported in parentheses.
(1) (2) (3)
∆ Cash Holdings 1.246 1.198 1.267
(28.77)*** (26.70)*** (13.71)***
Litigation -2.074 -2.078 -1.870
(-22.35)*** (-22.13)*** (-21.00)***
Litigation ×∆ Cash Holdings -1.146 -1.293 -0.973
(-2.78)** (-2.88)*** (-2.42)**
∆ Earnings 0.272 0.271 0.384
(11.93)*** (11.90)*** (15.62)***
∆ Net Assets 0.088 0.087 0.086
(7.30)*** (7.27)*** (6.92)***
∆ R&D Expenses -0.516 -0.517 -0.932
(-1.71)* (-1.71)* (-3.08)***
∆ Interest Expense -0.904 -0.902 -1.325
(-9.44)*** (-9.42)*** (-12.99)***
∆ Dividends 1.152 1.147 1.465
(1.60) (1.59) (2.09)**
Cash Holdingst−1 0.155 0.155 0.148
(13.51)*** (13.38)*** (12.59)***
Market Leverage -0.868 -0.876 -0.722
(-21.21)*** (-19.79)*** (-18.07)***
Net Financing -0.042 -0.042 -0.035
(-3.78)*** (-3.79)*** (-3.21)***
Cash Holdingst−1 ×∆ Cash Holdings -0.084 -0.085 -0.061
(-5.68)*** (-5.73)*** (-3.47)***
Leverage×∆ Cash Holdings -1.667 -1.642 -1.271
(-11.12)*** (-10.77)*** (-7.66)***
Unionization Rate 0.001
(0.35)
Unionization Rate×∆ Cash Holdings -0.002
(-0.76)
Missing Unionization Rate -0.035
(1.61)
G-Index -0.002
(-1.14)
G-Index×∆ Cash Holdings -0.045
(-4.92)***
N 12,656 12,656 11,195
AdjustedR2 0.17 0.17 0.15
41
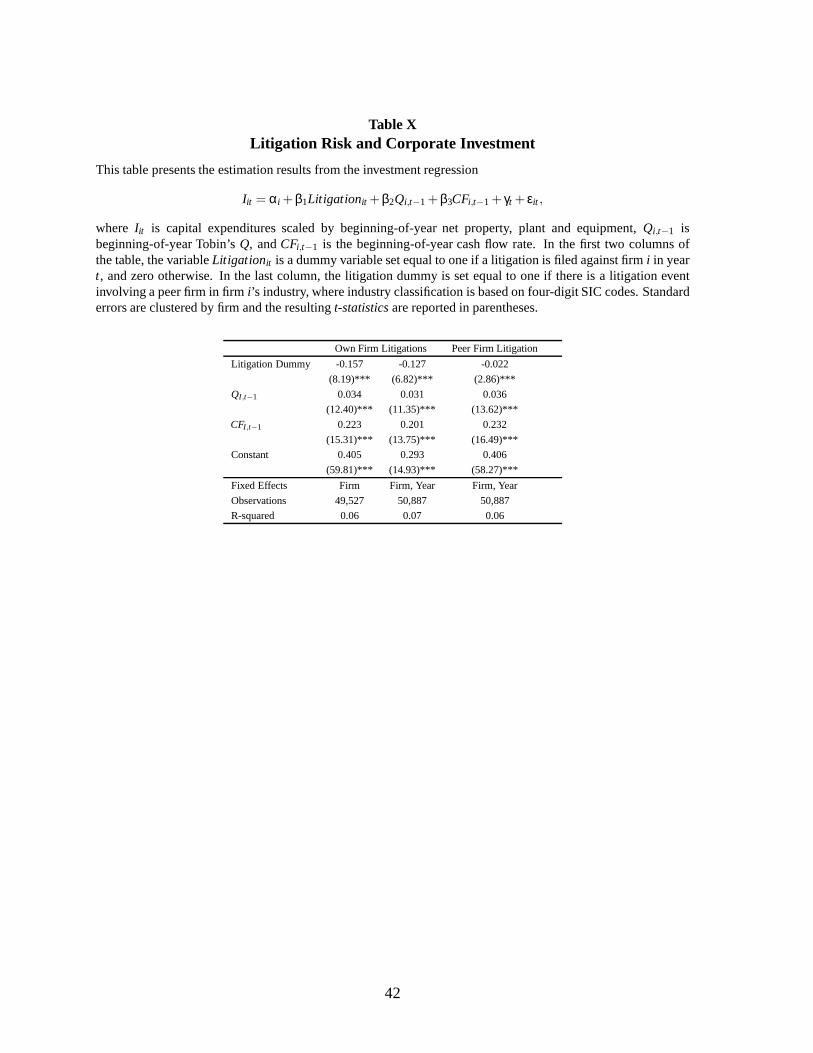
Table XLitigation Risk and Corporate Investment
This table presents the estimation results from the investment regression
Iit = αi + β1Litigationit + β2Qi,t−1 + β3CFi,t−1 + γt + εit ,
where Iit is capital expenditures scaled by beginning-of-year net property, plant and equipment,Qi,t−1 isbeginning-of-year Tobin’sQ, andCFi,t−1 is the beginning-of-year cash flow rate. In the first two columns ofthe table, the variableLitigationit is a dummy variable set equal to one if a litigation is filed against firm i in yeart, and zero otherwise. In the last column, the litigation dummy is set equal to one if there is a litigation eventinvolving a peer firm in firmi’s industry, where industry classification is based on four-digit SIC codes. Standarderrors are clustered by firm and the resultingt-statistics are reported in parentheses.
Own Firm Litigations Peer Firm Litigation
Litigation Dummy -0.157 -0.127 -0.022
(8.19)*** (6.82)*** (2.86)***
QI,t−1 0.034 0.031 0.036
(12.40)*** (11.35)*** (13.62)***
CFI,t−1 0.223 0.201 0.232
(15.31)*** (13.75)*** (16.49)***
Constant 0.405 0.293 0.406
(59.81)*** (14.93)*** (58.27)***
Fixed Effects Firm Firm, Year Firm, Year
Observations 49,527 50,887 50,887
R-squared 0.06 0.07 0.06
42

Table XIRobustness
This table reports the results of various robustness tests.The first four columns estimate various cash regressionsusing the class action litigation events from our primary sample. The last two columns estimate cash regressionsusing litigation events that are not classified as securities litigation from the Audit Analytics database. Column1 replicates the specification in Table IV with the natural logarithm of cash levels as the dependent variable.Columns 2 through 4 replicate the ex ante litigation risk regressions from Table VI using the natural logarithmof cash levels as the dependent variable. Column 5 replicates the specification in Table IV using non-securitieslitigation events to define the Litigation dummy variable and Column 6 replicates the ex ante litigation riskregression from Table VI, where the predicted probabilities are estimated using the same specification but basedon the non-securities litigation events. All specifications include industry and year fixed effects. Standard errorsare clustered at the industry level andt-statistics are reported in parentheses.
Securities Litigation Other Litigations
Dependent Variable log(Cash) log(Cash) log(Cash) log(Cash) Cash/Assets Cash/Assets
(1) (2) (3) (4) (5) (6)
ln(Total Assets) 0.984 0.907 0.911 0.911 -0.056 -0.021
(66.11)*** (47.18)*** (48.45)*** (48.08)*** (11.12)*** ( 7.20)***
Leverage -1.799 -1.581 -1.586 -1.586 -0.120 -0.170
(18.22)*** (7.88)*** (7.93)*** (7.92)*** (3.31)*** (5.19 )***
Cash Flow 0.228 -0.067 -0.067 -0.067 0.012 -0.006
(7.62)*** (4.10)*** (4.09)*** (4.08)*** (1.38) (0.64)
Net Working Capital -0.590 -0.093 -0.092 -0.092 -0.018 -0.025
(8.26)*** (0.64) (0.64) (0.64) (0.83) (1.28)
Dividend Payer -0.090 -0.181 -0.180 -0.181 -0.018 -0.036
(1.82)* (3.29)*** (3.27)*** (3.27)*** (2.67)*** (4.21)** *
Market-to-Book 0.054 0.123 0.122 0.122 0.009 0.016
(12.83)*** (7.75)*** (7.59)*** (7.57)*** (4.57)*** (9.85 )***
Capital Expenditures -1.515 -3.647 -3.622 -3.622 -0.226 -0.272
(8.23)*** (8.74)*** (8.57)*** (8.59)*** (3.80)*** (4.83) ***
Acquisitions -2.367 -2.772 -2.771 -2.773 0.026 -0.010
(17.19)*** (14.37)*** (14.32)*** (14.32)*** (0.61) (0.31)
R&D to Sales 0.190 0.313 0.314 0.316 0.109 0.119
(12.48)*** (2.95)*** (2.91)*** (2.93)*** (5.22)*** (4.78 )***
Net Debt Issuance 0.739 0.798 0.798 0.799 0.020 0.019
(7.07)*** (7.16)*** (7.16)*** (7.15)*** (1.26) (1.18)
Net Equity Issuance 0.615 -0.008 -0.024 -0.025 -0.162 -0.106
(7.82)*** (0.06) (0.18) (0.18) (7.92)*** (5.00)***
Industry CF Volatility -0.224 -0.767 -0.743 -0.737 -0.121 -0.150
(0.42) (1.67)* (1.63) (1.62) (2.17)** (2.70)***
Litigation Dummy 0.295 0.018
(6.11)*** (4.01)***
Idiosyncratic Volatility 4.569 4.864 4.840 -0.308
(1.84)* (1.92)* (1.92)* (1.34)
Systematic Volatility 18.525 19.432 19.627 2.308
(4.75)*** (5.10)*** (5.11)*** (3.17)***
Prob(Litigation) 1 0.706 0.469
(2.59)** (7.22)***
Prob(Litigation) 2 0.492
(2.48)**
Prob(Litigation) 3 0.482
(2.37)**
Observations 50,887 12,518 12,518 12,518 9,070 12,534
R-squared 0.74 0.72 0.72 0.72 0.25 0.23
43
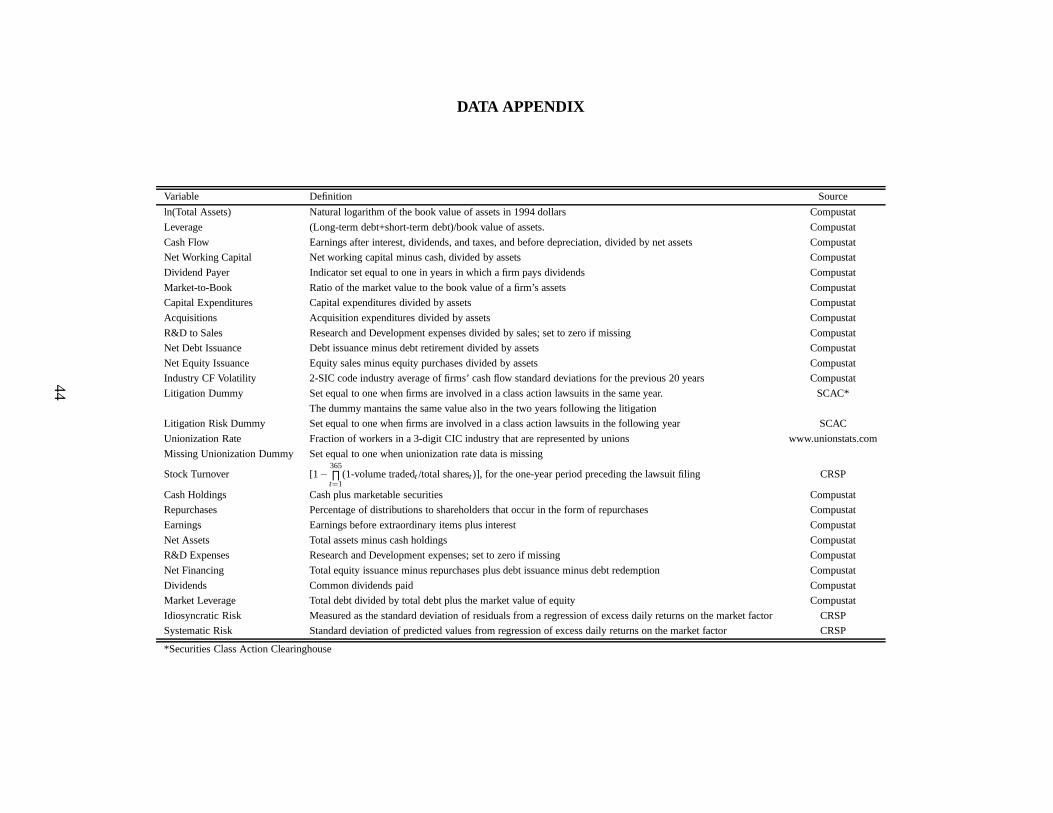
DATA APPENDIX
Variable Definition Source
ln(Total Assets) Natural logarithm of the book value of assets in 1994 dollars Compustat
Leverage (Long-term debt+short-term debt)/book value of assets. Compustat
Cash Flow Earnings after interest, dividends, and taxes, and before depreciation, divided by net assets Compustat
Net Working Capital Net working capital minus cash, dividedby assets Compustat
Dividend Payer Indicator set equal to one in years in which a firm pays dividends Compustat
Market-to-Book Ratio of the market value to the book value ofa firm’s assets Compustat
Capital Expenditures Capital expenditures divided by assets Compustat
Acquisitions Acquisition expenditures divided by assets Compustat
R&D to Sales Research and Development expenses divided by sales; set to zero if missing Compustat
Net Debt Issuance Debt issuance minus debt retirement divided by assets Compustat
Net Equity Issuance Equity sales minus equity purchases divided by assets Compustat
Industry CF Volatility 2-SIC code industry average of firms’cash flow standard deviations for the previous 20 years Compustat
Litigation Dummy Set equal to one when firms are involved in a class action lawsuits in the same year. SCAC*
The dummy mantains the same value also in the two years following the litigation
Litigation Risk Dummy Set equal to one when firms are involvedin a class action lawsuits in the following year SCAC
Unionization Rate Fraction of workers in a 3-digit CIC industry that are represented by unions www.unionstats.com
Missing Unionization Dummy Set equal to one when unionization rate data is missing
Stock Turnover [1−365∏
t=1(1-volume tradedt /total sharest )], for the one-year period preceding the lawsuit filing CRSP
Cash Holdings Cash plus marketable securities Compustat
Repurchases Percentage of distributions to shareholders that occur in the form of repurchases Compustat
Earnings Earnings before extraordinary items plus interest Compustat
Net Assets Total assets minus cash holdings Compustat
R&D Expenses Research and Development expenses; set to zeroif missing Compustat
Net Financing Total equity issuance minus repurchases plusdebt issuance minus debt redemption Compustat
Dividends Common dividends paid Compustat
Market Leverage Total debt divided by total debt plus the market value of equity Compustat
Idiosyncratic Risk Measured as the standard deviation of residuals from a regression of excess daily returns on the market factor CRSP
Systematic Risk Standard deviation of predicted values from regression of excess daily returns on the market factor CRSP
*Securities Class Action Clearinghouse
44