“ACI, NSF-CHE and HSIs” University of Texas, El Paso April 23, 2007 NSF Division of Chemistry.

©e-GEOS SpA - 2016 – all right reserved
YOUR HUB
FOR GEOSPATIAL
APPLICATIONS
Primo Workshop Nazionale
Data Exploitation della missione PRISMA,
precursore delle missioni iperspettrali nazionali
Agenzia Spaziale Italiana (ASI), Roma, 2 Marzo 2017
HSIS:
PRISMA Image Simulator
Massimo Zavagli, e-GEOS

©e-GEOS SpA - 2016 – all right reserved
• Introduction of Hyper-Spectral Image Simulator (HSIS)
• Functions and Algorithms
– Satellite orbit/attitude and acquisition Geometry model
– Scattering and Atmosphere models
– PRISMA Sensor Model
• Architecture
• Operational workflow
• Graphic User Interface
• Examples
– From Hyperion and ALI data
– From AVIRIS data
OVERVIEW

©e-GEOS SpA - 2016 – all right reserved
Hyper-Spectral Image Simulator simulates the imaging of the
PRISMA Hyperspectral and Panchromatic satellite sensors taking
into accounts:
– Geometry:
• Satellite orbit, pushbroom mechanism for imaging
• Attitude and eventual slow disturbances on it during acquisition
– Sun elevation and Atmosphere effects:
• Sun ephemerides, surface scattering, atm. transmissivity, path radiances.
DEM is used for retrieval of incidence angles and shadow calculation
– Sensor Simulator:
• Geometry degradation (loss of contrast)
• Spectral degradation
• Radiometry and noise modelling
• DN generation (and generation of L0 CCSDS packets)
• Radiance retrieval from DN (tool for basic calibration model)
HSIS FUNCTIONALITIES

©e-GEOS SpA - 2016 – all right reserved
• Inputs:
– Orbit: TLE
– Attitude: Pitch, Roll, Yaw (time functions)
– Ground Surface: SRTM DEM, Geoid, others defined
by User
• Outputs
– Pixel line-of-sight / ground-surface intersection X, Y, Z
(ECR) for Panchromatic and Hyperspectral sensors
– Mapping on the focal plane (through sinc sampling)
• Geometry module of HSIS performs the mapping from Earth surface to
sensor detector array, taking into account the geometry of image
acquisition (satellite position, orbit and attitudes, lines of sights of the
detectors (HYP and PAN) pixels and the digital elevation model of the
acquisition scene).
SATELLITE ORBIT/ATTITUDE AND
ACQUISITION GEOMETRY MODEL
©e-GEOS SpA - 2016 – all right reserved
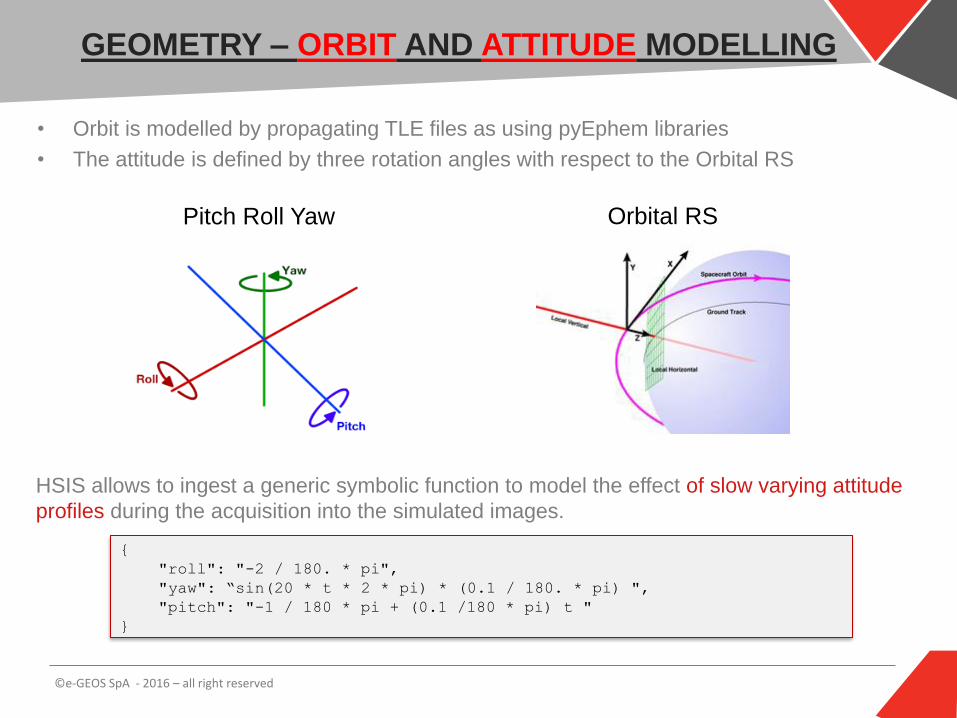
HSIS allows to ingest a generic symbolic function to model the effect of slow varying attitude
profiles during the acquisition into the simulated images.
• Orbit is modelled by propagating TLE files as using pyEphem libraries
• The attitude is defined by three rotation angles with respect to the Orbital RS
Orbital RSPitch Roll Yaw
{
"roll": "-2 / 180. * pi",
"yaw": “sin(20 * t * 2 * pi) * (0.1 / 180. * pi) ",
"pitch": "-1 / 180 * pi + (0.1 /180 * pi) t "
}
GEOMETRY – ORBIT AND ATTITUDE MODELLING
©e-GEOS SpA - 2016 – all right reserved
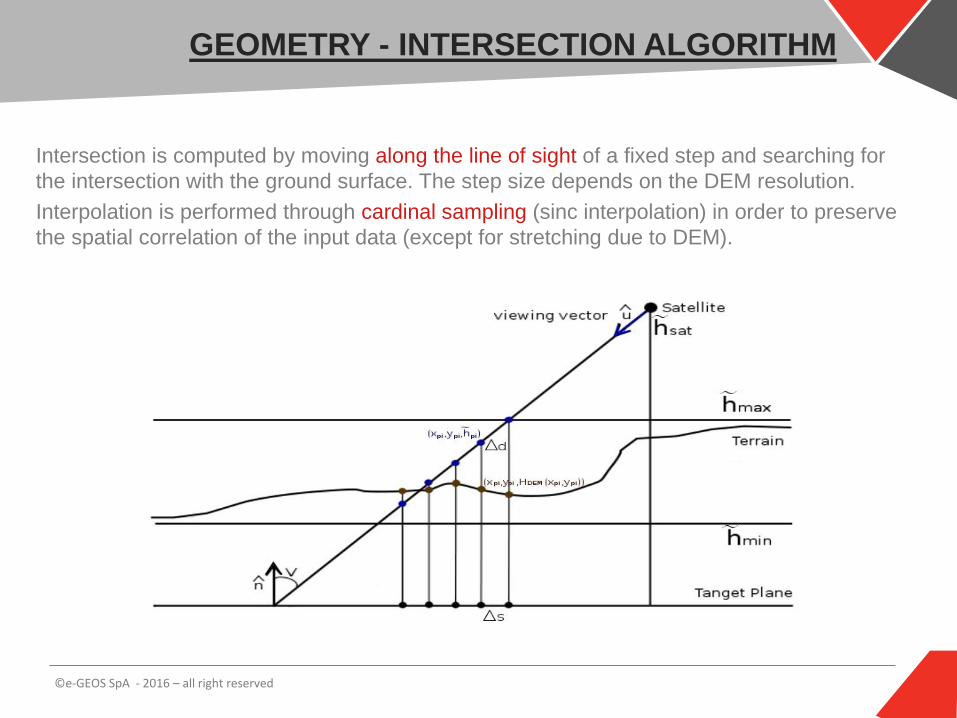
Intersection is computed by moving along the line of sight of a fixed step and searching for
the intersection with the ground surface. The step size depends on the DEM resolution.
Interpolation is performed through cardinal sampling (sinc interpolation) in order to preserve
the spatial correlation of the input data (except for stretching due to DEM).
GEOMETRY - INTERSECTION ALGORITHM
©e-GEOS SpA - 2016 – all right reserved
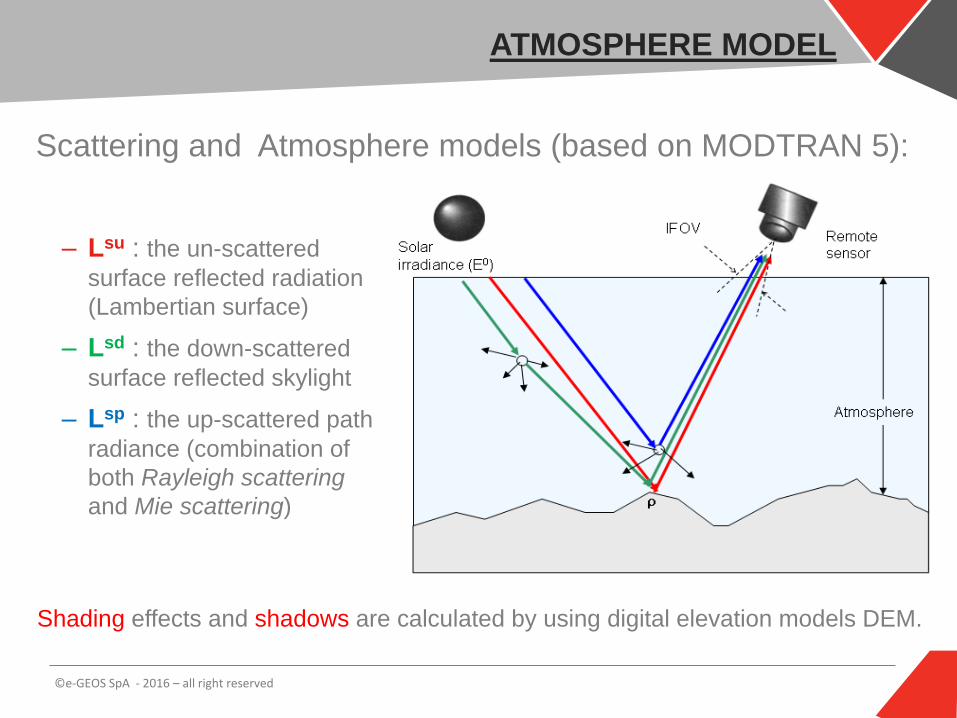
– Lsu : the un-scattered
surface reflected radiation
(Lambertian surface)
– Lsd : the down-scattered
surface reflected skylight
– Lsp : the up-scattered path
radiance (combination of
both Rayleigh scattering
and Mie scattering)
Scattering and Atmosphere models (based on MODTRAN 5):
Shading effects and shadows are calculated by using digital elevation models DEM.
ATMOSPHERE MODEL

©e-GEOS SpA - 2016 – all right reserved
• Atmosphere MODEL: there are six
geographical-seasonal model
atmospheres:
• IHAZE: define type and default
metereological areosol models
• TPTEMP: Temperature
• CO2MX: the CO2 mixing ratio in ppmv
• ICLD: specifies the cloud and rain
models used (with CEXT)
MODTRAN parameters can be managed through GUI:
Some parameters can be introduced through the ingestion of maps:
– H2OSTR [g/cm2]: Vertical water vapour column [g/cm2]
– VIS and ASTMX: visibility and Angstrom Law offset to define the aerosol optical depth
– CEXT [km-1]: the extinction coefficient for accurate cloud model
ATMOSPHERE MODEL IMPLEMENTATION

©e-GEOS SpA - 2016 – all right reserved
Input Parameters: • Keystone
• Smile
• Slit Curvature
• Jitter Across Track
• Jitter Along Track
Input Data: • TOA Pancromatic Radiance
• TOA Hyperspectral Radiance
Output:• Digital Number
• L0 in CSSDS Packet Format
Radiometric sources of noises:• Spatial Pattern noise (PRNU)
• Dark Signal Non-Uniformity
(DSNU)
• Signal and shot noises (photon
shot noise, readout n., flicker n.,
off-chip n.)
Electro/Optical System:
• Hyperspectral: 30 m GSD, 400nm-2500nm VNIR
(65 Bands) and SWIR (171 Bands)
• Panchromatic: 5 m GSD
SENSOR MODEL (DEVELOPED BY LEONARDO)

©e-GEOS SpA - 2016 – all right reserved
HYPERSPECTRAL SENSOR MODEL DIAGRAM

©e-GEOS SpA - 2016 – all right reserved
HSIS is decomposed into three components:
– HSIS-HMI: this component provides the operator graphical interface with
functions to define and run simulation scenarios.
– HSIS-Core: this component is the algorithmic core of the simulator. It
performs all computations of the simulations.
– HSIS-Server: this component wraps the simulator process and
communicates with HSIS-HMI to start the process itself, copy simulation
parameters, monitor running simulations, manage data.
SW deployment on three HW systems:
– HSIS-WS: 1 Workstation (Windows)
for interface.
– HSIS-DS: 1 Server (Linux) for data
server and services provision.
– HSIS-PS: 1 Server (Linux) for data
processing.
ARCHITECTURE AND HW/SW DEPLOYMENT

©e-GEOS SpA - 2016 – all right reserved
• Operator must define the
scenario:
– Reflectance/radiances ingestion
– processing parameters
– Footprint definition
• Once the Scenario is defined, the
simulation can be run, monitored
and controlled.
• Finally, the produced intermediate
and output products can be
retrieved by the Operator to
perform data analysis and post
processing.
Reflectance/radiances data gathering
• Real data from airborne/satellite optical sensor
• Synthetic data
Reflectance/radiances pre-conditioning
• Spatial resampling
• Cropping
• Geocoding
Scenario definition
• DEM/Geoid selection/ingestion
• Atmosphere parameters
• Sensor instrument parameters
• Orbit/attitude file load
Simulation Start and Monitoring
• Start
• Monitor
• Suspend/Resume and Stop actions
Analysis
• Image browsing
• Image filtering
• Image profile plotting
OPERATIONAL WORK-FLOW

©e-GEOS SpA - 2016 – all right reserved
WEB GIS Application
– Client on HSIS-WS:• Browser with JavaScript application
providing the GUI
– Server on HSIS-DS:• HSISController: WEB application that
responds to the client for data
ingestion, job submission, processing
control, load/save scenarios from/to
DB.
• GeoServer: provider of geographic data
to the client through OGC protocols like
WMS and WFS
• Shared folder for data exchange
ENVI provides functionalities for:
– Input data pre-conditioning
– Data analysis of results
Main Window with
Scenario Editor, Map,
Archives and Layers
GRAPHICAL USER INTERFACE (1/2)
Interface for
radiance/reflectance
input data ingestion

©e-GEOS SpA - 2016 – all right reserved
The HSIS-HMI provides a webGIS to preview input products and insert parameters
GRAPHICAL USER INTERFACE (2/2)
©e-GEOS SpA - 2016 – all right reserved
Example 1 - end-to-end processing to simulate Hyperspectral and
Panchromatic products from EO-1 data:
– Reflectivities from Hyperion data 2002 04 02 9:30 on Napoli area
– PAN Radiances from ALI data 2002 04 02 9:30 on Napoli Area
Example 2 - end-to-end processing to simulate Hyperspectral
products from AVIRIS data (data code: f080709t01p00r13rdn):
– Radiance from AVIRIS data acquired in 2008, 8th July in 2002 04
02 9:30 over the coast Michigan lake south of Manistee National
Forest (Grand and Kalamazoo River Outlets, MI)
EXAMPLES

©e-GEOS SpA - 2016 – all right reserved
EO-1 ALI RESULTS: PAN
©e-GEOS SpA - 2016 – all right reserved
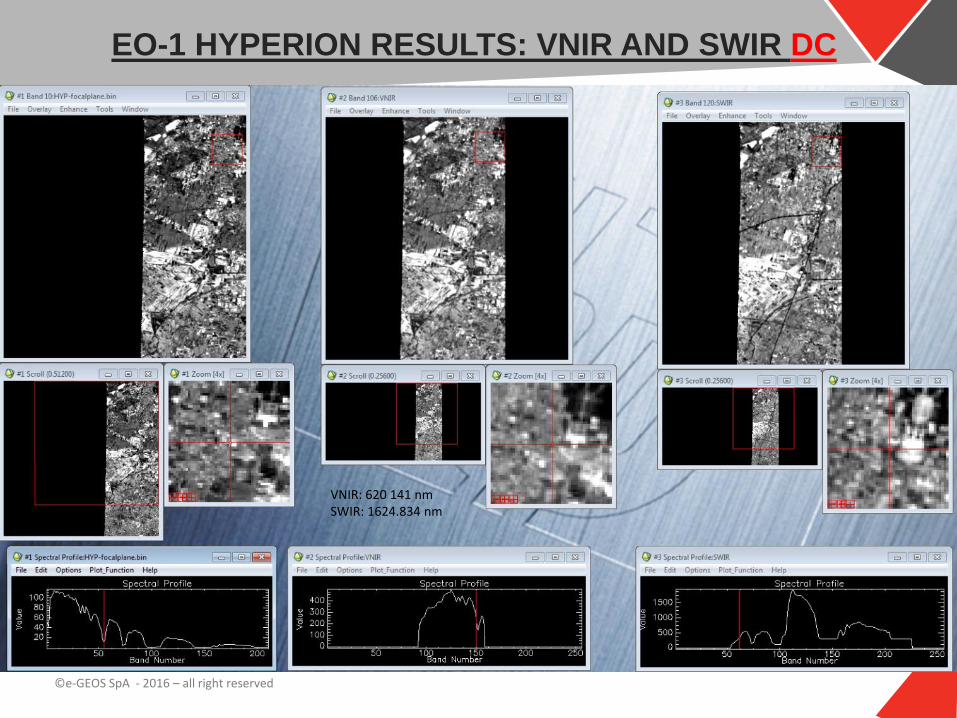
EO-1 HYPERION RESULTS: VNIR AND SWIR DC
VNIR: 620 141 nmSWIR: 1624.834 nm
©e-GEOS SpA - 2016 – all right reserved
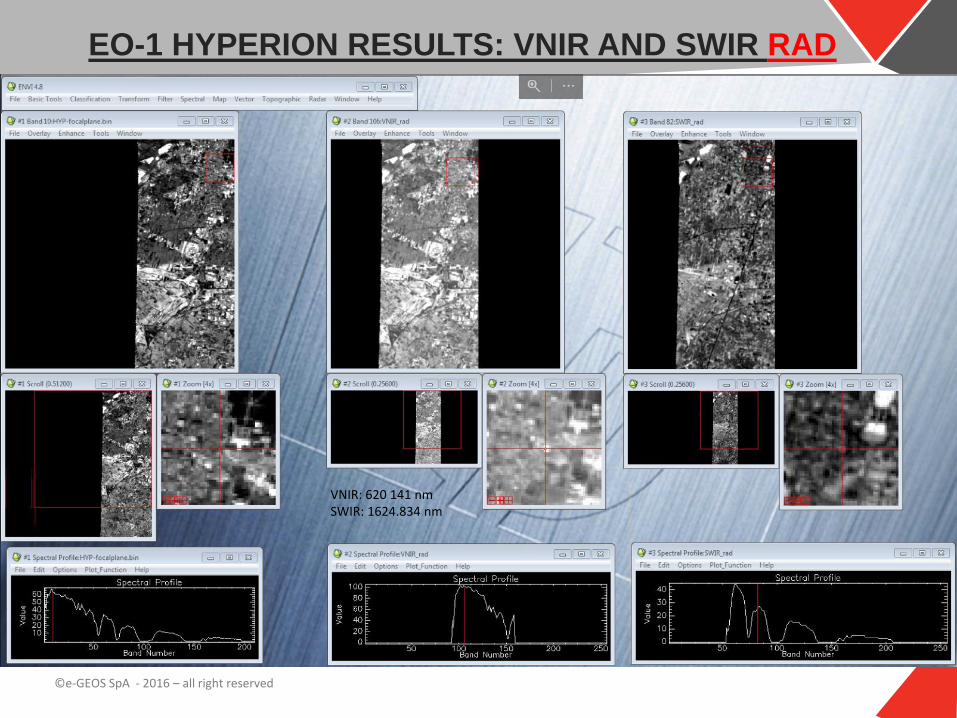
EO-1 HYPERION RESULTS: VNIR AND SWIR RAD
VNIR: 620 141 nmSWIR: 1624.834 nm
©e-GEOS SpA - 2016 – all right reserved
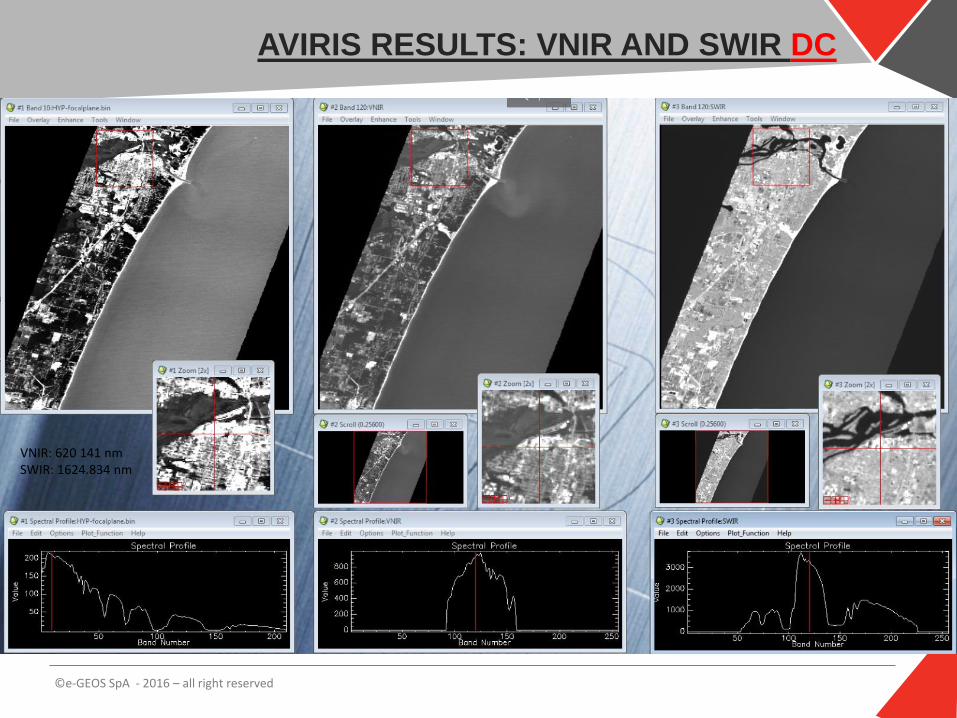
AVIRIS RESULTS: VNIR AND SWIR DC
VNIR: 620 141 nmSWIR: 1624.834 nm

©e-GEOS SpA - 2016 – all right reserved
AVIRIS RESULTS: VNIR AND SWIR RAD
VNIR: 620 141 nmSWIR: 1624.834 nm

e-GEOS S.p.A – L.O. Contrada Terlecchie snc – Matera / HQ Via Tiburtina, 965 – Roma
Thank you