HSES 1eTE C01.qxd 5/13/04 12:19 PM Page 2 Section 1.1 1.1...
24
2 Chapter 1 1.1 What Is Earth Science? Reading Strategy Categorizing As you read about the different branches of Earth science, fill in the column with the name of each branch and list some of the things that are studied. Key Concepts What is the study of Earth science? How did Earth and the solar system form? Vocabulary ◆ Earth science ◆ geology ◆ oceanography ◆ meteorology ◆ astronomy The spectacular eruption of a volcano, the magnificent scenery of a rocky coast, and the destruction created by a hurricane are all subjects for Earth science. The study of Earth science deals with many fasci- nating and practical questions about our environment. What forces produced the mountains shown on page 1? Why does our daily weather change? Is our climate changing? How old is Earth? How is Earth related to the other planets in the solar system? What causes ocean tides? What was the Ice Age like? Will there be another? Understanding Earth is not an easy task because our planet is always changing. Earth is a dynamic planet with a long and complex history. Overview of Earth Science Earth science is the name for the group of sciences that deals with Earth and its neighbors in space. Earth science includes many subdivi- sions of geology such as geochemistry, geophysics, geobiology and paleontology, as well as oceanography, meteorology, and astronomy. Units 1 through 4 focus on the science of geology, a word that means “study of Earth.” Geology is divided into two broad areas—physical geology and historical geology. Physical geology includes the examination of the materi- als that make up Earth and the possible explanations for the many processes that shape our planet. Processes below the surface create earthquakes, build mountains, and produce vol- canoes. Processes at the surface break rock apart and create geology a. b. c. d. e. f. g. ? ? ? ? ? ? ? Figure 1 Scientists called paleontologists study fossils, which are signs of life in the distant past, to find out how life-forms have changed through time. Posing Questions What questions do you have about this fossil? 2 Chapter 1 FOCUS Section Objectives 1.1 Define Earth science. 1.2 Describe the formation of Earth and the solar system. Build Vocabulary Word Parts Ask students to use a dictionary to determine the meanings of the following word parts: geo- (Earth); astro- (outer space); -ology (study of); -ography (study of); -onomy (study of) Based on this discussion and their prior knowledge, have students predict the meaning of this section’s vocabulary words. Then, have students look up the words in the Glossary to check their predictions and make any necessary corrections. Meteorology will likely present a problem, with most students predicting that it is the study of meteors, rather than the study of the atmosphere. Reading Strategy a. Earth, earthquakes, mountains, volcanoes, Earth’s history b. oceanography c. composition and movements of seawater, coastal processes, seafloor topography, marine life d. meteorology e. atmosphere, weather, climate f. astronomy g. universe, solar system INSTRUCT Overview of Earth Science Build Reading Literacy Refer to p. 216D in Chapter 8, which provides guidelines for comparing and contrasting. Compare and Contrast Have students create a table to compare and contrast physical geology and historical geology. They should fill in their table as they read the first part of this section. Areas to consider include the focus of each area and examples of what is studied. Visual L1 2 L2 L2 Reading Focus 1 Section 1.1
Transcript of HSES 1eTE C01.qxd 5/13/04 12:19 PM Page 2 Section 1.1 1.1...

2 Chapter 1
1.1 What Is Earth Science?
Reading StrategyCategorizing As you read about thedifferent branches of Earth science, fill in thecolumn with the name of each branch and listsome of the things that are studied.
Key ConceptsWhat is the study of Earthscience?
How did Earth and thesolar system form?
Vocabulary◆ Earth science◆ geology◆ oceanography◆ meteorology◆ astronomy
The spectacular eruption of a volcano, the magnificent scenery of arocky coast, and the destruction created by a hurricane are all subjectsfor Earth science. The study of Earth science deals with many fasci-nating and practical questions about our environment. What forcesproduced the mountains shown on page 1? Why does our dailyweather change? Is our climate changing? How old is Earth? How isEarth related to the other planets in the solar system? What causesocean tides? What was the Ice Age like? Will there be another?
Understanding Earth is not an easy task because our planet is alwayschanging. Earth is a dynamic planet with a long and complex history.
Overview of Earth ScienceEarth science is the name for the group of sciences that deals with
Earth and its neighbors in space. Earth science includes many subdivi-sions of geology such as geochemistry, geophysics, geobiologyand paleontology, as well as oceanography, meteorology, andastronomy.
Units 1 through 4 focus on the science of geology, a wordthat means “study of Earth.” Geology is divided into twobroad areas—physical geology and historical geology.
Physical geology includes the examination of the materi-als that make up Earth and the possible explanations for themany processes that shape our planet. Processes below thesurface create earthquakes, build mountains, and produce vol-canoes. Processes at the surface break rock apart and create
geology a.
b. c.
d. e.
f. g. ??
??
??
?
Figure 1 Scientists calledpaleontologists study fossils,which are signs of life in thedistant past, to find out how life-forms have changed through time. Posing Questions Whatquestions do you have about this fossil?
2 Chapter 1
FOCUS
Section Objectives1.1 Define Earth science.1.2 Describe the formation of
Earth and the solar system.
Build VocabularyWord Parts Ask students to use adictionary to determine the meaningsof the following word parts:geo- (Earth); astro- (outer space);-ology (study of); -ography (study of);-onomy (study of)Based on this discussion and their priorknowledge, have students predict themeaning of this section’s vocabularywords. Then, have students look up thewords in the Glossary to check theirpredictions and make any necessarycorrections. Meteorology will likelypresent a problem, with most studentspredicting that it is the study of meteors,rather than the study of the atmosphere.
Reading Strategya. Earth, earthquakes, mountains,volcanoes, Earth’s historyb. oceanographyc. composition and movements ofseawater, coastal processes, seafloortopography, marine lifed. meteorologye. atmosphere, weather, climatef. astronomyg. universe, solar system
INSTRUCT
Overview ofEarth ScienceBuild Reading LiteracyRefer to p. 216D in Chapter 8, whichprovides guidelines for comparingand contrasting.
Compare and Contrast Have studentscreate a table to compare and contrastphysical geology and historical geology.They should fill in their table as theyread the first part of this section. Areasto consider include the focus of eacharea and examples of what is studied.Visual
L1
2
L2
L2
Reading Focus
1
Section 1.1
HSES_1eTE_C01.qxd 5/13/04 12:19 PM Page 2

Introduction to Earth Science 3
different landforms. Erosion by water, wind, and ice results in differ-ent landscapes. You will learn that rocks and minerals form in responseto Earth’s internal and external processes. Understanding the origin ofrocks and minerals is an important part of understanding Earth.
In contrast to physical geology, the aim of historical geology is tounderstand Earth’s long history. Historical geology tries to establish atimeline of the vast number of physical and biological changes thathave occurred in the past. See Figure 1. We study physical geologybefore historical geology because we must first understand how Earthworks before we try to unravel its past.
Unit 5 is devoted to oceanography. Oceanography integrates thesciences of chemistry, physics, geology, and biology. Oceanographersstudy the composition and movements of seawater, as well as coastalprocesses, seafloor topography, and marine life. See Figure 2.
Unit 6 examines the composition of Earth’s atmosphere. The com-bined effects of Earth’s motions and energy from the sun cause theatmosphere to produce different weather conditions. This, in turn, cre-ates the basic pattern of global climates. Meteorology is the study of theatmosphere and the processes that produce weather and climate. Likeoceanography, meteorology also involves other branches of science.
Unit 7 demonstrates that understanding Earth requires an under-standing of Earth’s position in the universe. The science of astronomy,the study of the universe, is useful in probing the origins of our ownenvironment. All objects in space, including Earth, are subject to thesame physical laws. Learning about the other members of our solarsystem and the universe beyond helps us to understand Earth.
Throughout its long existence, Earth has been changing. In fact, it ischanging as you read this page and will continue to do so. Sometimes thechanges are rapid and violent, such as when tornados, landslides, orvolcanic eruptions occur. Many changes, however, take place so grad-ually that they go unnoticed during a lifetime.
Formation of EarthEarth is one of nine planets that revolve around the sun. Our solarsystem has an orderly nature. Scientists understand that Earth andthe other planets formed during the same time span and from thesame material as the sun. The nebular hypothesis suggests thatthe bodies of our solar system evolved from an enormous rotatingcloud called the solar nebula. It was made up mostly of hydrogenand helium, with a small percentage of heavier elements. Figure 3 onpage 4 summarizes some key points of this hypothesis.
What are the two main areas of geology?
Figure 2 Oceanographers studyall aspects of the ocean—thechemistry of its waters, thegeology of its seafloor, the physicsof its interactions with theatmosphere, and the biology of its organisms.
Use CommunityResourcesThe USGS (United States GeologicalSurvey) has a network of regional officeswhere geologists study geologicalphenomena at local, regional, andglobal levels. Their activities includemonitoring earthquake activity,mapping subsurface rock formations,and providing the public with infor-mation about geologic events suchas floods and landslides. Ask a USGSgeologist from a local office to talk tothe class about what geologists do attheir jobs. Ask students to preparequestions in advance.Interpersonal
Formation of EarthBuild Reading LiteracyRefer to p. 186D in Chapter 7, whichprovides guidelines for relating textand visuals.
Relate Text and Visuals Have studentsturn ahead in the text to Figure 3 on p. 4for a visual representation of the nebularhypothesis. Have them read the figurecaption, then use the figure to describethe major steps in the nebular hypothesis.(Solar system begins as cloud of dust andgases. Cloud starts to rotate and collapse.Heated center forms the sun. Coolingcreates solid particles. Collisions createasteroid-sized bodies. Asteroids form theinner planets. Lighter materials and gasesform the outer planets.)Visual
L1
L2
Introduction to Earth Science 3
Customize for English Language Learners
Students should use the words and wordparts they just learned, along with their priorknowledge, to define the following words:oceanographer, meteorologist, geography,geologist, geological, astronaut, astronomer.
Students should then use a dictionary to checktheir definitions. Review the correct meaningsof these words with students when they arefinished.
Answer to . . .
The two main areas ofgeology are physical
geology and historical geology.
HSES_1eTE_C01.qxd 5/13/04 12:20 PM Page 3

4 Chapter 1
Figure 3 Formation of the Solar System According to the Nebular Hypothesis A Our solar system began as anenormous cloud of dust and gases made up mostly of hydrogen and helium with a small percentage of heavier elements.B This cloud, called a nebula, started to rotate and collapse toward the center of the cloud. Heat was generated at thecenter, which eventually formed the sun. C Cooling of the nebula caused rocky and metallic materials to form tiny solidparticles. D Repeated collisions of these particles resulted in the formation of asteroid-sized bodies. E These asteroidseventually combined to form the four inner planets—Mercury, Venus, Earth, and Mars. The lighter materials and gasescombined farther away from the center to form the four outer planets—Jupiter, Saturn, Uranus, and Neptune.
B
C
D
E
A
4 Chapter 1
Use VisualsFigure 3 Have students study thediagram illustrating the nebularhypothesis. Ask: What do all stages ofthis hypothesis have in common? (Inall stages, the system is spinning.) Whatwas the first stage in the develop-ment of our solar system? (Our solarsystem began as an enormous cloud ofgas and dust.) Challenge students tomake a timeline or flowchart of thekey events in the formation of oursolar system. (Students should make atimeline or flowchart based on steps Athrough E given in the figure caption.)Visual, Logical
Separation and DensityPurpose Students see how substancesseparate based on density.
Materials 2 large glass jars with lids,100 mL sand, 100 mL rock salt, 100 mLsugar, 100 mL water, 100 mL vegetableoil, 100 mL corn syrup
Procedure At the start of the class,place all of the solids in one jar and allthe liquids in another jar. Put the lids onboth jars and shake them carefully. Letthe jars settle during the class. Then,have the students look at them. Ask:Why did the liquids separate?(Differences in density made the liquidsrise or fall and separate.) Why didn’t thesolids separate? (The solid particles wereunable to move past each other.) Whatstate was Earth most likely in when itseparated into layers? (The materialsthat made up Earth must have beenmolten or nearly molten.)
Expected Outcome The liquids willseparate into different layers. The solidswill remain mixed.Visual, Logical
L2
L1
Section 1.1 (continued)
As Earth was forming, density differencescaused denser materials to sink to Earth’s core,while less dense materials escaped to theatmosphere. Density differences continue toshape Earth today. Today’s volcanic eruptionsare generally caused by less dense magma andgases rising up through the mantle until theypenetrate the crust, resulting in a volcanic
eruption. This is an example of the principleof uniformitarianism, which is essential to thestudy of geology. This principle states that theprocesses that exist on Earth today are identicalto the processes that existed on Earth in thedistant past. This principle allows geologiststo make useful inferences based oncontemporary observations.
Facts and Figures
HSES_1eTE_C01.qxd 5/20/04 12:24 PM Page 4

Section 1.1 Assessment
Reviewing Concepts1. What are the sciences that are included in
Earth science?
2. What topics are included in the study ofphysical geology?
3. Explain how physical geology differs fromhistorical geology.
4. Describe the nebular hypothesis.
Critical Thinking5. Forming Conclusions Explain why Earth is
called a dynamic planet.
6. Inferring Would meteorology be a usefulscience to apply to the study of planets suchas Mercury and Mars? Explain.
7. Hypothesizing Suppose that as Earthformed, all lighter elements were released tosurrounding space. How might this affect thestructure of Earth today?
High temperatures and weak fields of gravity characterized theinner planets. As a result, the inner planets were not able to hold ontothe lighter gases of the nebular cloud. The lightest gases, hydrogen andhelium, were whisked away toward the heavier planets by the solarwind. Earth, Mars, and Venus were able to retain some heavier gasesincluding water vapor and carbon dioxide. The materials that formedby outer planets contained high percentages of water, carbon dioxide,ammonia, and methane. The size and frigid temperatures of the outerplanets provided the surface gravity to hold these heavier gases.
Layers Form on Earth Shortly after Earth formed, the decay ofradioactive elements, combined with heat released by colliding particles,produced some melting of the interior. This allowed the denser elements,mostly iron and nickel, to sink to Earth’s center. The lighter, rocky com-ponents floated outward, toward the surface. This sinking and floatingis believed to still be occurring, but on a much smaller scale. As a resultof this process, Earth’s interior is not made of uniform materials. It con-sists of layers of materials that have different properties.
An important result of this process is that gaseous materials wereallowed to escape from Earth’s interior, just as gases escape todayduring volcanic eruptions. In this way, an atmosphere graduallyformed along with the ocean. It was composed mainly of gases thatwere released from within the planet.
Why does Earth have layers?
Introduction to Earth Science 5
Summarizing Earth science is composedof many different areas of study. Why is itimportant to include all of these areas inthe study of Earth and the solar system?
Build Science SkillsInferring Based on the information inthis section, ask students to infer whichof Earth’s layers will be the densest.Have students turn ahead in the text toFigure 6 on p. 8 to see a diagram ofEarth’s layers.Logical
ASSESSEvaluateUnderstandingTo assess students’ knowledge of sectioncontent, ask them to answer the KeyConcepts questions at the beginningof this section.
ReteachHave students use Figure 3 to explain intheir own words the formation of oursolar system.
Because Earth is an ever-changingplanet, all the spheres on Earth areinteractive and affect one another. Tounderstand Earth’s existence and history,it is important to study all aspects ofEarth together.
L1
L2
3
L2
Introduction to Earth Science 5
Answer to . . .
Earth has layers becausedenser elements sank to
Earth’s center and less dense elementsfloated to the surface.
4. This hypothesis suggests that the solarsystem began as an enormous cloud of dustand gas. The cloud began to rotate, heat wasproduced, and the cloud began to collapsetoward the center. The sun formed at thecenter from this heat. Cooling of the cloudcaused rocky and metallic materials to formthe inner planets. The outer planets formedfrom lighter materials and gases.5. The surface of Earth is continually chang-ing due to its layered structure.
Section 1.1 Assessment
1. Earth science includes many subdivisionsof geology such as geochemistry, geophysics,geobiology, and paleontology, as well asmeteorology, oceanography, and astronomy.2. Physical geology includes processes thatoperate on and below Earth’s surface such asvolcanoes, mountain building, erosion, andearthquakes.3. Historical geology’s aim is to understandEarth’s history. Physical geology’s aim is tounderstand the processes that shape Earth.
6. It would not be very useful because thesetwo planets have only very thin atmospheres.Very few meteorological processes are occur-ring on them.7. If all the lighter elements were no longer apart of Earth’s structure, Earth probably wouldnot have layers defined by their density.
HSES_1eTE_C01.qxd 9/23/04 6:36 PM Page 5

6 Chapter 1
Earth’s Place in the UniverseFor centuries, people who have gazed at the nightsky have wondered about the nature of the universe,Earth’s place within it, and whether or not we arealone. Today many exciting discoveries in astron-
omy are beginning to provide answers about theorigin of the universe, the formation and evolutionof stars, and how Earth came into existence.
14 b.y. 13 b.y. 10 b.y. 5 b.y. Present
BigBang
Dustand
gasescollect Active
galaxiesform
Quasarsform
Localgroup
Milky Wayforms
Solar
Sun
Galaxies evolveand move apart Milky
Way
Figure 4 Big BangTheory Between 13 and14 billion years ago, ahuge explosion sent allof the universe’s matterflying outward at greatspeed. After a fewbillion years, thematerial cooled andcondensed into the firststars and galaxies.About 5 billion yearsago, our solar systembegan forming in agalaxy that is now calledthe Milky Way galaxy.
The realization that the universe is immense andorderly began in the early 1900s. Edwin Hubble andother scientists demonstrated that the Milky Waygalaxy is one of hundreds of billions of galaxies,each of which contains billions of stars. Evidencesupports that Earth, its materials, and all livingthings are the result of the Big Bang theory. The uni-verse began between 13 and 14 billion years ago as adense, hot, massive amount of material exploded withviolent force. See Figure 4. Within about one second,the temperature of the expanding universe cooled toapproximately 10 billion degrees. Basic atomic parti-cles called protons and neutrons began to appear.After a few minutes, atoms of the simplest elements—hydrogen and helium—had formed. The initialconversion of energy to matter in the young universewas completed.
During the first billion years or so, matter (essentiallyhydrogen and helium) in the expanding universeclumped together to form enormous clouds thateventually collapsed to become galaxies and clustersof galaxies. Inside these collapsing clouds, smaller con-centrations of matter formed into stars. One of thebillions of galaxies to form was the Milky Way.
During the life of most stars, energy produced ashydrogen nuclei (protons) fuses with other hydrogen
nuclei to form helium. During this process, callednuclear fusion, matter is converted to energy. Starsbegin to die when their nuclear fuel is used up.Massive stars often have explosive deaths. Duringthese events, called supernovas, nuclear fusion pro-duces atoms such as oxygen, carbon, and iron. Theseatoms may become the materials that make up futuregenerations of stars. From the debris scattered duringthe death of a preexisting star, our sun, and the solarsystem formed
Our star, the sun, is at the very least a second-generation star. Along with the planets in our solarsystem, the sun began forming nearly 5 billion yearsago from a large interstellar cloud called a nebula.This nebula consisted of dust particles and gasesenriched in heavy elements from supernova explo-sions. Gravitational energy caused the nebula tocontract, rotate, and flatten. Inside, smaller concen-trations of matter began condensing to form theplanets. At the center of the nebula there was suffi-cient pressure and heat to initiate hydrogen nuclearfusion, and our sun was born.
It has been said that all life on Earth is related to thestars. This is true because the atoms in our bodiesand the atoms that make up everything on Earth,owe their origin to a supernova event that occurredbillions of years ago, trillions of kilometers away.
6 Chapter 1
Earth’s Place inthe UniverseBackgroundThe Milky Way is a collection of severalhundred billion stars, the oldest ofwhich is about 10 billion years. It is oneof a cluster of approximately 28galaxies, called the Local Group, thatexists in our region of the universe.Initially, the oldest stars in the Milky Wayformed from nearly pure hydrogen.Later, succeeding generations ofyounger stars, including our Sun, wouldhave heavier, more complex atomsavailable for their formation.
Teaching Tips• As students read the feature and look
at Figure 4, have them make a timelineof the events shown from the bigbang to the present.
• While reading Earth’s Place in theUniverse feature, have students createa flowchart showing the chain ofevents starting with the big bang andending with the formation of our sunand the planets of our solar system.(Big Bang → Protons and neutronsappear → Hydrogen and helium form →Hydrogen and helium condense intoclouds → Galaxies and galaxy clustersform and start spreading apart →Clouds of gas and dust collapse, formingstars → Stars become supernovas →Nebula, enriched from supernovas,contracts, rotates, and flattens →Planets and our sun form)
Students may think that the Milky Wayis at the center of the universe. Theymay have inferred this from learningthat almost all galaxies are moving awayfrom the Milky Way in all directions. Todispel this misconception, have studentsmark with a black marker a number ofdots on a partially inflated balloon. Blowup the balloon and observe whathappens to the dots. They all moveaway from each other, as do almost allgalaxies. All points in the universe canbe thought of as being the center of theuniverse, as everything else is movingaway from everything else.Visual
L2
L2
HSES_1eTE_C01.qxd 5/20/04 10:22 AM Page 6

Introduction to Earth Science 7
1.2 A View of Earth
Reading StrategyPredicting Before you read, predict themeaning of the vocabulary words. After youread, revise your definition if your predictionwas incorrect.
Key ConceptsWhat are the four majorspheres into which Earthis divided?
What defines the threemain parts of the solidEarth?
Which model explains theposition of continents andthe occurrence ofvolcanoes andearthquakes?
Vocabulary◆ hydrosphere◆ atmosphere◆ geosphere◆ biosphere◆ core◆ mantle◆ crust
A view such as the one in Figure 5A providedthe Apollo 8 astronauts with a unique view ofour home. Seen from space, Earth is breathtak-ing in its beauty. Such an image reminds us thatour home is, after all, a planet—small, self-con-tained, and in some ways even fragile.
If you look closely at Earth from space, youmay see that it is much more than rock and soil.The swirling clouds and the vast global oceanemphasize the importance of water on our planet.
Earth’s Major SpheresThe view of Earth shown in Figure 5B should help you see why the
physical environment is traditionally divided into three major spheres:the water portion of our planet, the hydrosphere; Earth’s gaseousenvelope, the atmosphere; and the geosphere.
Our environment is characterized by the continuous interactions ofair and rock, rock and water, and water and air. The biosphere, which ismade up of all the life-forms on Earth, interacts with all three of thesephysical spheres. Earth can be thought of as consisting of four majorspheres: the hydrosphere, atmosphere, geosphere, and biosphere.
Figure 5 A View that greetedthe Apollo 8 astronauts as theirspacecraft emerged from behindth Moon. B Africa and Arabia areprominent in this image of Earthtaken from Apollo 17. The tanareas are desert regions. Thebands of clouds over centralAfrica are associated withrainforests. Antarctica, which iscovered by glacial ice, is visible atthe south pole. The dark blueoceans and white swirling cloudsremind us of the importance ofoceans and the atmosphere.
Vocabulary Term Before You Read After You Read
hydrosphere a. b.
atmosphere c. d.
geosphere e. f.
biosphere g. h.
core i. j.
mantle k. l.
crust m. n. ??
??
??
??
??
??
??
BA
FOCUS
Section Objectives1.3 Describe Earth’s four major
spheres.1.4 Differentiate among the three
parts of the geosphere.1.5 State the value of the theory
of plate tectonics to EarthScience.
Build VocabularyWord Parts Explain to students thathydro- relates to water and atmos-relates to air. Have them use thisinformation, along with priorknowledge, to predict the meaning ofthe vocabulary words for this section.
Reading StrategySample answer:a. ball of waterb. all water on Earthc. ball of aird. gaseous envelope surrounding Earthe. ball of rockf. solid part of Earth below theatmosphere and oceansg. ball of living thingsh. all life on Earthi. center of Earthj. dense inner spherek. ledgel. less dense middle layerm. outer envelopen. light, thin outer layer
INSTRUCT
Earth’s Major SpheresUse VisualsFigure 5 This image of Earth was takenby astronauts in space. Ask: Whichof Earth’s features are visible fromspace? (oceans, continents, clouds)What does the color of the land thatis visible tell you about the climate inthose regions? (Brown indicates a desertclimate. Green indicates a wet climate.)What other Earth features do youthink would be visible from space?(smoke from forest fires and city lights atnight) Who might find images fromspace useful? (meteorologists, geologists,oceanographers)Visual, Verbal
L1
2
L2
L2
Reading Focus
1
Introduction to Earth Science 7
Section 1.2
HSES_1eTE_C01.qxd 5/13/04 12:24 PM Page 7

8 Chapter 1
Hydrosphere Water is what makes Earth unique. All of the wateron Earth makes up the hydrosphere. Continually on the move, waterevaporates from the oceans to the atmosphere, falls back to Earth asrain, and runs back to the ocean. The oceans account for approxi-mately 97 percent of the water on Earth. The remaining 3 percent isfresh water and is present in groundwater, streams, lakes, and glaciers.
Although these freshwater sources make up a small fraction of thetotal amount of water on Earth, they are quite important. Streams, gla-ciers, and groundwater are responsible for sustaining life and creatingmany of Earth’s varied landforms.
Atmosphere A life-sustaining, thin, gaseous envelope called theatmosphere surrounds Earth. It reaches beyond 100 kilometers aboveEarth, yet 90 percent occurs within just 16 kilometers of Earth’s sur-face. This thin blanket of air is an important part of Earth. It providesthe air that we breathe. It protects us from the sun’s intense heat anddangerous radiation. The energy exchanges that continually occurbetween space, the atmosphere, and Earth’s surface produce weatherand climate.
If Earth had no atmosphere, life on our planet as we know it couldnot exist. Many of the processes and interactions that make the surfacesuch a dynamic place would not occur. For example, without weath-ering and erosion, the face of our planet might more closely resemblethe moon.
Geosphere Lying beneath both the atmosphere and the ocean is thegeosphere. Because the geosphere is not uniform, it is divided intothree main parts based on differences in composition—the core, themantle, and the crust. Figure 6A shows the dense or heavy inner spherethat is the core; the less dense mantle; and the lighter, thin crust. The crustis not uniform in thickness. It is thinnest beneath the oceans and thick-
est beneath the continents. Figure6B shows that the crust anduppermost mantle make up arigid outer layer called the litho-sphere. Beneath the lithosphere,the rocks become partiallymolten, or melted. They are ableto slowly flow because of theuneven distribution of heat deepwithin Earth. This region is calledthe asthenosphere. Beneath theasthenosphere, the rock becomesmore dense. This region of Earthis called the lower mantle.
Figure 6 A On this diagram, theinner core, outer core, and mantleare drawn to scale but thethickness of the crust isexaggerated by about 5 times.B There are two types of crust—oceanic and continental. Thelithosphere is made up of thecrust and upper mantle. Below thelithosphere are the asthenosphereand the lower mantle.
Crust 5–70 km
OutercoreInner
core 2890km
2260km1220
km
ContinentalcrustOceanic
crust
Dep
th (k
m) 100
200
300
660
Lithosphere
Asthenosphere
UpperMantle
Lower Mantle
UpperMantle
AB
8 Chapter 1
Build Reading LiteracyRefer to p. 1D, which providesguidelines for guided anticipation.
Anticipation Guide Ask students torespond to the following questions inwriting before they read this section.Have students check their answers andmake changes as needed after theyfinish reading the section. Studentsshould answer True or False to thefollowing series of statements:• The atmosphere contains all of the
water on Earth. (F)• Groundwater is part of Earth’s
hydrosphere. (T)• Earth’s atmosphere does nothing to
protect us from the sun’s radiation. (F)• There is no crust under Earth’s oceans.
(F)• Earth’s crust is the same thickness
under land as under water. (F)• The only layer of Earth that is solid is
the crust. (F)• The biosphere affects all other spheres
of Earth. (T)Verbal
Earth’s LayersPurpose Provide students with a three-dimensional model of Earth’s layeredstructure.
Materials hard-boiled egg, knife
Procedure Show students a hard-boiled egg. Crack the shell in severalplaces so pieces of shell can slide a bitover the white of the egg. Tell studentsthe shell of the egg represents Earth’scrust, which is a thin layer, cracked andbroken into plates that can move. Cutthe egg in half. Show students that thewhite of the egg represents Earth’smantle, and the yolk of the eggrepresents Earth’s core.
Expected Outcome Students will beable to relate the structure of the egg tothe structure of Earth and can use thisrepresentation to create a mental modelof what Earth’s layers look like.Visual, Logical
L2
L1
Section 1.2 (continued)
Customize for Inclusion Students
Learning Disabled Have learning disabledstudents draw labeled pictures illustrating eachof Earth’s four major spheres: hydrosphere,atmosphere, geosphere, and biosphere. Be
sure they include Earth’s layers in their sketchof the solid Earth. They can use Figure 6 as aguide.
HSES_1eTE_C01.qxd 9/23/04 6:36 PM Page 8

Introduction to Earth Science 9
Biosphere The biosphere includes all life on Earth. It is concen-trated in a zone that extends from the ocean floor upward for severalkilometers into the atmosphere. Plants and animals depend on thephysical environment for life. However, organisms do more than justrespond to their physical environment. Through countless interac-tions, organisms help maintain and alter their physical environment.Without life, the makeup and nature of the solid Earth, hydrosphere,and atmosphere would be very different.
Plate TectonicsYou have read that Earth is a dynamic planet. If we could go back intime a billion years or more, we would find a planet with a surface thatwas dramatically different from what it is today. Such prominent fea-tures as the Grand Canyon, the Rocky Mountains, and the AppalachianMountains did not exist. We would find that the continents had differ-ent shapes and were located in different positions from those of today.
There are two types of forces affecting Earth’s surface. Destructiveforces such as weathering and erosion work to wear away high pointsand flatten out the surface. Constructive forces such as mountain build-ing and volcanism build up the surface by raising the land anddepositing new material in the form of lava. These constructive forcesdepend on Earth’s internal heat for their source of energy.
What are Earth’s four major spheres?
Eurasian plate
Philippineplate
Australian plate
NorthAmerican
plate
Juan deFucaplate
Pacific plate
Nazcaplate
Cocosplate
Antarctic plate
SouthAmerican
plate
Caribbeanplate
African plate
Divergent plate boundariesConvergent plate boundaries
Transform plate boundaries
Pacificplate
NorthAmerican
plate
Arabianplate
Figure 7 Plate Tectonics Thereare currently 7 major platesrecognized and numerous smallerplates. Relating Cause and EffectWhat is the relationship betweenmountain chains and plateboundaries?
Build Science SkillsMaking Judgments Present groupswith the questions below. Challengethem to reach a consensus answer toeach question. Once all groups havefinished, have one student in eachgroup present the results. Ask: Howdoes the hydrosphere, atmosphere,and geosphere affect the biosphere?(Flooding, tornadoes, hurricanes, volcanoes,and earthquakes have caused loss of lifeand habitat.) How do members of thebiosphere affect the geosphere?(Humans have dug mines into the crusts.Burrowing animals also affect the solidEarth, though often in more of atemporary way.) How do membersof the biosphere affect thehydrosphere and atmosphere?(Humans have polluted both water andair. Human-made dams and those built bybeavers can have a dramatic effect on theflow of rivers.) Does the biosphereinfluence the other spheres morethan the other spheres influence thebiosphere? Explain your answer.(Students can answer either way as longas they have solid reasoning to supporttheir decision. For example, when changesin the other spheres threaten the biosphere,humans usually find a way to adjust to thechanges. However, the other spheres arenot always able to respond to humanefforts.)Verbal
Plate TectonicsBuild Reading LiteracyRefer to p. 362D in Chapter 13, whichprovides guidelines for using priorknowledge.
Use Prior Knowledge Based on theirprevious experiences with words such asconstruction and destroy, have studentspredict the definitions of the termsconstructive forces and destructive forces.Help students see this connection andthen check that they understand bothterms by asking them to list somedestructive forces and some constructiveforces.Verbal
L1
L2
Introduction to Earth Science 9
Answer to . . .
Figure 7 Mountain chains are oftenfound along plate boundaries.
The four major spheresare the hydrosphere,
atmosphere, geosphere, and biosphere.
It is important to note that the “solid Earth” isnot really all solid. The crust, mantle, and innercore are solid, but the outer core is liquid. Inaddition, a tiny part of Earth’s mantle (in theastherosphere) is molten, which gives rise to
the lava that flows out of volcanoes. Scientistshave inferred the state of matter for each ofEarth’s layers by studying the paths thatseismic waves take through Earth.
Facts and Figures
HSES_1eTE_C01.qxd 5/13/04 12:25 PM Page 9

10 Chapter 1
Section 1.2 Assessment
Reviewing Concepts1. Which of Earth’s spheres do each of these
features belong: lake, meadow, canyon, cloud?
2. What are the three main parts of thegeosphere?
3. Why is the solid Earth layered?
4. The plate tectonics theory explains theexistence and occurrence of what features?
5. What sort of energy allows the tectonic platesto move?
6. Describe an example of how water movesthrough the hydrosphere.
Critical Thinking7. Inferring Using the definitions of spheres as
they occur on Earth, what spheres do youthink are present on Venus?
8. Applying Concepts Describe a situation inwhich two or more of Earth’s spheres areinteracting.
9. Classifying Choose an Earth science branch.List how some of its studies relate to Earth’sspheres.
Within the last several decades, a great deal has been learned aboutthe workings of Earth. In fact, this period is called a revolution in ourknowledge about Earth. This revolution began in the early part of thetwentieth century with the idea that the continents had moved aboutthe face of the Earth. This idea contradicted the accepted view that thecontinents and ocean basins are stationary features on the face ofEarth. Few scientists believed this new idea. More than 50 years passedbefore enough data were gathered to transform this hypothesis into awidely accepted theory. The theory that finally emerged, calledplate tectonics, provided geologists with a model to explain howearthquakes and volcanic eruptions occur and how continents move.
According to the plate tectonics model, Earth’s lithosphere is brokeninto several individual sections called plates. Figure 7 on page 9 showstheir current position. These plates move slowly and continuouslyacross the surface. This motion is driven by the result of an unequaldistribution of heat within Earth. Ultimately, this movement of Earth’slithospheric plates generates earthquakes, volcanic activity, and thedeformation of large masses of rock into mountains. You will learnmore about the powerful effects of plate tectonics in Chapter 9.
What is the difference between destructive forcesand constructive forces?
Earth’s Spheres You learned in Section 1.1that Earth is a dynamic planet. Explainhow features in each of Earth’s spheres arechanging over time.
Convection and PlatesPurpose Students observe how heatfrom within Earth can move plates.
Materials hot plate; deep, wide glasscontainer such as a lasagna pan; dilutedtomato soup; large, thin sponges;scissors; tongs
Procedure Fill the container abouthalfway with tomato soup, and put iton the hot plate. Slowly heat it untilconvection cells form (soup rising in thecenter and falling at the edges). Whilethe soup is heating, cut various roughplate shapes out of the sponges. Use thetongs to place the sponges on thesurface of the soup. Have studentsobserve what happens to the sponges.(If necessary, review the concept ofconvection.) Ask: Why is the soupmoving? (Heat from below createsconvection cells.) Why do the “plates”move? (The moving soup carried theplates along with it.) How is the actualmovement of Earth’s plates differentfrom this demonstration? (The moltenrock in the mantle is solid, and thereforeslower-moving than the soup, and so theactual plates move much more slowly.)
Safety Caution students not to touchthe hot container or soup.
Expected Outcome The heat willcreate convection cells that move thesponges around.Visual, Logical
ASSESSEvaluateUnderstandingHave students make posters showingEarth’s layers and spheres. Studentsshould label their drawings with theterms crust, mantle, core, hydrosphere,biosphere, and atmosphere.
ReteachUse Figure 7 to review Earth’s plates andthe concept of plate tectonics.
Students’ answers could includediscussions of the hydrosphere (sea levelchanges), atmosphere (weather andclimate changes), geosphere (erosion oftopsoil, earthquake occurrence), andbiosphere (evolution of living things).
L1
L2
3
L2
Section 1.2 (continued)
10 Chapter 1
5. Plate tectonics depends on Earth’s internalheat.6. Sample answer: Water in a lake evaporatesinto the atmosphere. The water vapor con-denses and falls from the clouds into the lakeas rain and the cycle begins again.7. geosphere, atmosphere8. Sample answer: waves (hydrosphere)crashing onto the shore (geosphere); birds(biosphere) flying in the sky (atmosphere)9. Sample answer: meteorology: cloudcover—atmosphere; rain storms—hydrosphereand atmosphere
Section 1.2 Assessment
1. lake: hydrosphere, meadow: geosphere,canyon: geosphere, cloud: atmosphere2. The three main parts of the geosphere arethe core, mantle, and crust.3. The layers formed because of density dif-ferences in the materials that made up earlyEarth.4. Plate tectonics explains mountains,continents, ocean basins, earthquakes,and volcanoes.
HSES_1eTE_C01.qxd 5/14/04 1:25 PM Page 10

1.3 Representing Earth’sSurface
Reading StrategyMonitoring Your Understanding Previewthe Key Concepts, topic headings, vocabulary,and figures in this section. List two things youexpect to learn. After reading, state what youlearned about each item you listed.
Key ConceptsWhat lines on a globe areused to indicate location?
What problems domapmakers face whenmaking maps?
How do topographicmaps differ from othermaps?
Vocabulary◆ latitude◆ longitude◆ topographic map◆ contour line◆ contour interval
Determining LocationToday we use maps and computer programs to help us plan our routes.Long ago, people had to rely on maps that were made using data andinformation that were collected by travelers and explorers. Today com-puter technology is available to anyone who wants to use it.Mapmaking has changed a lot throughout recorded history.
After Christopher Columbus and others proved that Earth was notflat, mapmakers began to use a global grid to help determine location.
Global Grid Scientists use two special Earth measurements todescribe location. The distance around Earth is measured in degrees.
Latitude is the distance north or southof the equator, measured in degrees.Longitude is the distance east orwest of the prime meridian,measured in degrees. Earth is360 degrees in circumference.Lines of latitude are east-westcircles around the globe. Allpoints on the circle have thesame latitude. The line of latitudearound the middle of the globe, at0 degrees (°), is the equator. Lines oflongitude run north and south. Theprime meridian is the line of longitude thatmarks ° of longitude as shown in Figure 8.
What I Expect to Learn What I Learned
a. b.
c. d. ??
??
Introduction to Earth Science 11
90°N
75°60°
45°
30°
15°
0°
15°
30°
45°
60°75°
75°60° 45° 30° 15° 0° 75°60°45°30°15°
Prim
e m
erid
ian
90°S
90° 90°90°
75°
60°
45°
30°
15°
0°
15°
30°
45°
60°
75°
90°
West East
North
South
Equator
A
B
C
D
E
A
B
C
D
E
75° 60° 45° 30° 15° 0° 75°60°45°30°15°
Figure 8 Global Grid
FOCUS
Section Objectives1.6 Locate points on Earth’s surface
by their latitude and longitude.1.7 Describe the advantages and
disadvantages of different typesof mass.
1.8 Explain what makestopographic maps differentfrom other maps.
Build VocabularyParaphrase Have students look up thevocabulary words for this section in theGlossary and then rewrite the definitionsin their own words. Help studentsremember latitude lines run horizontallyacross Earth with the mnemonic “Latlies flat.” Similarly, help them see thatlongitude lines run the “long way” overEarth.
Reading StrategySample answer:a. I expect to learn about latitude andlongitude.b. Latitude lines measure degrees northand south of the equator; longitudelines measure degrees east and west ofthe prime meridian.c. I expect to learn about different typesof maps.d. There are many different types ofmaps. Maps are hard to make accurately.Different map types have differentadvantages and disadvantages.
INSTRUCT
Determining LocationUse VisualsFigure 8 Help students find point D onthe global grid in this figure. Ask: Whatis the latitude and longitude of pointD? (45°N, 75°W) What major city isnear point D? (Montreal, Canada) If anearthquake occurred near point D, arepeople at point A likely to feel it? Whyor why not? (No, point D is in the WesternHemisphere and point A is in the EasternHemisphere.)Visual, Logical
L1
2
L2
L2
Reading Focus
1
Introduction to Earth Science 11
Section 1.3
HSES_1eTE_C01.qxd 5/13/04 12:26 PM Page 11

12 Chapter 1
Lines of latitude and longitude form a global grid. This grid allowsyou to state the absolute location of any place on Earth. For example,
Savannah, Georgia, is located at 32° north latitude and 81° westlongitude.
The equator divides Earth in two. Each half is called a hemi-sphere. The equator divides Earth into northern and southernhemispheres. The prime meridian and the 180° meridiandivide Earth into eastern and western hemispheres.
Globes As people explored Earth, they collected information aboutthe shapes and sizes of islands, continents, and bodies of water.Mapmakers wanted to present this information accurately. The bestway was to put the information on a model, or globe, with the sameround shape as Earth itself. By using an accurate shape for Earth,mapmakers could show the continents and oceans of Earth much asthey really are. The only difference would be the scale, or relative size.
But there is a problem with globes. Try making a globe large enoughto show the streets in your community. The globemight have to be larger than your school building! Aglobe can’t be complete enough to be useful for find-ing directions and at the same time small enough tobe convenient for everyday use.
Maps and MappingA map is a flat representation of Earth’s surface. ButEarth is round. Can all of Earth’s features be accuratelyrepresented on a flat surface without distorting them?The answer is no. No matter what kind of map ismade, some portion of the surface will always lookeither too small, too big, or out of place. Mapmakershave, however, found ways to limit the distortion ofshape, size, distance, and direction.
The Mercator Projection In 1569, a map-maker named Gerardus Mercator created a map to help sailorsnavigate around Earth. On this map, the lines of longitude are paral-lel, making this grid rectangular, as shown on the map in Figure 10.The map was useful because, although the sizes and distances were dis-torted, it showed directions accurately. Today, more than 400 yearslater, many seagoing navigators still use the Mercator projection map.
How does the global grid divide Earth?
Equator
Equator
Figure 10 Mercator Map Tomake a Mercator map,mapmakers have to carve animage of Earth’s surface into slicesand then stretch the slices intorectangles. Stretching the slicesenlarges parts of the map. Theenlargement becomes greatertoward the north and south poles. Observing What areas on themap appear larger than theyshould?
15°E
0°
15°W
90°E
Greenwich
90°N75°N60°N
45°N
30°N
15°N
0°
30°S
NorthPole
Equator
75°E60°E45°E30°E
Primemeridian
15°S L O N G I T U D E
30° B180°
75°60°45°
30°15°
90°
X
15°
45°Y
90°
LA
TI
TU
DE
60°
75°
Figure 9 Measuring Latitudeand Longitude
12 Chapter 1
Maps and MappingUse VisualsFigure 9 Use this diagram to explainthe concepts of latitude and longitudeand how they are measured. Emphasizethat although latitude and longitude areusually shown on Earth’s surface, theyare actually measured inside Earth.Ask: From which point is latitudemeasured? (the equator) From whichpoint is longitude measured? (theprime meridian)Visual, Logical
Build Reading LiteracyRefer to p. 124D in Chapter 5, whichprovides guidelines for summarizing.
Summarize Have students write asummary of this section that includeseach map type and its advantages anddisadvantages. This can be done as atable. Here is an example:
Map Type Advantages Disadvantages
Mercator Rectangular; Sizes andprojection longitude distances
lines are distortedparallel;directionsshownaccurately
Robinson Most Distortionsprojection distances, around the
sizes, and map edgesshapes areaccurate
Conic Great Lots ofprojection accuracy over distortion on
small areas; most of thegood for road mapand weathermaps
Gnomonic Reliably Exactprojection shows the distances
shortest and directionsdistance are distortedbetween twopoints
Visual, Verbal
L1
L1
Section 1.3 (continued)
Customize for Inclusion Students
Learning Disabled Students can more easilylocate positions on a map using latitude andlongitude coordinates by using the followingprocedure. First, help students orient themselvesto the map by locating the equator and theprime meridian. Have students go over thosetwo key points using a highlighter and extendthe lines out to the edge of the paper. Next,
have students write N in the left and rightmargins above the equator, and S in the leftand right margins below the equator. Studentsshould write W in the margins above andbelow the map west of the prime meridian,and write E in the margins above and belowthe map east of the prime meridian.
HSES_1eTE_C01.qxd 5/14/04 1:26 PM Page 12

Figure 11 Robinson ProjectionMap Compare this map to theMercator projection.Comparing and ContrastingHow do the shapes in thecontinents differ between thesemaps? Are there any otherdifferences?
Different Projection Mapsfor Different PurposesThe best projection is alwaysdetermined by its intended use.The Robinson projection map isone of the most widely used.Maps that use this projectionshow most distances, sizes, andshapes accurately. However, even a Robinson projection has distor-tions, especially in areas around the edges of the map. You can see thisin Figure 11. Conic projection maps are made by wrapping a cone ofpaper around a globe at a particularline of latitude, as shown in Figure13. Various points and lines areprojected onto the paper. Thereis almost no distortion alongthe line of latitude that’s incontact with the cone, but therecan be much distortion in areasaway from this latitude. Becauseaccuracy is great over a smallarea, these maps are used to makeroad maps and weather maps.Gnonomic projections, as shown in Figure13, are made by placing a piece of paper on a globe sothat it touches a single point on the globe’s surface.Various points and lines are then projected onto the paper.Although distances and directions are distorted on thesemaps, they are useful to sailors and navigators because they showwith great accuracy the shortest distance between two points.
Equator
What major problem must mapmakers overcome?
Figure 13 GnomonicProjection Map Gnomonicprojections allow sailors toaccurately determine distance anddirection across the oceans.
Introduction to Earth Science 13
Figure 12 Conic ProjectionMap Because there is littledistortion over small areas, conicprojections are used to make roadmaps and weather maps.
Conic and GnomonicProjectionsPurpose Students see how conic andgnomonic projections are made.
Materials small globe, blanktransparency sheet
Procedure Use a photocopier to copythe maps in Figures 12 and 13 ontoa blank transparency sheet. Make thefigures as large as possible. Cut thetransparency in half to separate thefigures. Wrap the copy of Figure 12around the globe in a cone shape asshown. Point out how the features ofthe globe line up with the projection.Hold the copy of Figure 13 flat on topof the North Pole as shown. Ask:Where was the conic projection mostaccurate? (near the latitude where thecone touches the globe) Least accurate?(near the top and bottom) Where wasthe gnomonic projection mostaccurate? (near the North Pole)
Expected Outcome Students willobserve how the projections are relatedto round Earth.Visual, Logical
Use VisualsFigures 10–13 Advise students to lookcarefully at Figures 10–13 to see howeach map is created and why thisprocess results in distortion. Ask: Basedon Figure 10, how does the way aMercator map is created causedistortion? (Since the Mercator map ismade by slicing a globe, each section isrounded and the sections don’t fit together,so each piece must be stretched into arectangle, causing distortion.) UsingFigure 11, explain how a conicprojection map is created. (A cone ofpaper is put over a globe, and the lines ofthe globe are projected onto the paper.)Visual
L1
L2
Introduction to Earth Science 13
Answer to . . .
Figure 10 the areas near the poles
Figure 11 The continents are lessdistorted near the poles The longitudelines are straight, not curved.
into hemispheres
Representing roundEarth on flat paper
causes distortion in shape, size,distance.
HSES_1eTE_C01.qxd 9/23/04 7:46 PM Page 13
14 Chapter 1
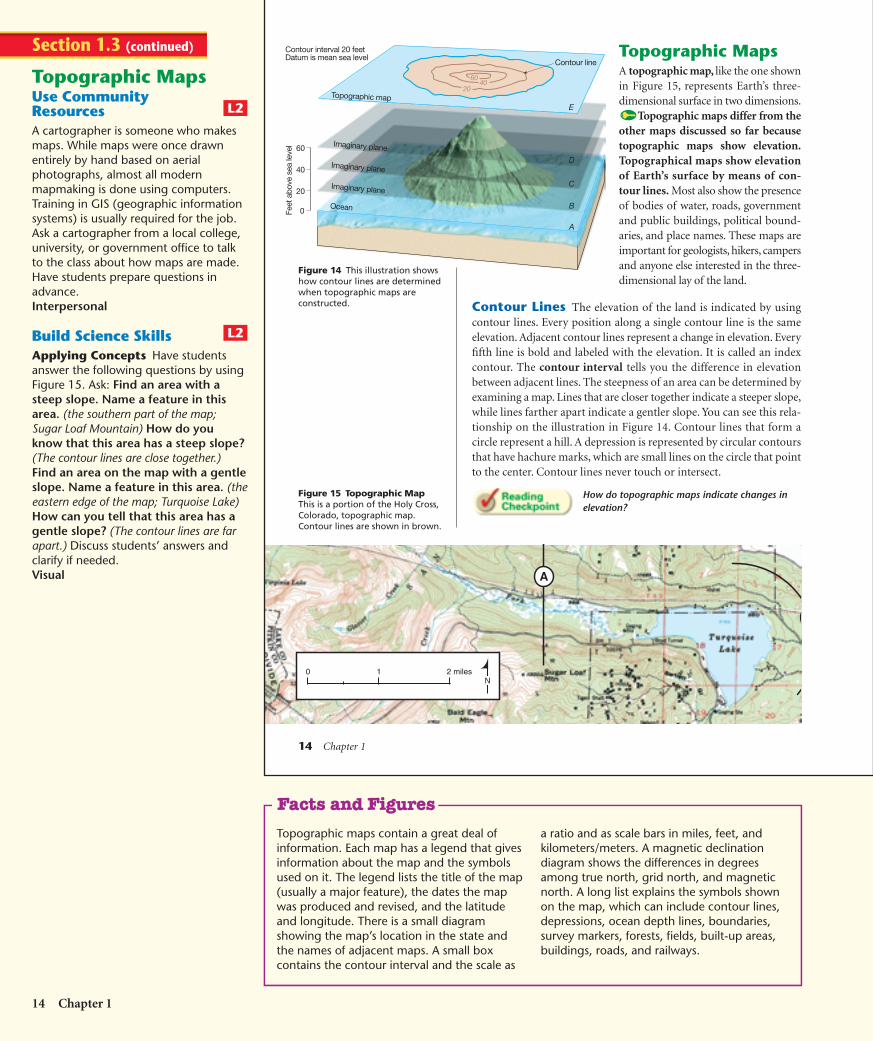
Topographic MapsA topographic map, like the one shownin Figure 15, represents Earth’s three-dimensional surface in two dimensions.
Topographic maps differ from theother maps discussed so far becausetopographic maps show elevation.Topographical maps show elevationof Earth’s surface by means of con-tour lines. Most also show the presenceof bodies of water, roads, governmentand public buildings, political bound-aries, and place names. These maps areimportant for geologists, hikers, campersand anyone else interested in the three-dimensional lay of the land.
Contour Lines The elevation of the land is indicated by usingcontour lines. Every position along a single contour line is the sameelevation. Adjacent contour lines represent a change in elevation. Everyfifth line is bold and labeled with the elevation. It is called an indexcontour. The contour interval tells you the difference in elevationbetween adjacent lines. The steepness of an area can be determined byexamining a map. Lines that are closer together indicate a steeper slope,while lines farther apart indicate a gentler slope. You can see this rela-tionship on the illustration in Figure 14. Contour lines that form acircle represent a hill. A depression is represented by circular contoursthat have hachure marks, which are small lines on the circle that pointto the center. Contour lines never touch or intersect.
How do topographic maps indicate changes in elevation?
0 1 2 milesN
A
Feet
abo
ve s
ea le
vel
20
Topographic map
0
2040
E
C
B
A
Ocean
Imaginary plane
DImaginary plane
60
Imaginary plane
40
60
Contour interval 20 feetDatum is mean sea level
Contour line
Figure 14 This illustration showshow contour lines are determinedwhen topographic maps areconstructed.
Figure 15 Topographic MapThis is a portion of the Holy Cross,Colorado, topographic map.Contour lines are shown in brown.
14 Chapter 1
Topographic MapsUse CommunityResourcesA cartographer is someone who makesmaps. While maps were once drawnentirely by hand based on aerialphotographs, almost all modernmapmaking is done using computers.Training in GIS (geographic informationsystems) is usually required for the job.Ask a cartographer from a local college,university, or government office to talkto the class about how maps are made.Have students prepare questions inadvance.Interpersonal
Build Science SkillsApplying Concepts Have studentsanswer the following questions by usingFigure 15. Ask: Find an area with asteep slope. Name a feature in thisarea. (the southern part of the map;Sugar Loaf Mountain) How do youknow that this area has a steep slope?(The contour lines are close together.)Find an area on the map with a gentleslope. Name a feature in this area. (theeastern edge of the map; Turquoise Lake)How can you tell that this area has agentle slope? (The contour lines are farapart.) Discuss students’ answers andclarify if needed.Visual
L2
L2
Section 1.3 (continued)
Topographic maps contain a great deal ofinformation. Each map has a legend that givesinformation about the map and the symbolsused on it. The legend lists the title of the map(usually a major feature), the dates the mapwas produced and revised, and the latitudeand longitude. There is a small diagramshowing the map’s location in the state andthe names of adjacent maps. A small boxcontains the contour interval and the scale as
a ratio and as scale bars in miles, feet, andkilometers/meters. A magnetic declinationdiagram shows the differences in degreesamong true north, grid north, and magneticnorth. A long list explains the symbols shownon the map, which can include contour lines,depressions, ocean depth lines, boundaries,survey markers, forests, fields, built-up areas,buildings, roads, and railways.
Facts and Figures
HSES_1eTE_C01.qxd 5/14/04 1:56 PM Page 14

Introduction to Earth Science 15
Scale A map represents a certain amount of area on Earth’s surface.So it is necessary to be able to determine distances on the map andrelate them to the real world. Suppose you want to build a scale modelof a boat that is 20 feet long. If your model is a 1/5-scale model, thenit is 4 feet long.
In a similar way, a map is drawn to scale where a certain distance onthe map is equal to a certain distance at the surface. Because maps modelEarth’s surface, the scale must be larger than that of the model boat. Lookat the scale on the map in Figure 16. The ratio reads 1:24,000. This meansthat 1 unit on the map is equal to 24,000 units on the ground. Becausethe ratio has no units, it may stand for anything. We usually use inchesor centimeters for our units. If the 1 stands for 1 centimeter on the map,how many kilometers does the 24,000 stand for on the ground?
Another scale provided on a map is a bar scale. See Figure 15. Thisallows you to use a ruler to measure the distance on the map and thenline the ruler up to the bar to determine the distance represented.
Geologic Maps It is often desirable to know the type and age ofthe rocks that are exposed, or crop out, at the surface. This kind of mapis shown in Figure 16. A map that shows this information is calleda geologic map. Once individual rock formations are identified, andmapped out, their distribution and extent are drawn onto the map.Each rock formation is assigned a color and sometimes a pattern. Akey provides the information needed to learn what formations arepresent on the map. Contour lines are often included to provide a moredetailed and useful map.
Figure 16 Geologic Map Thecolor coding on the maprepresents some rock formationsin Montana. Each color andpattern represents a differenttype of rock.
For: Links on mapping
Visit: www.SciLinks.org
Web Code: cjn-1013
12
SCALE 1:24 0001 0 1 MILE
1 .5 0 1 KILOMETER
1000 0 1000 2000 3000 4000 5000 6000 7000 FEET
Integrate MathWorking With Ratios Working with amap key to determine actual distancesoften requires the use of ratios, a topictaught in math class. Explain thefollowing process to your students. Ifa map legend has 1:24,000, thissuggests that 1 unit (centimeters orinches) on the map is equal to 24,000units (centimeters or inches) on Earth.To determine how many kilometers1 cm on the map would equal, set upa ratio (using the conversion factor1 km � 100,000 cm), as follows: 1 km /100,000 cm � xkm / 24,000 cm, thensolve the ratio by cross-multiplication.The result will be that 1 cm on the maprepresents 0.24 km on Earth. Because1:24,000 represents a ratio, it does notmatter what unit is used as long as themap’s unit matches the unit on Earth.This ratio would allow students todetermine how many inches on Earthcorresponded to inches on the map.Logical
Direct students to the Math Skills in theSkills and Reference Handbook at theend of the student text for additionalhelp.
Use CommunityResourcesGeologic maps are used by researchscientists, government agencies, andmining companies. Ask a geologist froma local college, university, miningcompany, or government office to talkto the class about how geologic mapsare made, what information they show,and how they are used. Ask students toprepare questions in advance.Interpersonal
L2
L2
Introduction to Earth Science 15
Download a worksheet on mappingfor students to complete, and findadditional teacher support fromNSTA SciLinks.
Answer to . . .
Topographic mapsindicate changes in
elevation with contour lines. Linescloser together indicate a steeper slope.
HSES_1eTE_C01.qxd 9/23/04 7:47 PM Page 15
16 Chapter 1
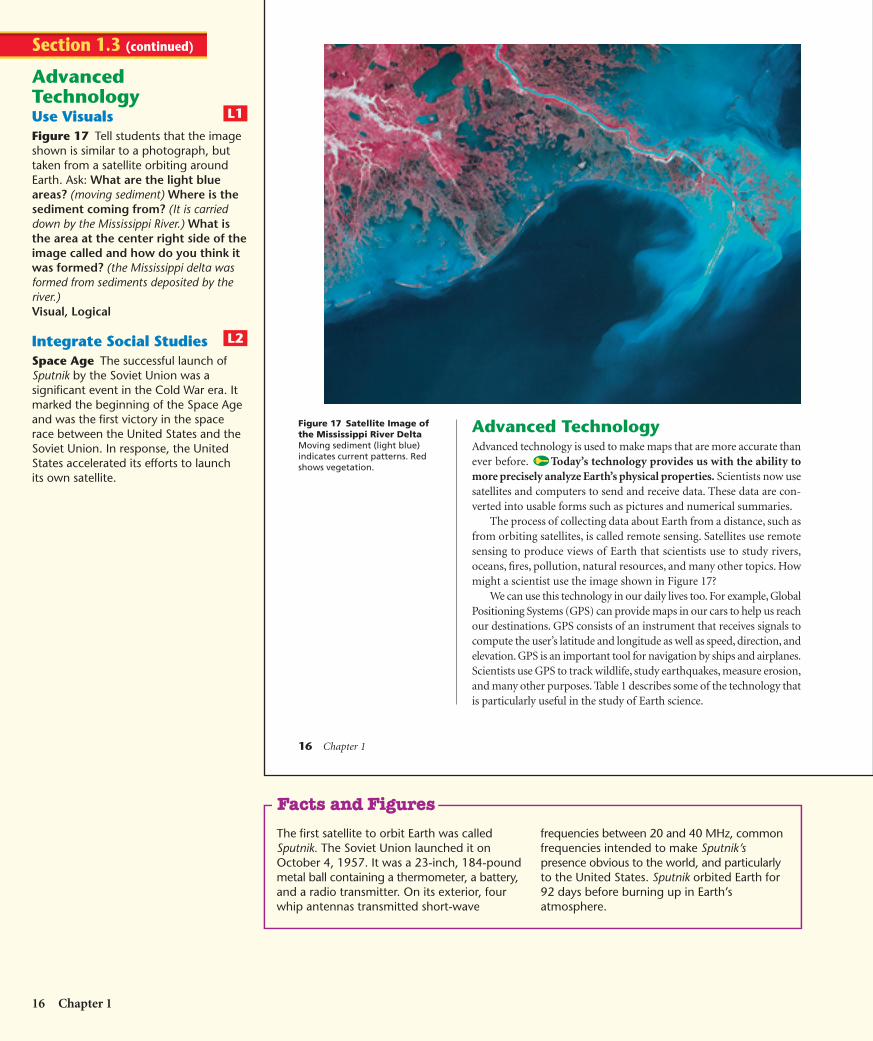
Advanced TechnologyAdvanced technology is used to make maps that are more accurate thanever before. Today’s technology provides us with the ability tomore precisely analyze Earth’s physical properties. Scientists now usesatellites and computers to send and receive data. These data are con-verted into usable forms such as pictures and numerical summaries.
The process of collecting data about Earth from a distance, such asfrom orbiting satellites, is called remote sensing. Satellites use remotesensing to produce views of Earth that scientists use to study rivers,oceans, fires, pollution, natural resources, and many other topics. Howmight a scientist use the image shown in Figure 17?
We can use this technology in our daily lives too. For example, GlobalPositioning Systems (GPS) can provide maps in our cars to help us reachour destinations. GPS consists of an instrument that receives signals tocompute the user’s latitude and longitude as well as speed, direction, andelevation. GPS is an important tool for navigation by ships and airplanes.Scientists use GPS to track wildlife, study earthquakes, measure erosion,and many other purposes. Table 1 describes some of the technology thatis particularly useful in the study of Earth science.
Figure 17 Satellite Image ofthe Mississippi River DeltaMoving sediment (light blue)indicates current patterns. Redshows vegetation.
16 Chapter 1
AdvancedTechnologyUse VisualsFigure 17 Tell students that the imageshown is similar to a photograph, buttaken from a satellite orbiting aroundEarth. Ask: What are the light blueareas? (moving sediment) Where is thesediment coming from? (It is carrieddown by the Mississippi River.) What isthe area at the center right side of theimage called and how do you think itwas formed? (the Mississippi delta wasformed from sediments deposited by theriver.)Visual, Logical
Integrate Social StudiesSpace Age The successful launch ofSputnik by the Soviet Union was asignificant event in the Cold War era. Itmarked the beginning of the Space Ageand was the first victory in the spacerace between the United States and theSoviet Union. In response, the UnitedStates accelerated its efforts to launchits own satellite.
L2
L1
Section 1.3 (continued)
The first satellite to orbit Earth was calledSputnik. The Soviet Union launched it onOctober 4, 1957. It was a 23-inch, 184-poundmetal ball containing a thermometer, a battery,and a radio transmitter. On its exterior, fourwhip antennas transmitted short-wave
frequencies between 20 and 40 MHz, commonfrequencies intended to make Sputnik’spresence obvious to the world, and particularlyto the United States. Sputnik orbited Earth for92 days before burning up in Earth’satmosphere.
Facts and Figures
HSES_1eTE_C01.qxd 5/14/04 1:27 PM Page 16

Section 1.3 Assessment
Reviewing Concepts1. Describe the two sets of lines that are used
on globes and some maps.
2. What happens to the images on the globewhen they are transferred to a flat surface?
3. What is the purpose of contour lines ontopographic maps?
4. What two lines mark zero degrees on theglobe? In which directions do these lines run?
5. Why is the Mercator projection map still in usetoday?
6. What types of advanced technology are usedin mapmaking today?
Critical Thinking7. Applying Concepts Why are there so many
different types of maps?
8. Drawing Conclusions How can data fromVLBI be used in mapmaking today?
9. Conceptualizing An area on a topographicmap has the following contour lineconfiguration: First, the lines are fairly widelyspaced. Then they are closely spaced. Finally,they are circular. Describe the topographyrepresented by these lines.
Use the bar scale on Figure 15 to answerthe following question.
10. Determine the distance along theshoreline of Turquoise Lake from thegaging station on the west shore to thegaging station on the south shore.Record your answer in kilometers.
Introduction to Earth Science 17
Type of Equipment Capabilities
Weather Satelllites
Navigation Satellites • These assist ships and submarines to determine their exact location at any time.
Landsat Satellites • The first Landsat satellite was launched in 1972. Landsat 7 was launched in 1999.• They provide data on Earth’s landmasses, coastal boundaries, and coral reefs.• Pictures taken are transmitted to ground stations around the world.• They orbit Earth every 99 minutes and complete 14 orbits per day.• Total coverage of Earth is achieved in 16 days.
Global Positioning • This system combines satellite information with computer technology to provideSystem (GPS) location information in three dimensions: latitude, longitude, and altitude.
• Three satellite signals are detected by a receiver. The distance from the satellites to the receiver is calculated, and the location is determined using the triangulation method. A fourth signal is then used to mathematically determine exact position.
Very Long Baseline • VLBI utilizes a large network of antennas around the world to receive radioInterferometry (VLBI) waves from space objects such as quasars.
• In Earth science, VLBI is used in geodesy, or the measurement of the geosphere.• Using the arrival times of radio waves from quasars, the position of radio
telescopes on Earth are determined to within millimeters of their position.• Small changes in the telescope positions allow scientists to study tectonic plate
motions and other movements of Earth’s crust with great precision and accuracy.
Table 1 Technology and Earth Science
• These monitor atmospheric temperature and humidity, ground and surface seawater temperature, cloud cover, and water-ice boundaries.
• They can help locate sources of distress signals.• They are able to scan Earth's surface in one 24-hour period.
Build Science SkillsPosing Questions Have studentsselect one type of equipment describedin Table 1 to research. Encouragestudents to make a list of questionsabout the equipment, such as when andwhere it was invented and by whom.Then have them research how thetechnology works and close with someapplications of the technology theyselected. Students can present theirwork as a written report, an oral report,or a poster to share with the class.Verbal, Visual
ASSESSEvaluateUnderstandingGive students a topographic map thatincludes latitude and longitude. Havethem locate specific features on themap, such as hills and depressions,based on the shapes of the contourlines. Have students determine thelatitude and longitude of these features.Give students the latitude and longitudeof a few sites of interest on the map andhave them tell you what they find ateach of those locations.
ReteachHave students answer the Assessmentquestions in small groups. Assign thelower ability students to answer theReviewing Concepts questions and thehigher ability students to answer theCritical Thinking questions. Havepartners then share and discuss theiranswers. Once all groups are finished,have students report their answers tothe class. Clarify concepts as needed.
Solution10. The distance in centimeters onthe map is approximately 5.5 cm. Thedistance on the ground is approximately3.43 km.
L1
L2
3
L2
Introduction to Earth Science 17
6. Sample answer: satellites, computers,high-powered telescopes, sonar, GPS, VLBI7. Each type of map is particularly useful insome capacity. Conic projections are goodfor small-scale maps such as road maps.Topographic maps help geologists and hikers.Mercator projections help sailors to navigate.8. Because small-scale changes in position canbe detected by VLBI technology, movementsof Earth’s crust can be measured precisely.9. The land starts out relatively flat and risessteeply to the top of a hill.
Section 1.3 Assessment
1. Lines of latitude are east-west circlesaround the globe. Lines of longitude runnorth and south.2. They become distorted.3. Contour lines indicate elevation.4. The lines are the equator, which runs eastand west, and the prime meridian, whichruns north and south.5. It is useful to sailors because although sizeand shape are distorted, it shows directionsaccurately.
HSES_1eTE_C01.qxd 9/23/04 7:47 PM Page 17
18 Chapter 1
1.4 Earth System Science
Reading StrategyOutlining As you read, make an outline ofthe most important ideas in this section. Beginwith the section title, then list the greenheadings as the next step of the outline.Outline further as needed.
Key ConceptsHow is Earth a system?
What is a system?
Where does the energycome from that powersEarth’s systems?
How do humans affectEarth’s systems?
What makes a resourcerenewable ornonrenewable?
Vocabulary◆ system
A s we study Earth, we see that it is a dynamic planet with manyseparate but interactive parts or spheres. Earth scientists are studyinghow these spheres are interconnected. This way of looking atEarth is called Earth system science. Its aim is to understand Earthas a system made up of numerous interacting parts, or subsystems.Instead of studying only one branch of science, such as geology, chem-istry, or biology, Earth system science tries to put together what weknow from our study of all of these branches. Using this type ofapproach, we hope to eventually understand and solve many of ourglobal environmental problems.
What Is a System?Most of us hear and use the term system frequently. You might useyour city’s transportation system to get to school. A news report mightinform us of an approaching weather system. We know that Earth isjust a small part of the much larger solar system.
A system can be any size group of interacting parts that forma complex whole. Most natural systems are driven by sources of energythat move matter and/or energy from one place to another. A simpleanalogy is a car’s cooling system. It contains a liquid (usually water andantifreeze) that is driven from the engine to the radiator and back
What Is Earth system science?
I. Earth System ScienceA. What is a System?
1.
2.
B. ?
?
?
18 Chapter 1
FOCUS
Section Objectives1.9 Describe the primary goal of
Earth system science anddefine the term system.
1.10 Describe Earth’s two majorsources of energy.
1.11 Explain how humans affectEarth’s systems.
1.12 Distinguish betweenrenewable and nonrenewableresources.
Build VocabularyWord Forms Have students predictthe meanings of open system and closedsystem based on their prior knowledgeof the words open, closed, and system.Have students verify their predictions byreading the section.
Reading StrategyEarth System ScienceA. What is a System?
1. System—any size group ofinteracting parts forming a whole
2. Types of Systems—closed andopen
B. Earth as a System1. Earth has two energy sources—the
sun and Earth’s interior.2. The parts of the Earth system are
linked so a change in one part cancause changes in all the other parts.
INSTRUCT
What Is a System?Build Science SkillsUsing Analogies The text gives ananalogy of a car’s cooling system to anatural system. Challenge students tothink of other analogies betweenhuman-made and natural systems.They should write a description ofthe analogy they choose, includingdiagrams if appropriate. Thedescriptions should explain how theanalogies are similar to the actualprocess and different from it.Verbal, Logical
L2
2
L2
L2
Reading Focus
1
Section 1.4
HSES_1eTE_C01.qxd 9/23/04 7:48 PM Page 18

Introduction to Earth Science 19
again. The role of this system is to transfer the heat generated by com-bustion in the engine to the radiator, where moving air removes theheat from the system.
This kind of system is called a closed system. Here energy movesfreely in and out of the system, but no matter enters or leaves the system.In the case of the car’s cooling system, the matter is the liquid. By con-trast, most natural systems are open systems. Here both energy andmatter flow into and out of the system. In a river system, for example, theamount of water flowing in the channel can vary a great deal. At onetime or place, the river may be fuller than it is at another time or place.
Earth as a SystemThe Earth system is powered by energy from two sources. Onesource is the sun, which drives external processes that occur in theatmosphere, hydrosphere, and at Earth’s surface. Weather and cli-mate, ocean circulation, and erosional processes are driven by energyfrom the sun. Earth’s interior is thesecond source of energy. There is heat thatremains from the time Earth formed. Thereis also heat continuously generated by thedecay of radioactive elements. These sourcespower the internal processes that producevolcanoes, earthquakes, and mountains.
The parts of the Earth system are linkedso that a change in one part can producechanges in any or all of the other parts. Forexample, when a volcano erupts, lava mayflow out at the surface and block a nearbyvalley. This new obstruction influences theregion’s drainage system by creating a lake orcausing streams to change course. Volcanicash and gases that can be discharged duringan eruption might be blown high into theatmosphere and influence the amount ofsolar energy that can reach Earth’s surface. The result could be a dropin air temperatures over the entire hemisphere.
Over time, soil will develop on the lava or ash-covered surface and,as shown in Figure 18, plants and animals will reestablish themselves.This soil will reflect the interactions among many parts of the Earthsystem—the original volcanic material, the type and rate of weather-ing, and the impact of biological activity. Of course, there would also
How do we know that Earth’s systems are connected?
Figure 18 When Mount St.Helens erupted in May 1980, thearea shown here was buried by avolcanic mudflow. Now, plants arereestablished and new soil isforming.
Build Reading LiteracyRefer to p. 216D in Chapter 8, whichprovides guidelines for comparing andcontrasting.
Compare and Contrast Helpstudents understand the differencebetween an open system and a closedsystem. Have students make acomparison chart, starting with thedefinition of each type of system.Have students classify each systemlisted during the brainstorming sessionas either an open system or a closedsystem. Example:
Open ClosedSystem System
Definition Energy and Energymatter move moves inin and out of and out ofthe system. the system,
but mattercannot enteror leave.
Examples weather system coolingriver system system
Have students research a list of systems.Then have students put each system inthe correct column on their comparisonchart.Verbal, Logical
Earth as a SystemBuild Science SkillsRelating Cause and Effect Using thissection of the textbook, have studentsmake a concept map showing how avolcanic eruption (an event of thegeosphere) can causes changes inall the other spheres (hydrosphere,atmosphere, and biosphere). Havestudents use the concept map to make aposter to be displayed in the classroom.Challenge students to create a productthat is both visually appealing andscientifically accurate. Ask students tothink of another event on Earth andpredict how it would affect all the otherspheres. Have students make anotherconcept map poster on this event.Visual, Group
L2
L1
Introduction to Earth Science 19
Customize for English Language Learners
Review with English language learners themeanings of the words open and closed.Help students relate the meanings of openand closed to open system and closed system.Before teaching the terms renewable resourcesand nonrenewable resources, explain what itmeans to renew a library book (take it outagain before you return it). Help studentsrelate this use of the word renew to the terms
renewable resources and nonrenewableresources. Tell students that if they are notallowed to renew a library book (nonrenewable)it is often because the library does not haveenough books on that topic to meet the needsof their patrons. Explain that a renewableresource can be used as often as we likebecause there is always more of it being made.
Answer to . . .
Earth system science is away of looking at Earth
as a system made up of severalinteracting subsystems.
Events taking place inone part can produce
changes in all the other parts.
HSES_1eTE_C01.qxd 5/13/04 12:34 PM Page 19

20 Chapter 1
be significant changes in the biosphere. Some organisms and theirhabitats would be eliminated by the lava and ash, while new settings forlife, such as the lake, would be created. The potential climate changecould also have an effect on some life-forms.
The Earth system is characterized by processes that occur over areasthat range in size from millimeters to thousands of kilometers. Timescales for Earth’s processes range from milliseconds to billions of years.Despite this great range in distance and time, many processes are con-nected. A change in one component can influence the entire system.
Humans are also part of the Earth system. Our actions pro-duce changes in all of the other parts of the Earth system. When weburn gasoline and coal, build breakwaters along a shoreline, disposeof our wastes, and clear the land, we cause other parts of the Earthsystem to respond, often in unforeseen ways. Throughout this book,you will learn about many of Earth’s subsystems, such as the hydrologic(water) system, the tectonic (mountain-building) system, and the cli-mate system. Remember that these components and we humans areall part of the complex interacting whole we call the Earth system.
People and the EnvironmentEnvironment refers to everything that surrounds and influences anorganism. Some of these things are biological and social. Others arenonliving such as water, air, soil and rock as well as conditions such astemperature, humidity, and sunlight. These nonliving factors make upour physical environment. Because studying the Earth sciences leads toan understanding of the physical environment, most of Earth sciencecan be characterized as environmental science.
Today the term environmental science is usually used for things thatfocus on the relationships between people and the natural environment. For example, we can dramatically influence naturalprocesses. A river flooding is natural, but the size and frequency offlooding can be changed by human activities such as clearing forests,building cities, and constructing dams. Unfortunately, natural systemsdo not always adjust to artificial changes in ways we can anticipate. Analteration to the environment that was intended to benefit society mayhave the opposite effect, as shown in Figure 19.
Resources Resources are an important focus of the Earth sciences.They include water and soil, metallic and nonmetallic minerals, andenergy. Together they form the foundation of modern civilization. TheEarth sciences deal not only with the formation and occurrence of
What are examples of nonliving factors?
Figure 19 The benefit that wasintended by the construction ofthe Aswan Dam in Egypt was notachieved. Drawing Conclusions Howmight the flooding here havebeen avoided?
20 Chapter 1
Students may think that only humanactions can seriously affect the environ-ment. Use the example of the eruptionof Mount St. Helens to emphasize thatnatural events can have widespread andnegative effects on the environment.The 1980 eruptions spread ash overmuch of eastern Washington. About500 square kilometers of forest weredestroyed or damaged. Most largeanimals in the area were killed by theblast, but some small animals survived.More than 20 years later, the area is stillfairly barren. It may take at least 200years for the forest to be restored to itsprevious state. Large mammals such aselk have already repopulated the area,along with birds, insects, and smallmammals.
People and theEnvironmentUse VisualsFigure 19 This flood was caused by theaction of humans. Ask: What was theactual cause of this flood? (building theAswan Dam) What are some wayshumans can cause floods or makethem worse? (by clearing forests,building cities, and constructing dams)Visual, Logical
L1
L2
Section 1.4 (continued)
One of the reasons it is often difficult topredict how natural systems will respond tounexpected changes is the prevalence ofpositive and negative feedback mechanisms.Processes that feed into changes, makingthem more severe, are considered positivefeedback. As humans put more carbon dioxideinto the air, Earth may hold more of the sun’sheat and begin to warm. This warming maycause snow and ice near the poles to melt.This melting may make Earth absorb more
of the sun’s rays, thus increasing Earth’stemperature further. This is an example ofpositive feedback. Negative feedbackmechanisms work to return the system to theway it was before the change. For example,an increase in Earth’s temperature may resultin an increase in evaporation, and then anincrease in clouds. Clouds cause Earth toreflect more of the sun’s rays back into space,cooling Earth back down.
Facts and Figures
HSES_1eTE_C01.qxd 5/14/04 1:29 PM Page 20

Introduction to Earth Science 21
these vital resources but also with maintaining supplies and the envi-ronmental impact of their mining and use.
Resources are commonly divided into two broad categories—renew-able resources and nonrenewable resources. Renewable resourcescan be replenished over relatively short time spans. Common exam-ples are plants and animals for food, natural fibers for clothing, andforest products for lumber and paper. Energy from flowing water, wind,and the sun are also considered renewable resources.
Important metals such as iron, aluminum, and copper plus our mostimportant fuels of oil, natural gas, and coal are classified as nonrenew-able resources. Although these and other resources continue toform, the processes that create them are so slow that it takes millionsof years for significant deposits to accumulate. Earth contains limitedquantities of these materials. Although some nonrenewable resources,such as aluminum, can be used over and over again, others, such as oil,cannot. When the present supplies are exhausted, there will be no more.
Population Figure 20 shows that the population of Earthis growing rapidly. Although it took until the beginning of thenineteenth century for the population to reach 1 billion, just 130 years were needed for the population to double to 2 billion.Between 1930 and 1975, the figure doubled again to 4 billion,and by about 2010, as many as 7 billion people may inhabitEarth. Clearly, as population grows, so does the demand forresources. However, the rate of mineral and energy resourceusage has increased more rapidly than the overall growth of thepopulation.
How long will the remaining supplies of basic resourceslast? How long can we sustain the rising standard of living intoday’s industrialized countries and still provide for the grow-ing needs of developing regions? How much environmentaldeterioration are we willing to accept to obtain basicresources? Can alternatives be found? If we are to cope withthe increasing demand on resources and a growing worldpopulation, it is important that we have some understandingof our present and potential resources.
Environmental ProblemsIn addition to the search for mineral and energy resources, the Earth sci-ences must also deal with environmental problems. Some of theseproblems are local, some are regional, and still others are global. Humanscan cause problems, such as the one shown in Figure 21. Significant
How do renewable and nonrenewable resourcesdiffer?
Wor
ld p
opul
atio
n (b
illio
ns)
8
7
6
5
4
3
2
1
04000 2000 0 2000
B.C. A.D.Year
4 billion(1975)
2 billion(1930)
1 billion(early 1800’s)
6.1 billion(2000)
Figure 20 Growth of WorldPopulation
For: Links on environmentaldecision-making
Visit: www.SciLinks.org
Web Code: cjn-1014
Build Science SkillsProblem Solving Explain that whensupplies of a nonrenewable resourcestart running low, it is often possible tosubstitute some other resource. Havestudents work in small groups tobrainstorm and research alternatives tooil that can be used when all of our oilhas been used up. If students are havingtrouble getting started, suggest thatthey focus on transportation and powergeneration. Areas students caninvestigate include natural gas, coal,biodiesel, nuclear power, wind power,and solar power. Have each grouppresent their results to the class.Interpersonal, Logical
Students may think that the worldpopulation is expected to continue toincrease indefinitely. Tell students thatmany demographers (scientists whostudy changes in human populations)expect population growth to slow downover the next 100 years. In fact, somepredict that the total population mayeven decrease. The reason for this is thatin many developed countries, people arenot having enough children to replacethemselves. Most current populationgrowth is occurring in developingcountries. However, as those countriesdevelop, their birth rates are alsoexpected to fall.
L2
L2
Introduction to Earth Science 21
Download a worksheet onenvironmental decision-making forstudents to complete, and findadditional teacher support fromNSTA SciLinks.
Answer to . . .
Figure 19 The flooding could havebeen avoided by not building the dam.
Nonliving factors includewater, air, soil, rock,
temperature, humidity, and sunlight.
Renewable resourcescan be replenished
over a relatively short time span.Nonrenewable resources take millionsof years to accumulate.
HSES_1eTE_C01.qxd 5/13/04 12:35 PM Page 21

22 Chapter 1
Section 1.4 Assessment
Reviewing Concepts1. Why do scientists study Earth as a system?
2. If a system is a collection of interactingparts, what happens when one of the parts ischanged?
3. What are the two sources of energy thatpower Earth’s systems?
4. List three ways that humans affect Earth’ssystems.
5. Large numbers of tiny ocean organismsdie every day, fall to the ocean floor, areburied, and are eventually converted to oiland natural gas. Why are these two fuelsconsidered nonrenewable?
Critical Thinking6. Applying Concepts Describe the parts of a
tree in terms of it being a system.
7. Evaluating Is it possible for humans to haveno effect on any of Earth’s systems? Explain.
8. Applying Concepts How can scientists helpto prevent a natural process from becomingan environmental hazard?
threats to the environment include air pollution, acid rain, ozonedepletion, and global warming. The loss of fertile soils to erosion, thedisposal of toxic wastes, and the contamination and depletion of waterresources are also of considerable concern. The list continues to grow.
People must cope with the many natural hazards that exist such asthe one shown in Figure 22. Earthquakes, landslides, floods, hurricanes,and drought are some of the many risks. Of course, environmental haz-ards are simply natural processes. They become hazards only whenpeople try to live where these processes occur.
It is clear that as world population continues to grow, pressures on theenvironment will increase as well. Therefore, an understanding of Earthis essential for the location and recovery of basic resources. It is also essen-
tial for dealing with the human impacton the environment and minimizing theeffects of natural hazards. Knowledgeabout Earth and how it works is neces-sary to our survival and well being. Earthis the only suitable habitat we have, andits resources are limited.
City Planning In Section 1.3, you learnedabout Landsat satellite imaging. How candata from Landsat help city planners deter-mine where and where not to build?
Figure 22 The damage here wascaused by a landslide that wastriggered by an earthquake.
Figure 21 Air pollution in theChinese city of Guangzhou. Airquality problems affect many cities.Interpreting PhotographsWhat may have contributedto this air pollution problem?
22 Chapter 1
EnvironmentalProblemsBuild Science SkillsInferring Discuss withstudents that eventssuch as earthquakes,landslides, floods,hurricanes, beach erosion from coastalstorms, and drought are naturalprocesses. Help students understandthat these natural processes becomehazards “only when people try to livewhere these processes occur.” Providesmall groups of students with one ormore pictures of damage from naturaldisasters. Some examples to use wouldbe flooded homes, a coastal homeabout to be carried out to sea, buildingsdamaged by an earthquake, or urbanflooding due to too much paved land.Ask: What happened here? How couldthis disaster have been prevented?(Sample answer: This home is beingcarried out to sea because it was built tooclose to the ocean. These homes wereflooded because they were built on a floodplain. This building was destroyed becauseit was built too close to a fault line.) Havestudents infer the answers to these twoquestions, and then share their ideaswith the class. Use this as an opportunityto introduce students to various Earthevents and processes that will be studiedlater in the year.Visual
ASSESSEvaluateUnderstandingAsk students to write a five-questionquiz on this section along with ananswer key. Then have students ask oneanother the questions.
ReteachUse the outlines students created for thischapter’s reading strategy to review themain ideas from this section.
Images can show scars of landslides,suggesting that the area may not bestable.
L1
L2
3
L2
Section 1.4 (continued)
trunk transports food and serves as supportfor branches and leaves. Leaves help keep thetree moist and shaded and release excesswater through pores.7. No, every day you affect at least one ofEarth’s systems, even on the smallest scale.Simply breathing changes the atmospherearound you or stepping on the grass mayaffect the biosphere beneath your foot.8. Sample answer: They can analyze an areato see if it is safe to live there. If the land isunstable or subject to flooding, they maymake recommendations that people notchoose to live there.
Section 1.4 Assessment
1. Earth is a system made up of numerousinteracting parts, or subsystems.2. Other parts may also change.3. The sources are the sun and reactions inEarth’s interior.4. Sample answer: contaminating water,polluting air, disposing of toxic waste5. It takes too long (millions of years) for theorganisms to be converted into oil.6. Roots transport food and water up throughthe trunk, which holds the tree upright. The
Answer to . . .
Figure 21 Sample answer: homeheating, motor vehicles, industry,power plants
HSES_1eTE_C01.qxd 9/23/04 7:48 PM Page 22
Introduction to Earth Science 23
1.5 What Is Scientific Inquiry?
Reading StrategyComparing and Contrasting Complete theVenn diagram by listing the ways hypothesisand theory are alike and how they differ.
Key ConceptsWhat is a hypothesis?
What is a theory?
Vocabulary◆ hypothesis◆ theory
A ll science is based on two assumptions. First, the natural worldbehaves in a consistent and predictable manner. Second, through care-ful, systematic study, we can understand and explain the naturalworld’s behavior. We can use this knowledge to make predictions aboutwhat should or should not be expected. For example, by knowing howoil deposits form, geologists are able to predict the most likely sites forexploration.
The development of new scientific knowledge involves some basicsteps. First, scientists collect data through observation and measure-ment. These data are essential to science and serve as the starting pointfor the development of scientific theories.
HypothesisOnce data have been gathered, scientists try to explain how or
why things happen in the manner observed. Scientists do this by stat-ing a possible explanation called a scientific hypothesis. Sometimesmore than one hypothesis is developed to explain a given set of obser-vations. Just because a hypothesis is stated doesn’t mean that it is corrector that the scientific community will automatically accept it.
Before a hypothesis can become an accepted part of scientificknowledge, it must be tested and analyzed. If a hypothesis can’t betested, it is not scientifically useful, no matter how interesting it mightseem. Hypotheses that fail rigorous testing are discarded. The historyof science is filled with discarded hypotheses. One of the best knownis the Earth-centered model of the universe. This hypothesis was basedon the apparent movement of the sun, moon, and stars around Earth.
hypothesis theory
For: Links on scientific methods
Visit: www.SciLinks.org
Web Code: cjn-1015
FOCUS
Section Objectives1.13 Define the terms hypothesis
and theory.
Build VocabularyWord Meanings Before they readthe section, have students write downdefinitions for hypothesis and theory. Asthey read the section, have them notethe scientific definitions of these termsand compare them to their definitions.
Reading StrategyHypothesis: an idea someone wants totest; Theory: an explanation that issupported by evidence and widelyaccepted; Similarities: could be provenwrong, can be tested
INSTRUCT
HypothesisBuild Reading LiteracyRefer to p. 446D in Chapter 16, whichprovides guidelines for sequencing.
Sequence Tell students to create aflowchart showing the steps toward thedevelopment of a scientific theory. Theyshould begin the flowchart as they arereading the introduction to this sectionand should end it at Scientific Methods.(Sample response: Collect data → Develophypotheses or models → Test hypothesis(experiment) → Accept, modify, or rejecthypothesis → If well tested, the hypothesisbecomes a theory.) Have students checktheir flowchart against the sequence ofsteps provided in the Scientific Methodssection of the text.Visual, Verbal
L1
2
L2
L2
Reading Focus
1
Introduction to Earth Science 23
Section 1.5
Download a worksheet on scientificmethods for students to complete,and find additional teacher supportfrom NSTA SciLinks.
HSES_1eTE_C01.qxd 5/13/04 12:38 PM Page 23
24 Chapter 9
Section 1.5 Assessment
Reviewing Concepts1. You have just come up with an
explanation to a question that has botheredyou for some time. What must you do to haveyour explanation become a hypothesis?
2. Explain how a hypothesis can become atheory.
3. According to the scientific community, howdoes the natural world behave?
4. What happens if more than one hypothesis isput forward to explain the same observations?
5. When is a model useful in scientificinvestigations?
Thinking Critically6. Applying Concepts Why do most scientists
follow a set order of steps when carrying out ascientific investigation?
7. Designing Experiments While carrying outan investigation, a scientist observes someunexpected results. What are the scientist’snext steps?
8. Understanding Concepts Why is itnecessary to use careful and systematicmethods when carrying out scientificinvestigations?
As the mathematician Jacob Bronowski stated,“Science is a great manythings, but in the end they all return to this: Science is the acceptanceof what works and the rejection of what does not.”
TheoryWhen a hypothesis has survived extensive testing and when compet-ing hypotheses have been eliminated, a hypothesis may become ascientific theory. A scientific theory is well tested and widelyaccepted by the scientific community and best explains certainobservable facts. For example, the theory of plate tectonics providesthe framework for understanding the origin of continents and oceanbasins, plus the occurrence of mountains, earthquakes, and volcanoes.
Scientific MethodsThe process of gathering facts through observations and formulatingscientific hypotheses and theories is called the scientific method. Thereis no set path that scientists must follow in order to gain scientificknowledge. However, many scientific investigations involve the follow-ing steps: (1) the collection of scientific facts through observation andmeasurement, (2) the development of one or more working hypothe-ses or models to explain these facts, (3) development of observationsand experiments to test the hypotheses, and (4) the acceptance, modi-fication, or rejection of the hypothesis based on extensive testing.
Explanatory Paragraph It took a longtime for the scientific community to acceptthe theory of plate tectonics. Write a para-graph suggesting how the use of properscientific methods helped the theory gainacceptance.
24 Chapter 1
Theory
Students often think that a scientifictheory is an ultimate truth, and thereforecan never be changed. This is not true.A theory is only accepted if a multitudeof tests support the theory. However,if even one scientist finds a situationwhere the theory fails, that theory isagain called into question and must berevised or replaced. For this reason,science is constantly changing. Oneexample is medicines or supplementsthat have been promoted and used foryears suddenly being pulled off theshelves after the discovery of unexpectedand dangerous side effects.Verbal
Scientific MethodsIntegrateLanguage ArtsRepresenting Definitions There aremany definitions for the word model.Have students use a dictionary to writedown as many definitions of the wordas possible. Then have them draw orcut out pictures representing thesedefinitions. Help students determinewhich definition is most appropriate inthis section.Visual, Verbal
ASSESSEvaluateUnderstandingGive students the steps of the scientificmethod in random order, and havethem put the steps in the correct order.
ReteachHave students illustrate each step of thescientific method on the flowchart theycreated earlier. Help students understandthat scientists regularly go back a fewsteps in the method as they attempt toarrive at a theory.Visual
Many scientists repeated the sameobservations and recorded similar results.These observations were made in manyplaces around the world, yet all had thesame basic principles. Advise studentsthat they can find out more about thetheory of plate tectonics in Chapter 9.
L1
L2
3
L2
L2
Section 1.5 (continued)
The experiment can be conducted againusing the same procedure.7. Sample answer: The scientist should recordhis or her observations and any numericalresults that can be recorded. The scientistshould continue carrying out the experimentand reanalyze the hypothesis to see if it canbe adjusted to accommodate the new results.8. To be accepted by the scientific community,all experiments must be able to be conductedrepeatedly with the same results obtained andwith a minimal amount of error. By using sys-tematic methods, this can be done.
Section 1.5 Assessment
1. Test and analyze the hypothesis.2. A hypothesis can become a theory once ithas survived extensive testing and when com-peting hypotheses have been eliminated.3. in a consistent and predictable manner4. They are all tested and analyzed.5. A model can be used at any point in theprocess such as testing a hypothesis orexplaining a theory.6. If an orderly set of steps is followed, theobservations and results are more reliable.
HSES_1eTE_C01.qxd 5/14/04 1:30 PM Page 24

Introduction to Earth Science 25
Studying Earth From SpaceScientific facts are gathered in many ways, such aslaboratory studies, field observations, and fieldmeasurements. Satellite images like the one inFigure 23 are another useful source of data. Suchimages provide perspectives that are difficult to getfrom more traditional sources. The high-tech instru-ments aboard many satellites enable scientists togather information from remote regions where dataare otherwise scarce.
The image in Figure 23 makes use of the AdvancedSpaceborne Thermal Emission and ReflectionRadiometer (ASTER). Because different materialsreflect and give off energy in different ways, ASTERcan provide detailed information about the composi-tion of Earth’s surface. Figure 23 is a three-dimensionalview looking north over Death Valley, California. Thedata have been computer enhanced to exaggeratethe color variations that highlight differences in typesof surface materials.
Figure 23 This satellite shows detailed information about the composition of surface materials in DeathValley, California. It was produced by superimposing nighttime thermal infrared data, acquired on April 7,2000, over topographic data from the U.S. Geological survey. (Image courtesy of NASA)
and metamorphic rocks. The bright red areas aredominated by the mineral quartz, found in sand-stone; the green areas are limestone. In the lowercenter of the image is Badwater, the lowest point inNorth America.
Salt deposits on the floor of Death Valley appear inshades of yellow, green, purple, and pink. Theseindicate the presence of carbonate, sulfate, andchloride minerals. The Panamint Mountains to thewest and the Black Mountains to the east are madeup of sedimentary limestones, sandstones, shales,
Studying EarthFrom SpaceBackground ASTER is an imaginginstrument that obtains detailed maps ofland surface temperature. It flies on asatellite called Terra, which waslaunched in 1999. ASTER is part ofNASA’s Earth Observing System (EOS),which is a series of satellites, a sciencecomponent, and a data system. EOS willhelp scientists develop a deeperunderstanding of Earth as an integratedsystem—the interactions among thebiosphere, hydrosphere, lithosphere,and atmosphere.
Teaching Tips• As students read the feature and look
at Figure 23, have them identify onthe image the various regionsdescribed in the text.
• Explain to students that this imagedoes not show the true colors ofDeath Valley as seen from space.Instead, the colors were inserted byscientists to indicate differences insurface composition. Ask: What doyou think this image would look likein true color? (Since Death Valley is adesert, it would be mostly tan in color.)Based on the information given onwhat the colors indicate, what is thecomposition of the most distantmountains in the image? (mostlylimestone, with some sandstone anda little bit of salt)
• Have students research ASTER andEOS on NASA’s web site and preparea report to the class.
Visual, Logical
L2
Introduction to Earth Science 25
HSES_1eTE_C01.qxd 5/13/04 12:41 PM Page 25