How wealthy are the poor people in Slovenia? - unece.org fileTotal value of real estate owned by...
20
How wealthy are the poor people in Slovenia? Stanka Intihar Statistical office of the Republic of Slovenia [email protected] Expert meeting on measuring poverty and inequality, Budva, Montenegro, 26-27 September 2017
Transcript of How wealthy are the poor people in Slovenia? - unece.org fileTotal value of real estate owned by...

How wealthy are the poor
people in Slovenia?
Stanka Intihar
Statistical office of the Republic of Slovenia
Expert meeting on measuring poverty and inequality,
Budva, Montenegro, 26-27 September 2017

Definitions, concepts (1)
• Microdata from SILC 2016 (income 2015) and Real Estate
Register (REN) 2015 linked through a (personal) statistical
identification number
• Observation unit: household (8,585)
• Unit of analysis: person=hh member (25,637)
• Value of real estate of hh = sum of values of real estate of all hh
members; the same value attributed to all hh members (value of
real estate per hh member or equivalized hh member)
• Relative poverty
• Poverty threshold: 60 % of median equivalised income or/and real
estate value
• OECD modified equivalence scale (1/0.5/0.3)
• Deciles in the tables = for equivalised disposable income

Definitions, concepts (2)
• RESIDENTIAL real estate = house or dwelling a household
owns and lives in (home)
• OTHER real estate = houses, dwellings and other buildings
a household owns and does not live in (empty or rented) +
land (agricultural, forest, land for building…)
• TOTAL real estate = real estate of natural persons (not legal
entities)
• Generalized market value of real estate, calculated at the
Surveying and Mapping Authority of the Republic of
Slovenia (GURS) for taxation purpose (not used yet)

Share of dwellings, persons, income and real estate
value by type of ownership (%), Slovenia,
Housing Census 2015, SILC 2016
More than 90% of population live in their own dwellings (85%) or dwelling of
relatives, friends (8%).
Tenants live in 8% of all occupied dwellings, they own 7% of total income and
less than 1% of total real estate value.
Income poverty: tenants=36.1%, owners: 11.5%
Real estate poverty: tenants=95.4%, owners: 26.8%
Experimental data - not to be distributed or published.
Occupied
dwellings
(census)
Occupants
(census)
Persons in
private hh
(SILC)
Income
(SILC)
Total real
estate value
(SILC)
owner + users-
occupied dwellings 91.8 93.2 90.2 92.6 99.4
rented dwellings 8.2 6.8 9.8 7.4 0.6
Type of ownership -
TOTAL 100.0 100.0 100.0 100.0 100.0

Total value of real estate owned by households in SILC
2016 and Real Estate Register 2015, Slovenia
SILC is coherent with Real Estate Register data. Total real estate value in
SILC represents 95% of total real estate value from Real Estate Register.
Experimental data - not to be distributed or published.
45
31
18
13
76
44
36
22
14
80
0
10
20
30
40
50
60
70
80
90
RESIDENTIAL REALESTATE (103.5%)
OTHER REAL ESTATE(85.5%)
other dwellings orbuildings (83.4%)
land, forest (88.7%) TOTAL REAL ESTATE(95.3%)
billion
SILC 2016 (income 2015) REN 2015

Structure of real estate value owned by households in
SILC 2016 and Real Estate Register 2015, Slovenia
SILC is coherent with Real Estate Register data.
Experimental data - not to be distributed or published.
5955
24 27
17 18
0%
10%
20%
30%
40%
50%
60%
70%
80%
90%
100%
SILC 2016 (income 2015) REN 2015
land, forest
otherdwellings orbuildings
residentialreal estate

Correlation between equivalised disposable income
and equivalised value of real estate,
Slovenia, SILC 2016
correlation coefficient=0.5 (medium high); p < 0.001 (statisctically significant)
DOH1=equivalised disposable income,
NEPR1= equivalised value of real estate
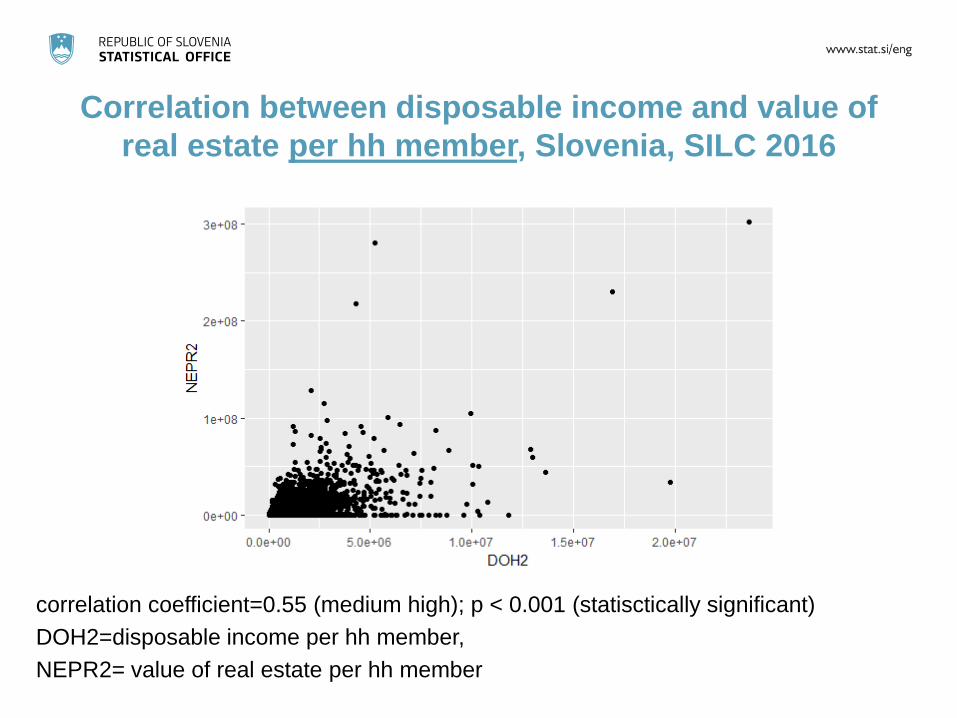
Correlation between disposable income and value of
real estate per hh member, Slovenia, SILC 2016
correlation coefficient=0.55 (medium high); p < 0.001 (statisctically significant)
DOH2=disposable income per hh member,
NEPR2= value of real estate per hh member

Mean value of income and real estate, Slovenia,
SILC 2016
Experimental data - not to be distributed or published.
mean per hh
member (EUR) % of mean income
income 8,732 100
residential real estate 22,515 258
houses-total 19,647 225
dwellings-total 10,149 116
other real estate (buildings and land) 15,363 176
other dwellings or buildings 9,073 104
land, forest 6,290 72
total real estate 37,879 434

Share of poor people and share of total income or total
value of real estate they own, Slovenia, SILC 2016
Large difference between poverty thresholds (EUR):
15,251 3,226 24,539 7,396 23,230 12,037 32,469
Experimental data - not to be distributed or published.
36
44
34
14
32
24
30
3 1 46
9
6 6
0
5
10
15
20
25
30
35
40
45
50
residential realestate
other real estate total real estate disposableincome
income +residential real
estate
income + otherreal estate
income + totalreal estate
%
poverty rate (%) share of income or real estate value - poor people (%)

Share of poor people by deciles of equivalised
disposable income (%), Slovenia, SILC 2016
The majority of real estate poor are in the first 6 income deciles, but
they are also in the highest income deciles.
Experimental data - not to be distributed or published.
eq. income decile real estate disposable income income + real estate
1 17 72 20
2 14 28 16
3 12 0 13
4 11 0 12
5 10 0 10
6 10 0 9
7 8 0 7
8 7 0 5
9 6 0 5
10 3 0 2
poor (%) 100 100 100
number of poor 675.000 280.000 600.000
poverty threshold (EUR) 24.539 7.396 32.469
poverty rate (%) 34 14 30

Share of equivalised income and/or equivalised value
of real estate by deciles of equivalised disposable
income (%), Slovenia, SILC 2016
The share of total value of real estate in the first 3 income deciles is higher
than the share of total disposable income in the same deciles.
Experimental data - not to be distributed or published.
eq. income
decile
residential
real estate
other dwellings
or buildings
land,
forests
total real
estate
disposable
income
income +
total real
estate
1 6 5 9 6 4 6
2 7 8 9 8 6 7
3 9 8 9 8 7 8
4 8 7 9 8 8 8
5 9 7 10 9 9 9
6 9 9 10 9 10 9
7 11 9 10 10 11 10
8 11 10 11 11 12 11
9 12 14 11 12 14 13
10 18 23 13 18 20 19
total 100 100 100 100 100 100
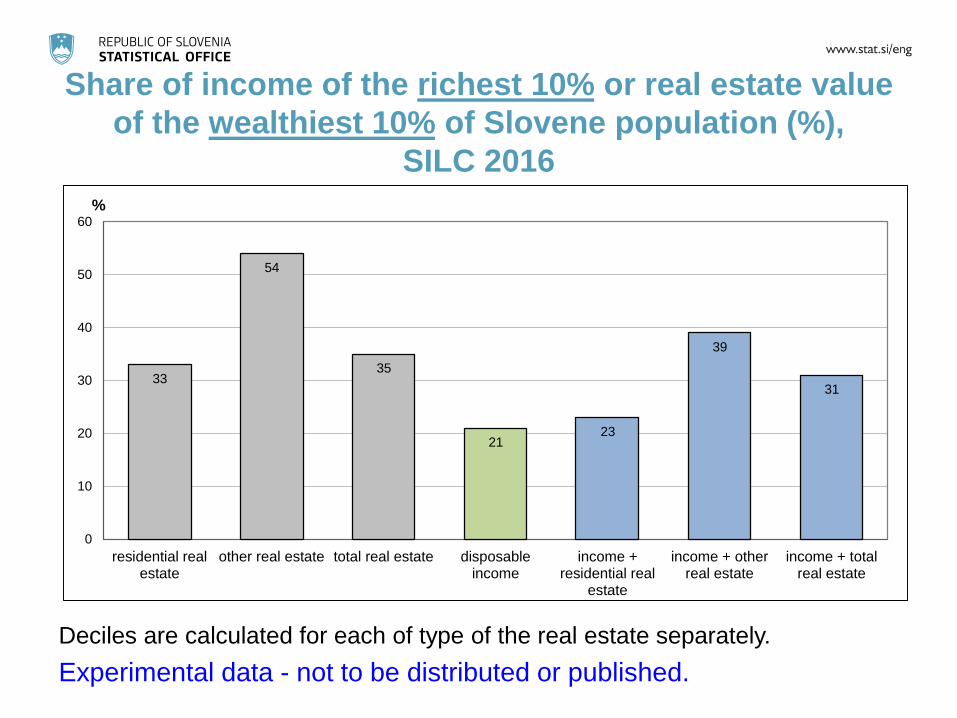
Share of income of the richest 10% or real estate value
of the wealthiest 10% of Slovene population (%),
SILC 2016
Deciles are calculated for each of type of the real estate separately.
Experimental data - not to be distributed or published.
33
54
35
2123
39
31
0
10
20
30
40
50
60
residential realestate
other real estate total real estate disposableincome
income +residential real
estate
income + otherreal estate
income + totalreal estate
%

Gini index for income and/or real estate,
Slovenia, SILC 2016
Gini: 0.24 for income, 0.52 for real estate and 0.44 for the combination of both
Deciles are calculated for each of type of the real estate separately.
Experimental data - not to be distributed or published.
0.53
0.71
0.52
0.24
0.35
0.49
0.44
0.0
0.1
0.2
0.3
0.4
0.5
0.6
0.7
0.8
residential realestate
other real estate total real estate income income +residential real
estate
income + otherreal estate
income + totalreal estate

Poverty rates by age class and income or real estate,
Slovenia, SILC 2016
Real estate poverty is higher than income poverty (the most vulnerable are
people below 50 years of age),
for people 65+ the real estate poverty is lower than income poverty.
Experimental data - not to be distributed or published.
45
49
38
25
20
36
50
55
44
36
30
4443
46
35
23
16
34
13 12 12
15
18
14
0
10
20
30
40
50
60
0-24 25-39 40-49 50-64 65+ total
%residential real estate other real estate total real estate income

Poverty rates by age class and income + real estate,
Slovenia, SILC 2016
Combination of income and real estate gives slightly lower poverty rates (the
lowest for 65+ and 50-64). The most vulnerable to income poverty are people 65+)
Experimental data - not to be distributed or published.
4143
34
2119
32
27 27
2220
21
24
38
41
31
20
15
30
1312 12
15
18
14
0
5
10
15
20
25
30
35
40
45
50
0-24 25-39 40-49 50-64 65+ total
%
income + residential real estate income + other real estate income + total real estate income

Poverty rates by household type and income or real
estate, Slovenia, SILC 2016
Real estate poverty is much higher for households with dependent children (and
also 1 person hh) than households without dependent children.
Experimental data - not to be distributed or published.
43
32
14
23
53
44
3336
55
42
24
30
65
51
34
44
40
27
11
20
51
43
30
3436
15
97
25
118
14
0
10
20
30
40
50
60
70
1 person HH 2 adults<65 2 adults, 1 65+ other HH, nodep. children
single parentHH
2 adults, dep.children
other HH withdep. children
total
%residential real estate other real estate total real estate income

Poverty rates by household type and income + real
estate, Slovenia, SILC 2016
2 adults, of which at least one is 65+ have the lowest income and real estate
poverty of all household types.
Experimental data - not to be distributed or published.
43
29
13
17
52
41
25
32
43
23
1311
51
25
15
24
39
25
10
15
50
38
23
30
36
15
97
25
11
8
14
0
10
20
30
40
50
60
1 person HH 2 adults<65 2 adults, 1 65+ other HH, nodep. children
single parentHH
2 adults, dep.children
other HH withdep. children
total
%income + residential real estate income + other real estate income + total real estate income
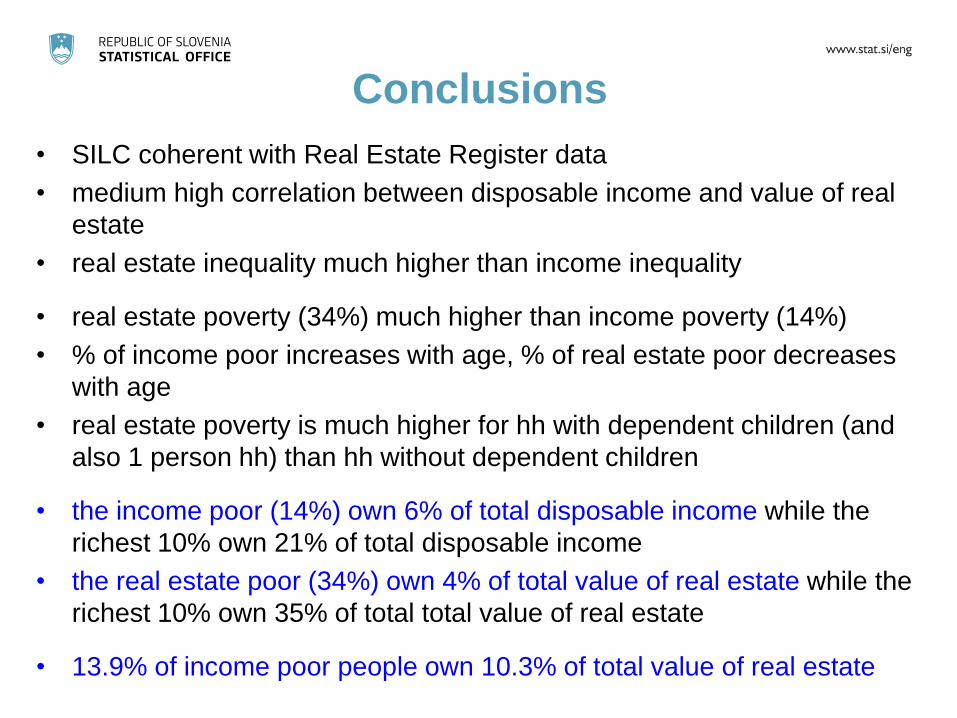
Conclusions
• SILC coherent with Real Estate Register data
• medium high correlation between disposable income and value of real
estate
• real estate inequality much higher than income inequality
• real estate poverty (34%) much higher than income poverty (14%)
• % of income poor increases with age, % of real estate poor decreases
with age
• real estate poverty is much higher for hh with dependent children (and
also 1 person hh) than hh without dependent children
• the income poor (14%) own 6% of total disposable income while the
richest 10% own 21% of total disposable income
• the real estate poor (34%) own 4% of total value of real estate while the
richest 10% own 35% of total total value of real estate
• 13.9% of income poor people own 10.3% of total value of real estate

Future steps• analyze real estate poverty for different population groups, spatial units
• exclude the real estate used by farmers and the self-employed to earn
income from the total value of real estate
• exclude mortgages still to be paid (other housing loans?)
• include other wealth (stocks and bonds, deposits, cars)
• explore the possibility of using the Household Finance and Consumption
Survey (HFCS) for 2014 (income 2013) – received from the Bank of
Slovenia (next in 2017)
• make corrections of income and real estate values for life expectancy and
interest rate
• investigate coherence with national accounts
• participate in joint OECD/Eurostat Expert Group on Micro Statistics on
Household Income, Consumption and Wealth
• analyze income, poverty and wealth of the total population (Income
Database being established within grant Merging Statistics and
Geospatial Iinformation + Real Estate Register)