HOW PROFITABLE IS YOUR HOTEL? - rss.hsyndicate.comrss.hsyndicate.com/file/152004937.pdf · is...
8
HOW PROFITABLE IS YOUR HOTEL? A unique insight into the UK hotel industry
Transcript of HOW PROFITABLE IS YOUR HOTEL? - rss.hsyndicate.comrss.hsyndicate.com/file/152004937.pdf · is...

HOW PROFITABLE IS YOUR HOTEL?
A unique insight into the UK hotel industry
2
HOW PROFITABLE IS YOUR HOTEL?
TRI H
osp
italityH
otStats
Introduction
The UK hotel market is seeing sales growth but profits, when as-sessed as an average, are heading in the reverse direction. Chang-ing booking habits and a pronounced rise in costs has led to a proportion of the hotel market seeing significant profit erosion. The historic ability of RevPAR to be an effective indicator of profits has been shattered.
This article provides a unique analysis of the UK hotel indus-try exploring these key issues. The article is built upon detailed profit information sourced from the HotStats database and pre-sented by TRI Hospitality Consulting.
The growing gap between RevPAR and GOPPAR
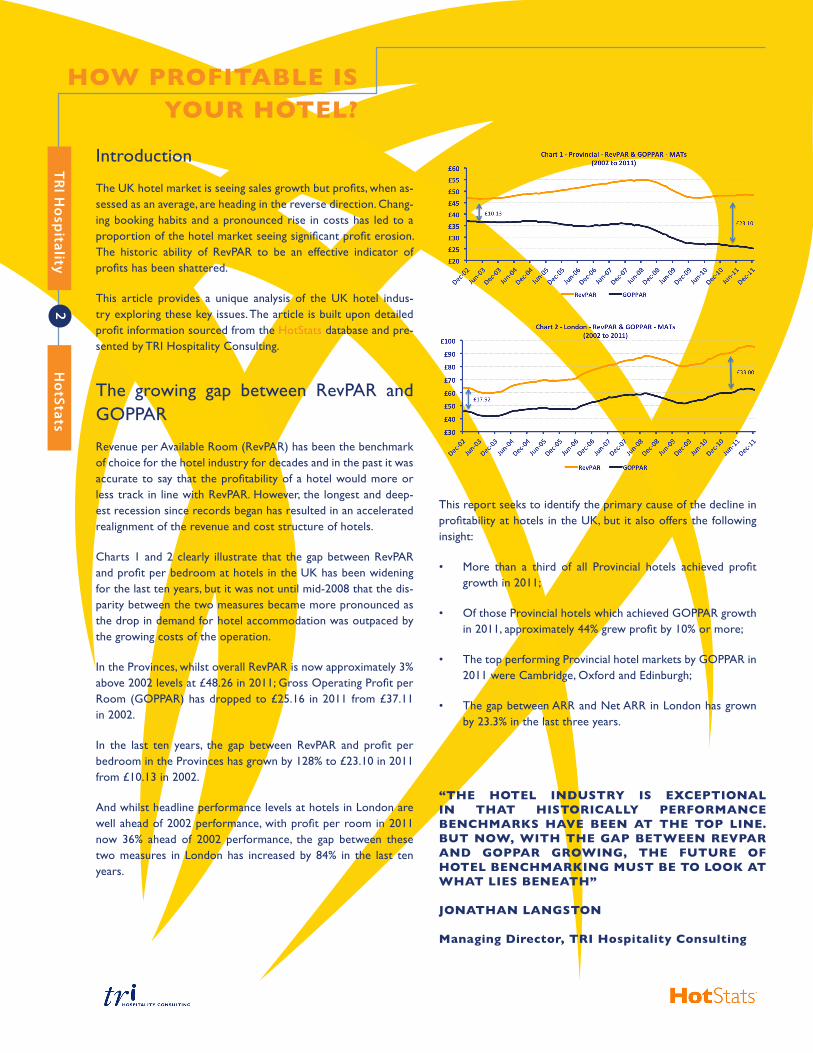
Revenue per Available Room (RevPAR) has been the benchmark of choice for the hotel industry for decades and in the past it was accurate to say that the profitability of a hotel would more or less track in line with RevPAR. However, the longest and deep-est recession since records began has resulted in an accelerated realignment of the revenue and cost structure of hotels.
Charts 1 and 2 clearly illustrate that the gap between RevPAR and profit per bedroom at hotels in the UK has been widening for the last ten years, but it was not until mid-2008 that the dis-parity between the two measures became more pronounced as the drop in demand for hotel accommodation was outpaced by the growing costs of the operation.
In the Provinces, whilst overall RevPAR is now approximately 3% above 2002 levels at £48.26 in 2011; Gross Operating Profit per Room (GOPPAR) has dropped to £25.16 in 2011 from £37.11 in 2002.
In the last ten years, the gap between RevPAR and profit per bedroom in the Provinces has grown by 128% to £23.10 in 2011 from £10.13 in 2002.
And whilst headline performance levels at hotels in London are well ahead of 2002 performance, with profit per room in 2011 now 36% ahead of 2002 performance, the gap between these two measures in London has increased by 84% in the last ten years.
This report seeks to identify the primary cause of the decline in profitability at hotels in the UK, but it also offers the following insight:
• More than a third of all Provincial hotels achieved profit growth in 2011;
• Of those Provincial hotels which achieved GOPPAR growth in 2011, approximately 44% grew profit by 10% or more;
• The top performing Provincial hotel markets by GOPPAR in 2011 were Cambridge, Oxford and Edinburgh;
• The gap between ARR and Net ARR in London has grown by 23.3% in the last three years.
“THE HOTEL INDUSTRY IS EXCEPTIONAL IN THAT HISTORICALLY PERFORMANCE BENCHMARKS HAVE BEEN AT THE TOP LINE. BUT NOW, WITH THE GAP BETWEEN REVPAR AND GOPPAR GROWING, THE FUTURE OF HOTEL BENCHMARKING MUST BE TO LOOK AT WHAT LIES BENEATH”
JONATHAN LANGSTON
Managing Director, TRI Hospitality Consulting

3
HOW PROFITABLE IS YOUR HOTEL?
TRI H
osp
italityH
otStats
The limitations of ARR
Whilst the analysis of achieved average room rate (ARR) pro-vides the market with a top-level statistic against which to com-pare the current performance of a property against historic lev-els and the competition, this figure does not take into account the increasingly high cost of capturing demand.
Net ARR is calculated as the total bedroom revenue for the period less the cost of sales (ie direct expenses including Travel Agents Commissions costs) divided by the total bedrooms oc-cupied during the period.
As illustrated in Chart 3, whilst hotels in the Provinces have suf-fered an 8.4% decline in average room rate in the 36 months to December 2011, to £68.71 from £75.03, during the same period Net ARR has dropped by 10.0% to £64.38 from £71.57.
Due to the rising costs associated with the bedroom operation, and the significant increase in costs associated with third-party, primarily web-based, intermediaries, the gap between ARR and Net ARR in the Provinces has increased by 25.1% to £4.33 from £3.46 per available room in the last three years.
For many hoteliers across the UK, third party websites offer an excellent service, providing a global marketing platform to maxi-mise the exposure of a property during this highly competitive period of trading. They also suit the needs of the consumer as price and property comparison websites enable speedy booking during our increasingly ‘time poor’ lives. However, third party commissions of up to 30% per booking are damaging the profit-ability of the bedroom operation. Table 1 illustrates the growth in cost associated with third party travel agents in locations across the UK.
This trend is not only a feature of Provincial hotel performance as Chart 4 illustrates. Whilst the achieved average room rate in
London and the Provinces has moved in opposite directions over the last three years, the commonality between the capital and the regions is the growing gap between achieved average room rate and Net ARR.
In the 36 months to December 2011 achieved average room rate in London grew by 9.5% to £126.59 from £115.60. How-ever, Net ARR has been hampered by a 23.3% increase in direct costs, to £6.03 from £4.89 per available room, resulting in an in-crease of just 8.9%. On a per room sold basis, the cost associated with Travel Agents Commissions (TAC) for London hoteliers in-creased by 10.6% in 2011, suggesting that not all hoteliers in the capital are riding on the crest of the pre-Olympic wave. As an overall figure, the increase in TAC per room sold in the Provinces was lower than London at 9%.
In other cities, as local press reported Birmingham hotels achiev-ing record room occupancy highs in the second half of 2011, year-on-year TAC per room was up by 10.7%, to approximately 7.3% of rooms revenue, illustrating the reliance of hoteliers in the Midlands city on demand derived from third-party websites.
Not all markets are so reliant on third-party websites. Whilst hoteliers in Norwich successfully recorded a 0.4% increase in achieved average room rate in 2011, TAC dropped by 10% to only £2.87 per room sold or 4.3% of rooms revenue.
Table 1: Travel Agents Commission (TAC)Analysis by Location
LocationTAC Per
Room Sold 2010 (£)
TAC Per Room Sold 2011 (£)
Movement(%)
London 5.64 6.24 +10.6
Provinces 3.90 4.25 +9.0
Birmingham 4.85 5.37 +10.7
Brighton 4.84 5.22 +7.9
Norwich 3.19 2.87 -10.0
Glasgow 4.23 4.58 +8.3
4
HOW PROFITABLE IS YOUR HOTEL?
TRI H
osp
italityH
otStats
Beyond RevPAR - Challenges in F&B
In addition to detailed information regarding the perfor-mance of the bedroom operation, the unique HotStats data-base provides in-depth data regarding the revenue, costs and utilisation of hotel restaurants, bars, meeting rooms, leisure facilities (including golf) and the minor operating depart-ments (MOD).
For the purpose of this report we are going to focus on the current profile of the food and beverage (F&B) department.
The F&B department is not nearly as profitable as the rooms department due to the labour-intensive operation and a cost of sales of up to 30% of total revenue. In addition, the profitability of the F&B department is often dictated by factors which are beyond the control of hoteliers.
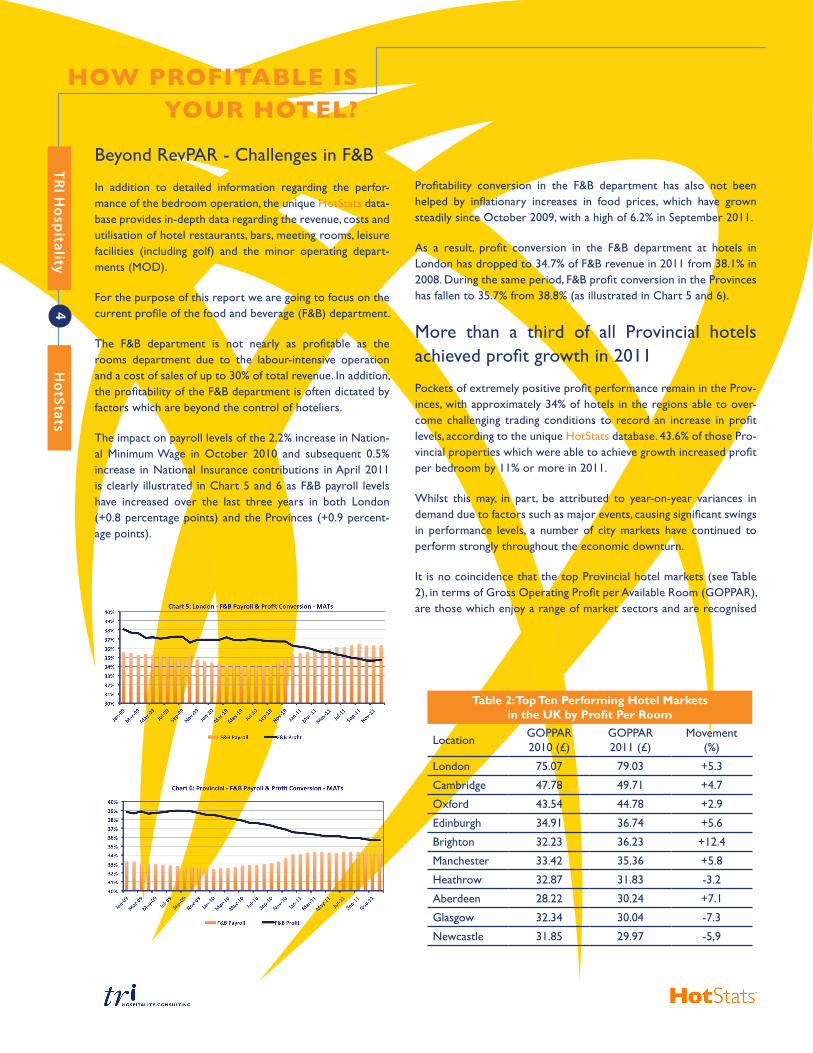
The impact on payroll levels of the 2.2% increase in Nation-al Minimum Wage in October 2010 and subsequent 0.5% increase in National Insurance contributions in April 2011 is clearly illustrated in Chart 5 and 6 as F&B payroll levels have increased over the last three years in both London (+0.8 percentage points) and the Provinces (+0.9 percent-age points).
Profitability conversion in the F&B department has also not been helped by inflationary increases in food prices, which have grown steadily since October 2009, with a high of 6.2% in September 2011.
As a result, profit conversion in the F&B department at hotels in London has dropped to 34.7% of F&B revenue in 2011 from 38.1% in 2008. During the same period, F&B profit conversion in the Provinces has fallen to 35.7% from 38.8% (as illustrated in Chart 5 and 6).
More than a third of all Provincial hotels achieved profit growth in 2011
Pockets of extremely positive profit performance remain in the Prov-inces, with approximately 34% of hotels in the regions able to over-come challenging trading conditions to record an increase in profit levels, according to the unique HotStats database. 43.6% of those Pro-vincial properties which were able to achieve growth increased profit per bedroom by 11% or more in 2011.
Whilst this may, in part, be attributed to year-on-year variances in demand due to factors such as major events, causing significant swings in performance levels, a number of city markets have continued to perform strongly throughout the economic downturn.
It is no coincidence that the top Provincial hotel markets (see Table 2), in terms of Gross Operating Profit per Available Room (GOPPAR), are those which enjoy a range of market sectors and are recognised
Table 2: Top Ten Performing Hotel Marketsin the UK by Profit Per Room
Location GOPPAR 2010 (£)
GOPPAR 2011 (£)
Movement(%)
London 75.07 79.03 +5.3
Cambridge 47.78 49.71 +4.7
Oxford 43.54 44.78 +2.9
Edinburgh 34.91 36.74 +5.6
Brighton 32.23 36.23 +12.4
Manchester 33.42 35.36 +5.8
Heathrow 32.87 31.83 -3.2
Aberdeen 28.22 30.24 +7.1
Glasgow 32.34 30.04 -7.3
Newcastle 31.85 29.97 -5,9
5
HOW PROFITABLE IS YOUR HOTEL?
TRI H
osp
italityH
otStats
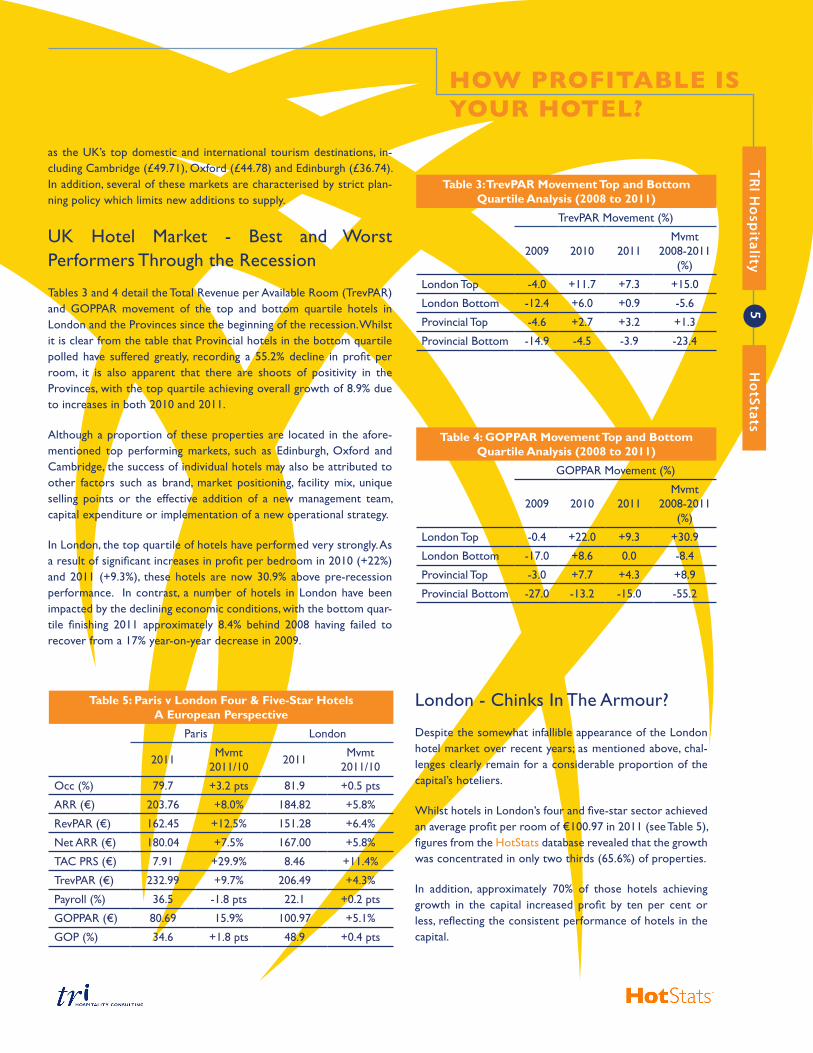
as the UK’s top domestic and international tourism destinations, in-cluding Cambridge (£49.71), Oxford (£44.78) and Edinburgh (£36.74). In addition, several of these markets are characterised by strict plan-ning policy which limits new additions to supply.
UK Hotel Market - Best and Worst Performers Through the Recession
Tables 3 and 4 detail the Total Revenue per Available Room (TrevPAR) and GOPPAR movement of the top and bottom quartile hotels in London and the Provinces since the beginning of the recession. Whilst it is clear from the table that Provincial hotels in the bottom quartile polled have suffered greatly, recording a 55.2% decline in profit per room, it is also apparent that there are shoots of positivity in the Provinces, with the top quartile achieving overall growth of 8.9% due to increases in both 2010 and 2011.
Although a proportion of these properties are located in the afore-mentioned top performing markets, such as Edinburgh, Oxford and Cambridge, the success of individual hotels may also be attributed to other factors such as brand, market positioning, facility mix, unique selling points or the effective addition of a new management team, capital expenditure or implementation of a new operational strategy.
In London, the top quartile of hotels have performed very strongly. As a result of significant increases in profit per bedroom in 2010 (+22%) and 2011 (+9.3%), these hotels are now 30.9% above pre-recession performance. In contrast, a number of hotels in London have been impacted by the declining economic conditions, with the bottom quar-tile finishing 2011 approximately 8.4% behind 2008 having failed to recover from a 17% year-on-year decrease in 2009.
Table 5: Paris v London Four & Five-Star HotelsA European Perspective
Paris London
2011 Mvmt2011/10 2011 Mvmt
2011/10
Occ (%) 79.7 +3.2 pts 81.9 +0.5 pts
ARR (€) 203.76 +8.0% 184.82 +5.8%
RevPAR (€) 162.45 +12.5% 151.28 +6.4%
Net ARR (€) 180.04 +7.5% 167.00 +5.8%
TAC PRS (€) 7.91 +29.9% 8.46 +11.4%
TrevPAR (€) 232.99 +9.7% 206.49 +4.3%
Payroll (%) 36.5 -1.8 pts 22.1 +0.2 pts
GOPPAR (€) 80.69 15.9% 100.97 +5.1%
GOP (%) 34.6 +1.8 pts 48.9 +0.4 pts
London - Chinks In The Armour?
Despite the somewhat infallible appearance of the London hotel market over recent years; as mentioned above, chal-lenges clearly remain for a considerable proportion of the capital’s hoteliers.
Whilst hotels in London’s four and five-star sector achieved an average profit per room of €100.97 in 2011 (see Table 5), figures from the HotStats database revealed that the growth was concentrated in only two thirds (65.6%) of properties.
In addition, approximately 70% of those hotels achieving growth in the capital increased profit by ten per cent or less, reflecting the consistent performance of hotels in the capital.
Table 3: TrevPAR Movement Top and BottomQuartile Analysis (2008 to 2011)
TrevPAR Movement (%)
2009 2010 2011Mvmt
2008-2011(%)
London Top -4.0 +11.7 +7.3 +15.0
London Bottom -12.4 +6.0 +0.9 -5.6
Provincial Top -4.6 +2.7 +3.2 +1.3
Provincial Bottom -14.9 -4.5 -3.9 -23.4
Table 4: GOPPAR Movement Top and BottomQuartile Analysis (2008 to 2011)
GOPPAR Movement (%)
2009 2010 2011Mvmt
2008-2011(%)
London Top -0.4 +22.0 +9.3 +30.9
London Bottom -17.0 +8.6 0.0 -8.4
Provincial Top -3.0 +7.7 +4.3 +8.9
Provincial Bottom -27.0 -13.2 -15.0 -55.2

6
HOW PROFITABLE IS YOUR HOTEL?
TRI H
osp
italityH
otStats
For those properties which suffered a decline, this is more likely to be due to the product quality and management of these prop-erties and additions to supply rather than the location, particu-larly as the volume of visitors to attractions in London was at a record high in 2011.
However, location has also played a role. This is exemplified by the 4.5% GOPPAR increase at hotels in London’s West End in 2011, compared to the 3.7% year-on-year decline in profit per room suffered by London Heathrow hoteliers during the same period.
That said, London remains the principal market in the UK and Table 4 illustrates the strength of headline performance levels at hotels in the capital against another of Europe’s consistently strong markets, Paris.
Whilst TrevPAR at four and five-star hotels in Paris in 2011 was approximately 13% above London, the profit conversion of hotels in the French capital is more than 15 percentage points lower than properties in the UK capital. This is primarily due to payroll levels in London being approximately 14 percentage points below hotels in Paris (due to French employment law) and considerable recent increases in Undistributed Operating Expenses in the French capital, including marketing (+10.8%) and admin & general (+9.7%) per available room.
It is noteworthy that Parisian hoteliers are also succumbing to the benefits afforded by third-party website bookers, with TACs on a per bedroom sold basis increasing by approximately 30% in 2011.
A Fundamental Shift in Undistributed Op-erating Expenses (UOEs)
As detailed in Chart 1 and 2 of this report, the gap between RevPAR and GOPPAR at hotels across the UK has grown consis-tently over the last ten years.
Whilst the pace of this widening has undoubtedly been quick-ened by the current economic downturn, the unique HotStats database reveals that as a result of a fundamental shift in UOEs, hotels in the UK may never be as profitable as they once were.
The impact on UOEs has been the greatest from the cost of utilities, which in the Provinces have increased by 2.1 percent-age points to 4.8% of total revenue in 2011 from 2.7% of total revenue in 2002 (see Chart 8).
Whilst utility costs as a proportion of total revenue in London have only increased by 0.7 percentage points, to 2.7% of total
revenue in 2011 from 2% (see Chart 7), this increase comes de-spite the significant growth in revenue during this period. Utility costs at hotels in London have come down from a high of 3.4% of total revenue in Summer 2009, once again reflecting the strong growth in revenue during this recent period.
Although the price of water has remained static in recent years, there have been significant increases in the cost of electricity (+23.6% from 2007 to 2011) and gas (+39.6% from 2007 to 2011) since the beginning of the recession, applying further pres-sure on cash strapped hoteliers (source: Department of Energy & Climate Change).
7
HOW PROFITABLE IS YOUR HOTEL?
TRI H
osp
italityH
otStats
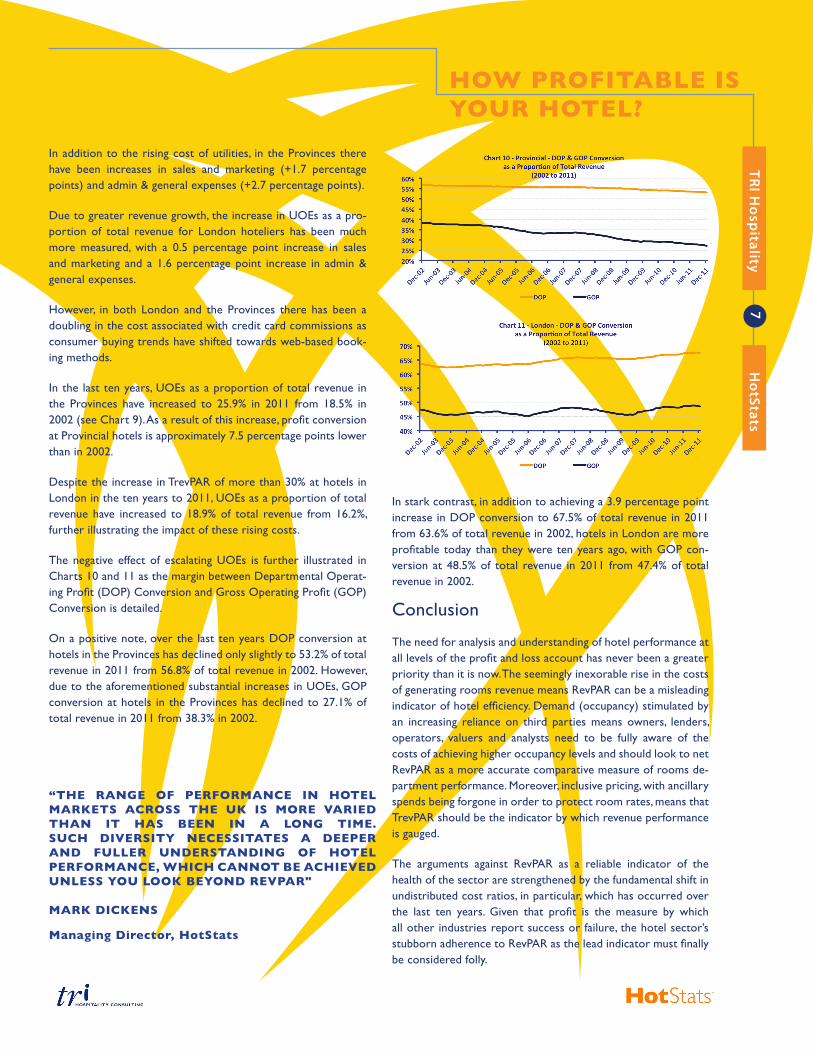
In addition to the rising cost of utilities, in the Provinces there have been increases in sales and marketing (+1.7 percentage points) and admin & general expenses (+2.7 percentage points).
Due to greater revenue growth, the increase in UOEs as a pro-portion of total revenue for London hoteliers has been much more measured, with a 0.5 percentage point increase in sales and marketing and a 1.6 percentage point increase in admin & general expenses.
However, in both London and the Provinces there has been a doubling in the cost associated with credit card commissions as consumer buying trends have shifted towards web-based book-ing methods.
In the last ten years, UOEs as a proportion of total revenue in the Provinces have increased to 25.9% in 2011 from 18.5% in 2002 (see Chart 9). As a result of this increase, profit conversion at Provincial hotels is approximately 7.5 percentage points lower than in 2002.
Despite the increase in TrevPAR of more than 30% at hotels in London in the ten years to 2011, UOEs as a proportion of total revenue have increased to 18.9% of total revenue from 16.2%, further illustrating the impact of these rising costs.
The negative effect of escalating UOEs is further illustrated in Charts 10 and 11 as the margin between Departmental Operat-ing Profit (DOP) Conversion and Gross Operating Profit (GOP) Conversion is detailed.
On a positive note, over the last ten years DOP conversion at hotels in the Provinces has declined only slightly to 53.2% of total revenue in 2011 from 56.8% of total revenue in 2002. However, due to the aforementioned substantial increases in UOEs, GOP conversion at hotels in the Provinces has declined to 27.1% of total revenue in 2011 from 38.3% in 2002.
“THE RANGE OF PERFORMANCE IN HOTEL MARKETS ACROSS THE UK IS MORE VARIED THAN IT HAS BEEN IN A LONG TIME. SUCH DIVERSITY NECESSITATES A DEEPER AND FULLER UNDERSTANDING OF HOTEL PERFORMANCE, WHICH CANNOT BE ACHIEVED UNLESS YOU LOOK BEYOND REVPAR"
MARK DICKENS
Managing Director, HotStats
In stark contrast, in addition to achieving a 3.9 percentage point increase in DOP conversion to 67.5% of total revenue in 2011 from 63.6% of total revenue in 2002, hotels in London are more profitable today than they were ten years ago, with GOP con-version at 48.5% of total revenue in 2011 from 47.4% of total revenue in 2002.
Conclusion
The need for analysis and understanding of hotel performance at all levels of the profit and loss account has never been a greater priority than it is now. The seemingly inexorable rise in the costs of generating rooms revenue means RevPAR can be a misleading indicator of hotel efficiency. Demand (occupancy) stimulated by an increasing reliance on third parties means owners, lenders, operators, valuers and analysts need to be fully aware of the costs of achieving higher occupancy levels and should look to net RevPAR as a more accurate comparative measure of rooms de-partment performance. Moreover, inclusive pricing, with ancillary spends being forgone in order to protect room rates, means that TrevPAR should be the indicator by which revenue performance is gauged.
The arguments against RevPAR as a reliable indicator of the health of the sector are strengthened by the fundamental shift in undistributed cost ratios, in particular, which has occurred over the last ten years. Given that profit is the measure by which all other industries report success or failure, the hotel sector’s stubborn adherence to RevPAR as the lead indicator must finally be considered folly.
8
GLOSSARY
TRI H
osp
italityH
otStats
Notes
The hotels profiled in this report are drawn from the HotStats database and reflect the portfolios and distribution of the hotel chains that we survey and which operate primarily in the three and four-star sectors.
The data samples are reviewed and rebased each year to reflect the changes in the HotStats survey base. Figures in this report are not adjusted for utilisation.
TRI Hospitality Consulting provides a wide range of services to clients in the hotel sector. It has offices in London, Dubai and Bar-celona. For an inside view of a local or regional market place in the hotel sector, bespoke HotStats reports are available. Terms and condition apply. To view a sample report visit www.trihc.com, select Market Knowledge and follow the path to Market Reports.
For more information contact:
TRI Hospitality Consulting
Jonathan Langston, Managing Director
+44 (0)20 7892 2201
Ben Livingstone, Managing Consultant
+44 (0)20 7892 2205
HotStats
Mark Dickens, Managing Director
+44 (0)20 7892 2207
Tony Oliveira, Business Development Manager
+44 (0)20 7486 2234
©TRI Hospitality Consulting 2012 © HotStats 2012 Unless otherwise attributed, all material in this press release is the copyright of TRI Hospitality Consulting and HotStats.
ARR - Average Room Rate Defined as the average room rate charged per paid room occupied and is calculated by dividing total rooms revenues by the number of rooms sold.
Cost of Sales Expenses directly related to the sale of goods or services such as raw materials but excluding indirect expenses.
Direct ExpensesDirect expenses relates to direct variable costs incurred in the operation of each department and varies from property to property. Examples include satellite television subscription, laundry and dry cleaning, guest and cleaning supplies costs.
DOPPAR - Departmental Operating Profit Per Available Room
Total departmental revenue less cost of sales, payroll costs and direct operating ex-penses divided by the total available rooms during the period.
GOPPAR - Gross Operating Profit Per Available Room
Defined as total revenue less all departmental and undistributed operating expenses, also referred to as IBFC (Income before Fixed Costs) divided by the total available rooms during the period.
HotStatsHotStats is the proprietary database from which TRI Hospitality Consulting derives its statistical information comprising over 1,400 hotels throughout Europe.
MAT - Moving Annual Total Defined as the average value of the 12 months up until the month examined.
MOD - Minor Operated Departments Minor Operated Departments include equipment rental, telephone and business centre revenues.
NetARR - Net Average Room RateCalculated as the total bedroom revenue for the period less the cost of sales (ie direct expenses including Travel Agents Commissions costs) divided by the total bedrooms occupied during the period.
RevPAR - Revenue Per Available Room The total bedroom revenue for the period divided by the total available rooms during the period.
Room OccupancyCalculated by dividing the number of roomnights sold during a period by the total num-ber of rooms available in the same period.
Roomnights Describes the number of rooms that are occupied in a hotel, regardless of the number of people staying in the room.
UOE - Undistributed Operating Expenses This classification is used for administrative and general expenses, marketing expenses, energy costs, and property operation and maintenance expenses.