How GMs, Boards and CFOs Utilize the KRTA CDPAA March 2015 Meeting Ty Harrell, CFC RVP for MS and TN...
15
How GMs, Boards and CFOs Utilize the KRTA CDPAA March 2015 Meeting Ty Harrell, CFC RVP for MS and TN 3/19/15
-
Upload
lindsay-allison -
Category
Documents
-
view
215 -
download
0
Transcript of How GMs, Boards and CFOs Utilize the KRTA CDPAA March 2015 Meeting Ty Harrell, CFC RVP for MS and TN...
How GMs, Boards and CFOs Utilize the KRTA
CDPAA March 2015 Meeting
Ty Harrell, CFC RVP for MS and TN
3/19/15

Ty Harrell - Introduction Born and Raised in Canton, MS
Wife of 17 years – Stacy
4 year old son – Houston
Ole Miss Rebel
Worked at the MS Statewide for 9 years– Plan Administrator of the Health Insurance Plan– Controller– Facilitator of MS Coop’s Accounting/HR & IT
Supervisor Training
2

NCAA
3

KRTA
4

KRTA – Key Ratio Trend Analysis
One of the most utilized and valued CFC products / services
145 ratios whose results are computed using Coop Form 7 reported numbers
Tracks 5 years of Coop history for each ratio reported
Shows medians and coop ranking for each peer group for each ratio
5

KRTA – Ratio Categories
1) Base
2) Financial
3) Revenue and Margins
4) Sales
5) Controllable Expenses
6) Fixed Expenses
7) Total Expenses
8) Employees
9) Growth
10)Plant
6

KRTA Ratio Categories
There are ratios that will speak to each department of the coop.
My job here today is to relay what I think are the “Most Valuable” ratios for the two entities that have to incorporate “all” departments:
–General Manager / CEO–Board of Directors
7

GM’s Top KRTA Concerns
Financial Strength Indicators – are these improving or declining and why? (Tier, MDSC, Equity as a % of Assets).
Cash – do ratios reflect true cash position of the coop and why or why not? (Current Ratio)
Load Mix – does increase/decrease bring up any concerns or needs for future consideration (Residential, Sm & Lg Commercial per total KWH sold)
Board – what story about the coop’s overall KRTA position stands out? How to relay that story effectively to the Board.
8

“Most Valuable” KRTA Ratios in each group for GM’s
Base – Total KWH Sold (2)
Financial – Equity as a % of Assets (16)
Revenue and Margins – Operating Margins per KWH Sold (47)
Sales – Residential, Sm & Lg KWH sold per Total KWH sold (69,72,73)
Controllable Expenses – Total Controllable Expenses per KWH Sold (86)
9

“Most Valuable” KRTA Ratios in each group for GM’s
Fixed Expenses - (3) – Power Cost per KWH Sold (88), Power Cost per KWH Purchased (89) & Power Cost as a % of Revenue (90)
Total Expenses – Total Cost of Service (minus power costs) per Total KWH Sold (105)
Employees – Overtime Hours/Total Hours (111)
Growth – Annual Growth in Total KWH Sold (114)
Plant – Line Loss (139)
10
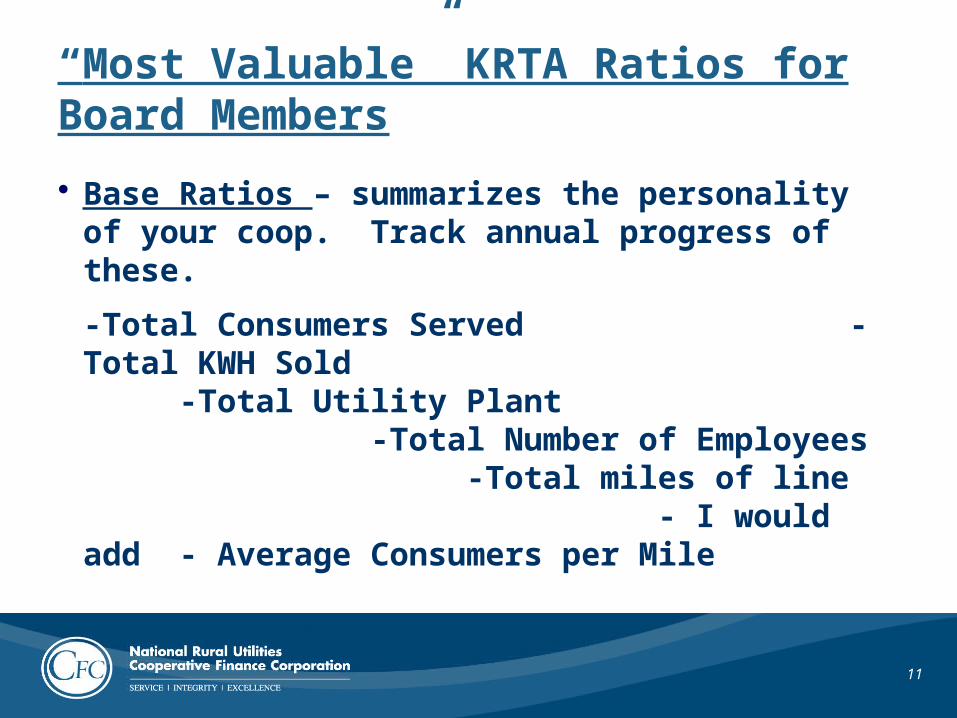
“Most Valuable” KRTA Ratios for Board Members
Base Ratios – summarizes the personality of your coop. Track annual progress of these.
-Total Consumers Served -Total KWH Sold
-Total Utility Plant -Total Number of Employees
-Total miles of line- I would add -
Average Consumers per Mile
11

“Most Valuable” KRTA Ratios for Board Members
Financial Ratios – Do an annual review of the most valuable ratios; Also emphasize the Financial Ratios that most impact your coop
-Tier -MDSC -Equity as a % of Assets
-Blended Interest Rate -Current Ratio-Rate of Return on Total
Capitalization
12

“Most Valuable” KRTA Ratios for Board Members
All Other Ratios – Your Individual Coop’s Personality will dictate what other ratios are valuable to ensure your Board has the Pertinent Information to make Informed Decisions.
13

Trends in KRTA Ratios
Total KWH Sold
Equity as a % of Assets
Blended Interest Rates
Average Residential Usage KWH per Month
14

15


![Tramites rvp 02_registro[1]](https://static.fdocuments.us/doc/165x107/58ef6a4a1a28ab80278b4617/tramites-rvp-02registro1.jpg)