How Essential Biodiversity Variables and remote sensing...
17
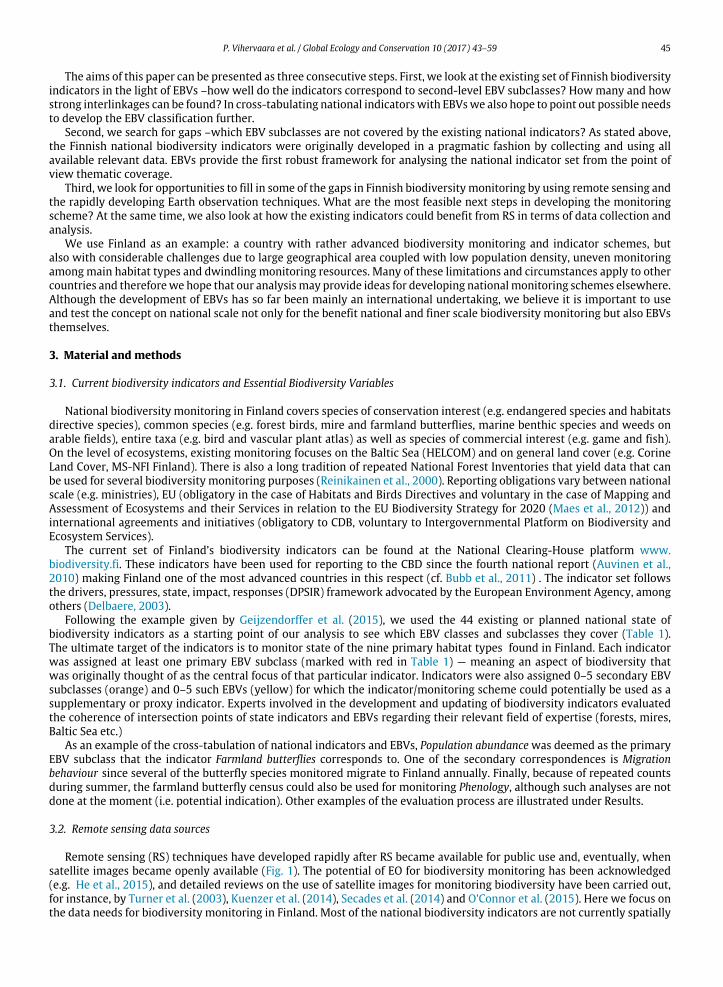
Global Ecology and Conservation 10 (2017) 43–59 Contents lists available at ScienceDirect Global Ecology and Conservation journal homepage: www.elsevier.com/locate/gecco Original research article How Essential Biodiversity Variables and remote sensing can help national biodiversity monitoring Petteri Vihervaara *, Ari-Pekka Auvinen, Laura Mononen, Markus Törmä, Petri Ahlroth, Saku Anttila, Kristin Böttcher, Martin Forsius, Jani Heino, Janne Heliölä, Meri Koskelainen, Mikko Kuussaari, Kristian Meissner, Olli Ojala, Seppo Tuominen, Markku Viitasalo, Raimo Virkkala Finnish Environment Institute, Mechelininkatu 34a, P.O.Box 140, FI-00251 Helsinki, Finland highlights • National biodiversity state indicators correspondence with EBVs was assessed. • EBV approach revealed gaps in the current biodiversity monitoring scheme. • Monitoring could be improved by using remote sensing applications and EBV approach. • Four EBVs could benefit substantially from the use of remotely sensed data. • Three new EBV-candidates were suggested to describe ecosystem function more comprehensively. article info Article history: Received 18 November 2016 Received in revised form 23 January 2017 Accepted 23 January 2017 Keywords: Essential Biodiversity Variables (EBVs) Earth Observation In situ Indicators Ecosystem services Aichi targets abstract Essential Biodiversity Variables (EBVs) have been suggested to harmonize biodiversity monitoring worldwide. Their aim is to provide a small but comprehensive set of monitoring variables that would give a balanced picture of the development of biodiversity and the reaching of international and national biodiversity targets. Globally, GEO BON (Group on Earth Observations Biodiversity Observation Network) has suggested 22 candidate EBVs to be monitored. In this article we regard EBVs as a conceptual tool that may help in making national scale biodiversity monitoring more robust by pointing out where to focus further development resources. We look at one country –Finland –with a relatively advanced bio- diversity monitoring scheme and study how well Finland’s current biodiversity state indi- cators correspond with EBVs. In particular, we look at how national biodiversity monitoring could be improved by using available remote sensing (RS) applications. Rapidly emerging new technologies from drones to airborne laser scanning and new satellite sensors pro- viding imagery with very high resolution (VHR) open a whole new world of opportunities for monitoring the state of biodiversity and ecosystems at low cost. In Finland, several RS applications already exist that could be expanded into national indicators. These include the monitoring of shore habitats and water quality parameters, among others. We hope that our analysis and examples help other countries with similar challenges. Along with RS opportunities, our analysis revealed also some needs to develop the EBV framework itself. © 2017 The Authors. Published by Elsevier B.V. This is an open access article under the CC BY-NC-ND license (http://creativecommons.org/licenses/by-nc-nd/4.0/). * Corresponding author. E-mail address: [email protected] (P. Vihervaara). http://dx.doi.org/10.1016/j.gecco.2017.01.007 2351-9894/© 2017 The Authors. Published by Elsevier B.V. This is an open access article under the CC BY-NC-ND license (http://creativecommons.org/ licenses/by-nc-nd/4.0/).
Transcript of How Essential Biodiversity Variables and remote sensing...
Global Ecology and Conservation 10 (2017) 43–59
Contents lists available at ScienceDirect
Global Ecology and Conservation
journal homepage: www.elsevier.com/locate/gecco
Original research article
How Essential Biodiversity Variables and remote sensing canhelp national biodiversity monitoringPetteri Vihervaara *, Ari-Pekka Auvinen, Laura Mononen, Markus Törmä,Petri Ahlroth, Saku Anttila, Kristin Böttcher, Martin Forsius, Jani Heino,Janne Heliölä, Meri Koskelainen, Mikko Kuussaari, Kristian Meissner, Olli Ojala,Seppo Tuominen, Markku Viitasalo, Raimo VirkkalaFinnish Environment Institute, Mechelininkatu 34a, P.O.Box 140, FI-00251 Helsinki, Finland
h i g h l i g h t s
• National biodiversity state indicators correspondence with EBVs was assessed.• EBV approach revealed gaps in the current biodiversity monitoring scheme.• Monitoring could be improved by using remote sensing applications and EBV approach.• Four EBVs could benefit substantially from the use of remotely sensed data.• Three new EBV-candidates were suggested to describe ecosystem function more comprehensively.
a r t i c l e i n f o
Article history:Received 18 November 2016Received in revised form 23 January 2017Accepted 23 January 2017
Keywords:Essential Biodiversity Variables (EBVs)Earth ObservationIn situIndicatorsEcosystem servicesAichi targets
a b s t r a c t
Essential Biodiversity Variables (EBVs) have been suggested to harmonize biodiversitymonitoringworldwide. Their aim is to provide a small but comprehensive set ofmonitoringvariables that would give a balanced picture of the development of biodiversity and thereaching of international and national biodiversity targets. Globally, GEO BON (Group onEarth Observations Biodiversity Observation Network) has suggested 22 candidate EBVs tobe monitored. In this article we regard EBVs as a conceptual tool that may help in makingnational scale biodiversity monitoring more robust by pointing out where to focus furtherdevelopment resources. We look at one country –Finland –with a relatively advanced bio-diversity monitoring scheme and study how well Finland’s current biodiversity state indi-cators correspondwith EBVs. In particular,we look at hownational biodiversitymonitoringcould be improved by using available remote sensing (RS) applications. Rapidly emergingnew technologies from drones to airborne laser scanning and new satellite sensors pro-viding imagery with very high resolution (VHR) open a whole new world of opportunitiesfor monitoring the state of biodiversity and ecosystems at low cost. In Finland, several RSapplications already exist that could be expanded into national indicators. These includethe monitoring of shore habitats and water quality parameters, among others. We hopethat our analysis and examples help other countries with similar challenges. Along with RSopportunities, our analysis revealed also some needs to develop the EBV framework itself.© 2017 The Authors. Published by Elsevier B.V. This is an open access article under the CC
BY-NC-ND license (http://creativecommons.org/licenses/by-nc-nd/4.0/).
* Corresponding author.E-mail address: [email protected] (P. Vihervaara).
http://dx.doi.org/10.1016/j.gecco.2017.01.0072351-9894/© 2017 The Authors. Published by Elsevier B.V. This is an open access article under the CC BY-NC-ND license (http://creativecommons.org/licenses/by-nc-nd/4.0/).

44 P. Vihervaara et al. / Global Ecology and Conservation 10 (2017) 43–59
1. Introduction
In addition to climate change, biodiversity loss is recognized to pose one of the most serious threats to human well-being (GBO-4, 2014; MA, 2005; Rockström et al., 2013). Up to date biodiversity monitoring is crucial because of: (1) social–ecological systems are ultimately the result of and dependent upon biodiversity, ecosystem functioning, and biosphereprocesses (i.e. socio-economic, utilitarian reasoning); (2) high-quality biodiversity data is an essential building block ofmany disciplines and environmental models that attempt to explain the world per se (curiosity, scientific reasoning) and;(3) biodiversity is included in environmental policies atmany levels—people in societies have decided to protect biodiversityand report on this progress (policy demand for monitoring and reporting, institutional reasoning). Besides these human-focused reasons of explaining why biodiversity matters, the fundamental rationale is that biodiversity underpins ecosystemfunctioning (Hooper et al., 2012).
The launching of the concept of Essential Biodiversity Variables (EBVs) has stimulated progress to unify and harmonizebiodiversity monitoring globally (CBD Subsidiary Body on Implementation, 2016; GEO BON, 2015a, b; Pereira et al., 2013;Pettorelli et al., 2016) and revitalized aspirations of constructing an encompassing global biodiversity indexwith an analogyfrom the stockmarkets (Brummitt et al., in press; cf. Balmford et al., 2005). The aim of EBVs is to findmeasurable parametersfor all relevant dimensions of biodiversity, to attain consensus on what to monitor, and, subsequently, to decide where tofocus the limited monitoring resources. The suggested top-level classes of EBVs are Genetic composition, Species populations,Species traits, Community composition, Ecosystem structure and Ecosystem function (UNEP/CBD/SBSTTA/17/INF/7, 2013; Pereiraet al., 2013). Although the focus of EBV development has so far been on global and supranational monitoring, the approachcan also be applied to a national level and even lower geographical or administrative scales. Since biodiversity is primarilya phenomenon of local eco-evolutionary processes, it can best be recognized and managed on a national or regional level.Looking at EBVs from a national monitoring perspective –having to think in practice which monitoring data sources andremote sensing techniques could be used to provide the information needed –also serves to make the EBVs more concrete.
The development of national, continental scale and global biodiversity indicators has received increasing interest afterthe turn of the Millennium. Individual countries started from different outsets. Countries like The Netherlands (Wondergemand Klein, 2010) and Finland (Auvinen and Toivonen, 2006) began by collecting data from all relevant monitoring schemesand building a comprehensive set of indicators based on them. Other countries linked biodiversity indicators from thebeginning with political goals (e.g. Sweden’s Environmental Objectives; Ministry of the Environment Sweden 2013). Incontrast, Switzerland developed a whole new purpose-build monitoring scheme for biodiversity (Hinterman et al., 2002).At international level, one of the first ambitious attempts to make a multi-country set of biodiversity indicators was theStreamlining European Biodiversity Indicators 2010 (SEBI2010) project coordinated by the European Environment Agency(Biała, et al., 2012). The SEBI2010 project was also important for developing global biodiversity indicators for the Conventionon Biological Diversity (CBD). After the launching of the Aichi Biodiversity Targets in 2010, the Biodiversity IndicatorPartnership (BIP) has developed a global set of indicators which focuses on monitoring the 2020 Aichi targets in particularwww.bipindicators.net/globalindicators; (CBD, 2014).
It is important to note the historical background against which EBVs have been introduced. As Geijzendorffer et al.(2015) remark, EBVs are a theory-driven and rather academic approach to biodiversity monitoring. On the contrary, much ofprevious indicator work has been practically oriented and data-driven. The previous work aims to provide at least some kindof answer to the question of reaching the biodiversity targets that have been set. In the case of Finland, all useable, relevant,and geographically comprehensive monitoring data were amassed and a collection of indicators was created on that basis.Steps are now taken both nationally and internationally to link indicatorsmore closely to targets as seen by the Aichi TargetsPassport created by the BIP (above). Perhaps time is now ripe to also look at our monitoring and indicator schemes from thetheory-driven EBV perspective in order to find existing gaps and biases.
Technical development of remote sensing applications is another important reason why the establishment of compre-hensive biodiversity monitoring schemes, covering relevant aspects of EBVs, is achievable today (Pettorelli et al., 2016).Growing amounts of remote sensing data are freely available. In situ data are also increasingly stored in GIS platforms andnew observations accumulate all the time (Vihervaara et al., 2012, 2013). Combining remotely sensed and in situ data inmodelling is a promising approach to fill in gaps in biodiversity monitoring (GEO BON, 2015a, b; CBD Subsidiary Body onImplementation, 2016). In addition, the applicability of automated environmentalmonitoring data is increasing. For instance,methods for DNA sampling in freshwater and ecological network studies are being developed (e.g. Thomsen andWillerslev,2015) –however, in this paper, we limit our discussion to remote sensing. Even though remotely sensed data have beenproduced already dozens of years, its use (and usability) in biodiversity monitoring has been narrow and limited.
2. Aims of the study
Given the present economic limitations in many countries it is not very realistic to aim to launch new monitoringprogrammes based on large-scale field work. In Finland, it has been estimated that some 70% of all biodiversity monitoringwas done on a voluntary basis at the turn of theMillennium (Toivonen and Liukko, 2005), and this percentage is likely to havegrown since due to budget cuts. It seems unrealistic to get government funding for any new field-basedmonitoring schemesas evenmany of the presentmonitoring programmes are at risk of being discontinued. Therefore, themost promising sourcesof new monitoring data lie in remote sensing and other automated or semi-automated data collection methods.
P. Vihervaara et al. / Global Ecology and Conservation 10 (2017) 43–59 45
The aims of this paper can be presented as three consecutive steps. First, we look at the existing set of Finnish biodiversityindicators in the light of EBVs –how well do the indicators correspond to second-level EBV subclasses? Howmany and howstrong interlinkages can be found? In cross-tabulating national indicatorswith EBVswe also hope to point out possible needsto develop the EBV classification further.
Second, we search for gaps –which EBV subclasses are not covered by the existing national indicators? As stated above,the Finnish national biodiversity indicators were originally developed in a pragmatic fashion by collecting and using allavailable relevant data. EBVs provide the first robust framework for analysing the national indicator set from the point ofview thematic coverage.
Third, we look for opportunities to fill in some of the gaps in Finnish biodiversitymonitoring by using remote sensing andthe rapidly developing Earth observation techniques. What are the most feasible next steps in developing the monitoringscheme? At the same time, we also look at how the existing indicators could benefit from RS in terms of data collection andanalysis.
We use Finland as an example: a country with rather advanced biodiversity monitoring and indicator schemes, butalso with considerable challenges due to large geographical area coupled with low population density, uneven monitoringamongmain habitat types and dwindling monitoring resources. Many of these limitations and circumstances apply to othercountries and thereforewe hope that our analysismay provide ideas for developing nationalmonitoring schemes elsewhere.Although the development of EBVs has so far been mainly an international undertaking, we believe it is important to useand test the concept on national scale not only for the benefit national and finer scale biodiversity monitoring but also EBVsthemselves.
3. Material and methods
3.1. Current biodiversity indicators and Essential Biodiversity Variables
National biodiversity monitoring in Finland covers species of conservation interest (e.g. endangered species and habitatsdirective species), common species (e.g. forest birds, mire and farmland butterflies, marine benthic species and weeds onarable fields), entire taxa (e.g. bird and vascular plant atlas) as well as species of commercial interest (e.g. game and fish).On the level of ecosystems, existing monitoring focuses on the Baltic Sea (HELCOM) and on general land cover (e.g. CorineLand Cover, MS-NFI Finland). There is also a long tradition of repeated National Forest Inventories that yield data that canbe used for several biodiversity monitoring purposes (Reinikainen et al., 2000). Reporting obligations vary between nationalscale (e.g. ministries), EU (obligatory in the case of Habitats and Birds Directives and voluntary in the case of Mapping andAssessment of Ecosystems and their Services in relation to the EU Biodiversity Strategy for 2020 (Maes et al., 2012)) andinternational agreements and initiatives (obligatory to CDB, voluntary to Intergovernmental Platform on Biodiversity andEcosystem Services).
The current set of Finland’s biodiversity indicators can be found at the National Clearing-House platform www.biodiversity.fi. These indicators have been used for reporting to the CBD since the fourth national report (Auvinen et al.,2010) making Finland one of the most advanced countries in this respect (cf. Bubb et al., 2011) . The indicator set followsthe drivers, pressures, state, impact, responses (DPSIR) framework advocated by the European Environment Agency, amongothers (Delbaere, 2003).
Following the example given by Geijzendorffer et al. (2015), we used the 44 existing or planned national state ofbiodiversity indicators as a starting point of our analysis to see which EBV classes and subclasses they cover (Table 1).The ultimate target of the indicators is to monitor state of the nine primary habitat types found in Finland. Each indicatorwas assigned at least one primary EBV subclass (marked with red in Table 1) — meaning an aspect of biodiversity thatwas originally thought of as the central focus of that particular indicator. Indicators were also assigned 0–5 secondary EBVsubclasses (orange) and 0–5 such EBVs (yellow) for which the indicator/monitoring scheme could potentially be used as asupplementary or proxy indicator. Experts involved in the development and updating of biodiversity indicators evaluatedthe coherence of intersection points of state indicators and EBVs regarding their relevant field of expertise (forests, mires,Baltic Sea etc.)
As an example of the cross-tabulation of national indicators and EBVs, Population abundancewas deemed as the primaryEBV subclass that the indicator Farmland butterflies corresponds to. One of the secondary correspondences is Migrationbehaviour since several of the butterfly species monitored migrate to Finland annually. Finally, because of repeated countsduring summer, the farmland butterfly census could also be used for monitoring Phenology, although such analyses are notdone at the moment (i.e. potential indication). Other examples of the evaluation process are illustrated under Results.
3.2. Remote sensing data sources
Remote sensing (RS) techniques have developed rapidly after RS became available for public use and, eventually, whensatellite images became openly available (Fig. 1). The potential of EO for biodiversity monitoring has been acknowledged(e.g. He et al., 2015), and detailed reviews on the use of satellite images for monitoring biodiversity have been carried out,for instance, by Turner et al. (2003), Kuenzer et al. (2014), Secades et al. (2014) and O’Connor et al. (2015). Here we focus onthe data needs for biodiversity monitoring in Finland. Most of the national biodiversity indicators are not currently spatially

46 P. Vihervaara et al. / Global Ecology and Conservation 10 (2017) 43–59
Table 1Links between Finnish Biodiversity indicators and Essential Biodiversity Variables. Abbreviations: Forests (FO), Mires (MI), Baltic Sea (BS), Inland waters(IW), Farmlands (FA), Alpine habitats (AL), Urban habitats (UA), Shores (SH), Rocky and esker habitats (RE), and Climate change (CC). Indicators withnames in blue on the left column are under preparation. EBV sub-classes marked in red are additions suggested by the authors. An asterisk (*) refers to amonitoring scheme at risk of being discontinued. Question mark (?) relates to some uncertainty in the correspondence of the biodiversity indicator andEBV.
(Continued on next page)
explicit. Therefore the application of RS alone or combined with other GIS or statistical data sources may significantlyenhance them. At the same time, it is important to note that in situ data is often needed in addition to the RS data forcalibration and validation (O’Connor et al., 2015).

P. Vihervaara et al. / Global Ecology and Conservation 10 (2017) 43–59 47
Table 1 (continued)
Fig. 1. The timeline of the biodiversity related monitoring in Finland (above the axis) and development of remote sensing (below).
At the Finnish national scale, operational satellite products are available that can be used for selected EBVs. The Multi-Source National Forest Inventory (MS-NFI) dataset in Finland is a combination of high resolution satellite images (Landsatand SPOT) and NFI field plot measurements that are further refined with other digital maps (Tomppo et al., 2011). Multiplemeasures such as biomass and volume of different tree types and tree parts, site fertility, stand age, and canopy cover areestimated and the data cover the entire Finland at a spatial resolution of 16 m. The MS-NFI data is available for the years2006 (with less thematic detail), 2009, 2011 and 2013 (File service: http://kartta.luke.fi/index-en.html).
CORINE Land Cover (CLC) is another potential dataset for gaining an overall view of habitat structure. The Finnish HighResolution CLC (raster 20/25 m) has been produced in 2000, 2006 and 2012 based on classification of Landsat ETM andIRS/Spot images and with the aid of auxiliary digital maps at a spatial resolution of 25 m by 25 m (Törmä et al., 2004; Härmäet al., 2005). Land cover changemaps are available for 2006 and 2012with aminimummapping unit of 1 ha (0.5 ha for urbanareas) (Törmä et al., 2011). Both of these datasets are suitable for evaluating ecosystem structure EBVs.
Spatial and spectral resolutions define which RS products are useful for different EBV categories. O’Connor et al. (2015)show that at least 14 of the 22 candidate EBVs have a fully or partly remotely-sensed component. Coarse spatial resolutionsatellite imagery is useful for detecting general structures of ecosystems and often enables to span the perspective to history(Wulder et al., 2008). For example, Landsat images have been collected since the 1970s. However, it is important to solvehow compatible the data are from different sensors within same monitoring programme (Appendix).
The spatial resolution of VeryHigh Resolution (VHR) satellites is typically between 1 and 2m in the panchromatic channeland 2 and 4m inmultispectral channels. Small spatial resolution data, such as provided by IKONOS, QuickBird orWorldView,can be used for detection of smaller scale elements in the environment. VHR satellite data have been used for detection ofheterogeneity (Nagendra et al., 2013; Mairota et al., 2015), for example. Mairota et al. (2015) tested the usefulness of VHRin habitat analysis at different scales: landscape, patch and plot. VHR satellite imagery was found to be useful in estimatinghabitat quality and in predicting incidence of functional and taxonomic groups (with accuracy differences between groups).

48 P. Vihervaara et al. / Global Ecology and Conservation 10 (2017) 43–59
Hyperspectral images have been found useful for differentiating plant communities and even species (e.g. Sadro et al.,2007; He et al., 2011; Somers and Asner, 2012; Aneece and Epstein, 2015) due to higher number of narrow spectral bands(Jafari and Lewis, 2012). Today their use is still expensive and limited mainly to airborne vehicles, but their availability isexpected to increase in the future for example with the launch of the hyperspectral satellite Environmental Mapping andAnalysis Program (EnMap) planned in 2018.
Apart from passive satellites, active sensors such as radar and laser bring new dimensions to image interpretation. SAR(Synthetic Aperture Radar) satellites are used especially for sea and ice monitoring and can detect surface deformation andhelp in identifying the composition of forest patches (Schlund et al., 2014). The use of SAR images is expected to increasewithSentinel-1 data becoming accessible particularly in areas such as Finland where weather conditions affect the use of opticalimagery. The new instruments on board the Sentinel satellites –the MultiSpectral Instrument (MSI) on board Sentinel-2 andthe Ocean and Land Colour Instrument (OLCI) on board Sentinel-3 that were launched very recently by the European SpaceAgency –are expected to increase the overall performance of satellite based information because of free availability of data,increased spatial resolution, increased temporal resolution due to use of two satellites at the same time and large imagesize, better spectral resolution in case of Sentinel-2MSI due to red-edge and atmospheric bands and better usability becausesame processing algorithms can be used for images from two satellites and instruments have specific bands for atmosphericcorrection ((Malenovský et al., 2012), see also Box I).
Three-dimensional data can be acquired for landscape scale analyses by airborne laser scanning (ALS) which helps todetect species and species communities (e.g. Hill and Thomson, 2005). ALS data can be combined with field observationdata to provide more detailed characteristics for habitat modelling (Melin et al., 2013; Vihervaara et al., 2015). The NationalLand Survey of Finland (NLS) provides national ALS data for public use. Laser scanning began in 2008 and currently coversover 80% of the land area of Finland. The remaining land area is planned to be scanned by 2019 (NLS Finland, 2016).
In addition to satellite based earth observation of biodiversity, the use of piloted and especially remotely piloted aerialsystems (RPAS) have become increasingly popular amongst biologists for themapping of vegetation (e.g. Husson et al., 2014)and vertebrates (Linchant et al., 2015). The optical sensors in non-satellite based earth observation devices can often producehigher resolution pixels than current civilian satellites. While, at the moment, sensor payload and flight regulations restrictRPAS use (Anderson and Gaston, 2013), it is likely that with the steady miniaturization of sensory equipment RPAS deriveddata will be used much more frequently alongside satellite data in future biodiversity assessments.
Based on expert judgement and a literature review, we analysed how the multitude of RS instruments and methodscould be used to track biodiversity indicators and EBVs in Finland. Data sourceswere screened and their spatial and temporalresolution and spectral characteristics were taken into consideration (Table 2; Appendix).We also identified existing Finnishcases of environmental monitoring where RS could directly contribute to biodiversity indicators or EBVs.
4. Results
We cross-tabulated the Finnish Biodiversity state indicators with EBVs to find their linkages as well as gaps in currentbiodiversity monitoring schemes. The results are shown in Table 1. The EBVss along with their definitions were taken fromUNEP/CBD/SBSTTA/17/INF/7 (2013). However, we made some additions. Functional diversity was added under Communitycomposition in order to highlight one more important aspect of species communities. Decomposition, Carbon sequestrationand Water filtration and retention were added under Ecosystem function. For the latter additions, we refer to a recentlydeveloped framework for a national set of ecosystem service indicators (Mononen et al., 2016, www.biodiversity.fi/ecosystemservices) and include those functions that most centrally contribute to nationally important ecosystem services(see Discussion).
We demonstrate the analysis of correspondence points of the current biodiversity indicators and EBVs with twoexamples: Dead wood and Weeds on spring cereal fields. Dead wood corresponds primarily to the EBV subclass Habitatstructure. Secondarily, it is linked to Taxonomic diversity because 4000–5000 boreal species are dependent on the varioussuccessional stages of dead wood (Siitonen, 2001). Dead wood also influences Ecosystem composition by functional typebecause species living on deadwood form a particular functional group (decomposers).Deadwood can be also seen a possibleproxy for Population abundance (of certain lichens or beetles, for example), Physiological traits (related to decomposition),Functional diversity (one pivotal functional group of the boreal ecosystem), Decomposition, and Carbon sequestration (forestlitter constitutes a major carbon stock of the boreal forest; Akujärvi et al., 2016), but these relations are not straightforwardto quantify.
Weeds on spring cereal fields corresponds primarily to three EBVs: Population abundance and Taxonomic diversity of weedsspecies themselves as well as Species interactions. An interaction component has been built into the indicator by assessinghow many species of mainly insects and birds feed on the particular weed species in question (Hyvönen et al., 2003).The secondary EBV correspondences of Weeds on spring cereal fields were evaluated to be Functional Diversity and Habitatstructure/condition. In terms of the former, theweed indicator relates directly at least to two basic functional groups: primaryproducers and herbivores; and indirectly to carnivores. In term of the latter the composition and biomass of the weedcommunity constitutes an important habitat quality element for numerous species of agricultural habitats. Themost indirectpoints of correspondence of Weeds on spring cereal fields are to EBV two subclasses: Ecosystem extent and fragmentation(related to the occurrence of weed communities) and Secondary productivity (see above).
Table 1 reveals quite clearlywhere national indicators and EBVs do and do notmeet.Most of the primary correspondencesfall to two EBV subclasses: Population abundance and Habitat structure. This is understandable since the crude following

P. Vihervaara et al. / Global Ecology and Conservation 10 (2017) 43–59 49
Table 2Which category of EO data can biodiversity indicators benefit from? See further details in Appendix.
of population trends and habitat condition has been the primary goal of the indicator set. The second most commonEBVs marked with primary or secondary indication are also rather clear: Species distribution and Ecosystem extent andfragmentation. Taxonomic and functional diversity are also quite often a point of secondary or potential correspondence. EBVssubclasses listed under Species traits and Ecosystem function receive less ‘‘hits’’ and there is almost no connection betweenGenetic composition and current biodiversity indicators.
Remote sensing was evaluated to hold potential for providing new and more comprehensive data for several indicatorsand EBVs (Table 2). For instance the monitoring of Species traits, Community composition, Ecosystem structure and Ecosystemfunction could be improved with remotely sensed data. In Finland, RS data have already been utilized for monitoring theenvironment and these applications could also contribute to biodiversity indicators. Twopotential exampleswere identified:water quality monitoring where quality parameters have been identified from optical satellite images (Box I) and themapping of coastal vegetation where high resolution satellite images have been used for identifying the change of shorevegetation with Normalized Difference Vegetation Index (Box II). Additionally, ALS is increasingly being used for speciesdistribution modelling, falling under EBV subclass S pecies populations (Melin et al., 2013), and for predicting the occurrenceforest bird indicator species, falling under EBV subclasses Species populations, Community composition, Ecosystem structure(Vihervaara et al., 2015).
5. Discussion
5.1. Missing EBVs
We approach the current list of EBVs as an inventory of potential indicators open to modifications based on experiencesfrom real-life applications (cf. Pereira et al., 2013). From this standpoint, we suggest a few additions on the list ofEBV subclasses. First, we added Functional diversity under Community composition. This refers to functional aspects ofcommunities –separated fromhierarchical levels of species and ecosystems. Functional traits of species, and their cumulativeimpact on functioning of communities and ecosystems are receiving more and more attention especially when focusingecosystem services (processes) such as nutrient, carbon or water cycling as a part ecosystem assessments (Kremen, 2005).
Second,we added theword ‘‘condition’’ in the name of the subclassHabitat structure in order to refer to the quality aspectsof habitats that are not necessarily conceived as structure. Examples of such quality elements include water turbidity and

50 P. Vihervaara et al. / Global Ecology and Conservation 10 (2017) 43–59
Towards operative water quality monitoring by remote sensingThe main water quality parameters accessible by optical remote sensing include chlorophyll a (a proxy for phy-
toplankton biomass); water turbidity and the concentration of total suspended solids; water transparency; coloureddissolved organic matter; as well as algae blooms and their surface accumulations (e.g. Eleveld et al., 2014; Moses etal., 2012; Attila et al., 2013). The satellite based monitoring of water quality in coastal and open sea areas is already aroutine practice in many countries. In Finland, operative monitoring of the Baltic Sea has been performed since early2000’s (www.syke.fi/earthobservation). In the optically more complex inland waters, the estimation of water qualityfrom satellite data has so far been primarily a research topic (e.g. Brezonik et al., 2015; Li et al., 2015; Kallio et al.,2015), but operative services delivering this information from lakes are anticipated especially through the Copernicusprogramme and Sentinel satellites by the European Space Agency (Palmer et al., 2015). In the Table 3, the generalapplicability of MSI (Sentinel 2) and OLCI (Sentinel 3) instruments in deriving EBV related content from water areas isclassified into three classes (D = direct, S = Supportive/likely, NA = not applicable). The applicability is mainly based onthe spectral ability of satellite instruments to detect different water quality parameters (c.f. Malenovský et al., 2012;Palmer et al., 2015).
Box I.
nutrient content (see Box I). The monitoring of ecosystem condition is an important topic for the implementation of the EUBiodiversity strategy (EEA, 2015). Monitoring quality parameters may also be the only way to monitor the state of someaquatic ecosystems using remote sensing applications.
Third, we suggested three new subclasses under Ecosystem function: Decomposition, Carbon sequestration, and Waterfiltration and retention. These are all significant ecosystem processes that depend on biodiversity while, at the same time,they are noted as crucial regulating ecosystem services. Including them in the list of EBVs could improve our understandingof the interactions of abiotic and biotic processes as well as such hidden functional properties of biodiversity as soil biota ormeta-ecosystem effects on ecosystem functioning. The links between EBVs and ecosystem services are noted, for example,by UNEP/CBD/SBSTTA/17/INF/7 (2013). We recommend that these missing EBVs should be considered in the list of globalEBV candidates by GEO BON, increasing their number from 22 to 26.
5.2. Missing national biodiversity indicators
Contrasting national biodiversity indicators with EBVs revealed some gaps in the current indicator-based monitoringand evaluation scheme. Current indicators focus primarily on the EBV subclasses Population abundance or Habitat structure(under Species populations and Ecosystem structure, respectively). There are only few indicators which primary focus is onCommunity composition –at present, Wildlife richness, Forest vegetation and Weeds on spring cereal fields could be consideredas such. Even these deal with a rather limited variety of species (hunted mammals and birds or vascular plants, lichensand mosses). The community aspect is mostly missing from the Finnish monitoring system, and the same is also true forfunctional diversity.
Combining remote sensing of pre-selected areas with multi-taxa surveys could improve the scope of biodiversityassessment considerably. Examples of potential habitats for the monitoring of community composition include biodiversityhotspots such as traditional rural biotopes, old-growth forests and other woodland key habitats, as well as coastal meadows(Rassi et al., 2010; Timonen et al., 2010). Several mires types (including palsa mires) could also be monitored in this way.Having a pre-selected sample of areas tomonitorwould allow for the use of detailed RS products (cf. Table 2, Appendix) sincethe total monitoring area would remain reasonably small. This approach comes quite close to the biodiversity monitoringscheme of Switzerland (BDM Coordination Office, 2014) or the Wider Countryside Survey of Great Britain (Firbank et al.,2003).
5.3. Challenging EBVs
We felt some EBVs particularly difficult to understand and, therefore, had problems to locate them in the nationalmonitoring scheme. The most complicated was Ecosystem composition by functional type which description reads: ‘‘Thisis the basis of ecosystem classification. It can be informed by community composition intersected by species traits, or can bemeasured directly by assessing the degree of coverage by stratum for different plant life forms. The functional composition ofecosystems controls their delivery of ecosystem services, and thus their ‘health’ or ‘degradation’’’ (UNEP/CBD/SBSTTA/17/INF/7,2013). Perhaps our addition of Functional diversity comes quite close to this, although it focuses on functional diversityfrom the point of view of Community composition and not of Ecosystem structure. Measuring compositional properties ofecosystems is nevertheless missing from Finland’s current monitoring scheme.
The EBV class Genetic composition received only one potential hit from current biodiversity indicators (genetic differ-entiation of the seal population). The challenge of monitoring genetic variation has been noted from the beginning of thediscussion on EBVs (cf. Geijzendorffer et al., 2015), and our Finnish exercise does not shed any new light on the issue.

P. Vihervaara et al. / Global Ecology and Conservation 10 (2017) 43–59 51
Table 3Themain water quality parameters accessible with optical remote sensing in the EBV context and the general classification on the applicability (D= direct,S = Supportive/likely, NA = not applicable) of MSI (Sentinel 2) and OLCI (Sentinel 3) instruments (D = direct, S = Supportive/likely, NA = not applicable)based on the spectral properties of satellite instruments.
Other EBV sub-classes that had only one or a few linkages to current indicators were Population structure by age/size class,Body mass, Natal dispersal distance, Demographic traits, and Disturbance regime. While the eco-evolutionary importance ofthe first four is evident, we thought that their monitoring on a national scale is difficult as information on these phenomenais limited to certain species and individual research projects. Their connection to remote sensing was also seen as vague.The best examples of shifts in population structure and demographic traits come, perhaps, from fish studies where humanpressure in the form of over-fishing has caused the population age-structure to truncate and individuals to shrink in size andbreed younger (e.g. Shelton et al., 2015; Barot et al., 2004). The EBV subclass Disturbance regime under Ecosystem functionis interesting, but only of limited scope in present-day Finland since large-scale forest fires are rare today due to effectiveprevention, detection and extinguishing. Disturbance regimes would, nevertheless, be an interesting topic in the case ofsome special habitat types such as inland flooded forests and coastal habitats subjected to ice erosion.

52 P. Vihervaara et al. / Global Ecology and Conservation 10 (2017) 43–59
Identifying Common reed patches from satellite imagesThe common reed (Phragmites australis) is an erect perennial grass species growing both in saline and freshwater
coasts. It forms dense and somewhat monospecific patches and modifies the ground by its rhizomes. The reed patchesreach their full height and density in the end of the summer in the Northern Baltic Sea when they also have thegreatest impact on other wetland species in their vicinity (Güswell and Edwards, 1999). It is commonly suggested thatland use changes, disturbance and eutrophication are beneficial to common reed and can affect the plant communitycomposition (Tilman, 1982, 1987). In the Northern Baltic Sea the post-glacial land uplift creates suitable shallow areasfor reed belts. In many parts of the world common reed is seen as a nuisance species, but reactions towards reedvegetation in environmental management programs have varied (Chambers et al., 1999). Reed vegetation provideshabitats for many invertebrates and shelter for fish fry.
Common reed is easy to identify from the air by remote sensing methods. We used high-resolution satellite images(WorldView-2 and RapidEye) for mapping reed belts in a test area in SW Finland. Used images were taken in 2009(RE), 2011 (RE), 2012 (WV-2) and 2013 (WV-2). The vegetation was identified by calculating Normalized DifferenceVegetation Index (NDVI) by the following formula: NDVI = (infrared band –red band)/(infrared band + red band).After the calculation, the index layer was cropped by a shoreline polygon to cover only water areas and resampledto the same pixel size for easier comparison of the images. The resulting layers were assumed to show the extent ofcommon reed as it is the dominant coastal species in SW Finland but there might be some other wetland plant speciesamong it (Fig. 2).
Image resolution and the observation time affected the results. The resolution of the Landsat TM-7 satellite imagesis too coarse (30 m) but the VHR images such as RapidEye (5 m) and WorldView-2 (2 m) images gave more realisticresults on the reed belt extent. We also found that the early spring and summer images do not show the maximumreed belt extent, whereas, images from July to early September are more accurate due to the short growing season inhigh latitudes. The images taken in September underestimate the reed extent by 10%.
Box II.
Fig. 2. Common reed extent in Tammisaari archipelago, SW Finland in July 2013 based on NDVI index with a threshold value of 0.2.

P. Vihervaara et al. / Global Ecology and Conservation 10 (2017) 43–59 53
Similar to us, Australian experts, in their respective study related to the biodiversity of New SouthWales, to did not agreeupon the usefulness of EBVs Ecosystem composition by functional type, Disturbance regime or Body mass (Turak et al., in press).Some of the difficulties in applying EBVs to specific circumstances may due to the varying ecological conditions yet somemay also be due to inherent challenges in the suggested EBVs themselves. Therefore we find it important to test the EBVframework in several specific contexts in order to find out which EBVs can realistically advance biodiversity monitoring.
5.4. Remote sensing opportunities on different ecosystems
Our analysis of current national biodiversity indicators and their relation to EBV classes revealed some opportunitieswhere remote sensing applications could significantly improve data production for existing indicators or result in totallynew biodiversity parameter to be monitored in the future (Table 2). In particular, many structural and several functionalEBVs could be studied by using remote sensing (cf. Skidmore et al., 2015; Pettorelli et al., 2016; O’Connor et al., 2015).Vegetation phenology observations at high spatial and temporal resolution with the Sentinel-2 could also help the mappingof forests, mires and especially farmlands. Most Finland’s current biodiversity indicators are based on what Proença et al.(in press) call extensive schemes –for example, butterfly and bird monitoring programmes. With the help of RS results fromintensive schemes such as those included in the Finnish LTSER network (http://www.syke.fi/projects/lter) could better begeneralized to apply to larger areas and thus to serve biodiversity monitoring on national level.
Forests— Tree species can be related to EBVs such as Physiological traits and Functional diversity and could be tracked e.g. byhyperspectral satellite data (Jetz et al., 2016). Several remote sensing applications including ALS, aerial images and satellitedata, can be used to track Ecosystem structure. When analysing forest species indicators, such as forest birds, wildlife richnessand forest vegetation, remote sensing data could be used either as a proxy or, preferably, it could be combined with in situobservation data and modelled to produce habitat suitability and distribution maps (Goetz et al., 2010; Vihervaara et al.,2015). Opportunities of radar and hyperspectral data should also be tested to detect functional properties of forest vegetationand habitat structure and conditions the particular vegetation types need. An indicator for forest fragmentation has beenunder development for years. Remote sensing holds key to finalizing the indicator.
Mires — Because of the patch-like distribution of suitable habitat for mire species the fragmentation of pristine mires isa crucial indicator of the state of Finnish mires. The current fragmentation indicator needs revising and would benefitgreatly from remote sensing especially use of VHR imagery in order to detect the spatial variability of mire surface materialsand microwave SAR to estimate surface moisture. Functional aspects of mires are currently covered neither by nationalbiodiversity indicators nor by EBVs. Their role in landscape scale ecosystem processes is, however, very important in a boreallandscape.
Baltic Sea and inland waters — The structure, or merely condition, of aquatic habitats could be monitored by satelliteproducts for vast areas (see Boxes I and II). Chlorophyllα and algal blooms canbeused also asmeasures of primary productionand to indicate, possibly, population abundance of the algal species. Habitat structure and abundance of macroalgae –theextent of bladder wrack (Fucus vesiculosus) and eelgrass (Zostera marina) habitats, for instance –and vascular plants can bedetected from aerial images or VHR satellites, and in some cases from RPASs. Also, LIDAR is being tested for identifyingunderwater structures, including algal stands. The use of thermal sensors (TIR) is a particularly important source of watertemperature data which is a physical proxy for biodiversity distribution, for example. Functional trait hot spots of fish andother aquatic biota are poorly known, but perhaps a very important section of biodiversity to be monitored in the future(Stuart-Smith et al., 2013). However, these are the data which probably do not benefit from remote sensing data so far.
Farmlands— There is relatively good GIS data and statistics available due to the socio-economic importance of agriculture.However, we think that there are important aspects of farmland biodiversity that should be monitored more closely andwhich scope and accuracy could be improved by remotely sensed data. For instance, the location and extent of traditionalrural biotopes is already reasonablywell knownand stored inGIS, but data aremissing on the development of their condition.The over-growing and canopy-closure of these habitats could be tracked based on satellite data and aerial images, or evenmore accurately by ALS. The use of drones is marginal, because the analysis and data gathering needs quite a lot of resources.However, the quantification of changes in ecosystem condition might become more accurate than by mere eyesight. Themapping of field margins and buffer strips could possibly be done based on remote sensing, and to get these narrowhabitats under monitoring might provide link to catchment ecosystem processes, such as nutrient cycling and hydrology.For farmland birds and butterflies, a similar approach as in forest species can be used, whereas habitat preferences of insectsare dependent more on small-scale characteristics and the evident metapopulation behaviour.
Alpine habitats— There are currently only few state indicators of which lichen pastures and extent of palsa mires could beobviouslymonitored by various remote sensing techniques. Alpine areas are distant and their fieldmonitoring expensive andtime-consuming, which makes the development of remotely sensed monitoring an especially attractive option. Monitoringof alpine biodiversity is directly linked with the impacts of climate change (see below). Many species are directly dependenton snow cover and remotely sensed products on snow and change of snow from Sentinel-2 may be beneficial for theirmonitoring.

54 P. Vihervaara et al. / Global Ecology and Conservation 10 (2017) 43–59
Urban habitats — High resolution data from VHR satellites, ALS and aerial images have been used, but monitoring of thisecosystem type is difficult to tailor, because it is totally dependent on human influence and management. One example ofthe use of remote sensing in the monitoring of urban habitats is the soil sealing layer developed for Europe (EEA, 2011).However, the layer is not very accurate for Finland and would need fine tuning-based higher resolution images and nationaldata bases. Taxonomic diversity in urban habitats can be very high at landscape level due to small gardening, parks and greenareas, and small-scale conservation areas.
Shores, rocky habitats and eskers — Some micro habitats under these categories can be very dynamic and temporarybecause they are dependent on extreme weather events; for instance, storms can build shoreline walls from dead organicmaterial in the shallow coastlines of the Baltic sea which have high associated biodiversity while esker habitats are naturallycharacterized by forest fires that create openings inside the habitat. Tomonitor such characteristics automated and frequentscanning of VHR satellite data could be used. Shoreline vegetation (e.g. reedbeds of Phragmatis australis; see Box II) has asignificant influence on species diversity, but it may also have important functional properties.
Climate change — Several climate change indicators, such as those based on vegetation phenology, are directly observedfrom coarse resolution satellite imagery, such as MODIS, in Finland (Karlsen et al., 2006; Böttcher et al., 2014). Mothphenology is currently studied in Finland by using long-term monitoring datasets of Finnish moths (Leinonen et al., 2016)together with remote sensing variables such as snow melt and the start, maximum and end of the growing season. Therecent launch of Sentinel-2A/B opens a new opportunity for monitoring phenology (and plant productivity) at much higherspatial resolution (up to 10 m) in the future. Shifts in tree line in the alpine zone is a slower process, but can be monitoredquite well by using satellite data (e.g. Zhang et al., 2009). Radar has shown potential to detect mass migration of insectssuch as aphids, butterflies, and pollinators which have crucial role in ecosystem functioning and also contribute to manyecosystem services. These kinds of new indicators benefiting from modern remote sensing data illustrate the potential toupdate biodiversitymonitoring schemes on a national scale. Climate change indicators in Finland are still under constructionand functional dynamics seems to have a special importance in their building where remote sensing can help a lot.
Ecosystem functions — In addition to the EBVs about traits and functional diversity, the potential and interesting classesbased on our analysis, and where also remote sensing could play a role in monitoring, were the ecosystem functionsub-classes. The use of hyperspectral satellite data to trace functional traits were recently illustrated by Jetz et al. (2016), butin our case the challenge is how well this might work at high resolution scale. Kalacska et al. (2015) showed that chemicalcompounds of mire vegetation can be mapped by such techniques. Even though such variables could be monitored usingremote sensing it needs to be tested how it might work at larger geographical scales. A general question rising from ouranalysis is also how in situ species information and remote sensing data could be used together via modelling and buildingup for instance indices to be included in national biodiversity monitoring schemes (see also Vihervaara et al., 2015; GEOBON, 2015a,b)? Use of indices in biodiversity monitoring of inland waters was also recently reviewed by Heino (2015).In general, different indices developed in inland waters tell us different things about biodiversity, ecosystem state andecosystem services, suggesting that various indices should be used for biodiversity monitoring.
5.5. Applicability, feasibility, scalability and continuity
We think that the observations described in this paper fit with the rationale of robust biodiversity monitoring on anational scale and provide several pathways for improving the current monitoring scheme. However, it is important toremind that while the new remote sensing datasets and adjusted EBV classes can track local (and national) scale biodiversitychange more precisely, the data they provide has to be comparable to other countries’ assessments to build the big pictureof the state of biodiversity on regional and global scales. This kind of data scalability has been one of the starting points ofEBV definition (Pereira et al., 2013). The operationalization of RS data in biodiversitymonitoring depends also on the costs ofacquisition and interpretation of data, whichmight need a hierarchical approach so that rough parametrization of nationallyrelevant key EBVs are based on wall-to-wall HR imagery (free Landsat & Sentinel-2), and detailed analysis of hot spots onVHR, airborne hyperspectral and laser scanning.
It is also crucial to develop the monitoring in a synergetic collaboration with science-policy platforms: research and newmonitoring is dependent on resources invested in testing and building up these systems. National focal points and decisionmakers have to be aware of the new possibilities of applying remote sensing in biodiversity monitoring. Highlighting therelationship of biodiversity and ecosystem services is also needed to receive the support of the wider society for biodiversitymonitoring and to show the potential risks related to missing knowledge of ecosystem functioning, for instance, underclimate change. This makes it important to include EBVs in the ecosystem assessments prepared under IPBES and MAES, aswell as to link the biodiversity and ecosystem service monitoring demands to the Copernicus programme and planning ofpost 2020 biodiversity strategies.

P. Vihervaara et al. / Global Ecology and Conservation 10 (2017) 43–59 55
6. Conclusions
We have described how the current state of biodiversity indicators of Finland could be improved by applying the conceptof Essential Biodiversity Variables and using remote sensing. Our findings suggest that monitoring EBVs such as Ecosystemfunction, Ecosystem structure, Community composition and Species traits could benefit substantially from the use of remotelysensed data on national scale. While remote sensing data could bring many enhancements to the current situation, suchas increased geographical coverage and repeated measures over time, we want to emphasize the importance of long-termsurveys and the crucial role of field verification at the same time. Together these two could improve for examplemodel-basedevaluations of biodiversity change under various pressures.
Acknowledgements
This work got support from EU Horizon 2020 ESMERALDA Project, Grant agreement No. 642007. This work is also partof the MARS project funded under the 7th EU Framework Programme, Theme 6 (Environment including Climate Change),Contract No.: 603378 (http://www.mars-project.eu). We thank also Maj and Tor Nessling Foundation for the support.
Appendix
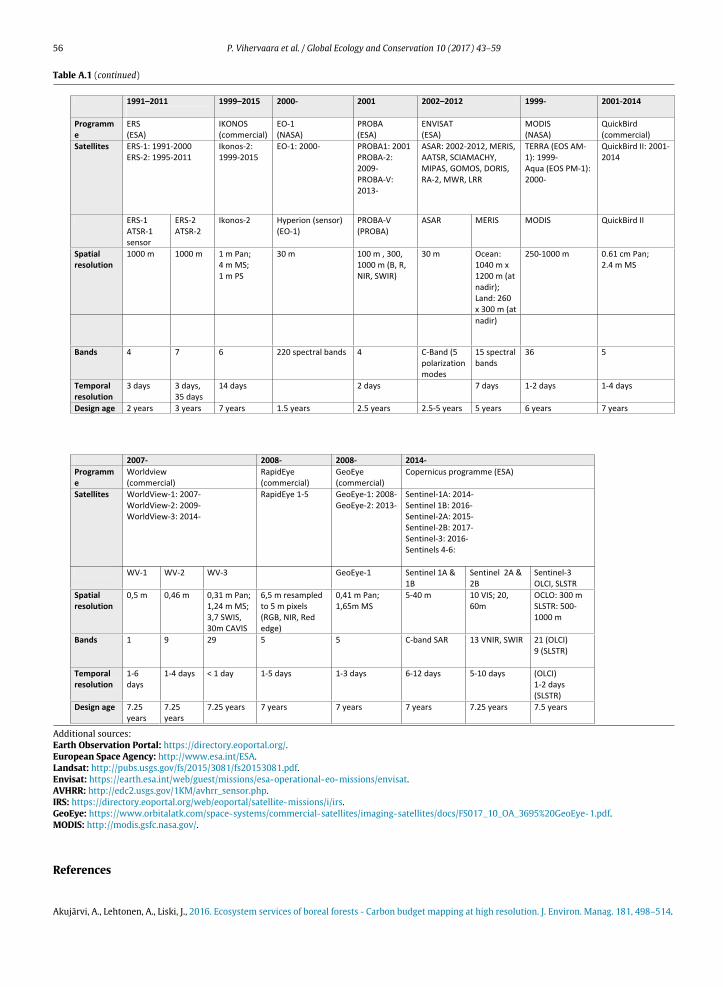
See Table A.1.
Table A.1Steps in remote sensing development. Note: This table represents a sample of important steps of remote sensing development and potential RS productsthat are considered useful for environmental monitoring.
(Continued on next page)
56 P. Vihervaara et al. / Global Ecology and Conservation 10 (2017) 43–59
Table A.1 (continued)
Additional sources:Earth Observation Portal: https://directory.eoportal.org/.European Space Agency: http://www.esa.int/ESA.Landsat: http://pubs.usgs.gov/fs/2015/3081/fs20153081.pdf.Envisat: https://earth.esa.int/web/guest/missions/esa-operational-eo-missions/envisat.AVHRR: http://edc2.usgs.gov/1KM/avhrr_sensor.php.IRS: https://directory.eoportal.org/web/eoportal/satellite-missions/i/irs.GeoEye: https://www.orbitalatk.com/space-systems/commercial-satellites/imaging-satellites/docs/FS017_10_OA_3695%20GeoEye-1.pdf.MODIS: http://modis.gsfc.nasa.gov/.
References
Akujärvi, A., Lehtonen, A., Liski, J., 2016. Ecosystem services of boreal forests - Carbon budget mapping at high resolution. J. Environ. Manag. 181, 498–514.

P. Vihervaara et al. / Global Ecology and Conservation 10 (2017) 43–59 57
Anderson, K., Gaston, K.J., 2013. Lightweight unmanned aerial vehicles will revolutionize spatial ecology. Front. Ecol. Environ. 11, 138–146. http://dx.doi.org/10.1890/120150.
Aneece, I., Epstein, H., 2015. Distinguishing early successional plant communities using ground-level hyperspectral data. Remote Sens. 7 (12), 16588–16606.Attila, J., Koponen, S., Kallio, K., Lindfors, A., Kaitala, S., Ylöstalo, P., 2013. MERIS Case II water processor comparison on coastal sites of the northern Baltic
Sea. Remote Sens. Environ. 128, 138–149.Auvinen, A.-P., Kemppainen, E., von Weissenberg, M. (Eds.), 2010. Fourth National Report on the Implementation of the Convention of Biological Diversity
in Finland. The Finnish Environment 2|2010. Ministry of the Environment, Helsinki, 192 p.Auvinen, A.-P., Toivonen, H., 2006. Biodiversity monitoring and indicators –A review of international projects and suggestions for the development of
biodiversity monitoring in Finland [In Finnish with English Summary]. Suomen ympäristö 33/2006. Finnish Environment Institute, Helsinki, 77 p.Balmford, A., Bennun, L., Brink, B.T., Cooper, D., Côte, I.M., Crane, P., Dobson, A., Dudley, N., Dutton, I., Green, R.E., Gregory, R.D., Harrison, J., Kennedy, E.T.,
Kremen, C., Leader-Williams, N., Lovejoy, T.E., Mace, G., May, R., Mayaux, P., Morling, P., Phillips, J., Redford, K., Ricketts, T.H., Rodríguez, J.P., Sanjayan,M., Schei, P.J., van Jaarsveld, A.S., Walther, B.A., 2005. The convention on biological diversity’s 2010 target. Science 307, 212–213.
Barot, S., Heino, M., O’brien, L., Dieckmann, U., 2004. Estimating reaction norms for age and size at maturation when age at first reproduction is unknown.Evol. Ecol. Res. 6, 659–678.
Bartsch, A., Kidd, R.A., Pathe, C., Scipal, K., Wagner, W., 2007. Satellite radar imagery for monitoring inland wetlands in boreal and sub-arctic environments.Aquat. Conserv. Mar. Freshw. Ecosyst. 17 (3), 305–317.
BDM Coordination Office, 2014. Swiss Biodiversity Monitoring BDM. Description of Methods and Indicators. Federal Office for the Environment, Bern.Environmental Studies no. 1410. 103 pp.
Biała, K., Condé, S., Delbaere, B., Jones-Walters, L., Torre-Marín, A., 2012. Streamlining European Biodiversity Indicators 2020: Building a Future on LessonsLearnt from the SEBI 2010 Process. EEA Technical report No 11/2012, Copenhagen, 50 p.
Böttcher, K., Aurela, M., Kervinen, M., Markkanen, T., Mattila, O.-P., Kolari, P., Metsämäki, S., Aalto, T., Arslan, A.N., Pulliainen, J., 2014. MODIS time-series-derived indicators for the beginning of the growing season in boreal coniferous forest — A comparison with CO2 flux measurements and phenologicalobservations in Finland. Remote Sens. Environ. 140, 625–638.
Brezonik, P.L., Olmanson, L.G., Finlay, J.C., Bauer, M.E., 2015. Factors affecting the measurement of CDOM by remote sensing of optically complex inlandwaters. Remote Sens. Environ. 157, 199–215.
Brummitt, N., Regan, E.C., Weatherdon, L.V., Martin, C.S., Geijzendorffer, I.R., Rocchini, D., Gavish, Y., Haase, P., Marsh, C.J., Schmeller, D.S., 2016. Taking stockof nature: Essential biodiversity variables explained. Biol.l Conserv. (in press). Available online: http://dx.doi.org/10.1016/j.biocon.2016.09.006.
Bubb, P., Chenery, A., Herkenrath, P., Kapos, V., Mapendembe, A., Stanwell-Smith, D., Walpole, M., 2011. National Indicators, Monitoring and Reporting forthe Strategy for Biodiversity 2011–2020. UNEP-WCMC, Cambridge, UK, 98 p..
CBD, 2014. Earth Observation for Biodiversity Monitoring: A review of current approaches and future opportunities for tracking progress towards the AichiBiodiversity Targets. Secretariat of the Convention on Biological Diversity, Canada. Technical Series No. 72, 183 pp.
CBD Subsidiary Body on Implementation, 2016. Remote Sensing of Essential Biodiversity Variables, information document submitted byGEOBON to the firstmeeting of the CBD Subsidiary Body on Implementation (SBI-01), 18 April 2016, UNEP/CBD/SBI/1/INF/49. https://www.cbd.int/doc/meetings/sbi/sbi-01/information/sbi-01-inf-49-en.pdf.
Chambers, R.M., Meyerson, L.A., Saltonstall, K., 1999. Expansion of Phragmites australis into tidal wetlands of North America. Aquatic Botany 64, 261–273.Colpaert, A., Kumpula, J., Nieminen, M., 2003. Reindeer pasture biomass assessment using satellite remote sensing. Arctic 147–158.Delbaere, B., 2003. An Inventory of Biodiversity Indicators in Europe, 2002. Technical Report No 92. European Environment Agency, Copenhagen, 42 p.EEA, 2011. Urban soil sealing in Europe. http://www.eea.europa.eu/articles/urban-soil-sealing-in-europe (Accessed 25 May 2016).EEA, 2015. European EcosystemAssessment—Concept, Data, and Implementation Contribution to Target 2 Action 5Mapping andAssessment of Ecosystems
and Their Services (MAES) of the EU Biodiversity Strategy to 2020. EEA Technical Report No 6/2015. European Environment Agency.Eleveld, M.A., van der Wal, D., van Kessel, T., 2014. Estuarine suspended particulate matter concentrations from sun-synchronous satellite remote sensing:
Tidal and meteorological effects and biases. Remote Sens. Environ. 143, 204–215.Firbank, L.G., Barra, C.J., Bunce, R.G.H., Furse, M.T., Haines-Young, R., Hornung, M., Howard, D.C., Sheail, J., Sier, A., Smart, S.M., 2003. Assessing stock and
change in land cover and biodiversity in GB: an introduction to the Countryside Survey 2000. J. Environ. Manag. 67, 207–218.GBO-4, 2014. Secretariat of the Convention on Biological Diversity. Global Biodiversity Outlook 4. Montréal, 155 pages.Geijzendorffer, I.R., Regan, E.C., Pereira, H., Protons, L., Brummitt, N., Gavish, Y., Haase, P., Martin, C.S., Mihoub, J.-B., Secades, C., Schmeller, D.S., Stoll, S.,
Wetzel, F., Walter, M., 2015. Bridging the gap between biodiversity data and policy reporting needs: An Essential Biodiversity Variables perspective. J.Appl. Ecol. http://dx.doi.org/10.1111/1365-2664.12417.
GEO BON, 2015a. Global Biodiversity Change Indicators: Model-Based Integration of Remote-Sensing & In Situ Observations that Enables Dynamic Updatesand Transparency at Low Cost. V1.1.
GEO BON. 2015b. GEO BON Strategy for Development of Essential Biodiversity Variables, version 1.0, October 2015. http://geobon.org/Downloads/Other_documents/Essential_Biodiversity_Variable_Strategy_v1.pdf.
Goetz, S.J., Steinberg, D., Betts, M.G., Holmes, R.T., Doran, P.J., Dubayah, R., Hofton, M., 2010. Lidar remote sensing variables predict breeding habitat of aNeotropical migrant bird. Ecology 91, 1569–1576. http://dx.doi.org/10.1890/09-1670.1.
Güswell, S., Edwards, P., 1999. Shading by Phragmites australis: a threat for spcies-rich fen meadows. Appl. Veg. Sci. 2, 61–70.Härmä, P., Teiniranta, R., Törmä, M., Repo, R., Järvenpää, E., Kallio, E., 2005. CLC2000 Finland: Final Report; Finnish Environment Institute, Geoinformatics
and Land Use Division: 9.02.2011, 2005.Hazeu, G., Milenov, P., Pedroli, B., Samoungi, V., Van Eupen, M., Vassilev, V., 2014. High Nature Value farmland identification from satellite imagery, a
comparison of two methodological approaches. Int. J. Appl. Earth Obs. Geoinform. 30, 98–112.He, K.S., Bradley, B.A., Cord, A.F., Rocchini, D., Tuanmu, M.N., Schmidtlein, S., Turner, W., Wegmann, M., Pettorelli, N., 2015. Will remote sensing shape the
next generation of species distribution models? Remote Sens. Ecol. Conserv. 1 (1), 4–18.He, K.S., Rocchini, D., Neteler, M., Nagendra, H., 2011. Benefits of hyperspectral remote sensing for tracking plant invasions. Divers. Distrib. 17, 381–392.Heino, J., 2015. Approaches, potential and pitfalls of applying bioindicators in freshwater ecosystems. In: Lindenmayer, D.B., Pierson, J., Barton, P. (Eds.),
Surrogates and Indicators of Biodiversity and Environmental Change. CSIRO Publishing and CRC Press, Melbourne and London, pp. 91–100.Hill, R.A., Thomson, A.G., 2005. Mapping woodland species composition and structure using airborne spectral and LiDAR data. Int. J. Remote Sens. 26 (17),
3763–3779.Hinterman, U., Weber, D., Zangger, A., Schmill, J., 2002. Monitoring de la biodiversité en Suisse, MBD, Rapport intermédiaire. Cahier de l’environnement no
342. l’Office fédéral de l’environnement, de forêts et du paysage OFEFP. Bern, 88 p.Hogda, K.A., Karlsen, S.R., Solheim, I., Tommervik, H., Ramfjord, H., 2002. The start dates of birch pollen seasons in Fennoscandia studied by NOAA AVHRR
NDVI data. In: Geoscience and Remote Sensing Symposium, IGARSS’02. 2002 IEEE International, vol. 6. IEEE, pp. 3299–3301.Hooper, D.U., Adair, E.C., Cardinale, B.J., Byrnes, J.E.K., Hungate, B.A., Matulich, K.L., Gonzalez, A., Duffy, J.E., Gamfeldt, L., O’Connor, M.I., 2012. A global
synthesis reveals biodiversity loss as a major driver of ecosystem change. Nature 486, 105–108.Husson, E., Hagner, O., Ecke, F., 2014. Unmanned aircraft systems help to map aquatic vegetation. Appl. Vegetation Sci. 17, 567–577. http://dx.doi.org/10.
1111/avsc.12072.

58 P. Vihervaara et al. / Global Ecology and Conservation 10 (2017) 43–59
Hyvönen, T., Ketoja, E., Salonen, J., Jalli, J., Tiainen, J., 2003. Weed species diversity and community composition in organic and conventional cropping ofspring cereals. Agricult. Ecosys. Environ. 97, 131–149.
Siitonen, J., 2001. Forest management, coarse woody debris and saproxylic organisms: Fennoscandian boreal forests as an example. Ecol. Bull. 49, 11–41.Jafari, R., Lewis, M.M., 2012. Arid land characterisation with EO-1 Hyperion hyperspectral data. Int. J. Appl. Earth Obs. Geoinform. 19, 298–307.Jetz, W., Cavender-Bares, J., Pavlick, R., Schimel, D., Davis, F.W., Asner, G.P., Guralnick, R., Kattge, J., Latimer, A.M., Moorcroft, P., Scaepman, M.E., Schildhauer,
M.P., Schneider, F.P., Schrodt, F., Stahl, U., Ustin, S.L., 2016. Monitoring plant functional diversity from space. Nature Plants 2, . http://dx.doi.org/10.1038/NPLANTS.2016.24. Article number: 16024.
Johansen, B., Karlsen, S.R., 2005. Monitoring vegetation changes on Finnmarksvidda, Northern Norway, using Landsat MSS and Landsat TM/ETM+satelliteimages. Phytocoenologia 35 (4), 969–984.
Kalacska, M., Lalonde, M., Moore, T.R., 2015. Estimation of foliar chlorophyll and nitrogen content in an ombrotrophic bog from hyperspectral data: Scalingfrom leaf to image. Remote Sens. Environ. (ISSN: 0034âĂŘ4257) 169 (2015), 270–279. http://dx.doi.org/10.1016/j.rse.2015.08.012.
Kallio, K., Koponen, S., Ylöstalo, P., Kervinen, M., Pyhälahti, T., Attila, J., 2015. Validation of MERIS spectral inversion processors using reflectance, IOP andwater quality measurements in boreal lakes. Remote Sens. Environ. 157, 147–157.
Karlsen, S.R., Elvebakk, A., Høgda, K.A., Johansen, B., 2006. Satellite-based mapping of the growing season and bioclimatic zones in Fennoscandia. GlobalEcol. Biogeogr. 15, 416–430.
Korpela, I., Ørka, H.O., Maltamo, M., Tokola, T., Hyyppä, J., 2010. Tree species classification using airborne LiDAR –effects of stand and tree parameters,downsizing of training set, intensity normalization, and sensor type. Silva Fennica 44 (2), 319–339.
Kremen, C., 2005. Managing ecosystem services: what do we need to know about their ecology? Ecol. Lett. 8, 468–479.Kuenzer, C., Ottinger, M., Wegmann, M., Guo, H.D., Wang, C.L., Zhang, J.Z., Dech, S., Wikelski, M., 2014. Earth observation satellite sensors for biodiversity
monitoring: potentials and bottlenecks. Int. J. Remote Sens. 35, 6599–6647.LaRue, M.A., Rotella, J.J., Garrott, R.A., Siniff, D.B., Ainley, D.G., Stauffer, G.E., Porter, C.C., Morin, P.J., 2011. Satellite imagery can be used to detect variation
in abundance of Weddell seals (Leptonychotes weddellii) in Erebus Bay, Antarctica. Polar Biology 34 (11), 1727–1737.Leinonen, R., Pöyry, J., Söderman, G., Tuominen-Roto, L., 2016. Suomen yöperhosseuranta (Nocturna) 1993–2012. Suomen ympäristöKeskuksen raportteja
15, 1–71.Li, Linhai, Li, Lin, Song, Kaishan, 2015. Remote sensing of freshwater cyanobacteria: An extended IOP Inversion Model of Inland Waters (IIMIW) for
partitioning absorption coefficient and estimating phycocyanin. Remote Sens. Environ. 157, 9–23.Linchant, J., Lisein, J., Semeki, J., Lejeune, P., Vermeulen, C., 2015. Are unmanned aircraft systems (UASs) the future of wildlife monitoring? A review of
accomplishments and challenges. Mammal Rev. 45, 239–252. http://dx.doi.org/10.1111/mam.12046.MA, 2005. Millennium Ecosystem Assessment. Ecosystems and Human Well-Being: Biodiversity Synthesis. World Resources Institute, Washington, D.C.
(USA).Maes, J., Egoh, B., Willemen, L., Liquete, C., Vihervaara, P., Schaegner, P., Grizetti, B., Drakou, E.G., La Notte, A., Zulian, G., Bouraoui, F., Paracchini, M., Braat,
L., Bidoglio, G., 2012. Mapping ecosystem services for policy support and decision making in the European Union. Ecosyst. Serv. 1, 31–39.Mairota, P., Cafarelli, B., Labadessa, R., Lovergine, F., Tarantino, C., Lucas, R.M., Nagendra, H., Didham, R.K., 2015. Very high resolution Earth observation
features for monitoring plant and animal community structure across multiple spatial scales in protected areas. Int. J. Appl. Earth Obs. Geoinform. 37,100–105.
Malenovský, Z., Rott, H., Cihlar, J., Schaepman, M.E., García-Santos, G., Fernandes, R., Berger, M., 2012. Sentinels for science: Potential of Sentinel-1,-2, and-3missions for scientific observations of ocean, cryosphere, and land. Remote Sens. Environ. 120, 91–101.
Melin, M., Packalén, P., Matala, J., Mehtätalo, L., Pusenius, J., 2013. Assessing and modeling moose (Alces alces) habitats with airborne laser scanning data.Int. J. Appl. Earth Obs. Geoinform. 23, 389–396.
Mononen, L., Ahokumpu, A.-L., Auvinen, A.-P., Rönkä, M., Tolvanen, H., Aarras, N., Kamppinen, M., Viirret, E., Kumpula, T., Vihervaara, P., 2016. Nationalecosystem service indicators: measures of social-ecological sustainability. Ecol. Indicat. 61, 27–37.
Moses, W.J., Gitelson, A.A., Berdnikov, S., Saprygin, V., Povazhnyi, V., 2012. Operational MERIS-based NIR-red algorithms for estimating chlorophyll-aconcentrations in coastal waters—The Azov Sea case study. Remote Sens. Environ. 121, 118–124.
Nagendra, H., Lucas, R., Honrado, J.P., Jongman, R.H., Tarantino, C., Adamo, M., Mairota, P., 2013. Remote sensing for conservation monitoring: Assessingprotected areas, habitat extent, habitat condition, species diversity, and threats. Ecol. Indicat. 33, 45–59.
NLS Finland, 2016. Laser scanning plan covers the year 2019. http://www.maanmittauslaitos.fi/en/professionals/topographic-data/remote-sensing/laser-scanning/laser-scanning-plan-covers-year-2019> (Accessed 18 May 2016).
O’Connor, B., Secades, C., Penner, J., Sonnenschein, R., Skidmore, A., Burgess, N.D., Hutton, J.M., 2015. Earth observation as a tool for tracking progress towardsthe Aichi Biodiversity Targets. Remote Sens. Ecol. Conserv. 1, 19–28. http://dx.doi.org/10.1002/rse2.4.
Palmer, Stephanie C.J., Kutser, Tiit, Hunter, PeterD., 2015. Remote sensing of inlandwaters: Challenges, progress and future directions. Remote Sens. Environ.157, 1–8.
Pereira, H.M., Ferrier, S., Walters, M., Geller, G.N., Jongman, R.H.G., Scholes, R.J., Bruford, M.W., Brummitt, N., Butchart, S.H.M., Cardoso, A.C., Coops, N.C.,Dulloo, E., Faith, D.P., Freyhof, J., Gregory, R.D., Heip, C., Hoöft, R., Hurtt, G., Jetz, W., Karp, D.S., McGeoch, M.A., Obura, D., Onoda, Y., Pettorelli, N., Reyers,B., Sayre, R., Scharlemann, J.P.W., Stuart, S.N., Turak, E., Walpole, M., Wegmann, M., 2013. Essential biodiversity variables. Science 339, 277–278.
Pettorelli, N., Wegmann, M., Skidmore, A., Mücher, S., Dawson, T.P., Fernandez, M., Lucas, R., Schaepman, M.E., Wang, T., O’Connor, B., Jongman, R.H.G.,Kempeneers, P., Sonnenschein, R., Leidner, A.K., Böhm, M., He, K.H., Nagendra, H., Dubois, G., Fatoyinbo, T., Hansen, M.C., Paganini, M., de Klerk, H.M.,Asner, G., Kerr, J., Estes, A.B., Schmeller, D.S., Heiden, U., Rocchini, D., Pereira, H.M., Turak, E., Fernandez, N., Lausch, A., Cho, M.A., Alcaraz-Segura,D., McGeoch, M.A., Turner, W., Mueller, A., St-Louis, V., Penner, J., Vihervaara, P., Belward, A., Reyers, B., Geller, G.N., 2016. Framing the conceptof satellite remote sensing essential biodiversity variables: challenges and future directions. Remote Sens. Ecol. Conserv. http://dx.doi.org/10.1002/rse2.15.
Prins, E., Petersen, B.S., Aunins, A., Priednieks, J., 2005. Using Landsat TM and field data to produce maps of predicted bird densities in Latvian farmland. Int.J. Remote Sens. 26, 1881–1891.
Proença, V., Martin, L.J., Pereira, H.M., Fernandez, M., McRae, L., Belnap, J., Böhm, M., Brummitt, N., García-Moreno, J., Gregory, R.D., Pradinho Honrado, J.,Jürgens, N., Opige, M., Schmeller, D.S., Tiago, P., van Swaay, C.A.M., 2016. Global biodiversity monitoring: From data sources to Essential BiodiversityVariables. Biol, Conserv. (in press). Available online: http://dx.doi.org/10.1016/j.biocon.2016.07.014.
Puttonen, E., Litkey, P., Hyyppä, J., 2010. Individual tree species classification by illuminated—shaded area separation. Remote Sens. 2, 19.Rassi, P., Hyvärinen, E., Juslén, A. andMannerkoski, I. (Eds.), 2010. The 2010 Red List of Finnish Species. Ympäristöministeriö and Suomen ympäristökeskus,
Helsinki, p. 685.Reinikainen, A., Mäkipää, R., Vanha-Majamaa, I., Hotanen, J.-P., 2000. Kasvit muuttuvassa metsäluonnossa Metsäntutkimuslaitos ja Kustannusosakeyhtiö
Tammi, Helsinki 2000 (In Finnish).Rockström, J., Steffen, W., Noone, K., Persson, A., Chapin, F.S., Lambin, E.F., Lenton, T.M., Scheffer, M., Folke, C., Schnellhuber, H.J., 2013. ym: A safe operating
space for humanity. Nature 461, 472–475.Sadro, M., Gastil-Buhl, J., Melack, 2007. Characterising patterns of plant distribution in a southern California salt marsh using remotely sensed topographic
and hyperspectral data and local tidal fluctuations. Remote Sens. Environ. 110 (2), 226–239.

P. Vihervaara et al. / Global Ecology and Conservation 10 (2017) 43–59 59
Schlund, M., von Poncet, F., Hoekman, D.H., Kuntz, S., Schmullius, C., 2014. Importance of bistatic SAR features from TanDEM-X for forest mapping andmonitoring. Remote Sens. Environ. 151, 16–26.
Secades, C., O’connor, B., Brown, C., Walpole, M., 2014. Earth Observation for Biodiversity Monitoring: A Review of Current Approaches and FutureOpportunities for Tracking Progress Towards the Aichi Biodiversity Targets (Secretariat of the Convention on Biological Diversity, 2014).
Shelton, A.O., Hutchings, J., Waples, R.S., Keith, D.M., Akcakaya, H.R., Dulvy, N.K., 2015. Maternal age effects on Atlantic cod recruitment and implicationsfor future population trajectories. ICES J. Mar. Sci. 72 (6), 1769–1778.
Skidmore, A., Pettorelli, N.C., Coops, G.N., Geller, M., Hansen, R. Lucas, et al., 2015. Agree on biodiversity metrics to track from space. Nature 523, 403–405.Somers, B., Asner, G.P., 2012. Hyperspectral time series analysis of native and invasive species in Hawaiian rainforests. Remote Sens. 4 (9), 2510–2529.Stuart-Smith, R.D., Bates, A.E., Lefcheck, J.S., Duffy, J.E., Baker, S.C., Thomson, R.J., Stuart-Smith, J.F., Hill, N.A., Kininmonth, S.J., Airoldi, L., Becerro, M.A.,
Campbell, S.J., Dawson, T.P., Navarrete, S.A., Soler, G.A., Strain, E.M.A., Willis, T.J., Edgar, G.J., 2013. Integrating abundance and functional traits revealsnew global hotspots of fish diversity. Nature 501 (7468), 539. http://dx.doi.org/10.1038/nature12529.
Thomsen, P.F., Willerslev, E., 2015. Environmental DNA –An emerging tool in conservation for monitoring past and present biodiversity. Biol. Cons. 183,4–18.
Tilman, D., 1982. Resource Competition and Community Structure. Princeton University Press, Princeton, NJ.Tilman, D., 1987. On the meaning of competition and the mechanisms of competitive superiority. Funct. Ecol. 1, 304–315.Timonen, J., Siitonen, J., Gustafsson, L., Kotiaho, J.S., Stokland, J.G., Sverdrup-Thygeson, A., Mönkkönen, M., 2010.Woodland key habitats in northern Europe:
concepts, inventory and protection. Scand. J. Forest Res. 25, 309–324.Toivonen, H., Liukko, U.-M., 2005. Proposal for a nationwide biodiversity monitoring system. Summary of the memoranda of the Expert Group for
Biodiversity Research, Monitoring and Data Systems [In Finnish with English summary]. Suomen Ympäristö 759, 1–38.Tomppo, E., Heikkinen, J., Henttonen, H.M., Ihalainen, A., Katila, M., Mäkelä, H., Tuomainen, T., Vainikainen, N., 2011. Designing and Conducting a Forest
Inventory-Case: 9th National Forest Inventory of Finland. Springer Science and Business Media.Törmä, M., Härmä, P., Hatunen, S., Teiniranta, R., Kallio, M., Järvenpää, E., 2011. Change detection for Finnish CORINE land cover classification. In: Earth
Resources and Environmental Remote Sensing/GIS Applications II. In: Michel, Ulrich, Civco, Daniel L. (Eds.), Proceedings of SPIE, vol. 8181, SPIE,Bellingham, WA, p. 81810Q.
Törmä, M., Härmä, P., Teiniranta, R., Repo, R., Järvenpää, E., Kallio, E., 2004. The Production of Finnish Corine Land Cover 2000 Classification. XXth ISPRSCongress. International Society for Photogrammetry and Remote Sensing.
Turak, E., Brazill-Boast, J., Cooney, T., Drielsma, M., Delacruz, J., Dunkerley, G., Fernandez, M., Ferrier, S., Gill, M., Jones, H., Koen, T., Leys, T., McGeoch,M., Mihoub, J.-P., Scanes, P., Schmeller, D., Williams, K., 2016. Using the essential biodiversity variables framework to measure biodiversity change atnational scale. Biol. Conserv. (in press). Available online: http://dx.doi.org/10.1016/j.biocon.2016.08.019.
Turner, W., Spector, S., Gardiner, N., Fladeland, M., Sterling, E., Steininger, M., 2003. Remote sensing for biodiversity science and conservation. Trends Ecol.Evol. 18 (6), 306–314.
UNEP/CBD/SBSTTA/17/INF/7, Essential Biodiversity Variables. Note by the Executive Secretary, 2 October 2013.Vihervaara, P., D’Amato, D., Forsius, M., Angelstam, P., Baessler, C., Balvanera, P., Boldgiv, B., Bourgeon, P., Dick, J., Kanka, R., Klotz, S., Maass, M., Melecis,
V., Petřik, P., Shibata, H., Tang, J., Thompson, J., Zacharias, S., 2013. Using long-term ecosystem service and biodiversity data to study the impacts andadaptation options in response to climate change: insights from the global ILTER sites network. Curr. Opin. Environ. Sustain. 5, 53–66.
Vihervaara, P., Kumpula, T., Ruokolainen, A., Tanskanen, A., Burkhard, B., 2012. The use of detailed biotope data for linking biodiversity with ecosystemservices in Finland. Int. J. Biodivers. Sci., Ecosyst. Serv. Manage. 8 (1–2), 169–185.
Vihervaara, P., Mononen, L., Auvinen, A.-P., Virkkala, R., Lü, Y., Pippuri, I., Packalen, P., Valbuena, R., Valkama, J., 2015. How to integrate remotely sensed dataand biodiversity for ecosystem assessments at landscape scale. Landscape Ecol. 30 (3), 501–516.
Wondergem, J., Klein, P., 2010. The Netherlands Environmental Data Compendium (EDC): Key factors for Communication of Environmental Information.EnviroInfo 2010 (Cologne/Bonn) Integration of Environmental Information in Europe: 513–517.
Wulder, M.A., White, J.C., Goward, S.N., Masek, J.G., Irons, J.R., Herold, M., Cohen, W.B., Loveland, T.R., Woodcock, C.E., 2008. Landsat continuity: Issues andopportunities for land cover monitoring. Remote Sens. Environ. 112 (3), 955–969.
Zhang, Y.J., Xu, M., Adams, J., Wang, X.C., 2009. Can Landsat imagery detect tree line dynamics? Int. J. Remote Sens. 30 (5), 1327–1340.